climate impacts in europe -...
TRANSCRIPT

Climate impacts in Europe
Final report of the JRC
PESETA III project
Ciscar J.C., Feyen L., Ibarreta D., Soria A. (coordination)
Full list of authors in Acknowledgments
2018
EUR 29427 EN

This publication is a Science for Policy report by the Joint Research Centre (JRC), the European Commission’s science and knowledge service. It aims to provide evidence-based scientific support to the European policymaking process. The scientific output expressed does not imply a policy position of the European Commission. Neither the European Commission nor any person acting on behalf of the Commission is responsible for the use that might be made of this publication. Contact information
Address: European Commission, Joint Research Centre, Edificio Expo. c/ Inca Garcilaso, 3. E-41092 Seville, Spain Email: [email protected] EU Science Hub
https://ec.europa.eu/jrc JRC112769 EUR 29427 EN
PDF ISBN 978-92-79-97218-8 ISSN 1831-9424 doi:10.2760/93257
Luxembourg: Publications Office of the European Union, 2018 © European Union, 2018 The reuse policy of the European Commission is implemented by Commission Decision 2011/833/EU of 12 December 2011 on the reuse of Commission documents (OJ L 330, 14.12.2011, p. 39). Reuse is authorised, provided the source of the document is acknowledged and its original meaning or message is not distorted. The European Commission shall not be liable for any consequence stemming from the reuse. For any use or reproduction of photos or other material that is not owned by the EU, permission must be sought directly from the copyright holders. All content © European Union, 2018, unless specified otherwise How to cite this report: J.C. Ciscar, D. Ibarreta, A. Soria, A. Dosio, A.Toreti, A. Ceglar, D. Fumagalli, F. Dentener, R. Lecerf, A. Zucchini, L. Panarello, S. Niemeyer, I. Pérez-Domínguez, T. Fellmann, A. Kitous, J. Després, A. Christodoulou, H. Demirel, L. Alfieri, F. Dottori, M.I. Vousdoukas, L. Mentaschi, E. Voukouvalas, C. Cammalleri, P. Barbosa, F. Micale, J.V. Vogt, J.I. Barredo, G. Caudullo, A. Mauri, D. de Rigo, G. Libertà, T. Houston Durrant, T. Artés Vivancos, J. San-Miguel-Ayanz, S.N. Gosling, J. Zaherpour, A. De Roo, B. Bisselink, J. Bernhard, L., Bianchi, M. Rozsai, W. Szewczyk, I. Mongelli and L. Feyen, Climate impacts in Europe: Final report
of the JRC PESETA III project, EUR 29427 EN, Publications Office of the European Union, Luxembourg, 2018, ISBN 978-92-79-97218-8, doi:10.2760/93257, JRC112769.

i
Contents
Abstract ............................................................................................................... 1
Acknowledgements ................................................................................................ 2
Executive Summary ............................................................................................... 4
1 Introduction .................................................................................................... 13
2 Methodology ................................................................................................... 15
2.1 Harmonised climate change and socioeconomic scenarios ............................... 15
2.1.1 Climate change scenarios ................................................................... 15
2.1.2 Socio-economic scenarios ................................................................... 19
2.2 Overview of impact models ......................................................................... 20
2.3 Economic model ........................................................................................ 22
2.4 Overview of sectoral impact analyses ........................................................... 24
3 Impact results ................................................................................................. 25
3.1 Coastal floods ........................................................................................... 25
3.2 River floods ............................................................................................... 27
3.3 Droughts .................................................................................................. 30
3.4 Agriculture ................................................................................................ 32
3.5 Energy ..................................................................................................... 37
3.6 Transport.................................................................................................. 39
3.7 Water resources ........................................................................................ 43
3.8 Habitat loss ............................................................................................... 48
3.9 Forest fires ............................................................................................... 52
3.10 Labour productivity .............................................................................. 55
3.11 Mortality due to heatwaves ................................................................... 57
4 Economic results ............................................................................................. 59
5 Limitations ...................................................................................................... 65
6 Further research .............................................................................................. 67
References ......................................................................................................... 72
List of abbreviations and definitions ....................................................................... 78
List of figures ...................................................................................................... 80
List of tables ....................................................................................................... 82
Annexes ............................................................................................................. 83

1
Abstract
The study assesses how climate change could affect Europe in eleven impact areas.
Under a high warming scenario, several climate impacts show a clear geographical north-
south divide. Most of the welfare losses, assessed for six impact areas, would be greatly
reduced under a 2ᵒC scenario.

2
Acknowledgements
The JRC PESETA III project has benefited from previous related studies, like projects
funded by DG Research (e.g. FP7 HELIX) and the AgMIP agriculture impact modelling
exercise. The authors wish to thank C. Piani and J.O. Haerted who kindly provided the
bias correction code (to correct the climate data), which was originally developed under
the European Union FP6 integrated Project WATCH (contract 036946).
The EURO-CORDEX data used in this work were obtained from the Earth System Grid
Federation server (https://esgf-data.dkrz.de/projects/ esgf-dkrz/). We are grateful to all
the modeling groups that performed the simulations and made their data available,
namely, Laboratoire des Sciences du Climat et de l’Environnement (IPSL), Institut
National de l’Environnement Industriel et des Risques, Verneuil en Halatte (INERIS), the
CLM community (CLMcom), the Danish Meteorological Institute (DMI), the Royal
Netherlands Meteorological Institute (KNMI), and the Rossby Centre, Swedish
Meteorological and Hydrological Institute (SMHI).
The project also builds on the advice and comments from the members of the JRC
PESETA III project Advisory Board: Clare Goodess (University of East Anglia), John Mac
Callaway (UNEP - Risø Centre), Ole B. Christensen (Danish Meteorological Institute),
Robert E. Kopp (Rutgers University), Jim McFarland (USA Environmental Protection
Agency) and Michael Hanemann (Arizona State University).
This report has been subject to additional peer review and the authors would like to
thank the comments and suggestions received from Simon Gosling, James Rising, the
colleagues at the Adaptation Unit of DG CLIMA and JRC colleagues, to whom the authors
are grateful.

3
Authors
Coordination J.C. Ciscar, L. Feyen, D. Ibarreta, A. Soria
Climate modelling A. Dosio
Crop modelling A. Toreti, A. Ceglar, D. Fumagalli, F. Dentener, R. Lecerf,
A. Zucchini, L. Panarello, S. Niemeyer
Agriculture economics I. Pérez Domínguez, T. Fellmann
Energy A. Kitous(a), J. Després
Transport A. Christodoulou, H. Demirel(b)
River floods L. Alfieri, F. Dottori, L. Feyen
Coastal floods M.I. Vousdoukas, L. Mentaschi, E. Voukouvalas, L. Feyen
Droughts C. Cammalleri, P. Barbosa, F. Micale, J.V. Vogt
Mediterranean habitat loss J.I. Barredo, G. Caudullo, A. Mauri
Forest fires D. de Rigo, G. Libertà, T. Houston Durrant, T. Artés
Vivancos, J. San-Miguel-Ayanz
Labour productivity S.N. Gosling(c), J. Zaherpour(c), D. Ibarreta
Water A. De Roo, B. Bisselink, J. Bernhard, L. Mentaschi
Visualisation A. Bianchi, M. Rozsai
Economic integration W. Szewczyk, J.C. Ciscar, I. Mongelli, A. Soria
All authors from the European Commission's Joint Research Centre, except:
(a) European Commission, Directorate-General for Energy
(b) Istanbul Technical University (Istanbul, Turkey)
(c) The University of Nottingham (Nottingham, United Kingdom)

4
Executive Summary
Policy context and purpose
Climate change adaptation and climate-related disaster risk reduction have been
recognized as a priority worldwide. Ambitious initiatives have been taken at global level,
such as the 2015 Paris Agreement on Climate Change and the 2015 Sendai Framework
for Disaster Risk Reduction, as well as several European policy actions like the EU
strategy on Adaptation to Climate Change.
The series of PESETA projects of the Joint Research Centre (JRC) have intended to
provide a better quantification of the possible consequences of future climate change for
Europe (EU28). The aim of the JRC PESETA III project is to further improve that
knowledge, narrowing uncertainty gaps (action 4 of the European adaptation strategy,
bridge the knowledge gap) with the overall scope of contributing to DG CLIMA’s mid-
century strategy and underpinning the forthcoming review of the EU Adaptation Strategy.
Scope
The assessment is based on a consistent methodological framework that integrates
climate and socio-economic projections, impact models and economic analysis. The
following climate impact categories have been considered in the study: coastal floods,
river floods, droughts, agriculture, energy, transport, water resources, habitat loss, forest
fires, labour productivity, and mortality due to heat.
In general, in what follows the climate impact results have not taken into account
planned or public adaptation, unless otherwise stated.
Future scenarios
The project implements the new family of climate projections (EURO-CORDEX) consistent
with the high-end emission scenario (Representative Concentration Pathway RCP8.5).
Under this scenario, projections of Global Warming Level (GWL, defined as the
temperature global mean temperature increase compared to the pre-industrial period)
exceed 3°C warming around 2070 and continue rising thereafter.
From the transient climate projections (from 1981 up to 2100), JRC PESETA III focuses
on two periods in particular:
• The end of the century (2071-2100), with GWL >3°C. This is further referred to
as the high warming scenario.
• The period for which GWL = 2°C (approximately 2025-2055). This is further
referred to as the 2°C warming scenario.

5
Results for the end of the century show how future climate without mitigation would
impact on Europe, whereas the results for the 2°C period portray impacts when global
average temperature rises by 2°C relative to pre-industrial temperatures, in accordance
with the limit set by the Paris Agreement. Impacts at the Paris target of 2°C under the
continued warming pathway considered in JRC PESETA III may differ from those under a
stabilization pathway, because of the sensitivity of climate to radiative forcing of
greenhouse gases and aerosols. For both periods the impacts are compared with
nowadays (1981-2010).
The evaluation of impacts is made within a specific setting of the state of the economy.
That can be static (the economy as of today) or dynamic (the economy of the
future).Most of the analyses follow the static approach. Some impact categories also take
into account dynamic projections of socio-economic conditions based on the ECFIN
Ageing Report and the Shared Socio-economic Pathways (SSPs) consistent with RCP8.5,
namely SSP3 and SSP5.
Main findings
Climate change due to human-induced global warming will induce a broad range of
environmental and socio-economic impacts across Europe, without taking into account
planned or public adaptation. Rising temperatures will result in reductions in labour
productivity. Shifts in flower/plant blooming, growing season and changes in soil water
content will affect agriculture productivity and habitat suitability. Net impacts on crop
yield remain uncertain for some crops due to the uncertainties in the CO2 fertilization on
crop growth and the adaptation options that might be adopted. Energy demand for
heating will decrease, yet energy requirements for cooling spaces will rise rapidly with
warming. Reduced water availability due to changes in precipitation may disrupt energy
provision that depends on cooling with surface water and lower the potential of
hydropower production. Southern parts of Europe may face increasing water shortage,
whereas water resources will generally increase in Northern Europe.
Many impacts on society and the environment will be connected to changes in climate
extremes due to their disproportionate rise compared to the corresponding change in
climatological averages. River flood risk is projected to increase in many regions of
Europe. Coastal floods, especially in the second half of this century with accelerating sea
level rise, will show a dramatic rise along most European coastlines. Transport and other
critical infrastructures in river flood plains and close to the sea will be increasingly at risk
of damage and disruption by inundation. More frequent and severe drying of soils and
vegetation, mainly in Southern Europe, will increase the risk of wildfires. There will be a
strong rise in human mortality from heat, not taking adaptation into account.

6
In several impact areas there is a clear geographical north-south divide: countries in the
south will be impacted more by global warming compared with the northern parts of
Europe. This is clearly the case for the effects on heat-related human mortality, water
resources, habitat loss, energy demand for cooling and forest fires, where the
Mediterranean area appears to be the most vulnerable to climate change.
From the economic perspective, the potential impact on welfare (expressed as
consumption) due to six impact categories (residential energy demand, coastal floods,
inland floods, labour productivity, agriculture and heat-related mortality) has been
assessed. The EU overall welfare loss under the high warming scenario is estimated to be
around 1.9% of GDP (€240 bn) per year at the end of the century, under a high
emissions scenario (RCP 8.5), but it should be noted that the list of considered impacts is
incomplete because key climate impacts cannot be quantified. The losses associated with
heat-related mortality represent a very significant share of the (unmitigated) high
warming scenario damages, the remaining being, in order of importance, coastal
flooding, labour productivity, agriculture and river flooding. There would be a small
welfare gain thanks to lower energy consumption.
Most of the assessed welfare losses would be greatly reduced under the 2oC scenario.
The project estimates the additional welfare impact in the EU associated to changes in
trade flows due to climate impacts occurring in third countries associated to four impact
areas (residential energy demand, river flooding, labour productivity and agriculture).
The transboundary effect is estimated to increase the EU welfare loss by 20%.
Findings for different impact categories
1. Coastal floods (2°C warming and high warming scenarios; static and dynamic)
Under present climate conditions, the estimated Expected Annual Damage (EAD) from
coastal flooding for Europe is €1.25 billion, while the Expected Annual number of People
Affected (EAPA) equals 102,000 people. Under the static economic analysis, EAD is
projected to rise to €6 billion at 2˚C warming and EAPA will rise to 436,000 people.
Accelerating Sea Level Rise towards the end of the century results in an exponential
increase in coastal flood impacts, with by the year 2100 EAD (EAPA) amounting to €60
billion (2.1 million people) under RCP8.5. The projected impacts are substantially higher
when taking into account socio-economic development. EAD for Europe is projected to
reach €93 and €961 billion under RCP8.5-SSP3 and RCP8.5-SSP5, respectively, by the
end of the century. Around the same period, 1.52 to 3.65 million people could be
annually flooded due to extreme sea levels, depending on the population growth
projected by SSP3 and SSP5. Impacts will put increasing pressure on coastal

7
communities, with the number of people forced to relocate reaching 28,120 and 28,340
under RCP8.5-SSP3 and RCP8.5-SSP5, respectively, towards the end of the century.
2. River floods (2°C warming and high warming scenarios; static and dynamic)
Under present climate conditions, in Europe an average of about 216,000 people are
exposed each year to river flooding and expected annual flood damage amounts to €5.3
billion. In most regions of Europe an increase of flood risk is projected due to global
warming. Under a 2°C global warming scenario, considering current socio-economic
conditions and no adaptation measures in place, flood impacts could more than double,
with around 525,000 people annually exposed to floods and €12.5 billion of expected
annual losses. Longer term climate conditions (2071-2100) under a RCP8.5 scenario
imposed on present society (static analysis), on the other hand, could result in around
717,000 people annually exposed to floods while direct flood damages could see a more
than three-fold increase with respect to current conditions, reaching €17.5 billion of
average annual losses.
Projections of flood impacts show an even more pronounced increase when socio-
economic scenarios are considered in the projections compared to damage based on
present socio-economic conditions. Depending on the socio-economic scenario, average
estimates of population annually affected by floods could range between 530,000 and
975,000 by the end of this century. A larger increase is foreseen in expected annual flood
damage, which is projected to rise to €29-112 billion in 2071-2100. This shows that flood
risk is amplified by economic growth. However, the projected socio-economic conditions
imply a wealthier society hence also an increase in the capacity to absorb the increase in
flood risk and take action to prevent or reduce them. Results indicate that the future
increase in expected damage and population affected by river floods can be reduced
through different configurations of adaptation measures. As such, adaptation efforts
should take into consideration both measures targeted at reducing the impacts of floods
(such as relocation and vulnerability reduction) and measures for reducing flood
magnitudes (e.g. by floodplain enlargement and restoration, increasing water retention,
and urban greening). Hard structural measures may be indispensable in some cases. Yet,
adaptation only based on raising structural flood protection has the effect of reducing the
frequency of floods below the protection standard but exposing societies to less-frequent
but catastrophic floods and potentially long recovery processes. Therefore enhancing
community flood resilience is also important.
3. Droughts (2°C warming scenario)
Over the majority of the European continent the simulations indicate limited statistically
significant variations of soil water content until the middle of the century. Under 2°C
warming, Mediterranean regions will experience the strongest reduction in soil moisture,

8
which may occur equally over the full year. On the other hand, North and East Europe
show a future increase in soil water availability, which is mostly larger during the wet
season. The projected patterns of change in soil drought hazard are a continuation of the
drying and wetting trends observed across Europe over the past 50 years: more droughts
in the west of the Mediterranean region and fewer droughts in Central and Eastern
Europe. Hence, future variations across the continent are driving a further polarization of
both soil moisture availability and soil drought severity. Areas of particular concern are
Andalucía, Extremadura and Algarve, because the soil moisture variations will be
characterized by both a reduction of the annual average and an increase of annual
amplitude, depicting deeper annual minimum values in the soil moisture curves. In the
present climate, these areas are already characterized by dry or semi-arid conditions and
are prone to drought events.
4. Agriculture (2°C warming scenario)
In rain-fed agriculture a favourable pattern emerges in Eastern Europe for all crops
modelled. There are some large yield increases relative to present conditions, such as
over 30% for wheat and maize. On the other hand, an adverse pattern emerges in
Southern Europe. Here, yields decline especially for summer crops. Maize, sugar beet and
sunflower yields decline in Italy and Portugal. The lower crop yields are caused by both
increased temperatures and reduced precipitation, affecting soil water availability to
plants.
In irrigated agriculture, increases in temperature by the mid-2030s result in declines in
crop yields by up to 20% relative to the present climate across all of Europe, for all crops
modelled except for maize in regions of Central Europe and England. Higher
temperatures are beneficial only in regions that are currently at the lower limit to grow
crops such as Northern and North-Eastern Europe.
When increases in CO2 levels are included, the yield declines are offset due to the CO2
fertilisation effect for C3 crops such as wheat, sugar beet, sunflower. However, these
effects are still affected by large uncertainties especially under strong water and nutrient
limitations in the soil. Weather and climate extremes may also heavily affect crop yields
by causing large losses; however these processes are not well integrated in the current
modelling approach and, thus, their effects are not fully taken into account.
As regards the economic impacts of the change in crop yields on the European
agricultural sector, results show that by 2050, the modelled climate change can lead to
decreases in EU crop prices, without and with the CO2 fertilisation effect. Livestock
commodities are not directly affected by climate change in the scenarios assessed, but
indirectly as the effects on feed prices and trade are transmitted to dairy and meat
products.

9
5. Energy (2°C warming and high warming scenarios)
The increase in temperature in Europe with global warming will lead to a decrease of
heating needs and an increase in demand for cooling. The demand for air cooling is
projected to increase by approximately 50% before reaching 2°C warming due to the
higher summer temperatures, and may multiply by a factor of 3 by the end of the
century at higher levels of warming. Yet, energy demand for heating remains the
dominant driver of the total energy needs in each of the European regions considered. In
absolute terms, Europe-wide, reductions in heating demand will therefore compensate for
the increase in cooling demand. Before mid-century, when warming remains below 2°C
warming, total effects on energy demand remain limited (-5%). By the end of century
with warming above 3°C, residential energy demand is projected to decline by 27%.
Most of the increase in cooling demand is concentrated in countries in Southern Europe
and Central-Southern Europe, where temperatures are the warmest and where air
conditioning diffusion is the greatest. Introducing policies that lower energy demand
through improved energy efficiency, such as increased insulation, could achieve even
larger savings of up to 40%.
6. Transport infrastructure (high warming scenario)
Transport infrastructures and operations are designed to be resilient to some extreme
weather events. However, climate change will increase the frequency and magnitude of
extreme events. This poses a threat to the transportation sector: by the end of the
century about 200 airports and 850 seaports of different size across the EU could face
the risk of inundation due to higher sea levels and extreme weather events. In particular,
countries by the North Sea have the greatest number of airports at risk of coastal
flooding that exceeds 1m of inundation. On the other hand, transportation along the
rivers Rhine and Danube could face less drought-related disruptions relative to the
present climate, which translate into potential economic savings in terms of
transportation costs.
7. Water resources (2°C warming and high warming scenarios)
Under 2°C warming, except for the Mediterranean region, precipitation will increase in
most parts of Europe with the strongest wetting over the Alps and Eastern Europe. As a
result, annual median river flows are projected to increase in most of Europe, except for
the Mediterranean, where a decrease in flow is projected in all four seasons. Low river
flow conditions will become more severe and happen more frequently in southern parts
of Europe, especially in summer, but will become less critical at northern latitudes. In
combination with the decrease in freshwater resources, Southern European regions,
which already have high water consumption relative to water availability, will face an
increased need for irrigation water due to higher evaporative demands under global

10
warming. As a result, Southern European countries are projected to face increased water
shortages, with, among other, impacts on both hydropower generation and cooling
capacity for thermal generation. For many countries in Central Europe, the projections
indicate a reduced reliance on upstream inflow to meet local water demands.
Furthermore, groundwater recharge is also decreasing in the Mediterranean, adding to
the already decreasing surface water availability. Also, more and more environmental
flow issues will increase in the Mediterranean, when rivers have too little water to fulfil
ecological standards.
Under the high emission scenario, all trends projected under the 2°C scenario are
magnified, but in many cases also exended north. Pressures on water resources with
increased scarcity issues are projected not only for the Mediterranean but also for
western and Central Europe.
Various adaptation mechanisms could lessen the effects of climate change on European
water resources, even under 2°C global warming, especially in the Mediterranean part of
Europe. Adaptation could take place by increasing irrigation efficiency, deficit irrigation,
possible re-use of treated waste water for irrigation, improving cooling processes in
industry and energy production, or improving intra-annual storage management of water
resources in a basin. Water pricing could also provide incentives for users to consider
water savings. Increased synergies between the water and agricultural policies are
needed. A better control of illegal abstractions is needed to prevent over-exploitation of
groundwater resources in a number of European regions, even more so given the
reduced groundwater recharge under climate change scenarios.
8. Habitat loss in the Mediterranean region (2°C warming and high warming scenarios)
The Mediterranean region is a global hotspot of biological diversity. However, this
reservoir of biodiversity is threatened by climate-driven habitat loss. Under a high
warming scenario, the present Mediterranean climate zone is projected to contract by
16% (157,000 km2) by the end of the century, this is equivalent in area to around half of
Italy. Only 71% of the present area of the Mediterranean climate zone remains stable.
The remaining 13% represents uncertain changes. Expansion of arid zones is the cause
for contraction of the Mediterranean zone. The arid climate zone is projected to increase
to more than twice its current extent, an expansion equivalent to three times the size of
Greece. That could lead to a decrease of biodiversity due to the migration or extirpation
(local extinction) of Mediterranean species that are unable to cope with the magnitude of
habitat change.
An expansion (“new” Mediterranean zones) representing 50% of the present extent of
the Mediterranean zone is projected to occur mostly over temperate oceanic areas under
the high emissions scenario. This suggests increased ecosystem disturbances such as

11
fires, droughts, pests and invasive alien species. Additionally, new biota assemblages
could reduce biodiversity and ecosystem services.
Limiting global warming to 2°C could see less contraction (2%) and greater stability of
the Mediterranean climate zone, and significantly less expansion of the arid zone. 91% of
the present Mediterranean zone remains stable under the 2°C scenario and the arid zone
increases in area by 14% from the present climate.
Only 63% of the Mediterranean climate zone that is currently within Natura 2000 sites
remains stable by the end of the century under the high warming scenario; a much
larger area (85%) of the Mediterranean climate zone that currently falls within the sites
remains stable under the 2°C scenario suggesting less impacts in nature and biodiversity.
9. Forest fires (2°C warming and high warming scenarios)
Climate change strengthens the current north-south pattern in the moisture levels of
deep layers of wood, leaves, soil and other organic matter on the ground. The ground
becomes drier from present around the Mediterranean region, under both a high warming
scenario and a 2°C scenario. Areas exhibiting low moisture extend further northwards
from the Mediterranean than nowadays. The present area of high moisture surrounding
the Alps decreases in size with climate change.
The danger of forest fires increases with climate change around the Mediterranean, with
Spain, Portugal and Turkey being the three countries with the highest danger.
10. Labour productivity (2°C warming and high warming scenarios)
Under the high warming scenario, daily average outdoor labour productivity could decline
by around 10-15% from present-day levels in several Southern European countries by
the end of the century (Bulgaria, Greece, Italy, the Former Yugoslav Republic of
Macedonia, Portugal, Spain and Turkey).
Countries in Northern Europe could also see declines in daily average outdoor labour
productivity, but they are considerably smaller than for the southern countries, at around
2-4% (Denmark, Estonia, Finland, Norway and Sweden).
With European-wide planned adaptation that shifts the hours of working for people
engaged in moderate to intense working activity, from day-time to night-time, outdoor
labour productivity could remain at, or very close to, present-day levels in many
European countries at the end of the century. Yet that would entail detrimental side-
effects of night working, such as chronic fatigue, anxiety, depression and noise pollution
to local residents, which have not been economically quantified in this study.

12
11. Mortality due to heatwaves (2°C warming and high warming scenarios)
Additional human mortality due to heat waves is reported in this study. Under the high
warming scenario, not taking into account adaptation, EU annual mortality could largely
increase (with 132,000 additional deaths/year), a factor 50 rise compared to the present,
with most of the increase occurring in the Central Europe regions and Southern Europe.
Under the 2°C scenario the additional deaths per year would be 58,000.
Caveats
Although this study covers many of the important damage mechanisms, the coverage of
possible climate impacts in Europe is still incomplete. Key biophysical and socio-economic
impacts like the effects of changes in ecosystems services, migration and irreversible
climate tipping points have not been considered. Therefore, this study should not be
interpreted as a complete assessment of the benefits of climate mitigation policy.
The economic integrative approach intends to make somehow comparable fundamentally
heterogeneous impact categories, looking for consistency in the comparison across
different damaging mechanisms (and therefore helping the identification of priorities in
terms of adaptation efforts). One should take into account that the economic
methodology is subject to many uncertainties and assumptions. Moreover, the EU
economic aggregate figures of economic losses remarkably hide a wide geographical and
sectoral variability, essential information for adaptation policies.
Further research
The scope of climate impact and adaptation studies could be extended into several
directions: enrich their spatial resolution (going local and regional), better understand
the role of extreme events (many impact models mainly focus on gradual climate
change, i.e. not considering the existence of thresholds beyond which impacts become
highly non-linear and irreversible), include non-market climate impact areas (e.g. natural
ecosystems, climate catastrophes, migration) further integrate the various impact models
(e.g. the land-water-energy nexus), and improve the cost-benefit analysis of adaptation.
13
1 Introduction
Climate change adaptation and disaster risk reduction have been recognized as a priority
worldwide. Amongst the global action plans dealing with these priorities, the Paris
Agreement on climate change and the Sendai Framework for Disaster Risk Reduction are
important milestones, as well as European initiatives like the EU Climate Change
Adaptation Strategy. The Paris Climate Agreement raises the policy relevance of
adaptation to the same level and importance as mitigation and establishes the framework
of limiting global warming well below 2°C and pursuing 1.5°C, while simultaneously
enhancing adaptive capacity, strengthening resilience and reducing vulnerabilities.
The objective of the EU Strategy on Adaptation to Climate Change, adopted by the
European Commission in April 2013, is to contribute to a more climate-resilient Europe.
One of its three objectives is to promote better informed decision-making by two means:
(a) refining knowledge gaps and identifying means to address those considered
significant for the purposes of the strategy; and (b) enhancing knowledge sharing and
transfer across Europe. Action 4 of the Strategy aims at bridging the knowledge gap for
four broad gap blocks; one of them is the 'information on damage and adaptation costs
and benefits'.
The series of PESETA projects of the Joint Research Centre (JRC) have intended to better
understand the possible biophysical and economic consequences of future climate change
for Europe. The JRC PESETA II preliminary results contributed to the development of the
EU Adaptation Strategy, providing background information about climate impacts in
Europe.
The aim of the JRC PESETA III project is to further improve the understanding of climate
impacts in Europe. In particular, the project intends to provide better estimates of
adverse climate change impacts and costs of global warming to support the successful
implementation of the Paris Agreement, contribute to the Commission's mid-century
strategy, and underpin any future review of the EU Adaptation Strategy.
The JRC PESETA III project, compared to JRC PESETA II, uses the new family of climate
futures (Representative Concentration Pathways, RCPs, and Shared Socioeconomic
Pathways, SSPs). EURO-CORDEX climate data consistent with the high-end emission
scenario (RCP8.5 family) are used, instead of the older IPCC SRES scenarios of the JRC
PESETA II project.
The purpose of this report is to summarise the main findings of the JRC PESETA III
project. The report does not deepen into the technical aspects of the various components
and models of the project, which can be found in the related JRC technical reports.

14
The report is structured in six sections, including this introduction. Section 2 presents the
methodological approach. The main impact results are presented in Section 3, while
Section 4 details the integrated economic implications. Section 5 notes a number of
limitations of the study. Section 6, finally, discusses some possible improvements and
extensions.

15
2 Methodology
Climate change damaging mechanisms are extremely heterogeneous and multifaceted,
and are already acting along a plethora of transmission patterns from the biophysical to
the socio-economic level. Addressing them all with a view to provide valuable insight to
prioritize adaptation options is virtually impossible from a top-down perspective.
According to the bottom-up focus adopted at the root of the PESETA approach, there are
three main methodological steps in the project. Firstly, the scenarios of climate change
and socio-economic development are selected. In the second step, the impact models, all
using the same climate change datasets, are run to simulate the impacts across a range
of sectors and hazards. In the third step, the sectoral and hazard impacts are
consistently valued in wider economic terms. This section details the main
methodological elements.
2.1 Harmonised climate change and socioeconomic scenarios
2.1.1 Climate change scenarios
The climate data used in JRC PESETA III are derived from regional climate models
(RCMs) that simulate physical climate processes on a geographical grid that covers the
whole of Europe, i.e. including non-EU countries. Some of the sectoral studies are applied
to the wider European domain in order to also deal with results for non-EU countries. The
climate projections have a relatively fine grid scale (0.11 degree, ~12.5km), the highest
presently available for pan-European studies.
Projections of future climate differ between climate models, even when they consider the
same greenhouse forcing and with all models built in plausible ways. This is known as
climate modelling uncertainty. In order to account for this uncertainty, JRC PESETA III
started with an initial set of 11 climate simulations that took part in a large, on-going
climate model inter-comparison project called EURO-CORDEX (http://euro-cordex.net/).
From this ensemble, a core sub-set of 5 climate simulations were chosen because for
some impact analyses it is computationally very demanding to run all 11 climate
projections. The 5 priority runs were carefully selected to ensure that they represented
the range in climate projections produced by the larger set of 11. All of the impact
sectors in JRC PESETA III used at least the smaller sub-set of 5 climate projections. We
further note that model simulations of the present and recent climate can differ from the
observed climate, revealing a certain climate model bias. The climate model simulations
for temperature and precipitation used in JRC PESETA III were therefore bias corrected
based on quantile mapping with observed data. More details on the climate data can be
found in Dosio (2016) and Dosio (2017).

16
The rate and degree of global warming relates to the amount of greenhouse gases in the
atmosphere with time, which is uncertain. The most recent scenarios are based on
Representative Concentration Pathways (RCPs; van Vuuren et al., 2011), which have
been adopted by the Intergovernamental Panel on Climate Change (IPCC) for its Fifth
Assessment Report (AR5). This project only considers climate change associated to the
highest RCP, RCP8.5, which corresponds to a radiative forcing value in the year 2100
relative to pre-industrial values of +8.5 W/m2. In this pathway, global carbon dioxide
emissions nearly double from the currently levels by 2050, and continue growing to
about 2.5 times their current level by the end of the century.
From the transient climate projections up to 2100 under RCP8.5, JRC PESETA III focuses
on two periods in particular:
• The end of the century (2071-2100), with Global Warming Level >3°C (GWL,
defined as the temperature global mean temperature increase compared to the pre-
industrial period) . This is further referred to as the high warming scenario.
• The period for which GWL = 2°C (approximately 2025-2055). This is further
referred to as the 2°C warming scenario.
At the end of the century, the IPCC AR5 projects a GWL of around 3.7°C ± 0.7°C, but the
warming over different regions can be much larger, depending strongly on both location
and season.
Results for the end of the century show how future climate without mitigation (i.e., high
levels of global warming) would impact on Europe, whereas the results for the 2°C period
portray impacts when global average temperature rises by 2°C relative to pre-industrial
temperatures, in accordance with the limit set by the Paris Agreement. The advantage of
considering only RCP8.5 is that it allows evaluating impacts for the Paris warming target
of 2°C as well as higher levels of warming using a single emissions pathway. It is,
however, important to note that impacts at the Paris target of 2°C under the continued
warming pathway considered here may differ from those under a stabilization pathway,
because of the sensitivity of climate to radiative forcing of greenhouse gases and
aerosols, as well as the lags inherent in some climate responses (e.g., sea-level rise). For
both periods the impacts are compared with the recent past (1981-2010), i.e. “the
present”. The years when global temperature rise reaches 2°C are different for each
climate model (Table 1). Impacts under both warming scenarios under RCP8.5 are
compared with those under present (1981-2010) climate conditions.
Some impact models have also computed the effects in the 2030s (average of the 2021-
2050 period). These results, however, are very similar to those of the 2°C scenario, and
therefore this report only focuses on the 2°C and high warming scenario.

17
Table 1. The priority sub-set of 5 climate models used in JRC PESETA III, and the year when 2°C is reached
Climate model full name 2°C
H1 CNRM-CERFACS-CNRM-CM5_r1i1p1_CLMcom-CCLM4-8-17 2044
H2 ICHEC-EC-EARTH_r12i1p1_CLMcom-CCLM4-8-17 2041
H3 IPSL-IPSL-CM5A-MR_r1i1p1_IPSL-INERIS-WRF331F 2035
H4 MOHC-HadGEM2-ES_r1i1p1_SMHI-RCA4 2030
H5 MPI-M-MPI-ESM-LR_r1i1p1_SMHI-RCA4 2044
Under the high warming scenario at the end of the century, the EURO-CORDEX
simulations used in JRC PESETA III show that Europe is projected to face a warming of
nearly 4ᵒC (consistent with the IPCC AR5 projections based on the full CMIP5 ensemble of
global models). Yet, the increase in temperature varies much both spatially and
seasonally (Figure 1). For instance, due to the moderating effects of marine climate on
the one hand and polar amplification on the other hand, winter temperature is projected
to increase, on average, between 2.7ᵒC over the British Isles (mean value of all bias-
adjusted RCMs) and 5.4ᵒC over Scandinavia, and local values may be even higher. In
summer, the projected change ranges between 3.0ᵒC over Britain and 4.7ᵒC over the Alps
and the Mediterranean regions. All models project an increase of temperature, but
individual models’ values can vary largely (Dosio, 2016).
Figure 1. Projected change of seasonal mean daily temperature for winter and summer, at the end of the century (2071-2100) compared to the present climate (1981-2010), under RCP8.5

18
Projected changes of winter and summer daily precipitation are shown in Figure 2. Winter
precipitation is projected to increase over most of Central and Northern Europe. In
summer, a general reduction in precipitation is projected for all regions except
Scandinavia and Eastern Europe. The southern regions of several Mediterranean
countries see declines in precipitation in both seasons.
It is important to note that models do not always agree on the change of summer
precipitation; although all models project a drying over the Iberian Peninsula and
increased precipitation over Scandinavia, for the other regions models’ results are more
heterogeneous, and, sometimes, contradictory (e.g., over Central Europe, where a mean
decrease of -1.6% is the result of the large models’ variability, with values ranging
between -16% and +37.2%).
Figure 2. Projected change of daily precipitation in winter and summer, at the end of the century (2071-2100) compared to the present climate (1981-2010), under RCP8.5 (top figures). Hatching
indicates areas where more than 80% of model runs (9 out of 11) agree on the sign of change (bottom figures)

19
The coastal flooding study not only addresses Sea Level Rise (SLR), it is also based on
projections of Extreme Sea Levels (ESL). ESLs are the result of contributions from the
mean sea level (MSL, increasing under SLR), tide and extreme weather, winds and
pressure driving waves and storm surges. The spatial and temporal dynamics of all the
above components are resolved through dynamic simulations. The study, as well as the
dataset is presented in Vousdoukas et al. (2017a).
2.1.2 Socio-economic scenarios
The economic evaluation of impacts is made within a specific setting of the state of the
economy. That can be static (the economy as of today) or dynamic (the economy of the
future). All impact studies allow making a comparative static scenario analysis based on
the well-known computable general equilibrium (CGE) methodology. This implies
assessing climate impacts as if future climate occurs in the present, affecting today's
economy and population. This approach is appropriate in order to avoid making
assumptions on the future (long-term) evolution of the socio-economic systems
(demography, economy size, sectoral decomposition of the GDP, etc.), which could
greatly distort the sectoral impacts of climate change. An additional advantage of this
methodology is that it eases the comparison of the severity of the different impacts
against the same economic system metrics. However, the absolute damage figures may
be unrealistic (and highly conservative), as it neglects the long-term dynamic growth of
the overall economies. Therefore, the comparative static analysis of the economic sectors
assumes the current levels of population, gross domestic product (GPD) and sectoral GDP
structure.
However, in some cases, it is interesting to understand the sensitivity of impacts to
future socio-economic change (the genuinely dynamic perspective). To this end, impacts
under different assumptions of future socio-economic change are also estimated for
energy, coastal floods, river floods and agricultural economics.
Three dynamic socioeconomic scenarios are considered in the project: the ECFIN Ageing
Report (European Commission, 2014 and 2015; Havik et al., 2014) – implemented by
the three sectoral studies using the dynamic approach - and two other scenarios used in
the international climate change impact context, known as the “Shared Socio-economic
Pathways” (SSPs; Riahi et al., 2017). The SSPs (SSP3 and SSP5) are consistent with the
RCP8.5 pathway used in JRC PESETA III.
The SSPs population projections come from the gridded projections of global population
density at 1/8o resolution of Jones and O’Neill (2016).
The EU Ageing Report projections are based on very detailed analyses of the
determinants of long-term growth in Europe, notably demographics, labour market and

20
planned legislation measures and, furthermore, they have been assessed by the EU
member states economic departments and other related ministries.
SSP3 assumes that there is slow to moderate economic development and increased
international fragmentation due to countries focussing on achieving their own energy and
food security goals at the expense of broader-based development. Slow technological
change and large regional inequalities mean that there are challenges to both mitigating
and adapting to climate change.
SSP5 assumes that there is rapid globalisation and economic development. This occurs at
the expense of a lower global environmental protection, as in the absence of climate
policies, energy demand is high and most of this demand is met with carbon-based fuels.
Nonetheless, rapid economic development means that challenges to adaptation are lower
than in the SSP3, but there are still challenges to mitigation because of the reliance on
carbon-based fuels.
2.2 Overview of impact models
Changes in climatic conditions are converted into a wide range of impacts, some of which
are translated into monetary terms, using a number of specific assessments undertaken
as part of the JRC PESETA III project. These impacts relate mostly to direct impacts from
climate change, such as loss in crop yield, reduced water availability, or direct damage to
infrastructures from flooding. The economic analysis then integrates where possible the
direct impacts into a wider economic assessment to understand the overall economic
implications of climate change on society. This section provides an overview of the
essential elements of the impact assessment in order to interpret the results. Further
details on the scenarios considered, methodologies and results can be found in the
references provided in Table 2. All sectors, with the exception of transport, have
assessed the 2°C scenario. Only the economic agriculture, coastal and river floods
assessments have considered the dynamic setting, on top of the static case.
JRC PESETA III uses a broad set of impact models to quantify the effects of climate
change on several sectors across Europe. The following climate impact categories have
been considered in the impact assessment: coastal floods, river floods, droughts,
agriculture, energy, transport, water resources, habitat loss, forest fires, labour
productivity and mortality. See Annex 1 for further methodological details.
Some of the models are used across multiple sectors because the projections from one
impact model can be used as input to another model. That is the case of the hydrological
model, whose projections are used to estimate the impact of climate change on river
flooding, drought, transport infrastructure, and water availability. The coastal flood risk
21
model is used to quantify the number of people affected and economic damages from
coastal flooding, as well as the impact on transport infrastructure.
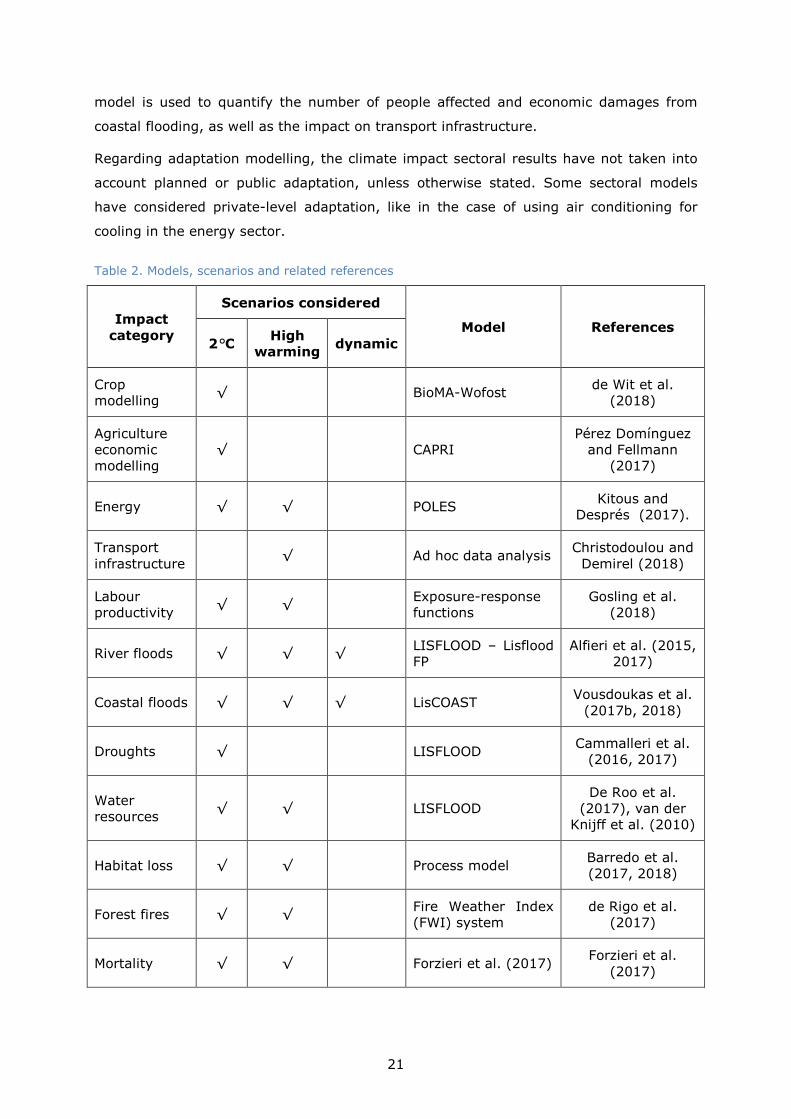
Regarding adaptation modelling, the climate impact sectoral results have not taken into
account planned or public adaptation, unless otherwise stated. Some sectoral models
have considered private-level adaptation, like in the case of using air conditioning for
cooling in the energy sector.
Table 2. Models, scenarios and related references
Impact
category
Scenarios considered
Model References
2°C High
warming dynamic
Crop modelling
√ BioMA-Wofost de Wit et al.
(2018)
Agriculture economic modelling
√ CAPRI Pérez Domínguez
and Fellmann (2017)
Energy √ √ POLES Kitous and
Després (2017).
Transport infrastructure
√ Ad hoc data analysis Christodoulou and
Demirel (2018)
Labour productivity
√ √ Exposure-response functions
Gosling et al. (2018)
River floods √ √ √ LISFLOOD – Lisflood FP
Alfieri et al. (2015, 2017)
Coastal floods √ √ √ LisCOAST Vousdoukas et al.
(2017b, 2018)
Droughts √ LISFLOOD Cammalleri et al.
(2016, 2017)
Water resources
√ √ LISFLOOD De Roo et al.
(2017), van der Knijff et al. (2010)
Habitat loss √ √ Process model Barredo et al. (2017, 2018)
Forest fires √ √ Fire Weather Index (FWI) system
de Rigo et al. (2017)
Mortality √ √ Forzieri et al. (2017) Forzieri et al.
(2017)

22
Based on the approach followed, the impact models used can be classified into two broad
types: process-based and statistical. The process-based models simulate the interaction
between climate change and specific impacts, by explicitly modelling the cause-effect
relationships. The statistical approaches build upon observed relationships between
climate and the impact variables, without considering the transmission mechanisms or
causality pathways from climate change to impacts. This second approach relies mainly
on the available empirical evidence.
2.3 Economic model
Direct impacts are highly heterogeneous. They emerge at varying speeds and affect
different socio-economic vectors. The transmission mechanisms through which they
affect several economic sectors (and, eventually, the entire socio-economic system) need
to be adequately captured in any modelling exercise. One way to make them comparable
is to integrate them under a common economic setting, to the extent to which the direct
impacts can be economically valued. For instance, impacts on agriculture yields can be
assumed to affect the productivity of the agriculture sector, which can be valued in
economic terms. Effects on habitat loss are more difficult to quantify in economic terms
and therefore cannot be integrated into the economic modelling currently.
Providing a ranking about the severity of the different climate impact patterns is crucially
important for policymaking purposes. The degree to which the climate impacts in
different areas become relatively comparable can be of value for policymakers intending
to prioritise scarce economic resources in climate policy. Thus understanding where
impacts are higher can be useful to geographically allocate climate adaptation resources.
Economy-wide policy analysis is often conducted by means of computable general
equilibrium (CGE) economic models, which combine a detailed sector structure of the
economic system under analysis with an appropriate modelling of the markets for
production factors (e.g. capital, labour, resources, and energy). The CGE methodology
has been applied in the context of climate impact analyses by several teams to integrate
diverse impacts, such as, e.g. Bosello et al. (2012), Reilly et al. (2013) and, more
recently, OECD (2015) and Houser et al. (2015). The methodology has three main ideas,
following its full name (see e.g. Shoven and Whalley, 1992): first, it relies on the notion
of market equilibrium (supply equals demand); second, the equilibrium is general, so
involving all markets of the economic system (all production factors, goods and
services); and third, the general equilibrium is computed via a calibration process where
the national accounts of a base year (in a sense, a snapshot of the transactions between
all economic agents in all markets) are precisely replicated by the model equations.

23
It should be noted that when such diverse climate impacts, derived from highly detailed
and different impact models, are integrated into a single economic model, one is
adopting a set of implicit assumptions that can influence the final results. In this respect
the results of the study rely on the impact dimensions that determine entirely the
economic summary.
The use of the CGE methodology has two other advantages for climate impact analysis,
in addition of allowing the comparison of heterogeneous climate impacts. The method
considers the so-called indirect effects occurring via the market system: how impacts in
one economic sector and country would affect other sectors and countries. For instance,
climate impacts in the agriculture sector in Greece (what could be defined as the direct
effect) would also affect other sectors closely linked to agriculture in Greece, such as its
agro-food industry, and other countries, like agriculture trading partners. These links are
duly accounted for in the model calibration phase.
The second advantage is closely related to the ability to explore the indirect effects. As
long as markets would adjust to the climate shock, the methodology captures implicit
adaptation by definition, via the changes in market prices. For instance, when the
agriculture productivity is affected by climate change, the agriculture market and all
other markets of the economy are adjusted via the economy price system. That is a
general and broad process that affects all input and good markets of the country where
the shock hits, and also the same markets in the countries with which the country has
trade relationships.
The economic simulations have been performed with the GEM-E3-CAGE CGE model.
Details of the CGE model used and its implementation are given in Annex 2.
Following the scheme adopted in previous PESETA studies, the economic results are
presented by dividing the EU into the following regions, according to their latitude and
their relative economic size:
• Northern Europe: Sweden, Finland, Estonia, Lithuania, Latvia and Denmark.
• UK & Ireland: UK and Ireland.
• Central Europe North: Belgium, Luxemburg, Netherlands, Germany and Poland.
• Central Europe South: Austria, Czech Republic, France, Hungary, Slovakia,
Romania
• Southern Europe: Bulgaria, Croatia, Cyprus, Greece, Italy, Malta, Portugal,
Slovenia, Spain.

24
2.4 Overview of sectoral impact analyses
Figure 3 gives an overview of the sectoral coverage of the various analyses contained in
the JRC PESETA III project. Three kind of analyses are conducted in the project:
• Climate impacts (in biophysical terms). The climate impacts are studied for the
eleven sectors of the project and are presented in Section 3.
• Economic impacts. The economic analysis is made for six of the impact
categories: residential energy demand, coastal floods, inland floods, labour
productivity, agriculture and heat-related mortality.
• Transboundary or spillover analysis, associated to four impact areas: residential
energy demand, river flooding, labour productivity and agriculture.
Figure 3. Overview of climate impact coverage for each kind of analysis

25
3 Impact results
3.1 Coastal floods
One third of Europeans live within 50 km of the coast. Climate change could have
profound impacts in these coastal zones due to coastal floods. The two impacts modelled
refer to expected economic damages of coastal floods (€bn/year), and expected
population affected by coastal floods (people/year). Current EU annual damages from
coastal flooding are estimated at €1.25 bn, with 102,000 people affected annually.
Projected economic damage
Under the static economic analysis (with fixed exposure, i.e. due to the effects of climate
change only) EU annual damages are projected to be around €60 bn by 2100 for the high
warming scenario (Table 3, RCP8.5 row, 2100 column), and could be reduced by almost
an order of magnitude under the 2oC scenario to €6 bn, a large damage reduction.
Projections of socio-economic development indicate that the wealth in coastal zones will
rise stronger relative to total country increases in wealth, as population and economic
activity will further concentrate in coastal areas. This means that coastal flood risk is
amplified by economic growth. The dynamic projections would imply much larger EU
damages, between €93 and €961 bn by 2100 in the high warming scenario, respectively
for SSP3 and SSP5. The 2°C scenario would largely reduce the damages relatively.
It should be noted, however, that the projected socio-economic conditions imply a
wealthier society, hence also an improved capacity to absorb the increase in coastal flood
risk. It should be further considered that the impact of coastal flooding at a certain level
of warming is strongly dependent on the concentration pathway adopted (i.e. the speed
at which a certain warming is reached). This is related to inertia effects of global warming
on sea level rise. Because the rate of warming is highest under RCP8.5 the effect of sea
level rise is less pronounced compared to slower warming pathways (such as RCP4.5 or
RCP2.6) at a specific warming level. Nevertheless, at any specific point in time, impacts
under RCP8.5 are always larger than under RCP4.5. Under a RCP4.5 – ECFIN scenario
(not in the table), flood impacts are approximately 20% lower compared to the RCP4.5 –
SSP1 country based projections. This reflects the somewhat slower economic growth
projected by the ECFIN Ageing Report compared to SSP1. For RCP8.5, the results based
on the ECFIN projections (with EAD = 238 billion Euro for Europe by 2100) lie in between
those for SSP3 (with EAD = 104 billion Euro for Europe by 2100) and SSP5 (with EAD =
555 billion Euro for Europe by 2100).

26
Table 3. Projected evolution in time of coastal flooding impacts aggregated at European level: Expected Annual Damage (EAD; billion €) and Expected Annual number of People Affected (EAPA; thousand people) from coastal flooding under RCP4.5-SSP1, RCP8.5-SSP3, and RCP8.5-SSP5. Values express the ensemble mean projections, for 2030, 2050, 2080, and 2100, as well as under 2oC warming
Scenario Baseline 2030 2050 2080 2100 2
°C
EAD
RCP4.5 1.25 3.71 6.56 16.57 26.96 8.9
RCP8.5 1.25 3.87 8.13 28.44 59.82 6.01
RCP4.5-SSP1 1.25 7.53 20.96 80.94 155.86 34.96
RCP8.5-SSP3 1.25 5.3 12.49 45.19 92.72 8.98
RCP8.5-SSP5 1.25 9.3 39.42 293.76 960.97 22.33
EAPA
RCP4.5 102 273 468 975 1330 586
RCP8.5 102 291 559 1359 2078 436
RCP4.5-SSP1 102 299 540 1173 1532 688
RCP8.5-SSP3 102 294 533 1140 1519 429
RCP8.5-SSP5 102 336 742 2204 3650 545
Projected affected population
With static population, the affected population could rise to 2 million people under the
high warming scenario. Under a 2°C scenario, the population affected would be 0.4
million people, a large reduction compared to the high emission case.
When including SSP-based spatial projections of population change (but not accounting
for changes in the spatial distribution of population in response to sea-level rise) the total
population affected could reach around 3 million people by the end of the century.
Adaptation
The safety of European coastal societies depends on natural and human-made coastal
flood protection, e.g. the capacity to buffer and absorb ocean energy through complex
wave shoaling and breaking processes. Long-term coastal adaptation strategies can avoid
significant economic damages and displacement of populations across Europe’s
coastlines. Whilst mitigation of emissions can lessen the impacts, it cannot eliminate
them.

27
3.2 River floods
Flood risk is likely to increase in the future due to the combined effects of climate change
and socio-economic developments. Similarly to the coastal study, the flood assessment
considers two kinds of impacts: expected economic damages of river floods (€bn/year),
and expected population affected by river floods (people/year).
Impacts without adaptation
Currently around 216,000 people across the EU are already exposed to river flooding
annually, with flood damage amounting to €5.3 bn/year (Figure 4). Note that this
historical scenario is based on the period 1976–2005. If future climate would happen on
today's economy and society (static setting), overall mean projections of annual
population affected by floods are estimated to increase to 530,000 for the 2°C scenario
and to further rise to 717,000 for the high warming scenario. The expected annual
damage is projected to rise to €12.5 bn and €17.5 bn for the respective future scenarios.
It is important to note that in the time window corresponding to the high warming
scenario (2071-2100) most climate projections reach or even exceed +3°C, hence the
larger spread observed in the left panel of Figure 4 for a number of countries compared
to the 3°C warming scenario shown in the right panel (e.g. Italy and France). Also, the
relationship between warming and impacts is variable across areas and model, and in
some areas impacts may decrease (or remain stable) with increasing warming.
When socio-economic dynamics are included through the SSPs, the expected affected
population ranges between 530,000 (SSP3) and 975,000 (SSP5) for the high warming
scenario. The effect of socio-economic projections are much stronger for the expected
annual damage, which for the high warming scenario is projected to reach €29 bn under
SSP3, to exceed €50 bn under ECFIN, and climb to €112 bn under SSP5. Economic
growth is embedded in the dynamic socio-economic scenarios and this amplifies the
exposure to the flood hazard. Under the ECFIN and SSP3 scenario, the affected
population is comparable or lower with respect to the “No SSP”, while in the SSP5
scenario the impacts for all countries are projected to be larger, with an increasing
spread of the model ensemble.

28
Figure 4. Left graphs: expected annual damage for the baseline and for the future periods 2021-2050 and 2071-2100 (high warming scenario). Right graphs: expected annual damage for different levels of warming. Figures show flood impacts under future climate conditions on present European
society (static). Note that some countries are not included in the graphs because impacts are negligible compared to other countries. Also note different scales on the horizontal axes.
29
Adaptation
Several adaptation options have been considered in the project:
1) a rise of flood protection such as increasing the height of river banks;
2) reducing peak river flows through water retention mechanisms such as
sustainable urban drainage systems (SUDS) and rural water retention systems;
3) reduction of vulnerability by implementing early warning systems, dry and wet
flood proofing, and floating buildings; and
4) relocation of populations and assets to areas of negligible risk.
The Figure 5 presents how the affected population and damage in the 2°C and high
warming scenarios would change under the four adaptation strategies implemented at
different levels of intensity (called "sensitivity" in the charts) in Germany, France, UK and
Italy (which represent more than 50 % of the European population considered in this
study). Estimates are for a high warming scenario (RCP8.5) and future socio-economic
development characterised by high mitigation challenges with low adaptation challenges
(SSP5).
The horizontal black lines show the effects of flooding in the present climate. As can be
seen, the graphs indicate large increases in river flood risk if adaptation measures are
not improved (i.e. constant intensity), due to increasing flood hazard and socio-economic
exposure. At the same time, keeping future risk to current levels with only one
adaptation strategy would require substantial improvements which might be
unachievable, especially for flood protection rising. For instance, an approach to
adaptation that relies only on raising flood protection levels can be unsustainable in the
long-term because, while reducing the frequency of floods below the protection level, it
can encourage economic development in the floodplain, so exposing society to low-
probability catastrophic floods (the “levee effect”). On this point it is worth noting that
future population scenarios do not consider the proportion of the population living in
flood-prone zones in the spatial projections. Future adaptation strategies should consider
the combination of different measures that are optimised at the entire river basin scale.

30
Figure 5. Annual affected population and damage across Germany (top) France, UK and Italy (bottom) for the 2°C and high warming scenarios with four adaptation strategies implemented at different levels of intensity ("sensitivity"). Shading denotes range in impacts from using 7 climate
models (average value is the solid line)
Note: Estimates are for a high warming scenario (RCP8.5) and future socio-economic development
characterised by SSP5.
3.3 Droughts
Droughts reduce soil moisture, which then affects ecosystems, plant growth, river flows
and agriculture. The drought assessment is based on the evaluation of the soil moisture-
based drought severity index (DSI), hence it represents soil drought. The results for the
2020s and the 2°C are very similar. Those of the 2°C case are presented.

31
Drought index/hazard
Figure 6 represents the spatial distribution of significant variation in drought hazard from
the present, under the 2°C scenario. The soil drought hazard rises (i.e. a reduction in soil
moisture) in the west of the Mediterranean region and it is reduced in Central and
Eastern Europe. Some regions see no significant change, including much of Belgium,
France, Italy, The Netherlands and the UK. The patterns of change suggest a
continuation of the drying and wetting trends observed across Europe over the past 50
years.
Figure 6. Spatial distribution of significant changes in soil moisture-based drought occurrence and severity (2°C scenario)
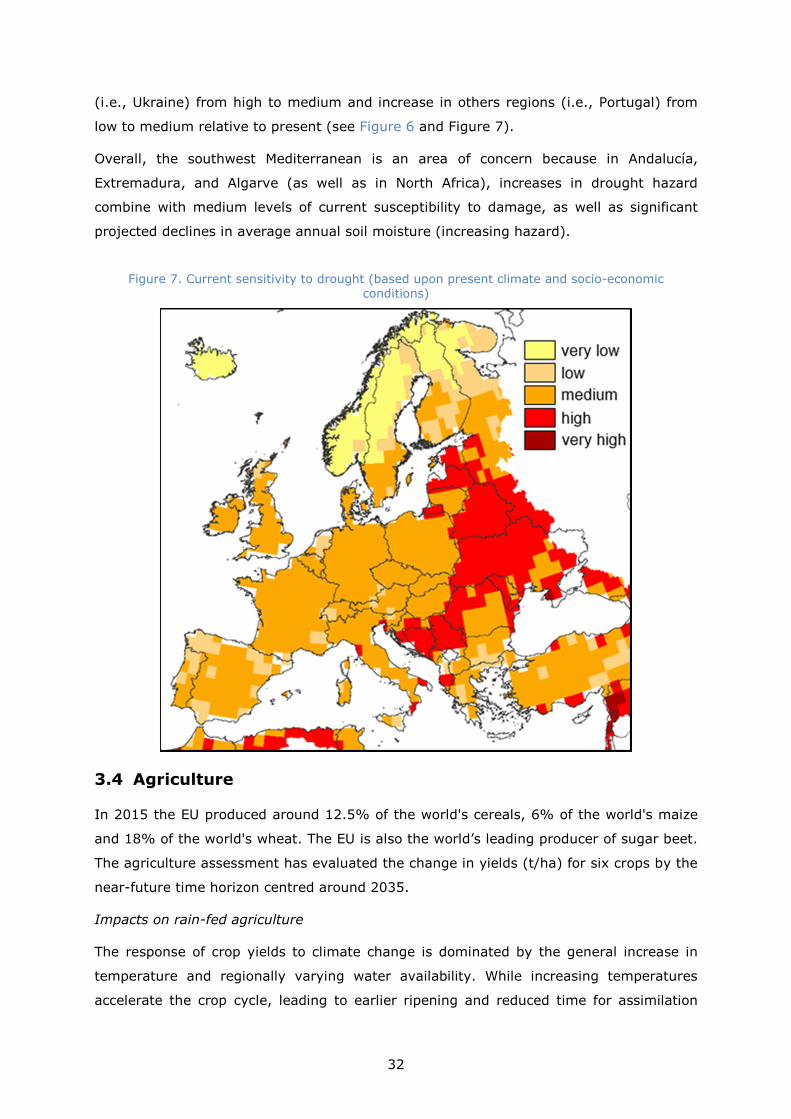
Drought risk
Figure 7 represents the propensity to damage, based on the current economic and
population conditions. The map considers both the exposure (e.g. population and
agriculture activity) and the vulnerability (health status and economic inequality).
The intercomparison of the maps in Figure 6 and Figure 7 shows how the regions with
increases in drought hazard overlap with regions currently characterised as having a low
or medium susceptibility to damage, whereas the regions that see reductions in drought
hazard intersect with regions of current high susceptibility to damage. This results in an
homogenization of soil moisture drought risk (combination of hazard and propensity to
damage) over Europe under the 2°C scenario, since the risk will decline in some regions
.
32
(i.e., Ukraine) from high to medium and increase in others regions (i.e., Portugal) from
low to medium relative to present (see Figure 6 and Figure 7).
Overall, the southwest Mediterranean is an area of concern because in Andalucía,
Extremadura, and Algarve (as well as in North Africa), increases in drought hazard
combine with medium levels of current susceptibility to damage, as well as significant
projected declines in average annual soil moisture (increasing hazard).
Figure 7. Current sensitivity to drought (based upon present climate and socio-economic conditions)
3.4 Agriculture
In 2015 the EU produced around 12.5% of the world's cereals, 6% of the world's maize
and 18% of the world's wheat. The EU is also the world’s leading producer of sugar beet.
The agriculture assessment has evaluated the change in yields (t/ha) for six crops by the
near-future time horizon centred around 2035.
Impacts on rain-fed agriculture
The response of crop yields to climate change is dominated by the general increase in
temperature and regionally varying water availability. While increasing temperatures
accelerate the crop cycle, leading to earlier ripening and reduced time for assimilation

33
with subsequently reduced yields, changes in precipitation regimes during important crop
development stages might either counteract the negative temperature effects or
reinforce them. Accordingly for some crops there is a higher spatial variability in the yield
response under climate change (Figure 8).
On the one hand, a favourable pattern emerges in Eastern Europe for all crops modelled.
There are some large yield increases relative to now, such as over 30% for wheat and
maize.
On the other hand, an adverse pattern emerges in Southern Europe. Here, yields decline,
especially for summer crops. For instance, maize, sugar beet and sunflower yields decline
in Italy and Portugal.
Impacts on irrigated agriculture
Increases in temperature by the mid-2030s result in declines in irrigated crop yields by
up to 20% compared to the current ones across all of Europe, for all crops modelled
except for maize in regions of Central Europe and England (Figure 8). Since water is not
a limiting factor, the effect of increased temperature and thus an accelerated crop cycle
leads to this reduction, if no adaptation is taken into consideration. Higher temperatures
are beneficial only in regions that are currently at the lower limit to grow crops, such as
in Northern and North-Eastern Europe.
However, when increases in CO2 levels are included, the yield declines are offset due to
the CO2 fertilisation effect for C3 crops such as wheat, sugar beet and sunflower. The
positive direct response of plants to increased CO2 levels is qualitatively well understood
and can even change the negative response induced by temperature. However, there are
still large uncertainties on the magnitude of the increased CO2 effects, especially under
water and nutrient limitations in the soil.

34
Figure 8. Changes relative to present (%) in irrigated and rain-fed yields, in the mid-2030s under a high warming scenario. Yields are the average from using 5 different climate models
Adaptation
A range of adaptation options should be explored and implemented to lessen the chances
of negative effects of climate change on crop yields.
This JRC PESETA III study did not however explore potential adaptation options, such as
the development and sowing of crops with enhanced drought resilience, improved
nutrient management, and the exploitation of new crop varieties. Such schemes have
been shown to work with some success in some parts of the world.
Adaptation to, and ways of dealing with, as well as a number of additional factors not
explicitly included in the modelling process will also be needed. These factors include the
adverse effects of heat stress, over-wet conditions, the occurrence of pests and diseases
and the impact of ozone concentrations.
Economic impacts on the agricultural sector (market-driven adjustments)
The assessment of the economic impacts of the biophysical climate-induced regional yield
changes requires taking into account market-driven adjustments and feedbacks on
agricultural production, trade, prices, and consumption. Moreover, as agricultural
markets are globally connected via world commodity trade, also climate change related
yield effects in non-EU countries are considered in the agro-economic analysis.
Accordingly, scenario results are the outcome of the simultaneous interplay of
macroeconomic developments (especially GDP and population growth), climate change
related biophysical yield shocks in the EU and non-EU countries, and the induced and

35
related effects on agricultural production and competiveness at domestic and
international markets.
Results show that by 2050, the modelled climate change can lead to decreases in EU
crop prices, without and with the CO2 fertilisation effect. Livestock commodities are not
directly affected by climate change in the scenarios assessed, but indirectly as the effects
on feed prices and trade are transmitted to dairy and meat products. In the scenario
without enhanced CO2 fertilization, EU crop producer price changes vary between -3% for
cereals and +5% for some other arable field crops, whereas producer price changes in
the livestock sector vary between -6% for sheep and goat meat (due to an increase in
relatively cheaper imports), and +4% for pork meat (due to a favourable export
environment). In the scenario considering CO2 fertilization, EU agricultural producer
prices decrease for all commodities. This is due to the general increase in EU domestic
production, which, compared to the reference scenario and the scenario without CO2
fertilization, faces a tougher competition on the world markets, consequently leading to
decreases in producer prices. Accordingly, EU producer prices in the crop sector drop by
about -20% for cereals. In the EU livestock sector, producer price changes vary between
-7.5% for cow milk and -19% for beef meat production as livestock benefits from
cheaper feed prices (and producer prices are further subdued due to increased imports).
In the scenario without CO2 fertilization, area increases for nearly all crops. Set aside
areas and fallow land are reduced by almost -6%, but the EU's total utilised agricultural
area (UAA) slightly increases by 1%. In the EU livestock sector, on the one hand, beef,
sheep and goat meat activities decrease both in numbers of herds and production, which
is mainly due to climate change induced decreases in grassland and fodder maize
production, the main feed for ruminant production. On the other hand, EU pork and
poultry benefit from lower feed prices, leading to production increases. In the scenario
with CO2 fertilization, decreasing area and increasing production output in the EU crop
sector indicate, on average, stronger (and more positive) EU yield changes compared to
the scenario without CO2 fertilization. However, effects on crops can be quite diverse, as
for example, EU wheat production increases by +18%, whereas grain maize production
decreases by -18%. A positive production effect is also evident in fodder activities,
mainly grassland, which show an increase in production of 11% despite a decline in area
of -8%. The net effect of the area and production developments is a drop of -5% in the
EU UAA, but also a considerable increase in area of set aside and fallow land. The EU
livestock sector benefits especially due to lower prices for animal feed.
In both scenario variants (with and without CO2 fertilization), the EU trade balance
improves for most agricultural commodities, except for beef, sheep and goat meat.
Changes in EU consumption are, in general, of relatively lower magnitude. Following the

36
changes in production, trade, prices and consumption, the effect on total agricultural
income at aggregated EU-28 level is positive in the scenario without CO2 fertilization
(+5%), whereas a decrease in total agricultural income of -16% is projected when
enhanced CO2 fertilization is considered, mainly due to the lower producer prices
obtained by farmers. However, the variance in agricultural income change is quite strong
at Member State and regional level. In the scenario without CO2 fertilization, six Member
States show a negative income development (Italy, Greece, Croatia, Malta, Slovenia,
Finland), but about 67% EU NUTS2 regions experience an income increase. Conversely,
in the scenario with enhanced CO2 fertilization, only four Member States see an income
increase (Netherlands, UK, Poland, Cyprus), whereas about 90% of the NUTS2 regions
experience a reduction of total agricultural income.
It has to be noted that the quantitative response of crop yields to elevated CO2 levels is
scientifically still very uncertain. Nevertheless, in both scenario variants the results
highlight the importance of taking market-driven adjustments into account when
analysing the total economic impacts of climate change on the agricultural sector.
Furthermore, the scenario results also underline the importance of looking beyond the
aggregated EU level. For example, taking market driven adjustments into account, total
soft wheat production declines in most regions in Southern Europe, whereas regions in
Northern France, Central Europe North and Northern Europe in particular show
production increases.
Figure 9. Absolute change (1000 t) in total soft wheat production compared to the reference scenario in 2050, for EU NUTS2 regions, and for scenarios without CO2 fertilisation (left) and with
CO2 fertilisation (right)

37
3.5 Energy
Energy demand can be largely influenced by climate change via two main ways: heating
demand can be reduced in winter as climate becomes warmer; cooling demand can also
be quite sensitive because warmer conditions will lead to higher use of air conditioning.
The dynamic analysis, using the ECFIN Ageing report socioeconomic scenario, focuses on
changes in heating and cooling demand of the residential buildings.
Impacts on heating and cooling demand
Figure 10 represents the evolution of residential heating and cooling final demand. Under
the climate change scenarios (H1 to H5, see Table 1), residential heating and cooling
energy needs are expected to be reduced by 32% compared to 2010. This is the result of
a large increase of cooling demand (more than doubling) and a larger decrease in
heating demand (by 37%). As heating demand is much higher in absolute terms than
cooling demand, total overall residential energy demand is reduced in net terms. All five
European regions see a decline in heating demand. Not surprisingly, most of the increase
in cooling demand is concentrated in countries in Southern Europe and Central-Southern
Europe, where temperatures are the warmest and where air conditioning diffusion is the
greatest.
Figure 10. European residential heating and cooling final demand (H1-5 are projectons using different climate models)
Source: JRC PESETA III, based on the POLES-JRC model (ADVANCE project version, ADVANCE wiki 2017)

38
Figure 10 also shows a "no climate change" scenario (dotted lines), with some reduction
in residential heating needs thanks to efficiency improvements (particularly insulation)
with time and despite an increase of residential areas by 58% between 2010 and 2100.
Adaptation
Another scenario was modelled in order to test the sensitivity of the system to increased
building insulation. Figure 11 shows the impact on energy demand for residential heating
and cooling with additional insulation. This adaptation measure can bring up to 40% of
additional energy savings in heating and cooling demand. Therefore, with an ambitious
building thermal insulation policy (consistent for instance with a very ambitious climate
policy), the European residential heating and cooling needs decrease by 62% by the end
of the century. Climate change would then play a smaller role than without these large
efficiency improvements (roughly a ratio of one to two).
Figure 11. Impact of better insulation on the sum of heating and cooling demand in EU (H1-5 are projectons using different climate models; “baseline” is without better insulation)
Source: JRC PESETA III, based on the POLES-JRC model (ADVANCE project version (ADVANCE wiki 2017))
The introduction of policies that improve energy efficiency through enhanced insulation is
one of many adaptation strategies that could be introduced to lessen the impact of
climate change on energy demand. Complementary adaptation options that are focussed
on improving energy efficiency may also include: improving the efficiency of air-
conditioning installations; product labelling that describes the efficiency of household

39
electrical products; the requirement for energy efficiency certificates to accompany the
sale and rental of buildings; and the introduction of financial instruments such as tax
deductions for improving building energy efficiency.
These adaptation options also provide the co-benefit of climate change mitigation
because they reduce energy consumption, and in turn reduce greenhouse gas emissions
(where the energy has been produced by the combustion of fossil fuels).
3.6 Transport
Transport infrastructures and operations are designed to be resilient to some extreme
weather events. Yet the increase in the frequency and magnitude of extreme events due
to climate change will pose a threat to the transportation sector. Five impact categories
are assessed, affecting three transport infrastructures: airports, seaports and inland
waterways. The three specific transport sectors were selected (Christodoulou and
Demirel, 2018) in order to complement the analysis of the transport sector of the
previous PESETA project, which focused on the impacts of climate change on roads and
rail (Nemry and Demirel, 2012). Three climate hazards are considered: coastal flooding,
river flooding and droughts. The five impacts are:
• Impact of coastal flooding on airports, for the whole of Europe.
• Impact of river flooding on airports, for the whole of Europe.
• Impact of coastal flooding on seaports, for the whole of Europe.
• Impact of river flooding on seaports, for the whole of Europe.
• Impact of droughts on inland waterways, for the Danube and Rhine rivers.
Impact of coastal flooding on airports
Many airports currently lie within the coastal zone in Europe, placing them at risk from
higher sea levels. Airports are generally designed to be resilient to coastal floods up to a
water depth of 1m.
However, coastal floods over 1m could adversely impact airport operations. Figure 12
represents the airports and seaports at risk for up to 1m SLR, up to 3m SLR and the total
(up to and over 3m SLR). 42 airports are projected to be at risk from coastal flooding
that is over 1m and up to 3m (difference between the up to 3m and up to 1m), by the
end of the century due to increases in sea level and extreme weather events under a
high warming scenario. An additional 8 airports are projected to be at risk of even larger
coastal floods that exceed 3m.
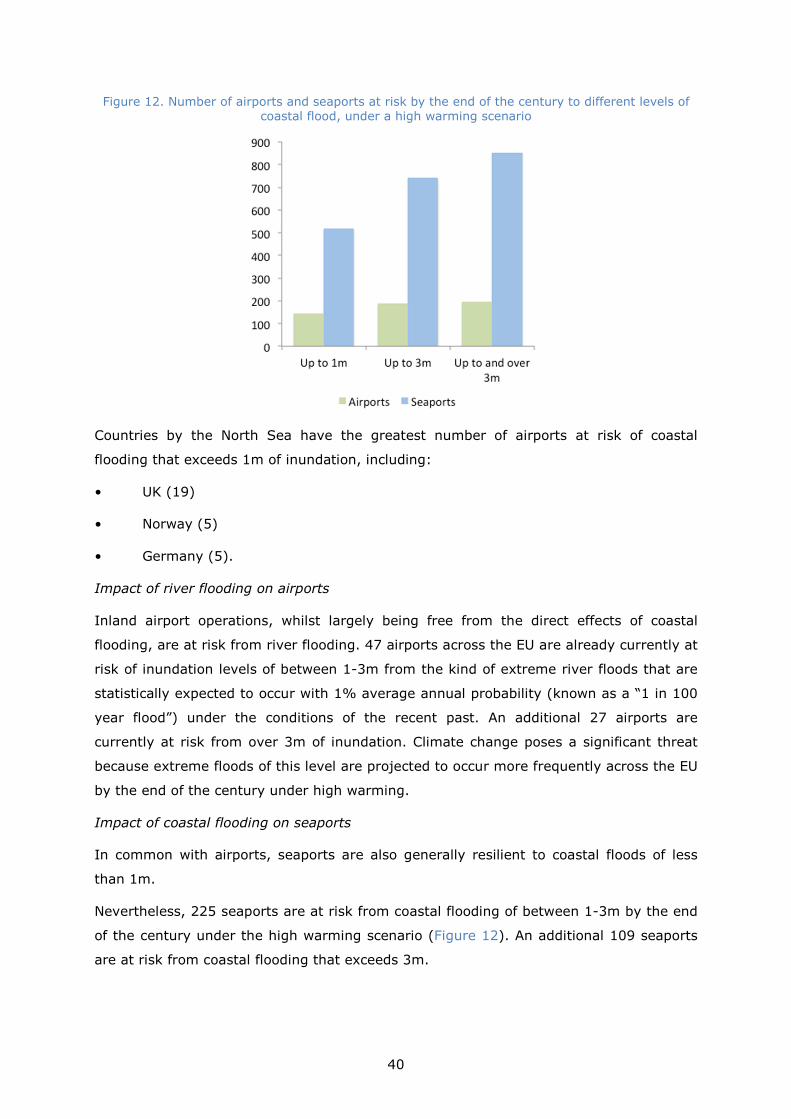
40
Figure 12. Number of airports and seaports at risk by the end of the century to different levels of coastal flood, under a high warming scenario
Countries by the North Sea have the greatest number of airports at risk of coastal
flooding that exceeds 1m of inundation, including:
• UK (19)
• Norway (5)
• Germany (5).
Impact of river flooding on airports
Inland airport operations, whilst largely being free from the direct effects of coastal
flooding, are at risk from river flooding. 47 airports across the EU are already currently at
risk of inundation levels of between 1-3m from the kind of extreme river floods that are
statistically expected to occur with 1% average annual probability (known as a “1 in 100
year flood”) under the conditions of the recent past. An additional 27 airports are
currently at risk from over 3m of inundation. Climate change poses a significant threat
because extreme floods of this level are projected to occur more frequently across the EU
by the end of the century under high warming.
Impact of coastal flooding on seaports
In common with airports, seaports are also generally resilient to coastal floods of less
than 1m.
Nevertheless, 225 seaports are at risk from coastal flooding of between 1-3m by the end
of the century under the high warming scenario (Figure 12). An additional 109 seaports
are at risk from coastal flooding that exceeds 3m.

41
Countries by the North Sea have the greatest number of seaports at risk of coastal
flooding that exceeds 1m, including:
• UK (85)
• Denmark (46)
• Norway (18)
• Germany (14).
Impact of river flooding on seaports
42 seaports are currently at risk of inundation levels of between 1-3m from a 1 in 100
year flood. An additional 42 are at risk from inundation of over 3m.
Impact of droughts on inland waterways
Droughts can severely disrupt inland navigation services by reducing water levels to the
point where navigation is impossible, or to a point where water vessels have to carry a
reduced load.
Under the high warming scenario, by the end of the century, low flow events become less
frequent at the points considered on the Danube. Fewer low flow events are also
projected for Kaub on the Rhine. In total, the Rhine and Danube inland waterway
networks are projected to operate with fewer disruptions from low water levels by the
end of the century under the high warming scenario, at least at three out of the four key
points considered.
Fewer low flow events due to climate change translate into potential economic savings in
terms of transportation costs, when compared to nowadays, because navigation is
possible more often and water vessels are not required to reduce their loads, or interrupt
their operation, as frequently (Figure 13). The range in Figure 13 corresponds to the
variability of projections from different climate models. For the majority of the cases,
savings are projected as a result of the reduction of low water days. For Ruhrort,
economic losses are projected for three out of the five model runs considered. By the end
of the century, under the high warming scenario, marginal average annual losses of €5
million are estimated for Ruhrort on Rhine, while the average annual savings at Kaub are
€45 million. Freight activity is significantly lower on the Danube and the savings here are
at around €5 and €7 million for Hofkirchen and Wildungsmauer, respectively.

42
Figure 13. Average annual savings (costs are negative) due to fewer low flow river events, under high warming at end of the century (range is due to using climate projections from different
climate models)
Adaptation
Adaptation strategies should be incorporated in the design or upgrade of coastal
transport infrastructure.
Adaptation strategies for airports and seaports may include protection of infrastructure
with dykes and levees, or elevation of critical infrastructure.
For inland waterways adaptation measures may include:
• improving forecasts of water levels and discharge;
• improving vessel carrying loads, such as through the development of lightweight
structures, small vessels and vessels with flat hulls; and
• improving logistics and governance of inland waterways, such as by creating
strategic alliances between inland waterway authorities and other modes of
transport to improve the seamlessness of the supply chain during low flow days.
-100
-50
0
50
100
150
200
An
nu
al
sav
ing
s (€
mil
lio
n)
Range
Average

43
3.7 Water resources
Average flows, low flows and groundwater
The annual median river discharge shows an increase in most parts of Europe, except for
the Mediterranean area where a decrease in flow is projected in all four seasons. A
North-South pattern emerges as regards low flows and groundwater. Declines in low
flows up to 30% are projected under a 2°C warming scenario for the Southern Europe
region (except Bulgaria), annually and for each season. During the summer months the
declines are severe, exceeding 30% of current summer flows. In Northern Europe and
NorthEastern Europe, however, increases in low flows are projected annually and for
each season.
The pattern of change in low flows across Europe is associated with a similar pattern in
soil moisture drought.
The declines in low flow magnitudes may impact on cooling water intake for industrial
and energy production activities, irrigation water availability, critical environmental flow
conditions, as well as hydropower potential. For example, with a 2ºC global warming,
projections show a 4% decrease of hydropower annual inflow for South-West Europe, i.e.
Spain, Portugal, Southern France and Northern Italy. In a RCP 8.5 scenario, projections
are more extreme, with a 12% decrease in hydropower inflow in Spain and Portugal and
a 10% decrease in Greece and the Balkans. Equally, as regards cooling water availability,
the decrease of low flows in South-West Europe might lead to cooling water availability
issues for thermal power stations, compounded by the higher temperature of the water
as a result of global and regional warming.
A North-South divide is also evident for changes in groundwater (Figure 14), with a
decrease in groundwater resources for countries in Southern Europe, and an increase for
countries north of this region. Further over-abstraction of groundwater in Southern
European countries, beyond renewable capacity, could lead to critical deep groundwater
levels and increased pumping costs to extract the water for use at the surface.

44
Figure 14 Changes in annual groundwater recharge under a 2°C scenario
Source: ensemble of the 11 Euro-Cordex runs, LISFLOOD model.
A North-South pattern of change also exists for “ecological flows”, an indicator of the
average number of days per year that minimum flow conditions are not reached. Spain
and Portugal in particular, face increased low flow conditions, where the number of days
with inadequate flow may increase by over 40% from present.
Water Exploitation Index
The Water Exploitation Index (WEI+) is the ratio of net water consumption in a region
and the available water resources. The available water resources are computed as annual
renewal groundwater, annual renewable surface water (water in lakes, reservoirs and
rivers) and water inflowing from upstream areas (for example Rhine inflow in the
Netherlands from Germany) This metric is calculated for each individual month, and then
averaged over a longer period. Values close to one indicate that the amount of net local
water consumption is close to the overall available amount of freshwater. WEI+ values
above 0.4 are regions with severe water scarcity. Areas above WEI+ 0.3 are water
stressed, at least for some parts of the year. Values below 0.2 indicate no severe issues.
According to this index, net water consumption in some parts of Europe is already
unsustainable (Figure 15).
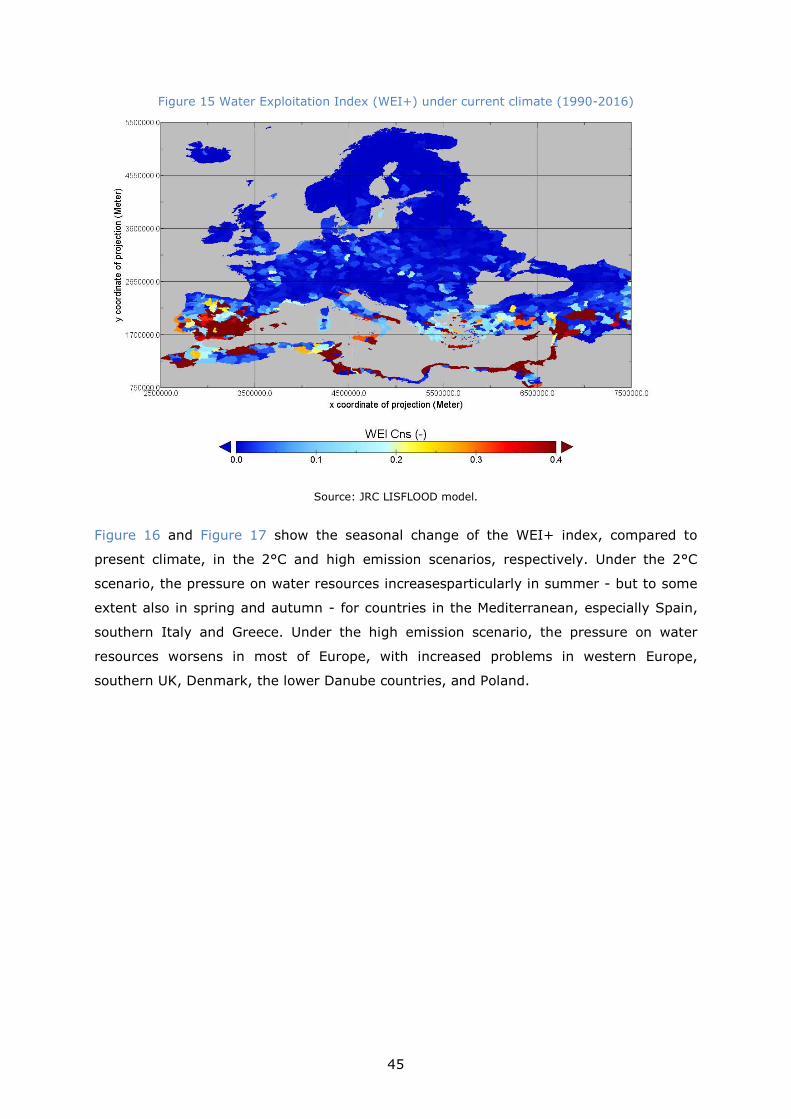
45
Figure 15 Water Exploitation Index (WEI+) under current climate (1990-2016)
Source: JRC LISFLOOD model.
Figure 16 and Figure 17 show the seasonal change of the WEI+ index, compared to
present climate, in the 2°C and high emission scenarios, respectively. Under the 2°C
scenario, the pressure on water resources increasesparticularly in summer - but to some
extent also in spring and autumn - for countries in the Mediterranean, especially Spain,
southern Italy and Greece. Under the high emission scenario, the pressure on water
resources worsens in most of Europe, with increased problems in western Europe,
southern UK, Denmark, the lower Danube countries, and Poland.
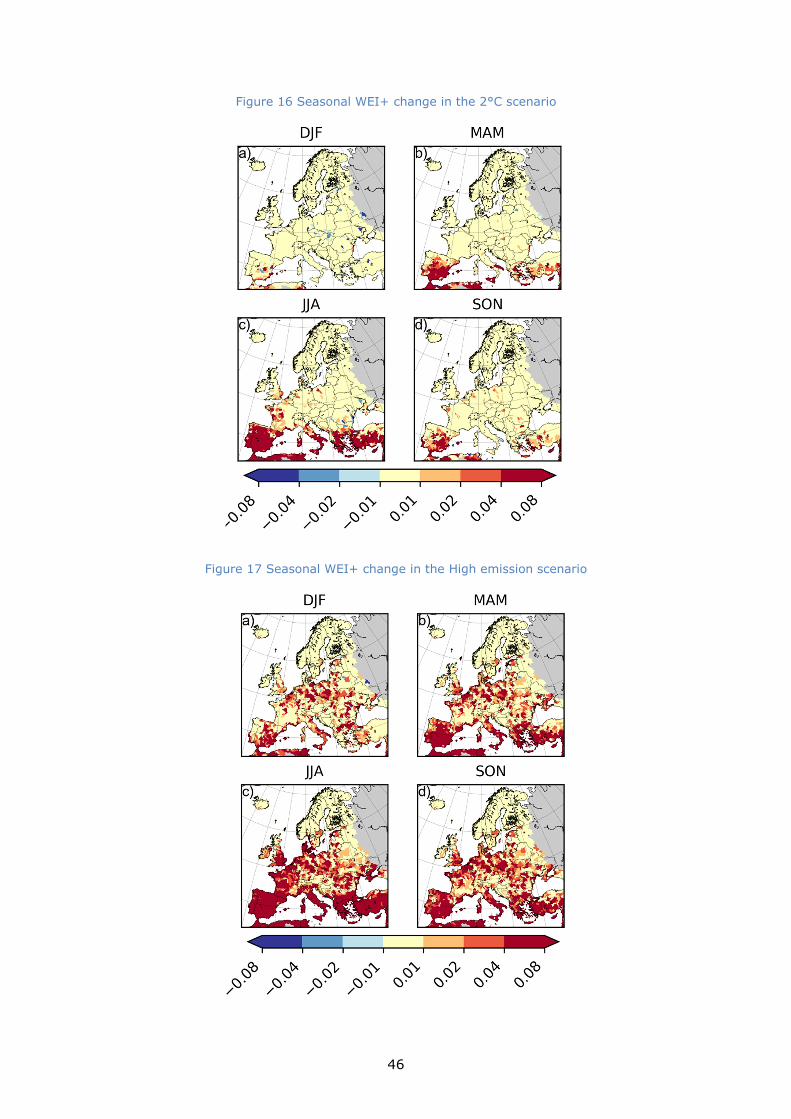
46
Figure 16 Seasonal WEI+ change in the 2°C scenario
Figure 17 Seasonal WEI+ change in the High emission scenario

47
Adaptation
The severity of some of the projected changes in extreme river flows and water
availability presented here, under a high emissions scenario, suggests that various
adaptation mechanisms will be needed to lessen the effects of climate change on
European water resources, even under a 2°C increase.
Large increases in projected water exploitation calls for water efficiency measures,
especially in the Mediterranean region. Projected increases in water dependency
(dependencies of regions on upstream inflowing freshwater to fulfil local water demand)
for some regions calls for sustained water diplomacy between countries as well as
international multi-member-state management of river basin water resources. In Europe,
this is already foreseen under the Water Framework Directive and the Flood Risk
Management Directive.
A number of planned adaptation strategies could be targeted at irrigation practices to
lower pressures on water resources. Water pricing for irrigation water, as well as for
industrial water, and in some areas also for public water, could create an incentive for
users to consider water savings. Irrigation efficiency could be increased by changing
irrigation methods (e.g. from sprinkling to drip irrigation). The EU Member States plan
investments to increase irrigation efficiency, but this is likely more effective when
irrigation water has a price. First results using planned Member States investments on
irrigation efficiency improvement suggest that those investments do show improvements
of water scarcity under current climate, but that 2°C climate change causes much more
scarcity than the water savings obtained with the investments.
Deficit irrigation ia another adaptation strategy that can be applied by different types of
irrigation application methods. The correct application of deficit irrigation requires
thorough understanding of the yield response to water (crop sensitivity to drought
stress) and of the economic impact of reductions in harvest. Water re-use might also be
considered to assist meeting the demand for irrigation water. This is planned already in
Spain.
Green cities (green roofs, parks) may lead to increased evapotranspiration in cities, and
delay the generation of runoff, leading to a reduction in (flash) flooding in urban areas.
But since especially Central European cities may experience more urban runoff under
climate change scenarios, urban greening measures should take this increased urban
runoff into account.
Other options might focus on delivering more efficient cooling technologies that lead to a
reduction in water use for producing energy. In addition, shifts from conventional energy

48
production (coal) to renewable energy production could reduce cooling water demand
and net consumption.
3.8 Habitat loss
The Mediterranean region is home to almost half of the plant and animal species, and
more than half of the habitats, listed in the EU Habitats Directive. However, this reservoir
of biodiversity is threatened by climate-driven habitat loss because the present
Mediterranean climate zone is projected to become smaller due to the expansion of arid
zones. In addition, the Mediterranean climatic domain is also projected to expand over
temperate oceanic areas, where drier summers and warmer temperatures suggest
increased ecosystem disturbances. These “new” Mediterranean areas could provide
opportunities for range expansion of Mediterranean species if habitat quality and biotic
interactions allow establishment. Nevertheless, changes in ecosystems are subject to
significant uncertainty and could take centuries before the new plant and animal species
assemblages are in equilibrium. Existing protected sites, along with natural and semi-
natural areas that are projected to remain in the Mediterranean zone, are critical for
adaptation and biodiversity conservation.
Change in the extent of the Mediterranean climate zone
The present Mediterranean climate zone may contract by 16% by the end of the century
under a high warming scenario and without adaptation (Figure 18). The magnitude of
this contraction (157,000 km2) is equivalent in area to around half of Italy. The zone is
projected to contract around central and southern parts of the Iberian Peninsula,
southern Italy and Sicily, southern and north-eastern Greece and Crete, Cyprus, and
parts of southern Turkey. Only 71% of the present area of the Mediterranean zone will
remain stable.
An expansion (“new” Mediterranean areas) representing 50% of the present extent of the
Mediterranean domain is projected to occur mostly over temperate oceanic areas under
the high emissions scenario. In these areas, a warmer and drier climate suggests
increased fires, droughts, pests and invasive alien species. Additionally, new
assemblages of plant and animal species could evolve altering biotic interactions, that in
turn could disrupt ecosystem and trophic interactions, thus creating transient and non-
analogue communities dominated by generalist species providing reduced ecosystem
services.
Change in the extent of the arid climate zone
Expansion of the arid zone is the cause for contraction of the Mediterranean zone. The
arid zone is projected to increase to more than twice its current extent – an expansion

49
that is equivalent to three times the size of Greece (Figure 18). A conversion of this
magnitude will lead to a decrease of biodiversity due to the migration and extirpation
(local extinction) of Mediterranean species that are unable to cope with the magnitude of
habitat change.
Limiting global warming to 2°C (assuming no adaptation) could see less contraction and
greater stability of the Mediterranean zone, and significantly less expansion of the arid
zone, compared to the high warming scenario. 91% of the present Mediterranean zone
remains stable under the 2°C scenario – this compares to only 71% with high warming
(Figure 18). Climate change mitigation also significantly reduces expansion of the arid
climate zone. Under the 2°C scenario the arid zone increases in area by 14% from
present. This compares to a 128% increase under high warming.
Figure 18. Projected changes in the extent of the Mediterranean and arid climate zones respectively, assuming no adaptation, under two scenarios: high warming by the end of the
century, and under the 2°C scenario
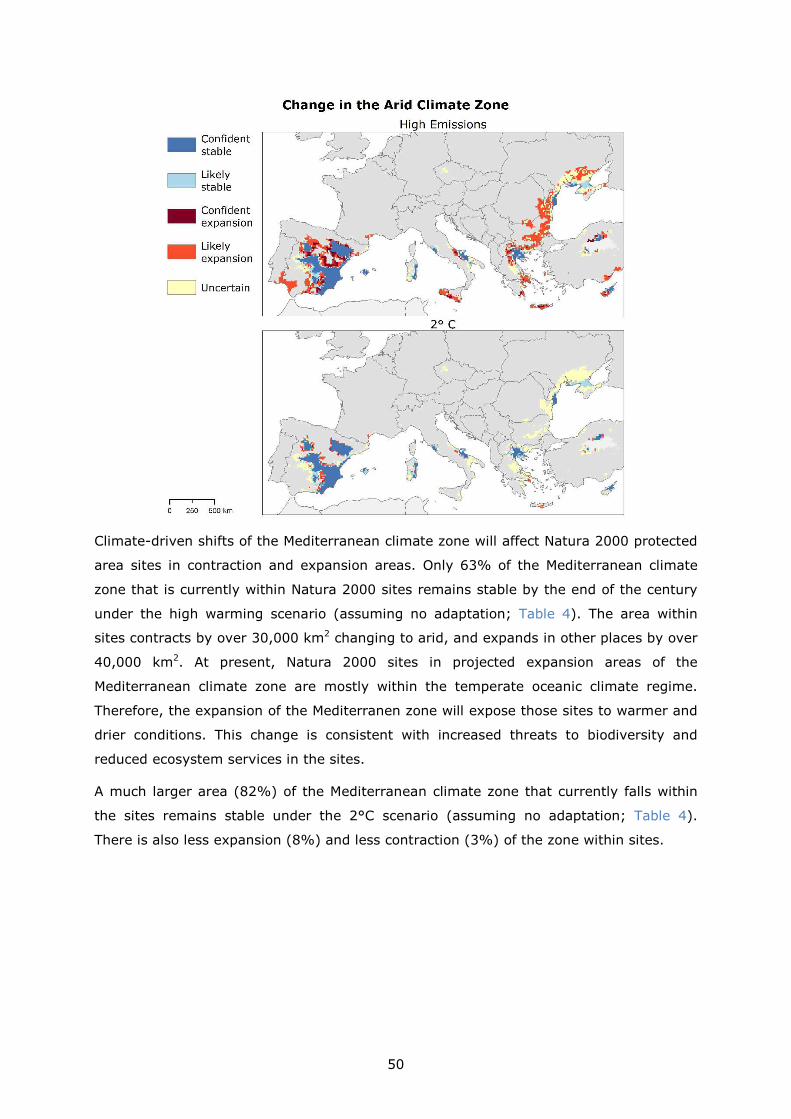
50
Climate-driven shifts of the Mediterranean climate zone will affect Natura 2000 protected
area sites in contraction and expansion areas. Only 63% of the Mediterranean climate
zone that is currently within Natura 2000 sites remains stable by the end of the century
under the high warming scenario (assuming no adaptation; Table 4). The area within
sites contracts by over 30,000 km2 changing to arid, and expands in other places by over
40,000 km2. At present, Natura 2000 sites in projected expansion areas of the
Mediterranean climate zone are mostly within the temperate oceanic climate regime.
Therefore, the expansion of the Mediterranen zone will expose those sites to warmer and
drier conditions. This change is consistent with increased threats to biodiversity and
reduced ecosystem services in the sites.
A much larger area (82%) of the Mediterranean climate zone that currently falls within
the sites remains stable under the 2°C scenario (assuming no adaptation; Table 4).
There is also less expansion (8%) and less contraction (3%) of the zone within sites.

51
Table 4. The proportion of the area, and area, of Natura 2000 sites currently within the Mediterranean zone, which are at least likely (i.e. likely as well as confident) to be stable, contract or expand due to climate change
Proportion (%) Area (km2)
high warming 2°C high warming 2°C
Stable 63% 85% 106,000 144,000
Contraction 20% 3% 32,000 6,000
Expansion 23% 8% 40,000 15,000
Adaptation
Target areas for adaptation are identified in Figure 19, which shows existing Natura 2000
sites as well as natural and semi-natural areas where the Mediterranean zone is
preserved under the high warming scenario by the end of the century. Both areas are
considered critical for biodiversity conservation.
The natural and semi-natural areas, not included in the Natura 2000 network, are
important features that can contribute to autonomous adaptation because of their
potential role as corridors and stepping-stones that can facilitate migration of species, as
well as acting as refugia.
In addition, these areas could facilitate some of the planned adaptation measures
identified by the European Commission for Natura 2000 sites, such as establishment of
new protected areas for increasing network coherence, implementation of buffer zones
around Natura 2000 sites, and creating corridors between Natura 2000 sites.
Figure 19. Existing Natura 2000 sites (light yellow) mapped against natural and semi-natural areas (green) where the Mediterranean zone is preserved under the high warming scenario by the end of
the century

52
3.9 Forest fires
Forests cover around 33% of the total land area (around 215 million hectares) in Europe
(Forest Europe, 2015). In the last decades, large forest fires have occurred in Europe, in
particular in the Mediterranean countries. The danger of forest fires will increase with
unmitigated climate change.
Several factors contribute to forest fire occurrence, such as the moisture content of fine
fuels on the ground’s surface, as well as of larger materials on the ground such as pieces
of wood. A wetter surface can lower the potential spreading of a fire, and also the ease of
ignition. Climate variables like wind speed are also important because they can affect the
rate at which a fire might spread following ignition.
A factor particularly linked with extreme weather (prolonged droughts and dry spells) is
the amount of moisture in thick wooden fuels and other organic matter on the ground.
The drying of these fuels is highly correlated with the intensity of wildfires. The pattern of
fuel moisture in these fuels, as estimated by the Drought Code (DC), which is one of the
components of the Fire Weather Index used in this study, is presented in Figure 20. The
increase of dry areas in brown is noticeable on this figure as we move from the present
to the 2 °C and high emission scenarios. In all the cases, the lowest moisture levels are
observed around the Mediterranean, in southern Spain, southern Portugal, southern
Italy, Greece and Turkey. Moisture levels generally increase moving northwards from this
region.
Figure 20. Moisture content of thick wooden fuels as estimated by the Drought Code (highly correlated with fire intensity) in the present and under two climate change scenarios
Note: The dark blue lines mark the boundaries between areas with similar orders of magnitude on the logarithmic scale (10, 100, 1000). Median values across five climate
models.

53
Vegetation Moisture
Climate change enlarges the current north-south differences in the moisture levels of
thick woodend fuels, leaves and other organic matter on the ground. The wooden fuels
become drier than in the present around the Mediterranean region, under both a high
warming scenario and a 2°C scenario – this raises the danger and intensity of forest
fires. Furthermore, areas exhibiting low fuel moisture extend further northwards from the
Mediterranean than in the present. The present area of high fuel moisture surrounding
the Alps decreases in size with climate change.
Although the declines in fuel moisture for Mediterranean countries are smaller with
mitigation that limits global warming to 2°C, relative to the high warming scenario, the
moisture levels are still lower than in present.
Danger
By combining fuel moisture levels with the other factors that contribute to the danger of
forest fires, it is possible to estimate the magnitude and spatial pattern of forest fire
danger across all of Europe (Figure 21).
Whilst there is some uncertainty in the magnitude of the effect of climate change, it is
clear that the danger of forest fires increases with climate change around the
Mediterranean. The three countries with the highest danger remain Portugal, Spain and
Turkey.

54
Figure 21. Forest fire danger estimated by the Fire Weather Index in the present, and under two climate change scenarios, according to two different climate models (H3, H5); these are selected to
demonstrate the effect of using different climate models
Note: The dark blue lines mark the boundaries between areas with similar values in increments of 15 units.
Areas at moderate danger from forest fires, as estimated by the Fire Weather Index, are
pushed north by climate change, up to Central Europe. There is relatively little change in
fire danger due to climate change across Northern Europe.
Adaptation
Even with mitigation, in the Mediterranean region, the danger of forest fires increases
relative to present due to climate change. This suggests that effective climate change
adaptation strategies will be crucial to lessening the detrimental impacts of climate
change on forest fires, and the reductions in biomass and biodiversity that they can
cause.
JRC PESETA III did not explicitly model adaptation scenarios for forest fire danger.
However, the literature review performed in JRC PESETA III (de Rigo et al., 2017)
indicates that key strategies to reduce the likelihood of severe fires and mitigate fire
hazard include vegetation management to lessen the spatial continuity of fuels and fuel
reduction to decrease the intensity of wildfires. Strategies to reduce fuels may include:
forest thinning; removal of shrubs and other understory vegetation; prescribed burning;
and the use of animal grazing. Additionally, the review suggests that multiple-species

55
and multi-aged forests may be less susceptible to severe wildfires than monocultures
(single species) and plantations (coetaneous forests).
Lastly, although highly relevant, is the need to adopt mitigation measures to reduce the
number of fire ignitions, taking into account that over 95% of the wildfire ignitions are
human-caused. Education, awareness raising and fire prevention campaigns are thus
essential.
3.10 Labour productivity
As the temperature and humidity of the surrounding environment increases, the human
body reacts by increasing blood flow to the surface of the skin and by sweating, in order
to control the internal body temperature. The level of thermal comfort decreases and it
can become more difficult to perform physical and cognitive tasks. In turn, labour
productivity starts to decline.
Heat stress occurs when the body’s attempts to control its internal temperature start to
fail. In extreme cases this can lead to death. Many studies have shown that labour
productivity starts to decline above a temperature threshold of around 25°C. Therefore
the higher temperatures projected with climate change poses a risk to labour
productivity. This assessment focuses on how much outdoor labour productivity would
change due to climate change.
Impacts under the high emission scenario
Under a high warming scenario and assuming no adaptation, daily average outdoor
labour productivity could decline by 3.4% in the EU, with large variation across the EU: in
Southern Europe a reduction up to 17% by the end of the century (Figure 22) and in
Northern Europe by up to 4%.

56
Figure 22. Regional differences from present (%) in daily average outdoor labour productivity due to climate change under a high warming scenario and a 2°C scenario respectively
The majority of outdoor workers affected would be in the agriculture and construction
sectors.
Indoor workers will also be affected by climate change but the impacts are generally 2-4
percentage points lower than for impacts on outdoor labour productivity.
Impacts under the 2°C scenario
A substantial proportion of impacts on labour productivity could be avoided by remaining
within a 2°C scenario, with a change of EU labour productivity of -0.4%, even with no
adaptation. The greatest benefits would be for Southern Europe (Figure 22). The impacts
could be up to 10 percentage points lower under the 2°C scenario than under high
warming. Furthermore, the range in impacts is smaller for the 2°C scenario than the high
warming scenario.
Adaptation
Whilst mitigation has the potential to lessen impacts, adaptation, either planned or
autonomous (or a combination of both), will be required to tackle decreasing outdoor
labour productivity.
There are various ways in which adaptation may take place, including:
• workers taking more frequent and longer breaks during the hottest parts of the
day;
• implementing irregular working hours to enable earlier starts and/or later ends to
the working day; and
• including night working for some workers in certain sectors and organisations.

57
21% of workers in Europe are already employed in jobs with irregular hours that include
night and early morning shifts but an important question is by how much this proportion
could realistically and safely be increased, particularly in Southern Europe, where the
largest declines in labour productivity are projected.
Furthermore, increasing the proportion of the labour force engaged in working irregular
hours, particularly at night, could mean additional costs, which could offset the possible
gains in productivity achieved from it.
3.11 Mortality due to heatwaves
Forzieri et al. (2017) assess the risk of weather-related hazards to the European
population in terms of annual numbers of deaths, with specific results regarding
heatwaves. The heatwave results have been integrated into the JRC PESETA III study.
They consider the impact due to climate change and population dynamics, and find that
climate change represents approximately 90% of the overall impact. The results refer to
the SRES A1B emissions scenario. The ensemble mean of the 2071-2100 period is
assumed comparable to the high warming scenario of JRC PESETA III and the 2040
value (average of the 2011-2040 and 2041-2070 periods) to the 2°C warming scenario.
The Forzieri et al. (2017) study also assumes constant vulnerability, i.e. no additional
adaptation measures are taken to reduce the heatwave impact or enhance human
acclimatization to future extreme climate conditions.
Table 5 represents the estimated mortality due to heatwaves per year in the various
scenarios: present period (1981-2010) and the 2°C and high warming scenarios; the
figures of the 2°C and high warming scenarios are relative to that of the present period.
Under the high warming scenario, mortality largely increases (a factor 50 rise) compared
to the present period, with around 132,000 additional deaths in the EU. Most of the
absolute increase could occur in Southern Europe and the Central Europe South regions.
Table 5. Impact on mortality due to heatwaves
Northern
Europe
UK &
Ireland
Central
Europe
North
Central
Europe
South
Southern
Europe EU
Present 5 95 472 756 1,364 2,692
2°C warming - control 46 978 4,407 13,906 38,336 57,674
High warming - control 113 3,498 11,079 35,997 81,462 132,150
Units: deaths/year
Source: Forzieri et al. (2017)

58
The 2°C scenario mortality change is smaller than that of the high warming scenario,
with around 58,000 deaths, a factor 20 rise compared to the present period. The regional
pattern of mortality increase is similar to that of the high warming scenario, with most of
the increase occurring in Southern Europe and the Central Europe South regions.
The number of deaths is considered as damage to the welfare of the population, and it is
not integrated into the CGE economic model. This damage is calculated instead by using
the value of statistical life (VSL) method; the welfare loss is the number of premature
deaths times the VSL; the assumed VSL is 1.14 million euro/person (2007 Euro; same
value for all member states), as in the JRC PESETA II study, the low-end of the range of
estimates considered in the review of the European Clean Air Policy Package (European
Commission, 2013; Holland, 2014).

59
4 Economic results
This section presents an overview of the economic dimension of climate impacts (see
Szewczyk et al. 2018), considering the impacts that can be consistently integrated into
the economic model (agriculture, energy, labour productivity, river floods and coastal
floods). The agriculture results come from the ISIMIP study, as analysed in the HELIX
FP7 project by JRC. The additional mortality due to heatwaves is also included, as
mortality appeared to be the most significant impact in the PESETA II project. The
mortality economic calculations were done separately from the CGE model.
Even if the economic analysis gives the impression of homogeneity the reader should
note that the input to the economic model is a diverse and heterogeneous set of climate
impacts, and that the relative comparability is also reached via a set of implicit
assumptions that can influence the aggregation of sectoral results.
Incomplete perspective of welfare effects
Figure 23 shows the welfare losses (as percentage of GDP) for the six sectoral impacts in
the five European regions and the EU in both the high warming and the 2oC scenarios.
The EU welfare loss under the high warming scenario is estimated to be around 1.9% of
GDP (€240 bn) and could be reduced by approximately 2/3 in the 2oC scenario (€79 bn).
It is important to note that while Figure 23 provides a good general overview, it can also
offer a misleading perspective of the EU climate damages because the list of considered
climate impacts is incomplete. The economic climate impacts can be classified into three
types: known-knowns, known-unknowns and unknown-unknowns. The impacts of Figure
23 represent the known-knowns. Some of the PESETA climate impacts, however, have
not been integrated into the economic framework (e.g. habitat losses) and, notably,
other climate impacts are not integrated into the PESETA study like possible impacts due
to ecosystem services losses - those represent the known-unknowns type: it is known
that the impacts exist but their economic implication are unknown. Finally, there might
be the unknown-unknowns, such as climate phenomena not considered (e.g. unknown
catastrophic consequences of climate tipping points, e.g. Gosling 2013) or unknown
relationships between climate and the economy. Therefore, the sum of impacts
represented in Figure 23 must not be considered as the total economic cost of the
specific climate change scenarios.
Another caveat relates to the inclusion of health impacts in Figure 23. The welfare losses
of the other five climate impacts are derived from the economic model, so it seems
appropriate to compare those welfare losses with GDP. On the contrary, the health
welfare losses are valued through the VSL (Value of Statistical Life), which is not a
market effect and, therefore, its comparison with GDP is limited.

60
Figure 23. Welfare losses (% of GDP) for the high warming scenario and 2°C
The North-South divide
Figure 24 represents the relative geographical distribution of climate damages; in the
figure the region with the lowest net welfare damage (as a share of GDP), Northern
Europe, has an index of one. The regional distribution of the welfare losses is highly
asymmetric, showing a clear North-South divide in the geography of climate impacts in
Europe: the southern Europe regions are much more affected than the rest of Europe, by
a factor of five (Central Europe South region) to eight (Southern Europe region).
Figure 24. The North-South divide for the high warming scenario
Note: Welfare impact (% GDP) in Northern Europe = 1

61
Figure 25 shows the relative importance of the climate impacts across the EU regions.
Health impacts are not represented because they might distort the relative scale of the
other five impacts. As one moves south impacts appear to be higher as a share of GDP;
the previous conclusion of the North-South divide is confirmed for agriculture, labour
productivity and river floods, but not for coastal damages, which are relatively higher in
Northern Europe and UK & Ireland, and the energy impacts, with a net positive effect in
all regions. The EU region with the highest welfare losses under the high warming
scenario would be Southern Europe.
Figure 25. The geography of impacts for the high warming scenario (without health impacts)
Avoided climate impacts with the 2oC scenario
The extent to which climate impacts are avoided under the 2oC scenario is represented in
Figure 26 (without neither the health impacts nor the positive impacts). The size of the
pies is proportional to the net total welfare loss (€13bn for the 2oC scenario and €90bn
for the high warming scenario).

62
Figure 26. Distribution of climate impacts (without health) under the 2oC scenario (left) and high warming scenario (right)
The ranking of sectoral climate damages under the high warming scenario are, in order of importance, coastal areas, labour productivity,
agriculture and river flooding. All the sectoral welfare losses would be substantially lower under the 2oC scenario.
Transboundary effects from the rest of the world
The transboundary or spillover effects relate to climate impacts occurring outside of the EU regions affecting the EU via international
trade. Those effects are estimated for agriculture, labour productivity, energy and river flooding. The global transboundary effect in terms
of GDP is represented in Figure 27 while Figure 28 shows the transboundary effects in welfare terms.

63
Figure 27. Geography of global transboundary effects in GDP terms (bn €)
Figure 28. Geography of global transboundary effects in welfare terms (bn €)

64
With the GDP metrics the sum of the additional effects is around 40% of the EU impact,
while with the welfare metrics the additional welfare loss is estimated to be around 20%
of the EU impact. The magnitude of the transboundary effect depends on two aspects:
the severity of climate impacts in the rest of the world regions and the intensity of trade
between the regions and the EU. Most of the EU transboundary effects originate in either
the Americas or Asia.
With respect to the sector of climate impact, about half of the GDP transboundary effects
to the EU are due to agricultural crops, which mainly affect Central and Southern EU
regions. Another one-third of the transboundary–induced welfare loss originates in the
labour productivity reduction, affecting mainly Central North Europe.

65
5 Limitations
It is important to note a number of limitations of the assessment, which should be taken
into account when interpreting the results. First of all, the coverage of climate impacts is
incomplete, as potentially significant effects have not been considered in this climate
impact assessment. That is notably the case, for instance, of climate catastrophes
(climate tipping points, e.g. Lenton et al. 2008), the climate impacts on natural
ecosystems (e.g. Gosling 2013), the effects of climate change on international migration
(Missirian and Schlenker, 2017) or air pollution co-benefits of climate policy (e.g. Kitous
et al. 2017). The reason why the coverage is insufficient is methodological: those
impacts cannot be quantified yet in a reliable way due to the existing data limitations and
the challenging complexity of the processes involved.
That limitation implies that one cannot derive definitive conclusions about the entirety of
the benefits of climate mitigation (the difference of impacts between the high warming
scenario and the 2oC scenario) from this study, as the study covers a limited set of
impacts, and for some of them data and/or assumptions may need further refinement.
Hence one should be cautious in interpreting exactly in quantitative terms the benefits of
climate policy as the difference of impacts between the high warming scenario and the
2oC scenario.
A second set of limitations stems from the many sources of uncertainties involved in
climate impact and adaptation assessments, the so-called cascade of uncertainties,
following the three steps of the PESETA analytical framework: the climate modelling, the
impact modelling and the economic assessment. For instance, only one biophysical
impact model has been used for each impact area. However, different models can
produce different results due, for example, to different assumptions or model equations
that intend to quantitatively capture complex biophysical processes. There is currently a
large literature comparing models e.g. the AgMIP (https://www.agmip.org/) and ISIMIP
(https://www.isimip.org/, Frieler et al., 2017) projects.
The impact results can give the impression of precision about the scale of future climate
impacts. Yet the results are subject to a high degree of uncertainty that should be
considered in the interpretation and use of the results.
Most of the value of this project indeed relies on the bottom-up, detailed impact
analyses, which have a relatively high spatial and temporal resolution. Some of this detail
and richness is diluted with the economic integration phase. In that respect, the
economic analysis of climate impacts deserves special consideration. The economic
integrative approach intends to make somehow comparable fundamentally
heterogeneous impacts, in an attempt to provide some consistency. However, as the

66
economic models work at the country level, all the richness in terms of time-spatial
aggregation are in a way lost in the economic translation of the consequences. The
information losses when interpreting economic results at the country level does also
happen when aggregating to the EU-level. The EU economic aggregate figures of
economic losses remarkably hide a wide geographical and sectoral variability, information
which is actually essential for adaptation policies.
Therefore, it should be underlined that a substantial part of the richness of the results of
the JRC PESETA III study relies on the bottom-up impact dimensions (even without
accompanying economic figures). On the other hand, the economic assessment chapter
is by no means a comprehensive, all-encompassing synthesis of the diverse range of
impacts, since some of them cannot be quantified economically.
Beyond these methodological aspects, a fundamental issue when analysing impacts and
adaptation climate policy is the characterisation and nature of specific adaptation
measures. When addressing climate change impacts, there are difficulties in properly
modelling sectoral adaptation. Some impact models assume a certain degree of
autonomous or private adaptation (at the individual level) and only few of them can
explore how public adaptation could reduce the climate damages. A broader and more
detailed simulation of the various adaptation options (both private and public) at the
sectoral level and appropriate geographical resolution (local and regional), assessing
their costs and benefits would be very useful for designing adaptation policies, and is,
undoubtedly, one of the top priorities to improve the analysis presented in this report.

67
6 Further research
From the policymaking standpoint, much more research is needed. Climate change is
already happening and adaptation can potentially reduce its costs (negative climate
effects) and reinforce its benefits (positive climate impacts). The main difficulty with
adaptation research is its multidisciplinary nature: it encompasses complex scientific and
policy areas like agriculture (with a large regulatory framework in Europe and other
developed countries) and water, therefore the need to streamline adaptation policy.
There is also the social dimension of climate impacts as they appear to be highly
asymmetric spatially. Little is known yet regarding the implications of climate change for
the most vulnerable social groups. In this context, climate change adaptation policy
would be informed not only by paying attention to the cost-efficiency of the measures
analysed, but also to consider the equity and re-distributional aspects of climate change
impacts and the potential adaptation measures to be implemented.
The scope of climate impact and adaptation studies should be enlarged along several
directions: enrich their spatial resolution (going local and regional), better understand
the role of extreme events (several impact models mainly focus on gradual climate
change, i.e. not considering the existence of thresholds beyond which impacts become
non-linear), include the difficult to model climate impact areas (e.g. natural ecosystems,
climate catastrophes, migration - Missirian and Schlenker 2017) and further integrate the
various impact models (e.g. the land-water-energy nexus), moving towards an
integrated assessment modelling setting (e.g. http://www.globalchange.umd.edu/iamc/).
At a more technical level, there have been some specific issues pinpointed by the JRC
PESETA III work for improvements to be undertaken in the future, discussed in what
follows. With respect to further work on climate projections, since high spatial resolution
projections are becoming more and more frequent, with convection-scale (5 km or less)
runs expected to be available in the near future, the availability of high resolution
spatially and temporally homogeneous observational data sets becomes of fundamental
importance. Better integration at European level of these observational data sets is
expected to improve homogeneity.
Also in this context, as some impact models need a large set of meteorological variables,
besides temperature and precipitation, such as wind speed, solar radiation or relative
humidity, it has been suggested to investigate the feasibility of bias-adjusting these
variables preserving, at the same time, the temporal day-by-day correlation with e.g.
temperature.
From the coastal impacts study, in order to avoid underestimation of risks, several
strategies for further work have been proposed. First of all to reconsider potentially

68
higher relative sea level rise (RSLR). Recent findings imply that RSLR can exceed the
presently considered range (DeConto and Pollard, 2016; Hinkel et al., 2015), rendering
the present projections on the conservative side. Second, there is a need to consider
processes that lead to impacts such as dyke failure and coastal erosion, which still
remains a challenge given the complex processes as well as temporal and spatial scales
involved. Finally, another challenging research area is the assessment of compound
flooding events driven by joint, river and coastal flooding (not considered in the present
study).
For impacts caused by riverine floods, in order to include the impact due to flash floods
and surface water flooding (not accounted for in JRC PESETA III), geographical and
climate data with higher resolution would be required. In addition, the evaluation of
adaptation measures should consider cost-benefit analyses, in order to identify most
effective measures, and possibly include important physical and social processes, such as
the probability of failure of flood protections (Zurich 2014) and maladaptation effects
such as the “levee effect” (Di Baldassarre et al, 2015).
Regarding the drought modelling activities, quantification of the impacts related to
drought is still a pending issue due to the absence of simple-to-derive structural impacts
and the creeping evolution of the phenomenon. The outcomes of JRC PESETA III have
helped to highlight the areas that will likely be more affected by an increase of drought
risk in the future, which is the starting point for an estimation of the drought damages.
Present drought impact records can be used to reconstruct the cause-effect relationship
between drought occurrence and impacts, in order to evaluate spatial variations in future
impacts.
In the ago-economic modelling work, specific extreme weather events could not be
considered yet for JRC PESETA III, as this aspect was still in an exploratory stage and no
robust yield estimates could be produced. Therefore, follow-up work has been suggested
to assess the agro-economic impacts of some specific extreme weather events such as
heat waves and over-wet conditions. Further development is also needed to improve the
representation of the CO2 effects and to model besides yield also quality and nutritional
aspects. Future agro-economic analysis should also try to improve the consistency
between EU and non-EU biophysical modelling input. Moreover, in this study, adaptation
to climate change has been based on the autonomous adjustment of the regional
agricultural production portfolio and intensities. Further work could assess technical
possibilities for adaptation, like for example the use of new and different crop varieties or
a switch from rain-fed to irrigated agriculture in a region for which irrigation plays no role
in the reference scenario. Apart from adaptation, also specific approaches for the
mitigation of climate change could be analysed – which could also help to highlight

69
possible synergies between adaptation and mitigation in the agricultural sector.
Furthermore, future work could consider how payments of the EU's Common Agricultural
Policy (CAP) could be used to support and ease agricultural adaptation strategies.
Extreme events were also regarded important for future work in assessing impacts on the
energy sector. This will require the use of updated heating and cooling data, both for
residential and service sectors. A better understanding of the effects of extreme climate
events on the power system (cold or heat waves, water scarcity) is also considered
important.
In the transport sector, further analysis is required to quantify the impacts in detail and
follow up projects should focus on mapping with high resolution Europe’s critical
infrastructure at risk from climate change and estimating relevant costs. More detailed
analysis would require information on the frequency and duration of the weather events
considered. Furthermore, the qualitative characteristics of infrastructure of major
seaports and airports need to be taken into account. Infrastructure at risk should be
examined case by case in order to take into consideration the particularities of the area,
the resilience of the infrastructure and of course details regarding the transport activity
and economic importance. Studies focusing on specific cases and pilot projects could
indicate important factors (e.g. of success) and highlight the main characteristics of a
general methodology for analysing the impacts of climate change on the specific sectors.
The study of Mediterranean habitat loss from climate change suggests that using more
types of metrics could provide additional information regarding projected impacts on
biodiversity. Secondly, the spatial resolution of the RCM simulations, although state of
the art (Jacob et al 2014), is notably larger than the optimal resolution required for
assessing local-level features such as Natura 2000 sites. This aspect can be alleviated by
using downscaling methods, e.g. change factor (Ekström et al., 2015). However,
downscaling methods would require increased computing resources.
From the forest fires study, a focus on assessing extreme values has been proposed as
an improvement for future work, with the aim to overcome the higher uncertainty of the
nonlinear variability of the potential damage by applying a bias correction on the
empirical fire damage models, separately exploiting the time series of fire danger
generated under each scenario realization, and the newly available updated dataset of
monthly burnt area statistics by country. The second step proposed is to exploit a
computationally intensive statistical resampling, in order to be able to estimate fire
damage extremes instead of the traditional central values. A more reliable projected
distribution of burn and a corresponding extreme scenario analysis might become
feasible. Improvements in the quantification of estimates of burnt-area damage into their
associated damage value have also been proposed (following Oehler et al., 2012 and

70
Camia et al. 2017). These next steps might achieve a more complete future biophysical
analysis on the response, resilience and adaptation potential of vegetation, plant
communities and ecosystems to changing fire danger and fire regimes.
Proposed further research in the labour productivity impact assessment is focused on
adaptation, on the feasibility of shifting the hours of work slightly, e.g. earlier starts,
longer breaks in the day (as opposed to entirely to night-time), in different sectors and
for different organisations across Europe, to explore the practical issues associated with
this form of planned adaptation. Including a comprehensive review of evidence on
potential negative health effects of working at night, as a potential planned adaptation
response to climate change, would be beneficial. It has also been proposed to investigate
alternative approaches to modelling adaptation, e.g. increasing air conditioning for indoor
workers, and ways of cooling local environments for outdoor workers.
As mentioned in the previous section, the cost-benefit analysis of adaptation should be
improved, developing sound methodologies (reinforcing its solid empirical basis, e.g.
Carleton et al., 2018) for the economic analysis of adaptation options for key impact
areas (e.g. coastal floods, river floods, droughts, agriculture, mortality/morbidity, etc.)
and at the appropriate spatial resolution for regional and local decision makers. This is
needed in order to design adaptation with an economic rationale, i.e. to address issues
like how to prioritise adaptation funds across regions and sectors, and what is the right
balance of expensive adaptation measures versus other alternative public investments.
The quasi-static economic approach of the project does not capture the genuinely
dynamic mechanisms of economic growth (capital accumulation, total factor productivity,
demographic trends, etc.) and the dynamic impacts that a changing climate may have on
them. A preliminary, exploratory exercise for coastal flood impacts in terms of growth
accounting (and growth accounting in presence of climate change) using the MaGE global
econometric growth model (Fouré et al. 2013) is being tested to explore the dynamic
impacts. MaGE is a dynamic recursive model, which means that an impact on the GDP or
on the capital stock occurring in one year has effects on the economic performance in
subsequent periods.
Beyond Europe, some international teams are making significant progress in the global
assessment of climate impacts following a risk perspective, e.g. the Climate Impact Lab
(https://www.impactlab.org/).
The new JRC PESETA IV project addresses some of those research challenges. The
project will intend to better capture the uncertainty from climate modelling, with
additional climate runs beyond the five core models of JRC PESETA III, and also add the
focus on 1.5ºC, 2ºC and higher warming levels (3ºC or 4ºC) and 2050, thus considering
the temperature goals of the Paris agreement. Three new impact areas will be included:

71
forest ecosystems, human health (both heat- and cold-related mortality) and
windstorms. The river floods and coastal floods models will explore adaptation measures,
including their costs and benefits; and additional inter-sectoral links will be considered.
Communication issues (particularly to policymakers) will also receive particular attention.

72
References
[1] Alfieri, L., Feyen, L., Dottori, F., Bianchi, A. (2015). Ensemble flood risk assessment in
Europe under high end climate scenarios Global Environmental Change, 35, 199-212.
https://doi.org/10.1016/j.gloenvcha.2015.09.004 .
[2] Alfieri, L., Dottori, F., Feyen, L. (2017). Task 7 – River floods. European Commission EUR
29422 EN, doi:10.2760/849948.
[3] Barredo, J.I., Caudullo, G., Mauri, A. (2017). Mediterranean habitat loss under RCP4.5
and RCP8.5 climate change projections - Assessing impacts on the Natura 2000 protected
area network. Publications Office of the European Union, Luxembourg. ISBN: 978-92-79-
67471-6, https://doi.org/10.2760/622174 .
[4] Barredo, J.I., Mauri, A., Caudullo, G., Dosio, A. (2018). Assessing Shifts of Mediterranean
and Arid Climates Under RCP4.5 and RCP8.5 Climate Projections in Europe. Pure and
Applied Geophysics, 1-17, https://doi.org/10.1007/s00024-018-1853-6 .
[5] Bosello, F., Eboli, F., Pierfederici, R. (2012). Assessing the Economic Impacts of Climate
Change. An Updated CGE Point of View. FEEM working paper, 2.2012; CMCC Research
Paper No. 125. https://doi.org/10.2139/ssrn.2004966 .
[6] Camia, A., Libertá, G., San-Miguel-Ayanz, J. (2017). Modeling the impacts of climate
change on forest fire danger in Europe: sectorial results of the PESETA II Project.
Publications Office of the European Union, Luxembourg. ISBN: 978-92-79-66259-1,
https://doi.org/10.2760/768481 , INRMM-MiD:14314418
[7] Cammalleri, C., Barbosa, P., Micale, F., Vogt, J.V. (2017). Climate change impacts and
adaptation in Europe, focusing on extremes and adaptation until the 2030s. Publications
Office of the European Union, Luxembourg. ISBN: 978-92-79-77230-6,
https://doi.org/10.2760/282880 .
[8] Cammalleri, C., Micale, F., Vogt, J. (2016). A novel soil moisture-based drought severity
index (DSI) combining water deficit magnitude and frequency. Hydrological Processes, 30
(2), 289-301. https://doi.org/10.1002/hyp.10578 .
[9] Carleton, T., Delgado, M., Greenstone, M., Houser, T., Hsiang, S., Hultgren, A., Jina, A.,
Kopp, R., McCusker, K., Nath, I., Rising, J., Rode, A., Seo H.K., Simcock, J., Viaene, A.,
Yuan, J., Zhang, A.T. (2018). Valuing the Global Mortality Consequences of Climate
Change Accounting for Adaptation Costs and Benefits. University of Chicago, Becker
Friedman Institute for Economics Working Paper No. 2018-51.
https://doi.org/10.2139/ssrn.3224365.
[10] Christodoulou, A., Demirel, H. (2018). Impacts of climate change on transport - A focus
on airports, seaports and inland waterways, EUR 28896 EN, Publications Office of the

73
European Union, Luxembourg, ISBN 978-92-79-97039-9, doi:10.2760/378464,
JRC108865.
[11] DeConto, R.M., Pollard, D. (2016). Contribution of Antarctica to past and future sea-level
rise. Nature, 531, 591-597. https://doi.org/10.1038/nature17145 .
[12] de Rigo, D., Libertà, G., Houston Durrant, T., Artés Vivancos, T., San-Miguel-Ayanz, J.
(2017). Forest fire danger extremes in Europe under climate change: variability and
uncertainty. Publications Office of the European Union, Luxembourg. ISBN: 978-92-79-
77046-3, https://doi.org/10.2760/13180.
[13] De Roo, A.P.J., Bisselink, B., Bernhard, J. (2017). Projections of changes in Europe’s
water resources under a 2 degree climate change. Final report PESETAIII Task 12a.
Technical report by the Joint Research Centre (JRC), in press
[14] De Wit, A., Boogaard, H., Fumagalli, D., Janssen, S., Knapen, R., van Kraalingen, D.,
Supit, I., van der Wijngaart, R., van Diepen, K. (2018). 25 years of the WOFOST
cropping systems model. Agricultural Systems.
https://doi.org/10.1016/j.agsy.2018.06.018 .
[15] Di Baldassarre, G., Viglione, A., Carr, G., Kuil, L., Yan, K., Brandimarte, L., Blöschl, G.
(2015). Debates—perspectives on sociohydrology: capturing feedbacks between physical
and social processes. Water Resources Research, 51(6), 4770–4781.
https://doi.org/10.1002/2014WR016416 .
[16] Dosio, A. (2016). Projections of climate change indices of temperature and precipitation
from an ensemble of bias-adjusted high-resolution EURO-CORDEX regional climate
models. Journal of Geophysical Research: Atmospheres 121, 5488–5511.
https://doi.org/10.1002/2015JD024411 .
[17] Dosio, A. (2017) Climate change projections, bias-adjustment, and selection of models’
runs. Technical report by the Joint Research Centre (JRC) in press
[18] Ekström, M., Grose M.R., Whetton, P.H. (2015). An appraisal of downscaling methods
used in climate change research. Wiley Interdisciplinary Reviews: Climate Change 6(3),
301-319. https://doi.org/10.1002/wcc.339 .
European Commission (2013). A Clean Air Programme for Europe. COM(2013) 918 final.
European Commission (2014). The 2015 Ageing Report. Underlying Assumptions and
Projection Methodologies. EUROPEAN ECONOMY 8/2014. Publications Office of the
European Union, Luxembourg. ISBN: 978-92-79-35351-2,
https://doi.org/10.2765/76255 .
[19] European Commission (2015). The 2015 Ageing Report. Economic and budgetary
projections for the 28 EU Member States (2013-2060), EUROPEAN ECONOMY 3/2015.

74
Publications Office of the European Union, Luxembourg. ISBN: 978-92-79-44746-4,
https://doi.org/10.2765/877631 .
[20] Forest Europe (2015). State of Europe’s Forests 2015.
http://www.foresteurope.org/docs/fullsoef2015.pdf . Archived at:
https://web.archive.org/web/20181030165439/https://www.foresteurope.org/docs/fullso
ef2015.pdf
[21] Forzieri, G., Cescatti, A., Batista e Silva, F., Feyen, L. (2017). Increasing risk over time of
weather-related hazards to the European population: a data-driven prognostic study. The
Lancet Planetary Health 1(5), e200-e208. https://doi.org/10.1016/S2542-
5196(17)30082-7
[22] Frieler, K., Lange, S., Piontek, F., Reyer C.P.O., Schewe, J., Warszawski, L., Zhao, F.,
Chini, L., Denvil, S., Emanuel, K., Geiger, T., Halladay, K., Hurtt, G., Mengel, M.,
Murakami, D., Ostberg, S., Popp, A., Riva, R., Stevanovic, M., Suzuki, T., Volkholz, J.,
Burke, E., Ciais, P., Ebi, K., Eddy T.D., Elliott, J., Galbraith, E., Gosling S.N., Hattermann,
F., Hickler, T., Hinkel, J., Hof, C., Huber, V., Jägermeyr, J., Krysanova, V., Marcé, R.,
Müller Schmied, H., Mouratiadou, I., Pierson, D., Tittensor D.P., Vautard, R., van Vliet,
M., Biber M.F., Betts R.A., Bodirsky B.L., Deryng, D., Frolking, S., Jones C.D., Lotze H.K.,
Lotze-Campen, H., Sahajpal, R., Thonicke, K., Tian, H., Yamagata, Y. (2017). Assessing
the impacts of 1.5 °C global warming – simulation protocol of the Inter-Sectoral Impact
Model Intercomparison Project (ISIMIP2b). Geoscientific Model Development, 10, 4321-
4345. https://doi.org/10.5194/gmd-10-4321-2017 .
[23] Fouré, J., Bénassy-Quéré, A., Fontagné, L. (2013). Modelling the world economy at the
2050 horizon. Economics of Transition 21(4), 617-654.
https://doi.org/10.1111/ecot.12023 .
[24] Gosling, S.N. (2013). The likelihood and potential impact of future change in the large-
scale climate system on ecosystem services. Environmental Science and Policy 27, S15-
S31. https://doi.org/10.1016/j.envsci.2012.03.011 .
Gosling, S., Zaherpour, J. and Ibarreta Ruiz, D. (2018). PESETA III: Climate change
impacts on labour productivity. Publications Office of the European Union, Luxembourg.
ISBN: 978-92-79-96912-6, https://doi.org/10.2760/07911
[25] Havik, K., Mc Morrow, K., Orlandi, F., Planas, C., Raciborski, R., Röger, W., Rossi, A.,
Thum-Thysen, A., Vandermeulen, V. (2014). The Production Function Methodology for
Calculating Potential Growth Rates & Output Gaps. EUROPEAN ECONOMY, Economic
Papers 535. ISBN: 978-92-79-35184-6, https://doi.org/10.2765/71437 .

75
[26] Hinkel, J., Jaeger, C., Nicholls, R.J., Lowe, J., Renn, O., Peijun, S. (2015). Sea-level rise
scenarios and coastal risk management. Nature Climate Change 5, 188-190.
https://doi.org/10.1038/nclimate2505 .
[27] Holland, M. (2014). Cost-benefit Analysis of Final Policy Scenarios for the EU Clean Air
Package. http://ec.europa.eu/environment/air/pdf/TSAP%20CBA.pdf . Archived at:
https://web.archive.org/web/20181030171955/http://ec.europa.eu/environment/air/pdf/
TSAP%20CBA.pdf .
[28] Houser, T., Kopp, R., Hsiang, S.M., Delgado, M., Jina, A.S., Larsen, K., Mastrandrea, M.,
Mohan, S., Muir-Wood, R., Rasmussen, D.J., Rising, J., Wilson, P. (2015). Economic risks
of climate change: an American prospectus. Columbia University Press.
ISBN: 9780231174565.
[29] Jacob, D., Petersen, J., Eggert, B., Alias, A., Christensen, O.B., Bouwer, L.M., Braun, A.,
Colette, A., Déqué, M., Georgievski, G., Georgopoulou, E., Gobiet, A., Menut, L., Nikulin,
G., Haensler, A., Hempelmann, N., Jones, C., Keuler, K., Kovats, S., Kröner, N.,
Kotlarski, S., Kriegsmann, A., Martin, E., van Meijgaard, E., Moseley, C., Pfeifer, S.,
Preuschmann, S., Radermacher, C., Radtke, K., Rechid, D., Rounsevell, M., Samuelsson,
P., Somot, S., Soussana J.-F., Teichmann, C., Valentini, R., Vautard, R., Weber, B., Yiou,
P. (2014). EURO-Cordex: new high-resolution climate change projections for European
impact research. Regional Environmental Change 14: 563-578.
https://doi.org/10.1007/s10113-013-0499-2 .
[30] Jones, B., O’Neill, B.C. (2016). Spatially explicit global population scenarios consistent
with the Shared Socioeconomic Pathways. Environmental Research Letters 11(8).
https://doi.org/10.1088/1748-9326/11/8/084003 .
[31] Keramidas, K., Kitous, A., Després, J., Schmitz, A. (2017). POLES-JRC model
documentation. Publications Office of the European Union, Luxembourg. ISBN: 978-92-
79-71801-4, https://doi.org/10.2760/225347 .
[32] Kitous, A., Després, J. (2017). PESETA3 Climate impact on energy demand. Assessment
of the impact of climate scenarios on heating and cooling demand. Publications Office of
the European Union, Luxembourg. ISBN: 978-92-79-77861-2,
https://doi.org/10.2760/96778 .
[33] Kitous, A., Keramidas, K., Vandyck, T., Saveyn, B., Van Dingenen, R., Spadaro, J.,
Holland, M. (2017). Global Energy and Climate Outlook 2017: how climate policies
improve air quality - Global energy trends and ancillary benefits of the Paris Agreement.
Publications Office of the European Union, Luxembourg. ISBN: 978-92-79-73864-7,
https://doi.org/10.2760/474356 .

76
[34] Lenton, T.M., Held, H., Kriegler, E., Hall, J.W., Lucht, W., Rahmstorf, S., Schellnhuber,
H.J. (2008). Tipping elements in the Earth's climate system. Proceedings of the National
Academy of Sciences 105 (6), 1786-1793. https://doi.org/10.1073/pnas.0705414105 .
[35] Missirian, A., Schlenker, W., (2017). Asylum applications respond to temperature
fluctuations. Science, 358(6370), 1610-1614. https://doi.org/10.1126/science.aao0432 .
[36] Narayanan, B., Aguiar, A., McDougall, R. (2012). Global Trade, Assistance, and
Production: The GTAP 8 Data Base.‚ Center for Global Trade Analysis, Purdue University‚
West Lafayette. Archived at:
https://web.archive.org/web/20180725173037/https://www.gtap.agecon.purdue.edu/da
tabases/v8/v8_doco.asp .
[37] Nemry, F., Demirel, H. (2012). Transport and Climate Change: a Focus on Road and Rail
Infrastructures. Publications Office of the European Union, Luxembourg. ISBN: 978-92-
79-27037-6, https://doi.org/10.2791/15504 .
[38] OECD (2015). The Economic Consequences of Climate Change. OECD Publishing, Paris.
ISBN: 9789264235410, https://doi.org/10.1787/9789264235410-en .
[39] Oehler, F., Oliveira, S., Barredo, J.I., Camia, A., San-Miguel-Ayanz, J., Pettenella, D.,
Mavsar, R., (2012). Assessing European wild fire vulnerability. Geophysical Research
Abstracts 14, 9452+. INRMM-MiD:14377675
[40] Pérez Domínguez, I., Fellmann, T. (2017). PESETA III: Agriculture Economic Modelling.
Final Report. Technical report by the Joint Research Centre (JRC), in press
[41] Reilly, J., Paltsev, S., Strzepek, K., Selin, N.E., Cai, Y., Nam K.-M., Monier, E.,
Dutkiewicz, S., Scott, J., Webster, M., Sokolov, A. (2013). Valuing climate impacts in
integrated assessment models: the MIT IGSM. Climatic Change 117(3), 561-573.
https://doi.org/10.1007/s10584-012-0635-x .
[42] Riahi, K., van Vuuren, D.P., Kriegler, E., Edmonds, J., O’Neill, B.C., Fujimori, S., Bauer,
N., Calvin, K., Dellink, R., Fricko, O., Lutz, W., Popp, A., Crespo Cuaresma, J., Samir,
K.C., Leimbach, M., Jiang, L., Kram, T., Rao, S., Emmerling, J., Ebi, K., Hasegawa, T.,
Havlik, P., Humpenöder, F., Da Silva, L.A., Smith, S., Stehfest, E., Bosetti, V., Eom, J.,
Gernaat, D., Masui, T., Rogelj, J., Strefler, J., Drouet, L., Krey, V., Luderer, G., Harmsen,
M., Takahashi, K., Baumstark, L., Doelman, J.C., Kainuma, M., Klimont, Z., Marangoni,
G., Lotze-Campen, H., Obersteiner, M., Tabeau, A., Tavoni, M. (2017). The Shared
Socioeconomic Pathways and their energy, land use, and greenhouse gas emissions
implications: An overview. Global Environmental Change 42, 153-168.
https://doi.org/10.1016/j.gloenvcha.2016.05.009 .

77
[43] Shoven, J.B., Whalley, Y.J. (1992), Applying General Equilibrium. Cambridge University
Press. ISBN: 9780521319867 .
[44] Szewczyk, W., Ciscar, J.C., Mongelli, I., Soria, A. (2018). JRC PESETA III Project,
economic integration and spillover analysis. Technical report by the Joint Research
Centre (JRC), in press
[45] Toreti, A., Ceglar, A., Fumagalli, D., Niemeyer, S., Dentener, F., Lecerf, R., Zucchini, A.,
Panarello, L. (2017). PESETA III: Agriculture Biophysical Assessment. Final Report.
Technical report by the Joint Research Centre (JRC), in press.
[46] van der Knijff, J.M., Younis, J., de Roo, A.P.J. 2010). LISFLOOD: A GIS-based distributed
model for river basin scale water balance and flood simulation. International Journal of
Geographical Information Science, 24 (2), 189-212.
https://doi.org/10.1080/13658810802549154 .
[47] Van Meijl, H., Havlik, P., Lotze-Campen, H., Stehfest, E., Witzke, P., Pérez Domínguez,
I., Bodirsky, B., van Dijk, M., Doelman, J., Fellmann, T., Humpenoeder, F., Levin-
Koopman, J., Mueller, C., Popp, A., Tabeau, A., Valin, H. (2017). Challenges of Global
Agriculture in a Climate Change Context by 2050 (AgCLIM50). Publications Office of the
European Union, Luxembourg. ISBN: 978-92-79-69666-4,
https://doi.org/10.2760/772445 .
[48] van Vuuren, D.P., Edmonds, J.A., Kainuma, M., Riahi, K., Thomson, A.M., Hibbard, K.,
Hurtt, G.C., Kram, T., Krey, V., Lamarque, J.-F., Masui, T., Meinshausen, M.,
Nakicenovic, N., Smith, S.J., Rose, S. (2011). The representative concentration
pathways: an overview. Climatic Change, 109, 5-31. https://doi.org/10.1007/s10584-
011-0148-z .
[49] Vousdoukas, M.I., Mentaschi, L., Voukouvalas, E., Verlaan, M., Feyen, L. (2017a).
Extreme sea levels on the rise along Europe’s coasts. Earth’s Future, 5(3), 304-323.
https://doi.org/10.1002/2016EF000505 .
[50] Vousdoukas, M.I., Mentaschi, L., Voukouvalas, E., Feyen, L. (2017b). PESETA III – Task
8: Coastal Impacts. European Commission EUR 29421 EN, doi: 10.2760/745440.
[51] Vousdoukas, M.I., Mentaschi, L., Voukouvalas, E., Bianchi, A., Dottori, F., Feyen, L.
(2018). Climatic and socioeconomic controls of future coastal flood risk in Europe. Nature
Climate Change, 8, 776–780. https://doi.org/10.1038/s41558-018-0260-4 .
[52] Zurich (2014). Risk Nexus, Central European floods 2013: a retrospective. Zurich
Insurance Company Ltd, Switzerland. Archived at:
http://www.webcitation.org/71AlsFRlk .

78
List of abbreviations and definitions
AgMIP The Agricultural Model Intercomparison and Improvement Project
CAP Common Agricultural Policy
CAPRI Common Agricultural Policy Regional Impact Analysis model
C3 standard mechanism of carbon fixation
CO2 Carbon dioxide
CGE Computable General Equilibrium
DG ECFIN Directorate-General for Economic and Financial Affairs
DC Drought code
DSI Drought Severity Index
EAD Expected Annual Damage
EAPA Expected Annual number of People Affected
FWI Forest Fire Weather Index
GDP Gross domestic product
GTAP Global Trade Analysis Project
H1 to H5 Set of JRC PESETA III core climate runs
HELIX Helix ClimateHigh-End cLimate Impacts and eXtremes
IPCC Intergovernmental Panel on Climate Change
ISI-MIP The Inter-Sectoral Impact Model Intercomparison Project
LISFLOOD Distributed Water Balance and Flood Simulation Model
MaGE Macroeconometrics of the Global Economy
NUTS2 Nomenclature of Territorial Units for Statistics 2
OECD Organisation for Economic Co-operation and Development
PESETA Projection of Economic impacts of climate change in Sectors of the
European Union based on bottom-up Analysis
POLES Prospective Outlook on Long-term Energy Systems
RCM Regional Climate Models
RCPs Representative Concentration Pathways
RSLR Relative Sea Level Rise

79
SSPs Shared socio-economic pathways
SUDS Sustainable Urban Drainage Systems
UN United Nations
UAA Utilised Agricultural Area
VSL Value of Statistical Life
WEI Water Exploitation Index
WGBT Wet bulb Globe Temperature

80
List of figures
Figure 1. Projected change of seasonal mean daily temperature for winter and summer,
at the end of the century (2071-2100) compared to the present climate (1981-2010),
under RCP8.5 .......................................................................................................17
Figure 2. Projected change of daily precipitation in winter and summer, at the end of the
century (2071-2100) compared to the present climate (1981-2010), under RCP8.5 (top
figures). Hatching indicates areas where more than 80% of model runs (9 out of 11)
agree on the sign of change (bottom figures) ...........................................................18
Figure 3. Overview of climate impact coverage for each kind of analysis ......................24
Figure 4. Left graphs: expected annual damage for the baseline and for the future
periods 2021-2050 and 2071-2100 (high warming scenario). Right graphs: expected
annual damage for different levels of warming. Figures show flood impacts under future
climate conditions on present European society (static). Note that some countries are not
included in the graphs because impacts are negligible compared to other countries. Also
note different scales on the horizontal axes. ............................................................28
Figure 5. Annual affected population and damage across Germany (top) France, UK and
Italy (bottom) for the 2°C and high warming scenarios with four adaptation strategies
implemented at different levels of intensity ("sensitivity"). Shading denotes range in
impacts from using 7 climate models (average value is the solid line) .........................30
Figure 6. Spatial distribution of significant changes in soil moisture-based drought
occurrence and severity (2°C scenario) ...................................................................31
Figure 7. Current sensitivity to drought (based upon present climate and socio-economic
conditions) ..........................................................................................................32
Figure 8. Changes relative to present (%) in irrigated and rain-fed yields, in the mid-
2030s under a high warming scenario. Yields are the average from using 5 different
climate models .....................................................................................................34
Figure 9. Absolute change (1000 t) in total soft wheat production compared to the
reference scenario in 2050, for EU NUTS2 regions, and for scenarios without CO2
fertilisation (left) and with CO2 fertilisation (right) ....................................................36
Figure 10. European residential heating and cooling final demand (H1-5 are projectons
using different climate models) ..............................................................................37
Figure 11. Impact of better insulation on the sum of heating and cooling demand in EU
(H1-5 are projectons using different climate models; “baseline” is without better
insulation) ...........................................................................................................38

81
Figure 12. Number of airports and seaports at risk by the end of the century to different
levels of coastal flood, under a high warming scenario ..............................................40
Figure 13. Average annual savings (costs are negative) due to fewer low flow river
events, under high warming at end of the century (range is due to using climate
projections from different climate models) ...............................................................42
Figure 14 Changes in annual groundwater recharge under a 2°C scenario ...................44
Figure 15 Water Exploitation Index (WEI+) under current climate (1990-2016) ...........45
Figure 16 Seasonal WEI+ change in the 2°C scenario ...............................................46
Figure 17 Seasonal WEI+ change in the High emission scenario .................................46
Figure 18. Projected changes in the extent of the Mediterranean and arid climate zones
respectively, assuming no adaptation, under two scenarios: high warming by the end of
the century, and under the 2°C scenario .................................................................49
Figure 19. Existing Natura 2000 sites (light yellow) mapped against natural and semi-
natural areas (green) where the Mediterranean zone is preserved under the high
warming scenario by the end of the century .............................................................51
Figure 20. Moisture content of thick wooden fuels as estimated by the Drought Code
(highly correlated with fire intensity) in the present and under two climate change
scenarios .............................................................................................................52
Figure 21. Forest fire danger estimated by the Fire Weather Index in the present, and
under two climate change scenarios, according to two different climate models (H3, H5);
these are selected to demonstrate the effect of using different climate models .............54
Figure 22. Regional differences from present (%) in daily average outdoor labour
productivity due to climate change under a high warming scenario and a 2°C scenario
respectively .........................................................................................................56
Figure 23. Welfare losses (% of GDP) for the high warming scenario and 2°C ..............60
Figure 24. The North-South divide for the high warming scenario ...............................60
Figure 25. The geography of impacts for the high warming scenario (without health
impacts) ..............................................................................................................61
Figure 26. Distribution of climate impacts (without health) under the 2oC scenario (left)
and high warming scenario (right) ..........................................................................62
Figure 27. Geography of global transboundary effects in GDP terms (bn €) ..................63
Figure 28. Geography of global transboundary effects in welfare terms (bn €)..............63
Figure 29. Overview of climate shocks affecting the economy ....................................88

82
List of tables
Table 1. The priority sub-set of 5 climate models used in JRC PESETA III, and the year
when 2°C is reached ............................................................................................. 17
Table 2. Models, scenarios and related references .................................................... 21
Table 3. Projected evolution in time of coastal flooding impacts aggregated at European
level: Expected Annual Damage (EAD; billion €) and Expected Annual number of People
Affected (EAPA; thousand people) from coastal flooding under RCP4.5-SSP1, RCP8.5-
SSP3, and RCP8.5-SSP5. Values express the ensemble mean projections, for 2030, 2050,
2080, and 2100, as well as under 2oC warming ........................................................ 26
Table 4. The proportion of the area, and area, of Natura 2000 sites currently within the
Mediterranean zone, which are at least likely (i.e. likely as well as confident) to be stable,
contract or expand due to climate change ............................................................... 51
Table 5. Impact on mortality due to heatwaves ........................................................ 57
Table 6 Implementation of sectoral climate impacts in CAGE ...................................... 90
83
Annexes
Annex 1. Impact models
This annex deals with the main features of each biophysical model.
1. Coastal floods
The approach of this JRC PESETA III study takes into account the three key variables in
risk analysis, namely exposure (value of assets, population and land-use exposed to
coastal flooding), vulnerability, and hazard. The defined hazard is coastal floods that are
caused by rising sea levels, high tides and storm surges. Projections of coastal floods for
all countries in Europe with a coastline were estimated according to climate projections
from a high warming scenario, as well as an intermediate moderate emissions scenario.
Projections of annual economic damages and people affected were produced for two
cases: 1) assuming no change from present socio-economic conditions; and 2)
population and GDP develop consistently with each of the two emissions scenarios (high
warming and moderate emissions). In both cases it was assumed that current levels of
flood protection do not change in the future.
The coast study may underestimate flood impacts because it does not consider some
processes that can drive additional risks. The assessment focuses on direct impacts of
coastal flooding only and does not take into account the effects of acidification in coastal
areas. Moreover, simultaneous fluvial and coastal flooding, which are likely to occur
simultaneously, with mutually-reinforcing negative impacts, are not jointly considered.
Processes such as dyke failure and coastal erosion are also neglected, as their
consideration remains a challenge given the complex processes as well as temporal and
spatial scales involved.
2. River floods
The number of people affected and the economic damages from river flooding have been
assessed with simulations of river flows generated by a hydrological model (LISFLOOD)
with projections of climate change, using maps of present flood hazard generated with a
hydrodynamic model (Lisflood-FP) and information on current flood defences.
The same hydrological model was used elsewhere in JRC PESETA III to assess soil
moisture and water resources.
Furthermore, the risk assessment framework was applied to qualitatively evaluate the
risk reduction potential of a number of flood adaptation strategies. Measures taken into
account include the rise of flood protection, reduction of the peak flows through water
retention, reduction of vulnerability and relocation to safer areas.
84
The analysis, however, does not consider other flood processes such as coastal floods
(due to storm surges and waves, which are considered separately in JRC PESETA III), nor
pluvial and flash floods (caused by localized, high-intensity rainfall events).
3. Droughts
The analysis of the consequences of droughts is made going beyond the study of rainfall.
Reduced availability of water can reduce the water content in soil (soil moisture), which
in the end affects land vegetation (i.e. agriculture) and other human activities.
An indicator of drought severity index (DSI) based on soil moisture is used. The indicator
depends both on the magnitude of the water deficit and the rarity of the event compared
to the historical climatology in the specific site and period. The higher are any of the two,
the higher is the severity index.
The drought exposure and vulnerability indicators are computed considering only the
current information, i.e. a comparative static framework is followed.
4. Agriculture
Crop modelling
A gridded crops model was run with climate inputs from 5 different climate models,
under a high warming scenario (RCP8.5) for the 2030s, to estimate the impact of climate
change on irrigated crops and rain-fed crops respectively.
Climate change will affect crops in different ways, depending upon whether a crop is
grown by irrigation or rainfall. Therefore crop yields in JRC PESETA III were simulated in
two separate ways. One way is by calculating “water-limited” yields, where changes in
water supply due to climate change are considered. This provides an indication of how
rain-fed crops might be affected by climate change. The second way of simulating crop
yields is the so-called “potential”, which assumes that water and nutrients are in ample
supply and the environment is free from pests and diseases. Only temperature, radiation
from the sun, and plant properties (such as the rates at which different crops grow), are
considered. Potential yields give an indication of how crops grown by full irrigation might
be affected by climate change. The current modelling approach does not account for
partial irrigation.
As there considerable uncertainties in the magnitude of the CO2 fertilisation effect, the
JRC PESETA III model simulations were conducted without and with the effect.
Agro-economic analysis
For the agro-economic analysis, the CAPRI model was employed, using a combination of
a Shared Socio-Economic Pathway (SSP2) and a Representative Concentration Pathway
(RCP8.5). CAPRI is an economic large-scale comparative-static, global multi-commodity,

85
agricultural sector model. The results of the JRC PESETA III agro-biophysical modelling
were implemented into CAPRI for the climate change related biophysical yield changes in
the EU. As the agricultural markets are internationally connected via world commodity
trade, also climate change related yield effects in non-EU countries were considered, as
provided by the AgCLIM50 project (van Meijl et al. 2017). The projection period for the
agro-economic impacts was 2050.
5. Energy demand
Two steps are followed: firstly, from climate change the heating and cooling degree days
(the degree days indicate a notion of how much heat or cold is outdoors compared to an
ideal temperature level, usually eighteen degrees Celsius) are computed; secondly, the
heating and cooling demand are a function of degree days and other variables (like
income, energy prices, building insulation and improvements in technology efficiency), as
specified in the POLES-JRC energy model (Keramidas et al 2017).
POLES is a global energy model that simulates the entire energy system, from primary
supply (fossil fuels, renewables) to transformation (power, biofuels, hydrogen) and final
sectoral demand.
The adaptation scenario was investigated by looking into improvements of building
performance (increased insulation). This is a kind of planned adaptation strategies
seeking energy efficiency.
The modelling of residential heating and cooling needs is based on a limited amount of
data points, which makes it difficult to separate the impacts of heating- and cooling-
degree days from the socio-economic drivers (population, size of households, income per
capita and other drivers), particularly for cooling. Although the data availability is scarce
for cooling, corresponding to a limited set of climate situations and usually covers only a
short time frame (2000-2010), some impact effect quantification has been possible
thanks to the model level of detail.
The modelling does not capture explicitly the way the evolution of technical progress and
lifestyle change may influence energy uses over such a long-term time frame, like the
one involved in the PESETA studies, the whole XXI century.
6. Transport
This sectoral assessment is connected to three other JRC PESETA III studies: coastal
flooding, river flooding and water resources. The projections of sea level and river
inundation levels were obtained from the coast and river flood impacts in JRC PESETA III,
respectively.

86
The impact of changes in droughts or river flows under a high warming scenario on
inland waterways was assessed for four critical points along the Rhine and Danube
(Europe’s most important inland waterways): Hofkirchen (Danube), Wildungsmauer
(Danube), Ruhrort (Rhine) and Kaub (Rhine). For inland waterways, only the impact of
drought was estimated, by associating changes in river flows with water levels, in
combination with transportation activity data, vessel carrying load restrictions and
transportation costs.
All impacts were estimated assuming that there are not adaptation strategies in the
future.
7. Water resources
JRC PESETA III has estimated the impact of climate change on extreme river flows and
water availability using the same hydrological model (LisFLOOD) that was used elsewhere
in the project to assess drought and damages from river flooding. The model was run
under a 2°C scenario, using climate inputs from five different climate models, while
assuming no change in land use and water demand from nowadays.
8. Habitat loss
JRC PESETA III assessed the effects of climate change on the spatial extent of Europe's
Mediterranean and arid climate zones. The zones were defined as being stable,
contracting, or expanding due to climate change. Measures of confidence were assigned
to the intensity of each of those changes, depending upon how many of 11 climate
models used showed the same result. If 10-11 models showed the same effect of climate
change, then the change was defined as confident, changes projected by 7-9 were
defined as likely, and 1-6 as uncertain.
Natura 2000 is a network of nature protection sites established under the EU Habitats
Directive. The current extent of the Mediterranean zone includes 2,599 Natura 2000
sites, totalling an area of around 168,000 km2, which represents 16% of the zone. JRC
PESETA III mapped present Natura 2000 sites against areas that are projected to remain
stable, contract or expand.
9. Forest fires
This JRC PESETA III study investigated how the danger of forest fires might be affected
by climate change across Europe, under two scenarios: 1) a high warming scenario at the
end of the century; and 2) a scenario in which global warming is limited to 2°C. Overall
forest fire danger was estimated by using the Canadian Forest Fire Weather Index (FWI)
system. The FWI has been used in many studies to indicate how climate change may
result in changes in fire severity and damage. Climate projections of rainfall, relative

87
humidity, temperature and wind speed were obtained from five climate models and used
as input to the FWI. The effects of future adaptation were not modelled.
10. Labour productivity
Changes in daily outdoor labour productivity are estimated by using daily wet bulb globe
temperature (WBGT). WBGT accounts for temperature, but also for humidity – variables
that are known to affect labour productivity.
Projections of WBGT were used with 5 different labour productivity impact models to
provide a range of potential impacts.
Other variables like wind, solar radiation and rainfall can also affect labour productivity
but these were not accounted for here.
There is uncertainty in the magnitude of projected climate change impacts on labour
productivity due to: 1) differences in the projections of climate between different climate
models; and 2) the use of different impact models. Both sources of uncertainty are
significant. The range in projected impacts due to using multiple climate models is
comparable to the range in impacts from using multiple impact models with only one
climate model.
The approach to modelling adaptation is highly idealised because it assumes the entire
European workforce shifts some of their hours of work from day-time to night-time. Yet
the analysis does not consider detrimental side-effects of night working, such as
disturbances of the normal circadian rhythms of psychophysiological functions,
interference with work performance as well as efficiency that can result in accidents;
chronic fatigue, anxiety and depression.
11. Mortality due to heatwaves
Results regarding mortality due to heatwaves come from the study of Forzieri et al.
(2017), who assess the annual numbers of deaths in Europe due to the risk of weather-
related hazards, in particular heatwaves, cold waves, wildfires, droughts, river and
coastal floods, and windstorms. Heatwaves appear to be the most lethal weather-related
hazard. The authors implement the IPCC risk framework, using a disaster record
database; the number of deaths is a function of hazards, exposure, and population
vulnerability. The study also assumes constant vulnerability, i.e. no additional adaptation
measures are taken to reduce the heatwave impact to future extreme climate conditions.

88
Annex 2. Economic model
GEM-E3-CAGE is a static multi-country, multi-sector CGE model of the world economy
linking the economies through endogenous bilateral trade. The CAGE database is mainly
based on the Global Trade Analysis Project (GTAP) database, version 8 (Narayanan et al.,
2012). The GEM-E3-CAGE model has 19 sectors and 25 world regions.
Making assumptions about the detailed sectoral structure of the European economy in a
time-span of many years seems a really cumbersome task, which would introduce more
uncertainty than the potential insight gain. Because of this long-term perspective of
climate impact, the CGE economic analysis adopted in our study is (quasi-) static; the
study looks at what the effects of climate change would be if the future climate would
occur today, under the current socioeconomic conditions. The estimated economic
impacts represent a level shift or one-off change in welfare or GDP, and not a change in
the growth rates. In other words, in this assessment the possible effects on economic
growth due to the impacts on savings and investment decisions are not considered.
However, this impact assessment provides a solid ground to providing an estimate of the
integrated damage: the comparison of the welfare (or GDP) levels obtained with today's
economic structure with present-day climate to the welfare (or GDP) levels obtained with
a warmer climate with the same economic structure provide a (conservative but robust)
measure of the impact that climate change could have with respect to the present levels
of welfare (or GDP).
There are three main channels through which the direct damages as computed by the
biophysical impacts affect the economy (see Figure 29). Two of the transmission
channels would affect the supply side of the economy and a third one the demand side.
Figure 29. Overview of climate shocks affecting the economy

89
Regarding the supply side, firstly, climate change is affecting the productivity of the
economy. The productivity is defined as the unit of output per unit of input. The clearest
case is that of agriculture: climate change can lead to reduced yields (output), while all
other factors of production (inputs) are the same. Secondly, climate change can alter the
capital stock of the economy, for instance when river floods damage infrastructure. These
supply-side effects would trigger a series of adjustments in the economy also indirectly
affecting sectors and regions different to that where climate change is impacting directly.
To further elaborate on those examples, the lack of domestic agricultural production will
provoke a higher food imports demand, and the capital equipment destroyed will need
replacement, which call for investments that will impede other investment opportunities.
Regarding the demand side of the economy, climate change can also influence
consumption decisions. For instance, damage to residential buildings due to a flood leads
to a change in the consumption behaviour of households as they would repair the
damage and consequently reduce other consumption expenditures. There would be a
substitution of consumption: additional consumption to repair the dwellings damage (e.g.
buy a new fridge) and an equivalent reduction in consumption (e.g. less leisure
expenditure), keeping the overall consumption constant. As the reparation of the flood
damage is part of obliged or compulsory consumption (which would not occur in the
absence of climate change), the economic model interprets that there is a welfare loss
associated to the damage to residential buildings.
Table 6 details how the different impact categories have been implemented in the CAGE
model. The agriculture impact model produces estimates of agriculture yields, which have
been implemented in the model as changes in productivity in the agriculture sector. The
effects due to river and coastal floods have two main components: damages to
residential buildings and damages to production sectors. The former component is
interpreted as an additional obliged consumption of households, which leads to a welfare
loss - due to the fact that there is now less money available for the (non-obliged)
consumption of (other) goods. The latter component has been implemented as a capital
loss. Third, coastal impacts have also two main damage categories. Sea flood damages
are interpreted as capital losses. Heating and cooling demand changes are modelled as
changes in obliged consumption. The number of premature deaths (mortality) is
considered as damage to the welfare of the population. This damage is calculated by
using the value of statistical life (VSL) method; the welfare loss is the number of
premature deaths times the VSL, assumed to be €1.09 million (same value for all
member states), the low-end of the range of estimates considered in the recent review of
the European Clean Air Policy Package (European Commission, 2013).

90
Table 6 Implementation of sectoral climate impacts in CAGE
Impact Biophysical model output Model implementation
Agriculture Yield change per crop Agriculture productivity
change
Energy Change in heating and cooling
demand
Change in obliged
consumption
Labour
productivity Change in labour productivity
Change in labour
productivity
River floods
Agriculture losses Agriculture productivity
Residential buildings damages Additional obliged
Production activities losses Capital loss
Coastal floods
Agriculture losses Agriculture productivity
Residential buildings damages Additional obliged
Production activities losses Capital loss
Mortality Change in mortality Welfare loss (ex-post)

GETTING IN TOUCH WITH THE EU
In person
All over the European Union there are hundreds of Europe Direct information centres. You can find the address of the centre nearest you at: https://europa.eu/european-union/contact_en
On the phone or by email
Europe Direct is a service that answers your questions about the European Union. You can contact this service:
- by freephone: 00 800 6 7 8 9 10 11 (certain operators may charge for these calls),
- at the following standard number: +32 22999696, or
- by electronic mail via: https://europa.eu/european-union/contact_en
FINDING INFORMATION ABOUT THE EU
Online
Information about the European Union in all the official languages of the EU is available on the Europa website at: https://europa.eu/european-union/index_en
EU publications You can download or order free and priced EU publications from EU Bookshop at: https://publications.europa.eu/en/publications. Multiple copies of free publications may be obtained by contacting Europe Direct or your local information centre (see https://europa.eu/european-union/contact_en).

KJ-N
A-2
9427-E
N-N
doi:10.2760/93257
ISBN 978-92-79-97218-8
The European Commission’s science and knowledge service
Joint Research Centre JRC Mission As the science and knowledge service of the European Commission, the Joint Research Centre’s mission is to support EU policies with independent evidence throughout the whole policy cycle.