climate change vulnerability in the black sea...
TRANSCRIPT

Climate Change Vulnerability in the
Black Sea Catchment
Roger Bär and Anthony Lehmann
1. Introduction
2. Theory
3. Methodology
4. Results
5. Discussion
6. Conclusion
Source:
UNEP/DEWA/GRID-
Europe
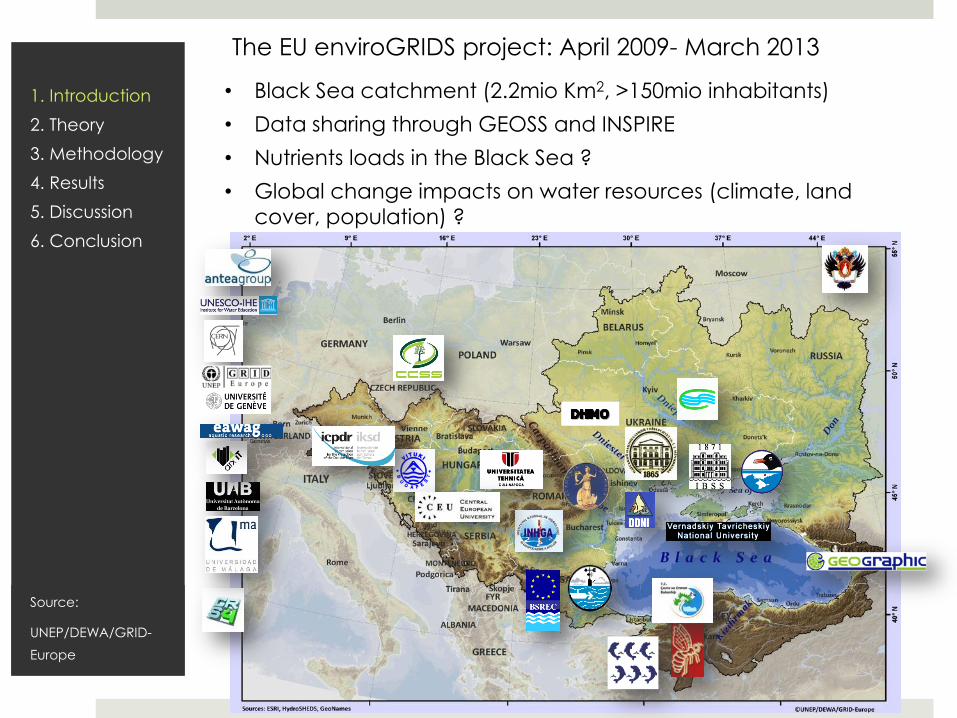
• Black Sea catchment (2.2mio Km2, >150mio inhabitants)
• Data sharing through GEOSS and INSPIRE
• Nutrients loads in the Black Sea ?
• Global change impacts on water resources (climate, land
cover, population) ?
The EU enviroGRIDS project: April 2009- March 2013
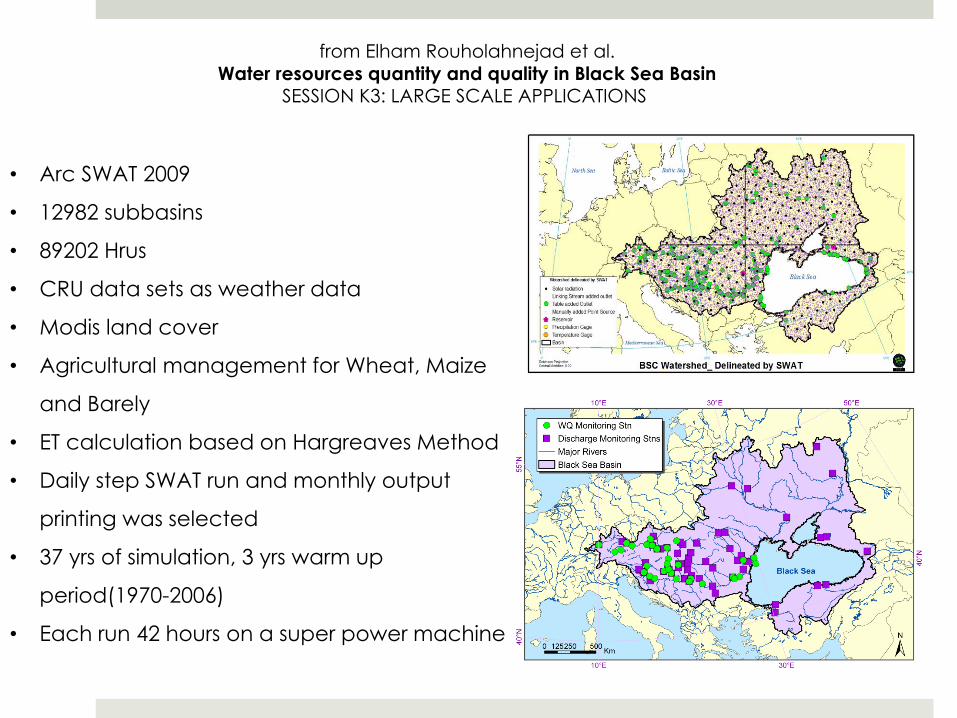
• Arc SWAT 2009
• 12982 subbasins
• 89202 Hrus
• CRU data sets as weather data
• Modis land cover
• Agricultural management for Wheat, Maize
and Barely
• ET calculation based on Hargreaves Method
• Daily step SWAT run and monthly output
printing was selected
• 37 yrs of simulation, 3 yrs warm up
period(1970-2006)
• Each run 42 hours on a super power machine
from Elham Rouholahnejad et al.
Water resources quantity and quality in Black Sea Basin SESSION K3: LARGE SCALE APPLICATIONS

River Discharge results
0
100
200
300
400
500
600
700
Dis
ch
arg
e (
m3/S
ec)
River Discharge (Q_6080, Prut River, Romania, Moldova, Ukraine)
95 PPU
Obs
Best_Sim
ValidationCalibration
p-factor= 0.59
r-factor= 0.92
R2= 0.58
NS= 0.47
0
500
1000
1500
2000
2500
3000
3500
4000
Dis
ch
arg
e (
m3
/Se
c)
River Discharge (Q_2467, Prypiat River, drains to Dnieper, Belarus)
95 PPUObsBest_Sim
p-factor= 0.8
r-factor= 1.71
R2= 0.52
NS= 0.28
Validation Calibration
River Discharge results from Elham Rouholahnejad et al.
Water resources quantity and quality in Black Sea Basin
SESSION K3: LARGE SCALE APPLICATIONS

1. Introduction
2. Theory
3. Methodology
4. Results
5. Discussion
6. Conclusion
Vulnerability Assessment of Agricultural Water Resources
Objectives
• Assess over all vulnerability for Agriculture
• Identify vulnerable regions
• Decompose results
• Offer a country comparison
Vulnerability = Potential to get harmed

1. Introduction
2. Theory
3. Methodology
4. Results
5. Discussion
6. Conclusion
Assessing Vulnerability
“How can vulnerability be measured?
Strictly speaking it cannot, because vulnerability does
not denote an observable phenomenon […]“.
Need to make the concept operational
Source:
Hinkel, 2011

1. Introduction
2. Theory
3. Methodology
4. Results
5. Discussion
6. Conclusion
Source:
Upper left: Allen
Consulting Group
2005
Upper right: Smeets
& Weterings 1999
Conceptualising Vulnerability

1. Introduction
2. Theory
3. Methodology
4. Results
5. Discussion
6. Conclusion
Contextualisation for the Black Sea project

1. Introduction
2. Theory
3. Methodology
4. Results
5. Discussion
6. Conclusion
Operationalization
Discrepancy between the theoretical framework and
the actual analysis method
Embed vulnerability framework in SWAT

Indicators
Temperature stress A temperature stress day is as day when the average daily air temperature is below
5°C or above 35°C
Water stress A water stress day is a day where the average daily evapotranspiration (minus
irrigation water) is less than half of the potential daily evapotranspiration.
Environmental water requirement The daily environmental water requirement is estimated by calculating 80% of a 10-
year average stream flow for each respective day.

1. Introduction
2. Theory
3. Methodology
4. Results
5. Discussion
6. Conclusion
Methodology

1. Introduction
2. Theory
3. Methodology
4. Results
5. Discussion
6. Conclusion
Temperature Stress

1. Introduction
2. Theory
3. Methodology
4. Results
5. Discussion
6. Conclusion
Water Stress
1. Introduction
2. Theory
3. Methodology
4. Results
5. Discussion
6. Conclusion
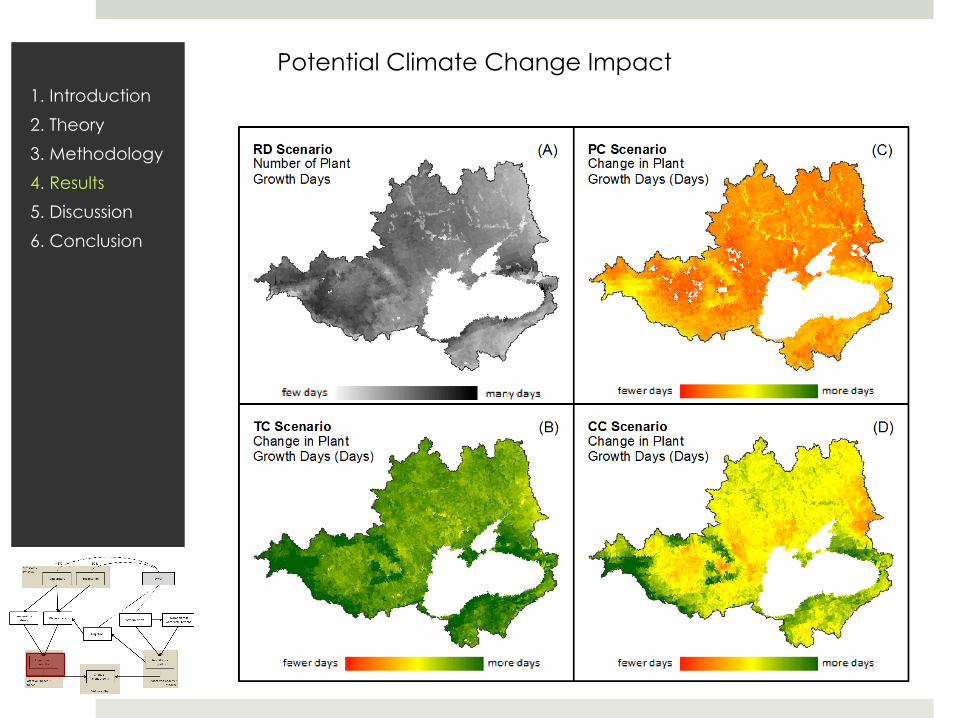
Potential Climate Change Impact

1. Introduction
2. Theory
3. Methodology
4. Results
5. Discussion
6. Conclusion
Irrigation Potential

1. Introduction
2. Theory
3. Methodology
4. Results
5. Discussion
6. Conclusion
Adaption by Irrigation

1. Introduction
2. Theory
3. Methodology
4. Results
5. Discussion
6. Conclusion
Water Vulnerability for Agriculture
1. Introduction
2. Theory
3. Methodology
4. Results
5. Discussion
6. Conclusion
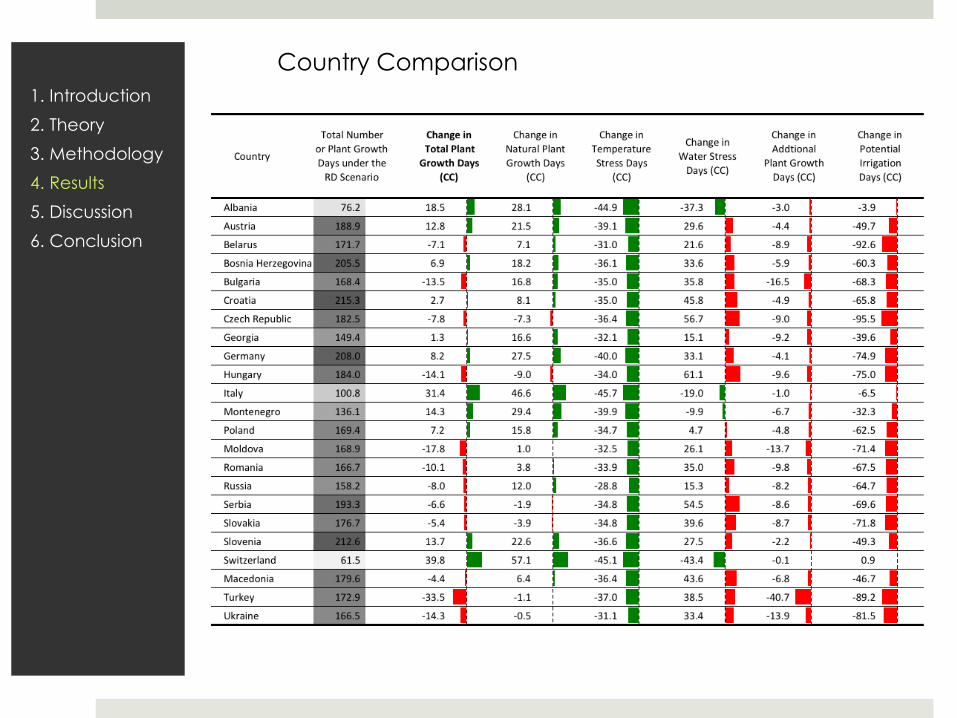
Country Comparison

1. Introduction
2. Theory
3. Methodology
4. Results
5. Discussion
6. Conclusion
Opposition of Potential Impact (+) and Adaption Capacity (-)
Difficult to compare with other studies, but no opposing
results (e.g. competition btw environment and agriculture)
Improvements:
Use outputs from Climate Change scenarios and uncertainty;
Improve indicator and threshold definitions;
Smaller discrepancy between the theoretical framework and
the actual analysis method
Appropriate combination of the two concepts, but DPSIR not
convenient for climate change analysis

1. Introduction
2. Theory
3. Methodology
4. Results
5. Discussion
6. Conclusion
Main Results
Agriculture plays key role as the larger water consumer
Differences between regions (e.g. mountains and
Turkey)
Better natural conditions – worse irrigation potential
Scope for Further Research
Extent to other sectors of climate vulnerability
Integrate water resources from groundwater
Policy Implications
Aggravated competition as irrigation will increase
Sustainable water resource management (e.g. WFD)
Effective and sustainable agronomic practices
(deficit irrigation, waste water irrigation, pressurized
irrigation systems)


Funded by the European Commission under grant agreement 226740