climate change risks to coastal buildings and infrastructure · in the climate change risks to...
TRANSCRIPT
Climate Change Risks to Coastal Buildings and InfrastructureA Supplement to the FIRSt pASS nAtIonAl ASSeSSment

Published by the Department of Climate Change and Energy Efficiency
www.climatechange.gov.au
ISBN: 978-1-921299-62-9 Climate Change Risks to Coastal Buildings and Infrastructure (pdf) 978-1-921299-63-6 Climate Change Risks to Coastal Buildings and Infrastructure (html) 978-1-921299-64-3 Climate Change Risks to Coastal Buildings and Infrastructure (paperback)
This work is licensed under the Creative Commons Attribution 3.0 Australia Licence. To view a copy of this license, visit http://creativecommons.org/licenses/by/3.0/au
The Department of Climate Change and Energy Efficiency asserts the right to be recognised as author of the original material in the following manner:
or
© Commonwealth of Australia (Department of Climate Change and Energy Efficiency) 2011.
DISCLAIMERMaterial in this report is made available on the understanding that the Commonwealth is not providing professional advice. Before relying on any material, readers should obtain appropriate professional advice. While reasonable care has been taken in preparing this report, the Commonwealth provides no warranties and makes no representations that the information contained in this report is correct, complete or reliable. The Commonwealth expressly disclaims liability for any loss, however caused, whether due to negligence or otherwise arising from the use of or reliance on the information contained in this report by any person.
The cover of this report is printed on 9Lives80 Gloss (recycled).
The inside pages of this report are printed on Envi Recycled Silk.
Design by Papercut.

Climate Change Risks to Coastal Buildings and InfrastructureA Supplement to the FIRSt pASS nAtIonAl ASSeSSment
2 Climate Change Risks to Coastal Buildings and Infrastructure
About this bookletAdaptation is one of the three pillars of the Australian Government’s climate change strategy.
In late 2009 the Australian Government released the first national assessment of climate change risks to Australia’s coastal assets. The Climate Change Risks to Australia’s Coasts: a first pass national assessment report identified significant risks to our natural ecosystems, beaches and landscapes, and to our settlements. In particular, the report provided an analysis of the location and number of residential properties that are at risk of inundation from rising sea levels and erosion as a consequence of climate change.
This booklet supplements the analysis presented in the Climate Change Risks to Australia’s Coasts report. It provides additional data on the exposure of commercial buildings (e.g. retail precincts), light industrial buildings, and transport systems (road, rail, tramways) in Australia’s coastal areas. Existing data on residential properties is also reported in the booklet, as well as subsequent modelling of projected population change and implications for the exposure levels of residential properties.
The analyses in Climate Change Risks to Australia’s Coasts and for this report were undertaken by Geoscience Australia using its National Exposure Information System (NEXIS) database. Building replacement values in this booklet are also derived from data in NEXIS and reflect 2008 replacement values of assets.
NEXIS is a relatively new dataset which is being updated over time. The analysis in this report was not available when the original report, Climate Change Risks to Australia’s Coasts, was released late in 2009.
The exposure of different infrastructure types is presented at a state level, with information on the most affected local government areas for each state located at the back of the booklet.
It should be noted that the analysis in this booklet considers the combined exposure to the hazards of inundation and shoreline recession (erosion) associated with rising sea levels under a changing climate. In the Climate Change Risks to Australia’s Coasts report (2009) the analyses for inundation and erosion were presented separately. There will therefore be differences in the figures reported for residential properties between this booklet and the Climate Change Risks to Australia’s Coasts report.
The results from this assessment are useful at a national scale and will assist in prioritising future coastal adaptation planning needs. The available national data is insufficient to answer all questions underpinning decision making at local and regional scales.
This assessment focuses on impacts and risk at the end of this century. However, climate change impacts will not stop then and impacts beyond 2100 will need to be anticipated in decision making with long horizons.
The report provides a plausible worst case scenario to assess risk and inform a dialogue on a national approach to manage risk in the future.
Nearer term impacts have also not been considered in this assessment as finer scale modelling processes are required for this. Understanding of both the shorter and longer term implications will also be needed to inform adaptation planning. Having access to this information allows governments, the private sector and the Australian community to understand and take steps to manage risks.
methodology – key points and caveats • An upper end sea level rise scenario of
1.1 metres for the 2100 period was considered.
• A storm tide allowance (1-in-100 year event) is included in the analysis for Tasmania, Victoria and New South Wales. For the other states, where state-wide storm tide modelling was not available, an allowance for modelled high water level was used.
• The inundation modelling used a relatively simple ‘bucket fill’ approach based on medium resolution elevation data. The upper and lower estimates help to bound the data uncertainties, particularly those associated with the medium resolution elevation data.
• The analysis does not take account of existing coastal protection such as seawalls, and does not include analysis of inundation due to riverine flooding (eg from extreme rainfall events).
• The identification of ‘soft’ potentially erodible shorelines was undertaken using the national Smartline dataset. Infrastructure located within 110 metres of these ‘soft’ potentially erodible shorelines was included in this analysis.
• More detailed assessments may change the relative order of local government areas and the magnitude and timing of projected impacts.
• Replacement values reported in this booklet are based on 2008 replacement values, as drawn from Geoscience Australia’s National Exposure Information System (NEXIS) database.
Climate Change Risks to Coastal Buildings and Infrastructure 3
oveRvIew
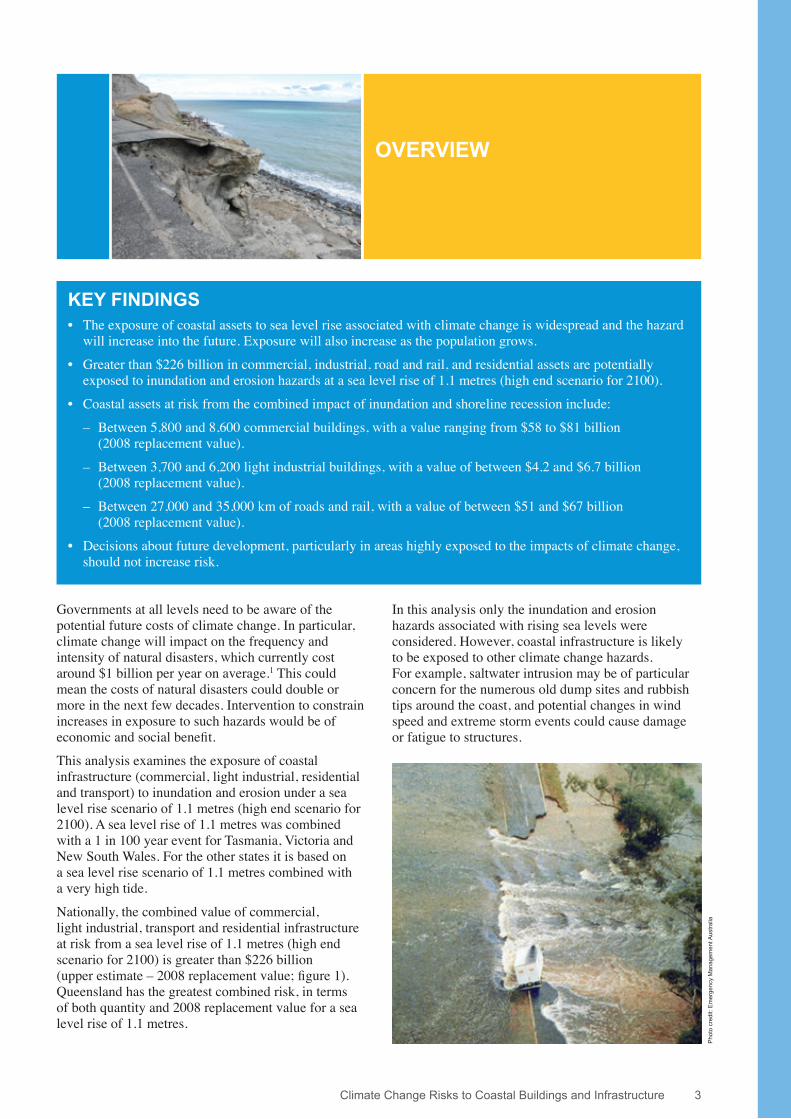
Key FIndIngS• The exposure of coastal assets to sea level rise associated with climate change is widespread and the hazard
will increase into the future. Exposure will also increase as the population grows.
• Greater than $226 billion in commercial, industrial, road and rail, and residential assets are potentially exposed to inundation and erosion hazards at a sea level rise of 1.1 metres (high end scenario for 2100).
• Coastal assets at risk from the combined impact of inundation and shoreline recession include:
– Between 5,800 and 8,600 commercial buildings, with a value ranging from $58 to $81 billion (2008 replacement value).
– Between 3,700 and 6,200 light industrial buildings, with a value of between $4.2 and $6.7 billion (2008 replacement value).
– Between 27,000 and 35,000 km of roads and rail, with a value of between $51 and $67 billion (2008 replacement value).
• Decisions about future development, particularly in areas highly exposed to the impacts of climate change, should not increase risk.
Pho
to c
redi
t: E
mer
genc
y M
anag
emen
t Aus
tralia
Governments at all levels need to be aware of the potential future costs of climate change. In particular, climate change will impact on the frequency and intensity of natural disasters, which currently cost around $1 billion per year on average.1 This could mean the costs of natural disasters could double or more in the next few decades. Intervention to constrain increases in exposure to such hazards would be of economic and social benefit.
This analysis examines the exposure of coastal infrastructure (commercial, light industrial, residential and transport) to inundation and erosion under a sea level rise scenario of 1.1 metres (high end scenario for 2100). A sea level rise of 1.1 metres was combined with a 1 in 100 year event for Tasmania, Victoria and New South Wales. For the other states it is based on a sea level rise scenario of 1.1 metres combined with a very high tide.
Nationally, the combined value of commercial, light industrial, transport and residential infrastructure at risk from a sea level rise of 1.1 metres (high end scenario for 2100) is greater than $226 billion (upper estimate – 2008 replacement value; figure 1). Queensland has the greatest combined risk, in terms of both quantity and 2008 replacement value for a sea level rise of 1.1 metres.
In this analysis only the inundation and erosion hazards associated with rising sea levels were considered. However, coastal infrastructure is likely to be exposed to other climate change hazards. For example, saltwater intrusion may be of particular concern for the numerous old dump sites and rubbish tips around the coast, and potential changes in wind speed and extreme storm events could cause damage or fatigue to structures.

4 Climate Change Risks to Coastal Buildings and Infrastructure
The analysis did not include consideration of critical infrastructure such as hospitals, or infrastructure involved in the delivery of some essential services such as wastewater systems. Since much of this infrastructure is concentrated around the coast, it can be expected that climate change will have implications for the delivery of some of these essential services into the future.
The methodology used in this report is the same as that used in Climate Change Risks to Australia’s Coast (2009). A summary of the methodology is provided in the ‘Methodology – key points and caveats’ box on page 2.
The analysis of exposure reported in this document is based on existing infrastructure stock. The impact that a changing, future population will have on
Sea level RiseIn recent decades, the rate of increase in sea level has been an order of magnitude faster than the average rate of rise over the previous several thousand years. From 1993 to 2003 global sea level rose by about 3.1 mm a year, compared to 1.8 mm a year when averaged from 1961 to 2003. Global average sea level rise during the twentieth century was 1.7 mm a year, which was slightly higher than the 1.2 mm a year relative rise recorded around Australia for the period.
In 2007 the Intergovernmental Panel on Climate Change (IPCC) issued projections in its Fourth Assessment Report for sea level rise of between 18–59 cm plus an allowance of 10–20 cm for ice sheet dynamics (79 cm) by 2100.2 There is growing consensus in the science community that sea level rise at the upper end of the IPCC estimates is plausible by the end of this century, and that a rise of more than 1.0 metre and as high as 1.5 metres cannot be ruled out. It should also be noted that sea levels will continue to rise after 2100.
A sea level rise of 1.1 metres was originally selected for national risk assessment analysis based on the plausible range of sea level rise values from research published after the IPCC forth Assessment Report. While estimates of total sea level rise remain uncertain, nearly all of the uncertainties in sea level rise projections operate to increase estimates of sea level rise.
Local sea level rise (mm/year) from the early 1990s to June 2010. Source: National Tidal Centre 2010
the exposure of coastal residential assets was also assessed. Based on current patterns of development the magnitude of risk to coastal assets has the potential to increase significantly into the future.
Avoidance of future risk is the most cost-effective adaptation response in most cases. Decisions on future development, particularly in areas highly exposed to the impacts of climate change, should not increase risk. However, as the data presented in this booklet reveals, there will still be a large legacy risk from existing infrastructure in the coastal zone, which will require attention. Early planning can help to minimise our future exposure.
Rep
lace
men
t Val
ue ($
bill
ion)
Light Industrial Road & Rail
Commercial Residential
Lighter bars represent lowerestimates & darker barsrepresent upper estimates
0
10
20
30
40
50
60
QLD NSW VIC SA WA TAS NT
Figure 1: The combined estimated replacement value ($ billion) for residential, commercial and transport infrastructure for a 1.1 metre sea level rise.
Climate Change Risks to Coastal Buildings and Infrastructure 5
RISKS to CommeRCIAl BuIldIngS
In this analysis, a commercial building is defined as one primarily occupied by businesses engaged in commercial trade, including wholesale, retail, office, and transport activities. The following analysis of exposure to commercial buildings uses the same methodology as in the report Climate Change Risks to Australia’s Coast (2009). A summary of this methodology is provided on page 2.
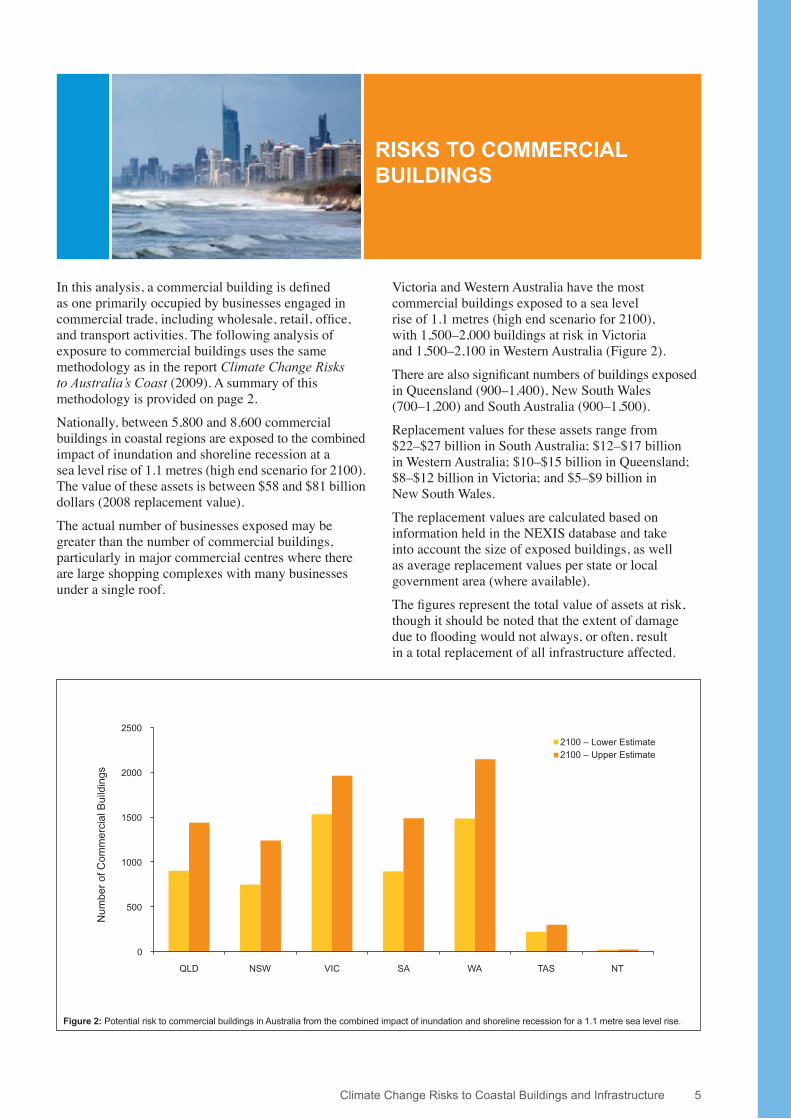
Nationally, between 5,800 and 8,600 commercial buildings in coastal regions are exposed to the combined impact of inundation and shoreline recession at a sea level rise of 1.1 metres (high end scenario for 2100). The value of these assets is between $58 and $81 billion dollars (2008 replacement value).
The actual number of businesses exposed may be greater than the number of commercial buildings, particularly in major commercial centres where there are large shopping complexes with many businesses under a single roof.
Victoria and Western Australia have the most commercial buildings exposed to a sea level rise of 1.1 metres (high end scenario for 2100), with 1,500–2,000 buildings at risk in Victoria and 1,500–2,100 in Western Australia (Figure 2).
There are also significant numbers of buildings exposed in Queensland (900–1,400), New South Wales (700–1,200) and South Australia (900–1,500).
Replacement values for these assets range from $22–$27 billion in South Australia; $12–$17 billion in Western Australia; $10–$15 billion in Queensland; $8–$12 billion in Victoria; and $5–$9 billion in New South Wales.
The replacement values are calculated based on information held in the NEXIS database and take into account the size of exposed buildings, as well as average replacement values per state or local government area (where available).
The figures represent the total value of assets at risk, though it should be noted that the extent of damage due to flooding would not always, or often, result in a total replacement of all infrastructure affected.
Num
ber o
f Com
mer
cial
Bui
ldin
gs
0
500
1000
1500
2000
2500
QLD NSW VIC SA WA TAS NT
2100 – Upper Estimate 2100 – Lower Estimate
Figure 2: Potential risk to commercial buildings in Australia from the combined impact of inundation and shoreline recession for a 1.1 metre sea level rise.
6 Climate Change Risks to Coastal Buildings and Infrastructure
RISKS to lIght InduStRIAl BuIldIngS
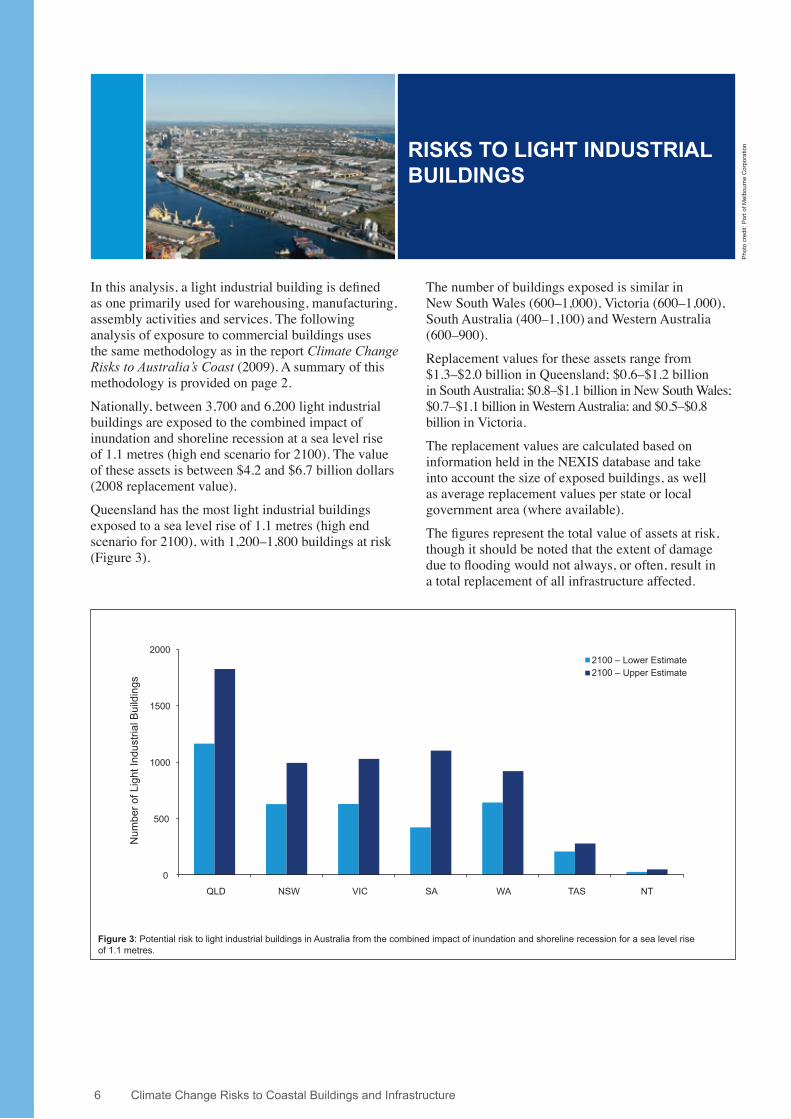
In this analysis, a light industrial building is defined as one primarily used for warehousing, manufacturing, assembly activities and services. The following analysis of exposure to commercial buildings uses the same methodology as in the report Climate Change Risks to Australia’s Coast (2009). A summary of this methodology is provided on page 2.
Nationally, between 3,700 and 6,200 light industrial buildings are exposed to the combined impact of inundation and shoreline recession at a sea level rise of 1.1 metres (high end scenario for 2100). The value of these assets is between $4.2 and $6.7 billion dollars (2008 replacement value).
Queensland has the most light industrial buildings exposed to a sea level rise of 1.1 metres (high end scenario for 2100), with 1,200–1,800 buildings at risk (Figure 3).
The number of buildings exposed is similar in New South Wales (600–1,000), Victoria (600–1,000), South Australia (400–1,100) and Western Australia (600–900).
Replacement values for these assets range from $1.3–$2.0 billion in Queensland; $0.6–$1.2 billion in South Australia; $0.8–$1.1 billion in New South Wales; $0.7–$1.1 billion in Western Australia; and $0.5–$0.8 billion in Victoria.
The replacement values are calculated based on information held in the NEXIS database and take into account the size of exposed buildings, as well as average replacement values per state or local government area (where available).
The figures represent the total value of assets at risk, though it should be noted that the extent of damage due to flooding would not always, or often, result in a total replacement of all infrastructure affected.
0
500
1000
1500
2000
QLD NSW VIC SA WA TAS NT
Num
ber o
f Lig
ht In
dust
rial B
uild
ings
2100 – Upper Estimate 2100 – Lower Estimate
Figure 3: Potential risk to light industrial buildings in Australia from the combined impact of inundation and shoreline recession for a sea level rise of 1.1 metres.
Pho
to c
redi
t: P
ort o
f Mel
bour
ne C
orpo
ratio
n

Climate Change Risks to Coastal Buildings and Infrastructure 7
RISKS to tRAnSpoRt InFRAStRuCtuRe
RoadsNationally, between 26,000 and 33,000 km of roads are potentially at risk from the combined impacts of inundation and shoreline recession for a sea level rise of 1.1 metres (high end scenario for 2100; figures 4 and 5). This figure is made up of 1,100–1,500 km of freeway, 10,000–13,000 km of main roads and 15,000–18,000 km of unsealed roads. This roadway has a value of between $46 and $60 billion (2008 replacement value). While most of the risk is to main roads, unsealed roads and tracks, the cost to replace freeway will be higher than replacing the same length of other types of road, and disruption to freeways will have a greater impact on transporting goods and people.
Western Australia has the greatest length of roadway at risk, with between 7,500 and 9,100 km exposed, at a replacement value of between $8.7 and $11.3 billion. Much of the exposure is to unsealed roadway.
Queensland has the greatest value of existing road infrastructure at risk, with between $9.7 and $12.9 billion for between 3,600 and 4,700 km of roadway. Queensland’s higher value relates to the greater percentage of freeway and main roads at risk in Queensland.
0
1000
2000
3000
4000
5000
6000
7000
8000
9000
10000
Lower Upper Lower Upper Lower Upper Lower Upper Lower Upper Lower Upper Lower Upper
QLD NSW VIC SA WA TAS NT
Leng
th (k
m)
Unsealed Roads Total length
Main Roads
Figure 5: Estimated length of road infrastructure at risk from the combined impact of inundation and shoreline recession for a 1.1 metre sea level rise.
Leng
th (k
m)
0
50
100
150
200
250
300
350
400
QLD NSW VIC SA WA TAS NT
Freeway – Lower Freeway – Upper
Figure 4: Estimated length of freeway at risk from the combined impact of inundation and shoreline recession for a 1.1 metre sea level rise.
All states, with exception of Tasmania and the Northern Territory, have an estimated replacement value of greater than $7 billion.

8 Climate Change Risks to Coastal Buildings and Infrastructure
Rail and tramways
0
100
200
300
400
500
600
QLD NSW VIC SA WA TAS NT
Leng
th (k
m)
2100 – Upper Estimate 2100 – Lower Estimate
Figure 6: Estimated length of existing rail and tramway infrastructure at risk from the combined impact of inundation and shoreline recession for a 1.1 metre sea level rise.
Nationally, between 1,200 and 1,500 km of rail lines and tramways are potentially at risk from inundation and shoreline recession from a sea level rise of 1.1 metres (high end scenario for 2100; figure 6). These assets have a value of between $4.9 and $6.4 billion (2008 replacement value).
Queensland has the greatest length (between 420 and 570 km) and highest estimated replacement value (between $1.7 and $2.3 billion) for rail and tramway infrastructure. New South Wales, South Australia and Tasmania have a replacement value of between $0.6 and $1.3 billion each. Assets exposed in Victoria, Western Australia and the Northern Territory have a replacement value of between $0.1 and $0.5 billion.
The analysis of exposure to road and rail uses the same methodology as in the report Climate Change Risks to Australia’s Coast (2009). A summary of this methodology is provided on page 2.
The total value and length of road and rail infrastructure indicates a high level of exposure to future climate change impacts. Impacts to transport networks will also have flow on effects – for emergency evacuation, ability to efficiently move goods and people and for access to service facilities, such as hospitals. Analysing the implications of disruption to transport networks and associated services will be an important part of preparing local and regional responses to the impacts of climate change.
The replacement values are calculated based on information held in the NEXIS database and are based on average replacement values per state or local government area (where available).
The figures represent the total value of assets at risk, though it should be noted that the extent of damage due to flooding would not always, or often, result in a total replacement of all infrastructure affected.

Climate Change Risks to Coastal Buildings and Infrastructure 9
RISKS to ReSIdentIAl BuIldIngS
In this analysis, a residential building is defined as a fixed structure consisting of one or more residences primarily for housing people. The following analysis of exposure to residential buildings uses the same methodology as in the report Climate Change Risks to Australia’s Coast (2009). A summary of this methodology is provided on page 2.
It should be noted that this analysis considers the combined exposure to the hazards of inundation and shoreline recession. In the Climate Change Risks to Australia’s Coasts report the analyses for inundation and erosion were presented separately. The figures reported here for residential properties will therefore be different from the figures reported in Climate Change Risks to Australia’s Coasts.
Nationally, between 187,000 and 274,000 residential buildings are exposed to the combined impact of inundation and shoreline recession at a sea level rise of 1.1 metres (high end scenario for 2100). The value of these assets is between $51 and $72 billion dollars (2008 replacement value). The upper estimate figure is greater than the $63 billion reported in Climate Change Risks to Australia’s Coasts, which did not include the value of buildings potentially exposed to erosion.
Queensland and New South Wales have the most residential buildings exposed to a sea level rise of 1.1 metres (high end scenario for 2100), with between 44,000 and 68,000 residential buildings at risk in each state (Figure 7).
There are also significant numbers of buildings exposed in Victoria and South Australia (31,000–48,000 in each state), Western Australia (20,000–30,000), and Tasmania (12,000–15,000).
Replacement values for these assets range from $15–$20 billion in Queensland; $14–$20 billion in New South Wales; $8–$11 billion in Victoria; $5–$8 billion in each of South Australia and Western Australia; and $4 billion in Tasmania (2008 replacement values).
The replacement values are calculated based on information held in the NEXIS database and are based on average replacement values per state or local government area (where available).
The figures represent the total value of assets at risk, though it should be noted that the extent of damage due to flooding would not always, or often, result in a total replacement of all infrastructure affected.
0
10000
20000
30000
40000
50000
60000
70000
80000
QLD NSW VIC SA WA TAS NT
Tota
l Num
ber o
f Res
iden
tial B
uild
ings
2100 – Upper Estimate 2100 – Lower Estimate
Figure 7: The range of potential risk to residential buildings in Australia for a sea level rise of 1.1 metres.
Pho
to c
redi
t: To
bias
Lan
chen
auer

10 Climate Change Risks to Coastal Buildings and Infrastructure
projecting risk against a changing populationAustralia’s population is projected to increase significantly between now and 2100. The Australian Bureau of Statistics (ABS) has forecast an increase from 21 million in 2007 to between 30.9 and 42.5 million people by 2056, and to between 33.7 and 62.2 million people by 2101 (see Figure 8).3 The ABS projections are based on differing assumptions of fertility, mortality, internal migration and overseas migration.
More recently, the Intergenerational Report 2010 projects that Australia’s population will grow by 65 per cent, to more than 35 million people in 2049.4 Based on current trends much of this growth would be accommodated in coastal settlements and cities.
Figure 8: Population growth projections for Australia 2008–2101. Series B largely reflects current trends in fertility, life expectancy at birth, net overseas migration and net interstate migration. Source: ABS
An analysis of the risk to infrastructure shows how exposure to climate change impacts for residential buildings can change as the population grows (based on current settlement patterns). Figure 9 shows the number of residential buildings exposed to inundation and erosion under a 1.1 metre sea level rise scenario against the 2008 population, the ABS Series A (high), B (business as usual) and C (low) population scenarios. The exposure is significantly increased by the ABS Series A & B population projections. At higher projected population growth (Series A), the increase in population has a greater impact on the number of buildings at risk than the increase in sea level.
References1 Bureau of Transport Economics 2001, Economic costs of natural disasters
in Australia. Report 103, Canberra.
2 Intergovernmental Panel on Climate Change Fourth Assessment Report (AR4, 2007).
2008 Population
Series A (high)
Series B (business as usual)
Series C (low)
Num
ber o
f Bui
ldin
gs a
t Ris
k
0
50000
100000
150000
200000
250000
Lower Upper Lower Upper Lower Upper Lower Upper Lower Upper Lower Upper Lower Upper
QLD NSW VIC SA WA TAS NT
Figure 9: The range of potential risk to residential buildings in Australia for a sea level rise of 1.1 metres for the 2008 population and also for the ABS Series A, B & C population projections.
3 Australian Bureau of Statistics (ABS) 2008, Population Projections, Australia, 2006-2101, catalogue no. 3222.0.
4 Commonwealth Treasury 2010, Intergenerational Report 2010, Australia to 2050: future challenges, http://www.treasury.gov.au/igr/igr2010/report/html/00_Preliminaries.asp.

Climate Change Risks to Coastal Buildings and Infrastructure 11
wes
tern
Aus
tral
ia
0
50
100
150
200
250
300
Port H
edlan
d
Busse
lton
Broome
Wyndh
am-E
ast K
imbe
rley
Bunbu
ry
Coorow
Lower
Upper
No.
of L
ight
Indu
stria
l Bui
ldin
gs
0
100
200
300
400
500
600
Bunbu
ry
Mandu
rah
Busse
lton
Broome
Espera
nce
Cannin
g
Lower
Upper
No.
of C
omm
erci
al B
uild
ings
Analysis by local government area – western Australia
Figure 10: Potential risk to commercial buildings in Western Australia from the combined impact of inundation and shoreline recession by local government area for a 1.1 metre sea level rise scenario.
Between 333 and 496 commercial buildings in the local government area of Bunbury may be affected by a 1.1 metre sea level rise (high end scenario for 2100). The number of exposed commercial buildings in Mandurah (between 242 and 400) and Busselton (between 209 and 260) is also high compared to other Western Australian local government areas. The graph shows the location of more than 85% of the potentially affected commercial buildings in Western Australia, as identified in this analysis.
light Industrial Buildings
Figure 11: Potential risk to light industry in Western Australia from the combined impact of inundation and shoreline recession by local government area for a 1.1 metre sea level rise scenario.
Between 176 and 252 light industrial buildings in the local government areas of Port Hedland and Busselton may be affected by a 1.1 metre sea level rise (high end scenario for 2100). The number of buildings in Broome (between 149 and 183) is also high. The graph shows the location of more than 90% of the potentially affected light industrial buildings in Western Australia, as identified in this analysis.
Commercial Buildings
Leng
th (k
m)
0
5
10
15
20
25
30
Port H
edlan
d
Roebo
urne
Kwinana
Bunbu
ry
Lower
Upper
Leng
th (k
m)
0
500
1,000
1,500
2,000
2,500
Broome
Carnarv
on
Port H
edlan
d
Shark
Bay
Ashbu
rton
Wyndh
am-E
ast K
imbe
rley
Roebo
urne
Busse
lton
Exmou
th
Derby-W
est K
imbe
rley
Lower
Upper
Roads
Figure 12: Potential risk to roads in Western Australia from the combined impact of inundation and shoreline recession by local government area for a 1.1 metre sea level rise scenario.
Roads in the local government areas of Broome (between 1,903 and 2,056 km at risk), Carnarvon (between 794 and 929 km) and Port Hedland (between 562 and 685 km) have a significant exposure with a sea level rise of 1.1 metres (high end scenario for 2100). Between 285 and 348 km of roads in the local government areas of Ashburton, Wyndham-East Kimberley and Busselton are also exposed with a sea level rise of 1.1 metres. Port Hedland has the greatest length of rail exposed, with between 23 and 28 km of rail line at risk. The graphs show the location of about 80% of the potentially affected roads and about 80% of the potentially affected rail in Western Australia, as identified in this analysis.
Figure 13: Potential risk to rail in Western Australia from the combined impact of inundation and shoreline recession by local government area for a 1.1 metre sea level rise scenario.
Rail

12 Climate Change Risks to Coastal Buildings and Infrastructure
Sout
h A
ustr
alia 0
100
200
300
400
500
600
700
800
Port Ade
laide
Enfi
eld
Holdfas
t Bay
Port P
irie C
ity an
d Dist
s
Charle
s Stur
t
Salisb
ury
Lower
Upper
No.
of L
ight
Indu
stria
l Bui
ldin
gs
0
100
200
300
400
500
600
Port Ade
laide
Enfi
eld
Port P
irie C
ity an
d Dist
s
Charle
s Stur
t
Port Aug
usta
Grant
Port Li
ncoln
Kingsto
n
Onkap
aring
a
Lower
Upper
No.
of C
omm
erci
al B
uild
ings
Analysis by local government area – South Australia
Figure 14: Potential risk to commercial buildings in South Australia from the combined impact of inundation and shoreline recession by local government area for a 1.1 metre sea level rise scenario.
Between 265 and 506 commercial buildings in the local government area of Port Adelaide Enfield may be affected by a 1.1 metre sea level rise (high end scenario for 2100). The number of exposed commercial buildings in Port Pirie (between 92 and 171), Charles Sturt (between 87 and 141) and Port Augusta (between 60 and 134) is also high compared to other South Australian local government areas. The graph shows the location of about 80% of the potentially affected commercial buildings in South Australia, as identified in this analysis.
light Industrial Buildings
Figure 15: Potential risk to light industry in South Australia from the combined impact of inundation and shoreline recession by local government area for a 1.1 metre sea level rise scenario.
Between 200 and 692 light industrial buildings in the local government area of Port Adelaide Enfield may be affected by a 1.1 metre sea level rise (high end scenario for 2100). The number of exposed buildings in Holdfast Bay (between 118 and 121) is also high compared to other South Australian local government areas. The graph shows the location of about 95% of the potentially affected light industrial buildings in South Australia, as identified in this analysis.
Commercial Buildings
Leng
th (k
m)
0
10
20
30
40
50
60
Port Ade
laide
Enfi
eld
Port P
irie C
ity an
d Dist
s
Port Aug
usta
Mount
Remark
able
Uninco
rporat
ed S
A
Salisb
ury
Lower
Upper
Leng
th (k
m)
0100200300400500600700800900
Yorke
Pen
insula
The C
ooron
g
Uninco
rporat
ed S
A
Kingsto
n
Port P
irie C
ity an
d Dist
s
Port Ade
laide
Enfi
eld
Cedun
a
Charle
s Stur
t
Streak
y Bay
Robe
Lower
Upper
Roads
Figure 16: Potential risk to roads in South Australia from the combined impact of inundation and shoreline recession by local government area for a 1.1 metre sea level rise scenario.
Roads in the local government areas of Yorke Peninsula (between 670 and 765 km at risk) and The Coorong (between 595 and 730 km) have a significant exposure with a sea level rise of 1.1 metres (high end scenario for 2100). Between 160 and 269 km of roads in the local government areas Port Adelaide Enfield and Charles Sturt are also exposed with a sea level rise of 1.1 metres. Port Adelaide Enfield has the greatest length of rail exposed, with between 38 and 48 km of rail line at risk. The graphs show the location of about 75% of the potentially affected roads and about 80% of the potentially affected rail in South Australia, as identified in this analysis.
Figure 17: Potential risk to rail in South Australia from the combined impact of inundation and shoreline recession by local government area for a 1.1 metre sea level rise scenario.
Rail

Climate Change Risks to Coastal Buildings and Infrastructure 13
tasm
ania
0
10
20
30
40
50
60
70
80
Burnie
Laun
cesto
n
Hobart
Centra
l Coa
st
Lower
Upper
No.
of L
ight
Indu
stria
l Bui
ldin
gs
0
10
20
30
40
50
60
70
Huon V
alley
Hobart
Burnie
George
Town
Lower
Upper
No.
of C
omm
erci
al B
uild
ings
Analysis by local government area – tasmania
Figure 18: Potential risk to commercial buildings in Tasmania from the combined impact of inundation and shoreline recession by local government area for a 1.1 metre sea level rise scenario.
Between 35 and 65 commercial buildings in the local government area of Huon Valley and between 56 and 58 commercial buildings in Hobart may be affected by a 1.1 metre sea level rise (high end scenario for 2100). The graph shows the location of nearly 80% of the potentially affected commercial buildings in Tasmania, as identified in this analysis.
light Industrial Buildings
Figure 19: Potential risk to light industry in Tasmania from the combined impact of inundation and shoreline recession by local government area for a 1.1 metre sea level rise scenario.
Between 63 and 71 light industrial buildings in the local government area of Burnie may be affected by a 1.1 metre sea level rise (high end scenario for 2100). The number of exposed buildings in Launceston (between 33 and 62) is also high. The graph shows the location of about 80% of the potentially affected light industrial buildings in Tasmania, as identified in this analysis.
Commercial Buildings
0 5
10 15 20 25 30 35 40 45 50
Burnie
Devon
port
Centra
l Coa
st
Waratah
/Wyn
yard
Leng
th (k
m)
Lower
Upper
Leng
th (k
m)
0
50
100
150
200
250
300
Flinde
rs
Glamorg
an/S
pring
Bay
Circula
r Hea
d
Claren
ce
Break O
'Day
Huon V
alley
Kingbo
rough
Lower
Upper
Roads
Figure 20: Potential risk to roads in Tasmania from the combined impact of inundation and shoreline recession by local government area for a 1.1 metre sea level rise scenario.
Roads in the local government areas of Flinders (between 222 and 266 km at risk) and Glamorgan/Spring Bay (between 211 and 243 km) have a significant exposure with a sea level rise of 1.1 metres (high end scenario for 2100). Burnie has the greatest length of rail exposed, with between 42 and 46 km of rail line at risk. The graphs show the location of about 70% of the potentially affected road and about 85% of the potentially affected rail in Tasmania, as identified in this analysis.
Figure 21: Potential risk to rail in Tasmania from the combined impact of inundation and shoreline recession by local government area for a 1.1 metre sea level rise scenario.
Rail
14 Climate Change Risks to Coastal Buildings and Infrastructure
vict
oria
0
50
100
150
200
250
300
350
400
Greater
Gee
long
Franks
ton
Kingsto
n
Morning
ton P
enins
ula
Hobso
ns B
ay
Lower
Upper
No.
of L
ight
Indu
stria
l Bui
ldin
gs
0
50
100
150
200
250
300
350
400
450
Surf C
oast
East G
ippsla
nd
Mariby
rnong
Kingsto
n
Franks
ton
Morning
ton P
enins
ula
Greater
Gee
long
Port P
hillip
Melbou
rne
Hobso
ns B
ay
Lower
Upper
No.
of C
omm
erci
al B
uild
ings
Analysis by local government area – victoria
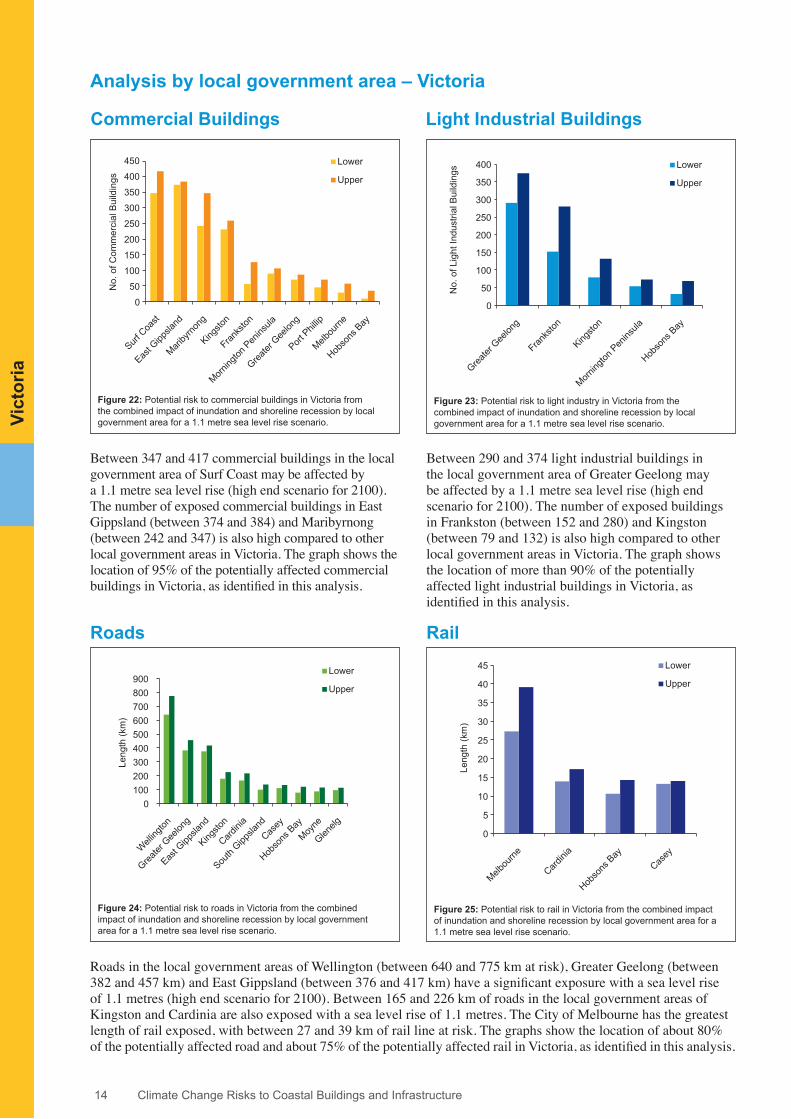
Figure 22: Potential risk to commercial buildings in Victoria from the combined impact of inundation and shoreline recession by local government area for a 1.1 metre sea level rise scenario.
Between 347 and 417 commercial buildings in the local government area of Surf Coast may be affected by a 1.1 metre sea level rise (high end scenario for 2100). The number of exposed commercial buildings in East Gippsland (between 374 and 384) and Maribyrnong (between 242 and 347) is also high compared to other local government areas in Victoria. The graph shows the location of 95% of the potentially affected commercial buildings in Victoria, as identified in this analysis.
light Industrial Buildings
Figure 23: Potential risk to light industry in Victoria from the combined impact of inundation and shoreline recession by local government area for a 1.1 metre sea level rise scenario.
Between 290 and 374 light industrial buildings in the local government area of Greater Geelong may be affected by a 1.1 metre sea level rise (high end scenario for 2100). The number of exposed buildings in Frankston (between 152 and 280) and Kingston (between 79 and 132) is also high compared to other local government areas in Victoria. The graph shows the location of more than 90% of the potentially affected light industrial buildings in Victoria, as identified in this analysis.
Commercial Buildings
0
5
10
15
20
25
30
35
40
45
Melbou
rne
Cardini
a
Hobso
ns B
ay
Casey
Lower
Upper
Leng
th (k
m)
Leng
th (k
m)
0100200300400500600700800900
Welling
ton
Greater
Gee
long
East G
ippsla
nd
Kingsto
n
Cardini
a
South
Gippsla
nd
Casey
Hobso
ns B
ay
Moyne
Glenelg
Lower
Upper
Roads
Figure 24: Potential risk to roads in Victoria from the combined impact of inundation and shoreline recession by local government area for a 1.1 metre sea level rise scenario.
Roads in the local government areas of Wellington (between 640 and 775 km at risk), Greater Geelong (between 382 and 457 km) and East Gippsland (between 376 and 417 km) have a significant exposure with a sea level rise of 1.1 metres (high end scenario for 2100). Between 165 and 226 km of roads in the local government areas of Kingston and Cardinia are also exposed with a sea level rise of 1.1 metres. The City of Melbourne has the greatest length of rail exposed, with between 27 and 39 km of rail line at risk. The graphs show the location of about 80% of the potentially affected road and about 75% of the potentially affected rail in Victoria, as identified in this analysis.
Figure 25: Potential risk to rail in Victoria from the combined impact of inundation and shoreline recession by local government area for a 1.1 metre sea level rise scenario.
Rail

Climate Change Risks to Coastal Buildings and Infrastructure 15
new
Sou
th w
ales
0
20
40
60
80
100
120
140
160
180
Shellh
arbou
r
Newca
stle
Sutherl
and S
hire
Wollon
gong
Rockd
ale
Port S
tephe
ns
Wyong
Gosfor
d
Lake
Mac
quari
e
Lower
Upper
No.
of L
ight
Indu
stria
l Bui
ldin
gs
Lower
Upper
0
50
100
150
200
250
Wollon
gong
Newca
stle
Eurobo
dalla
Lake
Mac
quari
e
Shoalh
aven
Shellh
arbou
r
Botany
Bay
Gosfor
d
Bega V
alley
Great L
akes
No.
of C
omm
erci
al B
uild
ings
Analysis by local government area – new South wales
Figure 26: Potential risk to commercial buildings in New South Wales from the combined impact of inundation and shoreline recession by local government area for a 1.1 metre sea level rise scenario.
light Industrial Buildings
Figure 27: Potential risk to light industry in New South Wales from the combined impact of inundation and shoreline recession by local government area for a 1.1 metre sea level rise scenario.
Commercial Buildings
Between 153 and 203 commercial buildings in the local government area of Wollongong may be affected by a 1.1 metre sea level rise (high end scenario for 2100). The number of exposed commercial buildings in Newcastle (between 72 and 158), Eurobodalla (between 118 and 140), Lake Macquarie (between 59 and 108) and Shoalhaven (between 66 and 95) is also high compared to other local government areas in New South Wales. The graph shows the location of about 75% of the potentially affected commercial buildings in New South Wales, as identified in this analysis.
Between 110 and 157 light industrial buildings in the local government area of Shellharbour may be affected by a 1.1 metre sea level rise (high end scenario for 2100). The number of exposed buildings in Newcastle (between 89 and 136) and Sutherland Shire (between 81 and 120) is also high compared to other local government areas in New South Wales. The graph shows the location of more than 80% of the potentially affected light industrial buildings in New South Wales, as identified in this analysis.
0
10
20
30
40
50
60
Newca
stle
Wollon
gong
Kiama
Shoalh
aven
Lower
Upper
Leng
th (k
m)
Leng
th (k
m)
0 50
100 150 200 250 300 350 400 450 500
Claren
ce Vall
ey
Port S
tephe
ns
Shoalh
aven
Greater
Taree
Great L
akes
Kemps
ey
Twee
d
Port M
acqu
arie-H
astin
gs
Lake
Mac
quari
e
Wollon
gong
Lower
Upper
Roads
Figure 28: Potential risk to roads in New South Wales from the combined impact of inundation and shoreline recession by local government area for a 1.1 metre sea level rise scenario.
Roads in the local government areas of Clarence Valley (between 285 and 443 km at risk), Port Stephens (between 275 and 345 km) and Shoalhaven (between 289 and 344 km) have a significant exposure with a sea level rise of 1.1 metres (high end scenario for 2100). Between 210 and 332 km of roads in the local government areas of Greater Taree and Great Lakes are also exposed with a sea level rise of 1.1 metres. Newcastle (between 49 and 56 km of rail line at risk) and Wollongong (between 43 and 51 km) have the greatest length of rail exposed. The graphs show the location of about 80% of the potentially affected roads and nearly 75% of the potentially affected rail in New South Wales, as identified in this analysis.
Figure 29: Potential risk to rail in New South Wales from the combined impact of inundation and shoreline recession by local government area for a 1.1 metre sea level rise scenario.
Rail

16 Climate Change Risks to Coastal Buildings and Infrastructure
Commercial buildings in the local government areas of Gold Coast (between 166 and 243), Moreton Bay (between 155 and 226) and Fraser Coast (between 167 and 213) may be affected by a 1.1 metre sea level rise (high end scenario for 2100). The number of exposed commercial buildings in Townsville (between 117 and 199) and Mackay (between 95 and 193) is also high compared to other local government areas in Queensland. The graph shows the location of nearly 90% of the potentially affected commercial buildings in Queensland, as identified in this analysis.
Que
ensl
and
0
100
200
300
400
500
600
Macka
y
Moreton
Bay
Brisba
ne
Gold C
oast
Towns
ville
Bunda
berg
Rockh
ampto
n
Fraser
Coast
Sunsh
ine C
oast
Whit
sund
ay
Lower
Upper
No.
of L
ight
Indu
stria
l Bui
ldin
gs
0
50
100
150
200
250
300
Gold C
oast
Moreton
Bay
Fraser
Coast
Towns
ville
Macka
y
Bunda
berg
Sunsh
ine C
oast
Lower
Upper
No.
of C
omm
erci
al B
uild
ings
Analysis by local government area – Queensland
Figure 30: Potential risk to commercial buildings in Queensland from the combined impact of inundation and shoreline recession by local government area for a 1.1 metre sea level rise scenario.
light Industrial Buildings
Figure 31: Potential risk to light industry in Queensland from the combined impact of inundation and shoreline recession by local government area for a 1.1 metre sea level rise scenario.
Between 336 and 502 light industrial buildings in the local government area of Mackay may be affected by a 1.1 metre sea level rise (high end scenario for 2100). The number of exposed buildings in Moreton Bay (between 156 and 250) and Brisbane (between 160 and 247) is also high compared to other local government areas in Queensland. The graph shows the location of more than 95% of the potentially affected light industrial buildings in Queensland, as identified in this analysis.
Commercial Buildings
Roads in the local government areas of Mackay and Fraser Coast (between 352 and 475 km at risk in each area), Gold Coast (between 301 and 408 km), and Rockhampton (between 305 and 395 km) have a significant exposure with a sea level rise of 1.1 metres (high end scenario for 2100). Burdekin has the greatest length of rail exposed, with between 78 and 104 km of rail line at risk. Between 33 and 69 km of rail lines in the local government areas of Mackay, Bundaberg, Rockhampton and Whitsunday are also exposed. The graphs show the location of more than 90% of the potentially affected roads and nearly 90% of the potentially affected rail in Queensland, as identified in this analysis.
Roads
0
20
40
60
80
100
120
Burdek
in
Bunda
berg
Whit
sund
ay
Towns
ville
Cairns
Macka
y
Rockh
ampto
n
Sunsh
ine C
oast
Isaac
Hinchin
brook
Lower
Upper
Leng
th (k
m)
Figure 33: Potential risk to rail in Queensland from the combined impact of inundation and shoreline recession by local government area for a 1.1 metre sea level rise scenario.
050
100150200250300350400450500
Macka
y
Fraser
Coast
Gold C
oast
Rockh
ampto
n
Moreton
Bay
Burdek
in
Bunda
berg
Towns
ville
Carpen
taria
Sunsh
ine C
oast
Lower
Upper
Leng
th (k
m)
Figure 32: Potential risk to roads in Queensland from the combined impact of inundation and shoreline recession by local government area for a 1.1 metre sea level rise scenario.
Rail

