climate change risk assessment for the business, industry and
TRANSCRIPT

(Defra Project Code GA0204)
Climate Change Risk Assessment for the Business, Industry and Services Sector
January 2012 1Baglee, A., 1Haworth, A. and 2Anastasi, S. Contractors: HR Wallingford
1Acclimatise 2AMEC Environment & Infrastructure UK Ltd (formerly Entec UK Ltd) The Met Office Collingwood Environmental Planning Alexander Ballard Ltd Paul Watkiss Associates Metroeconomica

ii Business, Industry and Services
Statement of use See full statement of use on Page v Keywords: Climate, risks, business, tourism, financial services, industry Research contractor: HR Wallingford Howbery Park, Wallingford, Oxon, OX10 8BA Tel: +44 (0)1491 835381 (For contractor quality control purposes this report is also numbered EX 6433) Defra project officer: Dominic Rowland Defra contact details: Adapting to Climate Change Programme, Department for Environment, Food and Rural Affairs (Defra) Area 3A Nobel House 17 Smith Square London SW1P 3JR
Tel: 020 7238 3000 www.defra.gov.uk/adaptation Document History:
Date Release Prepared Notes 07/10/10 0.1 Entec UK Ltd Review copy for project team only 11/11/10 0.2 Entec UK Ltd Revised review copy for project
team only 22/11/10 1.0 HR Wallingford / Entec UK Ltd Draft for review
24/11/10 1.1 HR Wallingford / Entec UK Ltd.
Acclimatise Draft for peer review
01/02/11 2.0 HR Wallingford / Acclimatise Updated in response to peer review and Government Department review comments
31/03/11 3.0 HR Wallingford / Acclimatise Additional work added and updated in response to further review comments
13/05/11 3.0A HR Wallingford High-level concerns identified by Government Departments added (to be addressed in Release 4).
14/06/11 3.0A2 HR Wallingford Minor amendments
12/08/11 4.0 Acclimatise / HR Wallingford Major re-write: draft for external publication
21/10/11 4A Acclimatise / HR Wallingford Updated draft in response to comments
05/12/11 5 Acclimatise / HR Wallingford Updated draft in response to comments
13/01/12 6 Acclimatise / HR Wallingford Updated with final edits.

Business, Industry and Services iii
© Crown copyright 2012 You may use and re-use the information featured in this document/publication (not including logos) free of charge in any format or medium, under the terms of the Open Government Licence http://www.nationalarchives.gov.uk/doc/open-government-licence/open-government-licence.htm Any email enquiries regarding the use and re-use of this information resource should be sent to: [email protected]. Alternatively write to The Information Policy Team, The National Archives, Kew, Richmond, Surrey, TW9 4DU. Printed on paper containing 75% recycled fibre content minimum. This report is available online at: http://www.defra.gov.uk/environment/climate/government/

iv Business, Industry and Services

Business, Industry and Services v
Statement of use This report presents the research completed as part of the UK Climate Change Risk Assessment (CCRA) for a selected group of risks in the Business, Industry and Services sector. Whilst some broader context is provided, it is not intended to be a definitive or comprehensive analysis of the sector.
Before reading this report it is important to understand the process of evidence gathering for the CCRA.
The CCRA methodology is novel in that it has compared over 100 risks (prioritised from an initial list of over 700) from a number of disparate sectors based on the magnitude of the consequences and confidence in the evidence base. A key strength of the analysis is the use of a consistent method and set of climate projections to look at current and future threats and opportunities.
The CCRA methodology has been developed through a number of stages involving expert peer review. The approach developed is a tractable, repeatable methodology that is not dependent on changes in long term plans between the 5 year cycles of the CCRA.
The results, with the exception of population growth where this is relevant, do not include societal change in assessing future risks, either from non-climate related change, for example economic growth, or developments in new technologies; or future responses to climate risks such as future Government policies or private adaptation investment plans.
Excluding these factors from the analysis provides a more robust ‘baseline’ against which the effects of different plans and policies can be more easily assessed. However, when utilising the outputs of the CCRA, it is essential to consider that Government and key organisations are already taking action in many areas to minimise climate change risks and these interventions need to be considered when assessing where further action may be best directed or needed.
Initially, eleven ‘sectors’ were chosen from which to gather evidence: Agriculture; Biodiversity & Ecosystem Services; Built Environment; Business, Industry & Services; Energy; Forestry; Floods & Coastal Erosion; Health; Marine & Fisheries; Transport; and Water.
A review was undertaken to identify the range of climate risks within each sector. The review was followed by a selection process that included sector workshops to identify the most important risks (threats or opportunities) within the sector. Approximately 10% of the total number of risks across all sectors was selected for more detailed consideration and analysis.
The risk assessment used UKCP09 climate projections to assess future changes to sector risks. Impacts were normally analysed using single climate variables, for example temperature.
A final Evidence Report draws together information from the 11 sectors (as well as other evidence streams) to provide an overview of risk from climate change to the UK.
Neither this report nor the Evidence Report aims to provide an in depth, quantitative analysis of risk within any particular ‘sector’. Where detailed analysis is presented using large national or regional datasets, the objective is solely to build a consistent picture of risk for the UK and allow for some comparison between disparate risks and regional/national differences.

vi Business, Industry and Services
This is a UK risk assessment with some national and regional comparisons. The results presented here should not be used by the reader for re-analysis or interpretation at a local or site-specific scale.
In addition, as most impacts were analysed using single climate variables, the analysis may be over-simplified in cases where the consequence of climate change is caused by more than one climate variable (for example, higher summer temperatures combined with reduced summer precipitation).

Business, Industry and Services vii
Executive Summary This report for the Business, Industry and Services sector of the UK Climate Change Risk Assessment (CCRA) has used available evidence and expert opinion to consider the effects of climate change for this sector. The aim of the CCRA is to help the UK and devolved Governments identify priorities for action and implement necessary adaptation measures. The CCRA focuses on 11 sectors deemed as fundamental to the social, environmental and economic value in the UK, including the Business, Industry and Services sector. This assessment utilised the following sub-sectors as illustrative examples to highlight the range of climate-related issues and challenges the sector as a whole faces: financial services; tourism; food and beverage manufacturing; primary extractives (oil, gas and mining); and chemical manufacturing. Selection of these sub-sectors was effectively a sector based case study approach to illustrate the key business issues and provide a wide variety of characteristics that can be used as proxies for other sub-sectors.
Climate change is expected to be a key challenge for the Business, Industry and Services sector, both today and in the future. Failure to consider climate risk and adaptation into decision-making processes could have severe consequences for this sector with further impacts felt across all other sectors. Climate change does not necessarily create ‘new’ risks for the Business, Industry and Services sector. Climate change typically represents a change to existing risk profiles – in other words they are already issues facing business and industry on a daily basis. For example, storm-related impacts to transport infrastructure, on which business heavily relies, have already been experienced. Climate change simply represents a potential change in the duration and/ or frequency of occurrence of these impacts, and their subsequent effects on business operations.
Key messages
Climate change represents a challenge for the Business, Industry and Services sector, with both tangible and intangible asset value potentially affected. However, for those businesses that take on this challenge, there are potentially significant commercial and competitive advantages to be gained.
The Business, Industry and Services sector is vulnerable to climate change due to the combination of the sector’s climate sensitivity and adaptive capacity. Although the majority of the risks identified in this risk assessment fall into the category of climate sensitivity, a number of risks to the sector are the result of low adaptive capacity, and in particular, a low recognition of the need to act on climate change. This crucially needs addressing in order to minimise the potential risks and seize opportunities.
The Business, Industry and Services sector does not operate in a void; this report has highlighted the inter-connectivity between business and industry, national infrastructure provision and the natural environment. Any adaptation actions need to remain cognisant of these important inter-connections, considering any possible feedbacks and knock-on consequences.
The Business, Industry and Services sector is influenced to a very large degree by international issues including investments, supply of products and materials and international markets. Many of these are influenced by present-day climate and may be influenced by future climate change to

viii Business, Industry and Services
some degree. These externalities (whether in the UK or overseas) are vitally important for business continuity and growth and need to be fully explored and mapped.
Vulnerability of the sector to climate change The Business, Industry and Services sector is highly vulnerable to a changing climate, both extreme (acute) events and incremental (chronic) climate change. The impacts are likely to be felt across the spectrum of sub-sectors and from Small and Medium Enterprises (SMEs) to large multi-national corporations. The degree to which individual organisations are vulnerable to climate change depends on their level of sensitivity and adaptive capacity (both these elements are discussed in more detail below). Across the sector, current vulnerability to climate-related impacts can be divided into the following common themes:
Assets: Fixed and workforce (e.g. infrastructure damage, workforce exposure to health and safety risks).
Operations: Supply of services, customer demand and regulatory environment (e.g. financial performance, markets shift due to change in public attitudes and / or legislation).
Procurement: Raw materials, supply chain and logistics (e.g. supply of water, energy and materials, reliance on vulnerable transport networks).
Environment: Natural and built, plus local community (e.g. climate-sensitive resources and conflict over their use).
These impacts have the potential to create the following consequences for individual businesses and collective sub-sectors within the Business, Industry and Services sector:
Financial performance (revenue loss / gain)
Additional costs (capital expenditure (capex) and operational expenditure (opex))
Operational disruption
Loss of staff work hours
Corporate reputation
Elevated stakeholder interest
Additional regulatory requirements
Contractual issues
Litigation
New market opportunities and product diversification.
Climate change risks and opportunities for the sector The initial scoping of climate-related impacts to the Business, Industry and Services sector (termed the ‘Tier 1 analysis’) identified more than 120 risks. These risks were subsequently scored, based on the magnitude of consequence for economic, environmental and social categories, together with the likelihood of the consequence

Business, Industry and Services ix
occurring, and the highest scoring or ‘key’ risks were selected for more detailed analysis (termed the ‘Tier 2 analysis’). This report presents the findings of the Tier 2 analysis. The key risks identified for the Business, Industry and Services sector were:
1. Reduced returns for UK financial institutions’ investments due to the absence of mainstreaming climate risk and adaptation into decision-making processes (BU1).
2. An increase in monetary losses as a result of an increasing proportion of UK tourist assets (natural and built) at risk from flooding (BU2).
3. A decrease in water (groundwater and surface water) availability for industrial usage (BU3).
4. An increase in monetary losses as a result of interruption to business from flooding (BU4).
5. A decrease in productivity and revenues due to ICT loss/ disruption (BU5)
6. Increased exposure for mortgage lenders (BU6).
7. An increase in insurance industry exposure due to flooding (BU7).
8. An expansion of new or existing tourist destinations in the UK (BU8).
9. A decrease in output for UK businesses due to an increase in supply chain disruption as a result of extreme events (BU9).
10. Loss of staff hours due to high internal building temperatures (BU10).
The assessment team believes that these risks, identified as a result of the scoring methodology, are consistent with those typically expected for Business, Industry and Services. They are also consistent with comments made by stakeholders on their perception of the ‘top’ risks to this sector in the UK, albeit without consideration of the wider international perspective (e.g. global supply chains).
Sensitivity Knowledge of the sensitivity of both the sector as a whole and the assessment end-point risks to particular climate variables is of enormous value in determining the likely future response under a changing climate. The five sub-sectors of Business, Industry and Services sector that this report focuses on are highlighted as having a number of features that make them particularly sensitive to the physical effects of climate change. These include reliance on:
Large fixed assets (e.g. chemical manufacturing near large main rivers or coastline)
Complex supply chains (e.g. food and beverages)
Natural assets (e.g. tourism).
It is important to stress that it should not be assumed that these sub-sectors would bear the majority of the risks from climate change.
The climate sensitivities of the key risks identified for the Business, Industry and Services sector are summarised in the table below. The table also shows whether the risks are direct or indirect result of climate change.

x Business, Industry and Services
Risk Sensitivity to climate change
Reduced returns and/or increased risks of UK financial institutions’ investments due to the absence of mainstreaming climate risk and adaptation into decision-making processes (BU1).
Indirect impact
At the moment, there is limited substantive evidence of the consequences of changes in climate on UK financial institutions. It is difficult to establish a clear and direct link between climate-related impacts and financial institution performance. Research strongly shows, however, that the sector faces considerable risks that could potentially be material to investment return and/or risk. Further, there is recognition by researchers, stakeholders and financial institutions themselves that sensitivity to some of the risks of climate change could be high in the short term. It is the case of the reputational implications of a changing climate, as well as the investor pressures for climate change adaptation disclosure and mainstreaming. As such, the exposure of financial institutions to climate change is known, but uncertainties are too high and available information too limited to quantify risks.
An increase in monetary losses as a result of an increasing proportion of UK tourist assets (natural and built) at risk from flooding (BU2).
Indirect impact
The financial implications for the tourism industry are directly linked to the number of tourist assets at risk of flooding. This risk is relatively sensitive to climate change, and in particular, ‘extreme events’ in the short term. Over a long time period, incremental sea level rise may exacerbate this issue further and thus the risk may become more frequent and less associated with ‘extreme’ events. Some amelioration of the risk may be afforded, however, through insurance and other risk transfer methods.
A decrease in water (groundwater and surface water) availability for industrial usage (BU3).
Direct impact
There is a strong and obvious link between water resources availability and precipitation. However, this ought to be put within the context of Public Water Supply (PWS) abstraction, which constitutes the vast majority of the water abstracted in the UK. As such, the availability of water for industrial applications may be more a function of the effectiveness of water resource management for PWS in making efficiency savings that allow for industrial abstractors to maintain operations.
An increase in monetary losses as a result of interruption to business from flooding (BU4).
Indirect impact
Like tourism assets, the risk of fluvial and tidal flooding is relatively sensitive to climate change, and in particular, ‘extreme events’. Over a long time period, incremental sea level rise and projected increases in rainfall may exacerbate this issue further and thus the risk may become more frequent and less associated with ‘extreme’ events.
A decrease in productivity and revenues due to ICT loss/ disruption (BU5).
Indirect impact
Both incremental and extreme events may play a part in the loss of ICT productivity. Although the majority of ICT equipment will operate well within the projected climatic ranges for temperature and humidity, it is recognised in this assessment that the risks for remote rural workers are most pronounced where there is greatest reliance on single electricity and telecommunications connections. Moreover, this risk is relatively sensitive to climate change, and in particular, ‘extreme events’ such as flooding.
Increased exposure for mortgage lenders (BU6).
Indirect impact
This risk is relatively insensitive to climate change due to the fact that there is not a direct link between a changing climate and the provision of mortgages. The availability of insurance cover is an important ‘middle-step’ and this will be subject to economic forces and risk management practices within the insurance sector. As such, any effect on mortgage lending will be the result of a complex interaction of physical climatic effects, incidents of flooding and an economic and societal response.
An increase in insurance industry exposure due to flooding (BU7).
Indirect impact
As per the risk above, this risk is also relatively insensitive to direct climate change effects as this will be the result of a complex interaction of physical climatic effects, incidents of flooding and an economic (insurance) and societal response.

Business, Industry and Services xi
Risk Sensitivity to climate change
An expansion of new or existing tourist destinations in the UK (BU8).
Indirect impact
With its close connections to the environment and climate itself, tourism is considered to be highly sensitive to climate. This is especially the case for this opportunity, because an increase in the attractiveness of the UK as a “sun, sea and sand” tourism destination is dependent on ameliorating climatic conditions (increased temperature and decreased precipitation).
A decrease in output for UK businesses due to an increase in supply chain disruption as a result of extreme events (BU9).
Indirect impact
Because supply chains are complex and dependent on a network of interconnected, yet independent, elements, it is not possible to develop a clear and direct causal link between climate change and supply chain disruption. Many climatic factors (e.g. heat, precipitation, melting, flooding) can break supply chains, making a single response function too simplistic.
Loss of staff hours due to high internal building temperatures (BU10).
Direct impact
High temperatures in the workplace have shown to affect productivity. There is a clear link with temperature, although other parameters such as humidity and ventilation are also important. As such, there is a high degree of sensitivity to climate change and the ability to adapt is likely to vary across the business and industry sector.
A high-level summary of the numerical results and associated costs for each risk analysed in this assessment are presented in the table below.
Risk Numerical results and costs
Reduced returns and/or increased risks of UK financial institutions’ investments due to the absence of mainstreaming climate risk and adaptation into decision-making processes (BU1).
Unavailable (qualitative assessment only)
An increase in monetary losses as a result of an increasing proportion of UK tourist assets (natural and built) at risk from flooding (BU2).
Impact of sea level rise on UK beach area: 3 – 16 km2 of beach is projected to be lost by the 2020s, 12 – 61 km2 (or 3%-7% of total beach area) by the 2080s.
Number of tourist visitor attractions and facilities at risk of flooding (Flood Zone 3) in England: 33,069 buildings. Preventative expenditure, through cost of flood bunds around buildings: £9 million by 2050s and £18 million by 2080s.
A decrease in water (groundwater and surface water) availability for industrial usage (BU3).
Modelled flow reduction scenarios: between 2% to 3% decrease for industrial abstractions by the 2080s. Change in total value of industrial abstractions that may be prevented if catchments switch from being sustainable to unsustainable in England and Wales: £3.5 million across all time periods.
An increase in monetary losses as a result of interruption to business from flooding (BU4).
Estimated average annual cost to businesses from disruption due to flooding: £24-50 million by the 2020s, £26-72 million by the 2050s and £34-96 million by the 2080s (current figure: £20 million).
A decrease in productivity and revenues due to ICT loss/ disruption (BU5).
Unavailable (qualitative assessment only)
Increased exposure for mortgage lenders (BU6).
Number of residential properties in England and Wales at “significant likelihood” of fluvial and tidal flooding: between 530,000 and 1.5 million by the 2050s and between 700,000 and 2.1 million by the 2080s. Mortgage fund value at risk: £1 to 8 billion and £2 to 9 billion by the 2050s and 2080s, respectively.
An increase in insurance industry exposure due to flooding (BU7).
Annual insurance payout costs for flooding in the UK could increase from a present-day annual average of £200 - £300 million, to £250-400 million by the 2020s and £0.5-1 billion by the 2080s.
An expansion of new or existing tourist destinations in the UK (BU8).
Unavailable (qualitative assessment only)

xii Business, Industry and Services
Risk Numerical results and costs
A decrease in output for UK businesses due to an increase in supply chain disruption as a result of extreme events (BU9).
Unavailable (qualitative assessment only)
Loss of staff hours due to high internal building temperatures (BU10).
Productivity losses due to workplace overheating: between 110% and 230% increase in staff days lost compared to baseline by the 2020s, 140-860% by the 2050s and 150-2,800% by the 2080s. This equates to financial losses of £1.1 billion to £15.2 billion by the 2080s (current estimate: £0.77 billion).
Adaptive capacity The ability of organisations to adapt to climate change is highly variable across the Business, Industry and Services sector and presents a particular challenge to this sector. Despite the large international body of evidence that suggests climate change is a reality, there is still a great deal of inertia within business and industry, with many companies solely considering climate change as a future issue.
There are a number of large, well-resourced and innovative national and multi-national companies based in the UK that are taking climate change adaptation seriously and therefore can demonstrate a high degree of sophistication in terms of climate change risk and opportunity management. On the other hand, the vast majority of organisations have yet to recognise climate change as a material risk, and if they have recognised it, it may only be considered as a long-term, future risk with little relevance to today’s challenges.
Interdependencies The Business, Industry and Services sector is intimately linked to all the other sectors included in the CCRA. From marine and fisheries to built environment, from biodiversity and ecosystem services to transport, business is reliant upon and supports many of the other sectors of the CCRA. Through this assessment, there have been a number of strong linkages that have been discussed; essentially the link between business and the strategic importance of national infrastructure (e.g. roads, rail, energy, telecommunications), as well as the importance of the natural environment (e.g. beaches to attract tourist visitors, or water resource availability for industrial abstraction). The message is clear, business does not operate in a void – these externalities (whether in the UK or overseas) are vitally important for business continuity and growth.
There are also a number of other business value drivers that are important to the Business, Industry and Services sector, such as exchange rates, changes in markets (e.g. consumer expectations), the cost of capital, changes in regulations and Government policy, changing patterns of labour, cost of energy and raw materials. These drivers may all be affected to a greater or lesser degree by climate change, and that these changes will vary going forward. Further analysis is required to understand the climate change effects on these drivers and therefore the overall cumulative effect (adverse or beneficial) for business as a whole.
On the international stage, UK business is once again intimately linked. The growth in globalisation and international supply chains means that there is a high dependence on a global response to climate change adaptation. In fact, the notion of a UK ‘only’ CCRA for business is not representative of the global market in which the UK operates. Climate change is a global problem, affecting UK-based companies working solely in the UK through to UK-listed multinational corporations that have interests in many of

Business, Industry and Services xiii
the countries that will face more severe climate change impacts than the UK. The UK tourist operators’ international interests are a good case in point.
Challenges to overcome In comparison to some other sectors (e.g. water or energy), the Business, Industry and Services sector is typified by a lack of available quantitative data on the potential impacts of climate change. Information that is currently collected is often considered commercially sensitive and remains undisclosed for confidentiality purposes. There is no regulatory requirement on most businesses to report on risks associated with either current and future impacts of climate change on its sector, or on its proposals for adapting to climate change (other than for those organisations who will report under the Adaptation Reporting Power). Some organisations disclose climate change-related information, however, under initiatives such as the Carbon Disclosure Project (CDP).
The report has identified a number of important challenges the Business, Industry and Services sector and Government needs to overcome. These are broadly aligned with a recent publication from the CBI1. In this document, the CBI identifies a number of challenges for business and industry, including:
The challenge of mainstreaming climate change considerations into standard business practices.
Meeting adaptation goals whilst maintaining other corporate goals with respect to sustainability.
There will be an increasing expectation for corporate reporting to disclose material climate-related risks.
Some businesses will be challenged to ‘go it alone’ and the sharing of non-commercially sensitive climate change adaptation information within or across should be encouraged.
Challenges to business will cover six key areas – supply chains, assets, operations, markets, regulatory compliance and business reputation.
To overcome these challenges and provide a robust link between the physical impacts of climate and the risks facing the Business, Industry and Services sector, numerous parties will need to be involved, including climate scientists, risk analysts, the private sector and Government. Individual businesses, and particularly those organisations with a naturally low adaptive capacity, will require a great deal of information sharing and support. Without this, there will be a constant challenge for business and industry to effectively adapt to climate change, build long-term resilience and take the competitive advantage.
1 CBI, 2010. ‘Whatever the weather: managing the risks from a changing climate’

xiv Business, Industry and Services

Business, Industry and Services xv
Key Term Glossary The key terms are defined below.
Adaptation (IPCC AR4, 2007)
Autonomous adaptation – Adaptation that does not constitute a conscious2 response to climatic stimuli but is triggered by ecological changes in natural systems and by market or welfare changes in human systems. Also referred to as spontaneous adaptation.
Planned adaptation – Adaptation that is the result of a deliberate policy decision, based on an awareness that conditions have changed or are about to change and that action is required to return to, maintain, or achieve a desired state.
Adaptive Capacity - The ability of a system to design or implement effective adaptation strategies to adjust to information about potential climate change (including climate variability and extremes), to moderate potential damages, to take advantage of opportunities, or to cope with the consequences (modified from the IPCC to support project focus on management of future risks) (Ballard, 2009). As such this does not include the adaptive capacity of biophysical systems.
Adaptation costs and benefits
The costs of planning, preparing for, facilitating, and implementing adaptation measures, including transition costs.
The avoided damage costs or the accrued benefits following the adoption and implementation of adaptation measures.
Consequence - The end result or effect on society, the economy or environment caused by some event or action (e.g. economic losses, loss of life). Consequences may be beneficial or detrimental. This may be expressed descriptively and/or semi-quantitatively (high, medium, low) or quantitatively (monetary value, number of people affected etc).
Impact - An effect of climate change on the socio-bio-physical system (e.g. flooding, rails buckling).
Response function - Defines how climate impacts or consequences vary with key climate variables; can be based on observations, sensitivity analysis, impacts modelling and/or expert elicitation.
Risk - Combines the likelihood an event will occur with the magnitude of its outcome.
Sensitivity - The degree to which a system is affected, either adversely or beneficially, by climate variability or change.
Uncertainty - A characteristic of a system or decision where the probabilities that certain states or outcomes have occurred or may occur is not precisely known.
Vulnerability - Climate vulnerability defines the extent to which a system is susceptible to, or unable to cope with, adverse effects of climate change including climate variability and extremes. It depends not only on a system’s sensitivity but also on its adaptive capacity. 2 The inclusion of the word ‘conscious’ in this IPCC definition is a problem for the CCRA and we treat this as anticipated adaptation that is not part of a planned adaptation programme. It may include behavioural changes by people who are fully aware of climate change issues.

xvi Business, Industry and Services

Business, Industry and Services xvii
Acknowledgements This report incorporates inputs from a number of organisations, in addition to those consulted during the draft of the scoping reports. The following organisations have contributed to this work.
Association of British Insurers
Cambridge Programme for Sustainability Leadership
Department for Culture, Media and Sport (Northern Ireland)
English Heritage
Environment Agency (Northern Ireland)
Food and Drink Federation
Historic Scotland
IBM
Intellect UK
Mercer
National Parks Authority
National Trust
Natural England
Office of National Statistics
Scottish Natural Heritage
VisitEngland
We also wish to acknowledge the author of the costs assessment (Chapter 6), Alistair Hunt.

xviii Business, Industry and Services

Business, Industry and Services xix
Contents Statement of use v
Executive Summary vii
Key Term Glossary xv
Acknowledgements xvii
Contents xix
1. Introduction 1
1.1 Background 1
1.2 Scope of the Business, Industry and Services Sector Report 3
1.3 Overview of the Business, Industry and Services sector 4
1.4 Policy Context 6
1.5 Structure of this report 9
2. Methods 11
2.1 Introduction: CCRA Framework 11
2.2 Outline of the method used to assess impacts, consequences and risks 12
2.3 Identify and characterise the impacts 14
2.4 Assess vulnerability 14
2.5 Identify the main risks 15
2.6 Assess current and future risk 15
2.7 Report on risks 16
3. Impacts and Risk Metrics 18
3.1 Introduction and Tier 1 analysis 18
3.2 Cross-sectoral and indirect risks 23
3.3 Selection of Tier 2 impacts 27
3.4 Identification of risk metrics 36
4. Sector Risk Analysis 38
4.1 Introduction and response functions 38
4.2 Estimates of changes in selected climate change scenarios 39
5. Socio-Economic Change 89 5.1 Introduction 89
5.2 Estimates of changes in selected social and economic futures 90
6. Costs 94
6.1 Introduction 94
6.2 Economic impacts 95
6.3 Presentation of results, uplifts and discounting 97
7. Adaptive Capacity 103

xx Business, Industry and Services
7.1 Overview 103
7.2 Assessing structural and organisational adaptive capacity 103
7.3 Adaptive Capacity in the Business, Industry and Services Sector 105
8. Conclusions 107
8.1 Key findings 107
8.2 Limitations of current methodology 107
8.3 Challenges to overcome 108
9. References 109
Appendices 119 Appendix 1 Policy background, scoring of Tier 1 impacts and risk scoring
explanation 121
Appendix 2 Response functions and the application of climate projections 137
Appendix 3 Economic impacts 165
Appendix 4 Social Vulnerability Checklist 169 Tables Table 3.1 Perceived risk level by sub-sector for the four types of climate risk identified in the KPMG analysis
(2008) 19 Table 4.1 Selection of response functions 38 Table 5.1 Socio-economic change summary, with extreme scenarios highlighted where applicable 91 Table 6.1 Summary of results in £million per annum 96 Figures Figure 2.1 Stages of the CCRA (yellow) and other actions for Government (grey) 11 Figure 2.2 Steps of the CCRA Method (that cover Stage 3 of the CCRA Framework: Assess risks) 13 Figure 3.1 Potential climate change impacts on the financial sector (assuming no adaptation) 20 Figure 3.2 Systematic map for the Business, Industry and Services sector based on 4th pass cause of “water
demand” 27 Figure 4.1 Total and industrial volumes of water licensed to be abstracted across 10 UK regions (Ml/d) 54 Figure 4.2 Cost of business interruption in the UK (£m) due to flooding 59 Figure 4.3 Insurance payout for weather related claims in the UK (£m) 69 Figure 4.4 Developments in Tourism Comfort Index (TCI) 73 Boxes Box 4.1 Examples of consequences of climate-related events on financial and credit performance of ‘real
sector’ investments 41 Box 4.2 Major on-going stakeholder-led developments pushing for climate change adaptation
mainstreaming 43 Box 4.3 Community and governmental opposition to mining project in Chile fuelled by climate-related
concerns 43 Box 4.4 Example of impact of average changes in climate on investments 46 Box 4.5 Impacts of floods of summer 2007 on tourism and leisure sector 50 Box 4.6 Impact of 2007 floods on businesses 57 Box 4.7 Case Study: Flooding at BT Exchange in Paddington, London 63 Box 4.8 Case study: 2007 flooding and the impact on transport infrastructure 82

Business, Industry and Services 1
1. Introduction
1.1 Background
It is widely accepted that the world’s climate is being affected by the increasing anthropogenic emissions of greenhouse gases into the atmosphere. Even if efforts to mitigate these emissions are successful, the Earth is already committed to significant climatic change (IPCC, 2007).
Over the past century, the Earth has warmed by approximately 0.7°C3. Since the mid-1970s, global average temperature increased at an average of around 0.17°C per decade4. UK average temperature increased by 1°C since the mid-1970s (Jenkins et al., 2009), however recent years have been below the long-term trend highlighting the significant year-to-year variability. Due to the time lag between emissions and temperature rise, past emissions are expected to contribute an estimated further 0.2°C increase per decade in global temperatures for the next 2-3 decades (IPCC, 2007), irrespective of mitigation efforts during that time period.
The sorts of impacts expected later in the Century are already being felt in some cases, for example:
Global sea levels rose by 3.3 mm per year (± 0.4 mm) between 1993 and 2007; approximately 30% was due to ocean thermal expansion due to ocean warming and 55% due to melting of land ice. The rise in sea level is slightly faster since the early 1990s than previous decades (Cazenave and Llovel, 2010).
Acidification of the oceans caused by increasing atmospheric CO2 concentrations is likely to have a negative impact on the many marine organisms and there are already signs that this is occurring, e.g. reported loss of shell weight of Antarctic plankton, and a decrease in growth of Great Barrier coral reefs (ISCCC, 2009).
Sea ice is already reducing in extent and coverage. Annual average Arctic sea ice extent has decreased by 3.7% per decade since 1978 (Comiso et al., 2008).
There is evidence that human activity has doubled the risk of a very hot summer occurring in Europe, akin to the 2003 heatwave (Stott et al., 2004).
The main greenhouse gas responsible for recent climate change is carbon dioxide (CO2) and CO2 emissions from burning fossil fuels have increased by 41% between 1990 and 2008. The rate of increase in emissions has increased between 2000 and 2007 (3.4% per year) compared to the 1990s (1.0% per year) (Le Quéré et al., 2009). At the end of 2009 the global atmospheric concentration of CO2 was 387.2 ppm (Friedlingstein et al., 2010); this high level has not been experienced on earth for at least 650,000 years (IPCC 2007).
The UK government is committed to action to both mitigate and adapt to climate change5 and the Climate Change Act 20086 makes the UK the first country in the world
3 Global temperature trends 1911-2010 were: HadCRUT3 0.8°C/century, NCDC 0.7°C/century, GISS 0.7°C/century. Similar values are obtained if we difference the decadal averages 2000-2009 and 1910-1919, or 2000-2009 and 1920-1929. 4 Global temperature trends 1975-2010 were: HadCRUT3 0.16°C/decade, NCDC 0.17°C/decade, GISS 0.18°C/decade. 5 http://www.defra.gov.uk/environment/climate/government/
2 Business, Industry and Services
to have a legally binding long-term framework to cut carbon emissions, as well as setting a framework for building the nation’s adaptive capacity. The devolved administrations also have their own strategies and plans in this regard.
The Act sets a clear and credible long term framework for the UK to reduce its greenhouse gas (GHG) emissions including:
A legal requirement to reduce emissions by at least 80% below 1990 levels by 2050 and by at least 34% by 2020.
Compliance with a system of five-year carbon budget, set up to 15 years in advance, to deliver the emissions reductions required to achieve the 2020 and 2050 targets.
In addition it requires the Government to create a framework for building the UK's ability to adapt to climate change and requires Government to:
Carry out a UK wide Climate Change Risk Assessment (CCRA) every five years.
Put in place a National Adaptation Programme (NAP), covering England and reserved matters, to address the most pressing climate change risks as soon as possible after every CCRA.
The purpose of this first CCRA is to provide underpinning evidence, assessing the key risks and opportunities to the UK from climate change, and so enable Government to prioritise climate adaptation policies for current and future policy development as part of the statutory National Adaptation Programme which will begin from 2012. The CCRA will also inform devolved Governments’ policy on climate change mitigation and adaptation.
Climate Change Act: First 5 year Cycle
The Scope of the CCRA covers an assessment of the risks and opportunities to those things which have social, environmental and economic value in the UK, from the current climate and future climate change, in order to help the UK and devolved Governments identify priorities for action and implement necessary adaptation measures. The Government requires the CCRA to identify, assess, and where possible estimate economic costs of the key climate change risks and opportunities for the UK, and for Devolved Governments. The outputs from the CCRA will also be of value to other public and private sector organisations that have a stake in the sectors covered by the assessment.
The CCRA will be accompanied (in 2012) with a study on the Economics of Climate Resilience7 (ECR) that will identify options for addressing some of the priority risks identified by the CCRA, and will analyse their costs and benefits. This analysis will provide an overall indication of the scale of the challenge and potential benefits from acting; and, given the wide-ranging nature of possible interventions, will help to identify priority areas for action by Government on a consistent basis.
This will be followed by the first NAP. The NAP will set out:
objectives in relation to adaptation
proposals and policies for meeting those objectives
timescales
6 http://www.legislation.gov.uk/ukpga/2008/27/contents 7 http://www.defra.gov.uk/environment/climate/government/

Business, Industry and Services 3
an explanation about how those proposals and policies contribute to sustainable development.
The CCRA analysis has been split into eleven sectors to mirror the general sectoral split of climate impacts research; agriculture, biodiversity and ecosystem services, business, industry and services, built environment, energy, floods and coastal erosion, forestry, health, marine and fisheries, transport and water.
1.2 Scope of the Business, Industry and Services Sector Report
This Business, Industry and Services sector report is one of the 11 sector reports commissioned as part of the CCRA contract with HR Wallingford. It is a key step in the process of developing the evidence base required to deliver the UK CCRA to Parliament, as required by the Climate Change Act (2008), by January 2012.
This report gives an overview of the impacts of climate change for the Business, Industry and Services sector in the UK. The diverse nature of this sector has meant that it has not been possible to provide a comprehensive picture of all of the potential climate change risks that the sector is likely to face. For the purposes of this study, the assessment of risks and opportunities for the sector was based on a number of sub-sectors, specifically: financial services; tourism; food and beverages; primary extractives (oil, gas and mining) and chemical manufacturing. These sub-sectors are used as illustrative examples to highlight the range of climate-related issues and challenges the sector as a whole may face. They are of particular significance for three principal reasons:
They rely on large fixed assets (e.g. chemical manufacturing near large main rivers or coastline)
They have complex supply chains (e.g. food and beverages)
They rely substantially on natural assets (e.g. tourism).
Within these sub-sectors, the study has made no distinction based on business size; the risks to Small and Medium Enterprises (SMEs) through to large multi-national corporations has been considered. It is important to highlight that although the focus of the CCRA is on risks in the UK, the inherent international nature of the Business, Industry and Services sector (e.g. UK banks, pension funds and insurers operate in a global market place) means that it is difficult to ignore potential climate impacts in areas outside the UK. However, the international dimensions of climate change, specifically the effects of climate change that could occur outside of the UK and could give rise to threats and opportunities, has been addressed in a recent Foresight Report (2011a). Consequently, the emphasis in this report is placed on UK-based risks and opportunities.
Our analysis follows a predetermined CCRA methodology as expressed in Chapter 2 of this report. Evidence in this report has been obtained from published literature, established datasets and consultation with a range of stakeholder organisations. The consultation process was initiated as a part of an earlier ‘Tier 1’ set of studies (Acclimatise, 2010a, Acclimatise, 2010b, Acclimatise, 2010c) and continued into this phase of work, the selection and analysis of ‘Tier 2’ risks. These organisations are acknowledged in the preface to this report. Our analysis was also undertaken in consultation with UK Government departments including Defra, the Department for Business, Innovation and Skills (BIS), HM Treasury, and the Department of Energy and Climate Change (DECC). The devolved administrations of Scotland, Wales and

4 Business, Industry and Services
Northern Ireland were also consulted to establish a complete picture of the UK and acknowledge differences in climate change policy frameworks.
1.3 Overview of the Business, Industry and Services sector
The Business, Industry and Services sector is extremely diverse. It incorporates a wider range of activities from financial services and retail to manufacturing and food production. These industries occur at a range of scales. Midcap firms (with turnovers between £25 million and £500 million) provide over 20% of UK jobs while, at the same time, there are over 4.8 million registered small and medium enterprises (SMEs) that account for half of all private sector output (HM Treasury, BIS 2011). The varied nature of these activities is mirrored by the subsectors’ uneven geographies. BIS illustrated this with reference to the financial services subsector: “The Greater South East account[ed] for 60% of total UK activity in financial intermediation and more than half of total UK output from real estate, renting and business services in 2006.” (HM Treasury, BIS, 2011).
The IMF forecasts that the world economy will grow by $20 trillion in today’s prices between 2010 and 2015. It expects advanced economies such as the UK to contribute around $8.5 trillion (IMF, 2010). The Business, Industry and Services sector will be the main driver of growth in the UK. BIS has highlighted ‘green’ growth as an area that offers important opportunities for UK firms as the sector emerges from recession. The low-carbon and environmental goods and services sector was estimated to be worth £112 billion in 2008-09 (HM Treasury, BIS, 2011).
The economic case for the taking action to adapt to climate change was made strongly in the 2006 Stern Review on the economics of climate change, which stated that; “many adaptation options… will provide benefits in excess of costs” (Stern, 2006).
This study is based on an analysis of a number of climate risks identified in five sub-sectors of the Business, Industry and Services sector:
Financial services
Tourism
Food and beverages
Primary extractives (oil, gas and mining)
Chemical manufacturing.
Each of these sub-sectors play an important role in driving growth in the UK economy, and each will be affected by the impacts of climate change in a variety of ways.
1.3.1 Financial Services
The UK financial services sub-sector consists of banks, asset managers, insurers, pension funds and other financial service providers. As well as being a significant driver of the UK economy in its own right, it also supports other sectors by providing credit and services to businesses and households. In 2008, it was responsible for 9% of total economic output and contributed 14% of the Treasury’s fiscal revenue (HM Treasury, 2009; Turner et al., 2010). The UK is considered to be an international centre for finance, with inward and outward financial investment flows amounting to more than £10 trillion per year (Bank of England, 2010). This sub-sector employs over 1 million people, and financial services are one of the UK’s largest export industries (HM

Business, Industry and Services 5
Treasury, 2011). In 2008, the countries that received the most investments from UK-owned financial institutions were in the developed world, though emerging markets represent a significant total share of foreign investments (HM Treasury, 2009).
1.3.2 Tourism
According to a recent study by Deloitte and Oxford Economics (2010) tourism was worth £115.4bn to the UK economy in 2009 – equivalent to 8.9% of total UK Gross Domestic Product (GDP). This makes it the UK’s fifth largest “sector”. Approximately 2.6 million people work in tourism accounting for 1 in 12 UK jobs (ibid). On a regional scale, tourism contributes £96.7bn to the economy in England (8.6% of GDP), £11.1bn in Scotland (10.4%), £6.2bn in Wales (13.3%) and £1bn in Northern Ireland (4.9%) (ibid). Over the next decade, the UK’s visitor economy is forecast to be one of the best performing sub-sectors, with above average growth at 3.5% in Gross Value Added (GVA) terms (ibid).
1.3.3 Food and Beverages Manufacturing
Food and beverages is the UK’s largest manufacturing sub-sector and employs over 400,000 people (Defra, 2010, UK Trade & Investment, 2010). The UK is the second most productive food and drinks manufacturer in the world. It contributed GVA £21.8 billion to the UK economy in 2009 (ONS/DEFRA Food Statistics Pocketbook 2009; UKTI, 2010). The Cabinet Office (2008) estimates that in 2008 the sub-sector and its supply chain accounted for 7% of GPD. In 2007, the UK attracted £8.4bn of new overseas investment from food and drink manufacturers (ONS Foreign Direct Investment 2007 Report, 2009). The sub-sector is comprised of over 7,000 enterprises operating almost 10,000 factories (UK Trade and Investment, 2010).
1.3.4 Primary Extractives
Oil and gas production from the UK continental shelf accounted for over 75% of the UK’s total primary energy in 2008 (Oil and Gas UK, 2009). The UK is the largest producer of both oil and gas in the EU and is fourteenth highest globally. Oil and gas is the highest tax contributing sub-sector in the UK, paying £6.9 billion in corporate taxes in 2009-10 (Oil and Gas UK, 2010). In 2010, the sub-sector contributed £27 billion to the economy and directly employed 32,000 people (Oil and Gas UK, 2009). The UK coal sub-sector supports some 10% of all UK electricity supplies (DECC, 2010). With respect to metals and minerals, British-based mining companies deliver two thirds of global iron ore output, the majority of the world’s diamonds, platinum and titanium, and a significant proportion of other metals and minerals (London Mining Network, 2010). UK-listed mining companies together enjoy around half the market capital available to the world’s ten biggest miners (Nostromo Research, 2009).
1.3.5 Chemical Manufacturing
The UK chemicals sub-sector is the largest exporter in UK manufacturing and accounts for approximately 1.5% of GDP (UKTI 2009). UK-based turnover exceeds £57bn and the industry employs over 180,000 people (Chemical Industries Association, 2010). This is a sub-sector where Small and Medium Enterprises (SMEs) play a key role. There are more than 3,100 chemical companies in the UK, with a high proportion being located in the north of England and Scotland.

6 Business, Industry and Services
1.3.6 Cross-Sectoral Linkages
The diverse nature of the sub-sectors within the Business, Industry and Services sector means that the climate risks are wide ranging. Perhaps unsurprisingly there is considerable overlap between the risks faced by the Business, Industry and Services sector and sectors covered by other CCRA reports.
Cross-sectoral linkages include:
Coastal erosion and sea level rise putting tourist assets at risk (Flooding).
Sea level rise and coastal inundation and erosion affect business and industrial assets (Flooding).
Increased flooding impacts on the insurance sub-sector due to increased payout frequency and value (Flooding).
Reduced groundwater levels and increased demand putting pressure on industry and agri-business (Agriculture, Water).
Disruption to port activities due to extreme weather and sea level rise negatively impacting supply chains (Marine).
Subsidence and landslips disrupt road, rail and port facilities and impact on supply chains (Transport).
Negative impact on cultural heritage impacts tourism industry (Built environment).
Loss of staff hours due to increases in internal building temperatures (Built environment).
In light of this the findings of this report should be taken in the context of the other CCRA sector studies, as is considered in the CCRA Evidence Report (CCRA, 2012).
1.4 Policy Context
1.4.1 Introduction
The Business, Industry and Services sector in the UK is administered and regulated by a large number of bodies, reflecting the range of industries and the scales at which they operate. This section presents the main policy instruments and institutions that govern the specific risks (outlined in Chapters 3 and 4) to the five sub-sectors that are the focus of this report.
BIS, HM Treasury, the Bank of England, UK Trade and Investment (UKTI) and trade bodies such as the CBI, administer and communicate UK business policy. Their principal focus is ensuring that the UK remains an attractive place in which to do business. They promote sustainable growth and support businesses to mainstream climate change adaptation policy into their management systems. This is especially important in this sector as much of the responsibility for governing climate adaptation remains with the individual businesses themselves.
For the purposes of the Business, Industry and Service Sector report, it is more instructive to give a picture of the policy framework that governs the risks outlined in Chapters 3 and 4. As such the bullet point text below is not an exhaustive description of all the activities/responsibilities associated with each principal regulatory body. Rather it highlights specific responsibilities that relate to the risks in this report.
Business, Industry and Services 7
Principal regulatory bodies include:
Defra: Leads in England on effective approaches to flood and coastal erosion risk management; managing water resources balanced with growth in the housing sector; and on planning policy for green infrastructure and biodiversity.
BIS: A supporting role for business in mainstreaming adaptation, enabling industries to respond to the future needs and opportunities presented. Supporting research and innovation through partners such as the Technology Strategy Board and Research Councils.
DECC: Responsible for coastal energy infrastructure; electricity infrastructure in flood risk areas; policy on energy demand for cooling buildings; and on methods for assessing energy efficiency to ensure that new build homes are energy efficient and have minimal demands for active cooling.
The Environment Agency: Enforces planning policy for flood and coastal risk management, water quality and green infrastructure in England and Wales. Environmental aspects of water resource management are regulated by the Environment Agency in England and Wales, by the Scottish Environment Protection Agency in Scotland and by the Northern Ireland Environment Agency in Northern Ireland.
Department for Communities and Local Government (CLG): Responsible for planning policy on housing, urban regeneration, and fire and rescue for England. This responsibility is also devolved to appropriate departments in Scotland and Northern Ireland and there is also further planning policy for Wales overseen by the Welsh Government. The CLG is also responsible for national policy on building regulations whether domestic, commercial or industrial.
Department of Health: Responsible for research for policy on heat waves.
HM Treasury, Department for Work and Pensions (DWP) and the Association of British Insurers through the Financial Inclusion Taskforce: Responsible for financial regulation and impacts of climate change for the mortgage and insurance industries.
Heritage bodies: Environmental impacts of industry on the natural environment are monitored to ensure they do not have a damaging impact. Heritage bodies play a particular role in supporting the tourism industry. Responsibility is devolved and is covered by: Natural England and English Heritage in England; the Countryside Council for Wales, Scottish Natural Heritage and the Northern Ireland Environment Agency.
Welsh Government: Responsible for flood and coastal erosion risk management; managing water resources; planning policy; biodiversity; Building Regulations; regeneration; fire and rescue; and health policy.
Scottish Government: Responsible for the implementation of its own Climate Change Act; managing flood risk; coastal flooding; building regulations; planning policy; and tourism.
Northern Ireland Executive: Responsible for some areas of planning policy, building regulations, tourism and transport.

8 Business, Industry and Services
1.4.2 UK Policy
The policy framework for managing the potential future risks of climate change is extremely diverse, reflecting the broad range of the risks that the Business, Industry and Services sector may face. Interdepartmental co-operation is essential to the success of the climate change adaptation framework. Many of the policies outlined in Table A1.1 require the co-operation of key stakeholders in the Business, Industry and Services sector.
The Adaptation Reporting Power contained in the Climate Change Act (2008) is the principle policy lever for the UK Government to influence businesses and help them to mainstream climate change adaptation into their management practices. It is only able to achieve its aims with the support and co-operation of those businesses that it asks to report. Defra has produced guidance to help businesses through the reporting process and has provided advice on ways in which they can implement climate change adaptation strategies. The UK Climate Impacts Programme (UKCIP) has also developed a number of tools that help business in this regard. UKCIP’s Business Areas Climate Assessment Tool (BACLIAT), for example, is a simple checklist that can be used to assess the potential impacts of climate change at an organisational level.
Policy that protects assets from flood risk and coastal erosion, and building regulations and planning policy play a vital role in protecting UK businesses and their supply chains from the negative impacts of climate change. There are a number of pieces of primary legislation that aim to manage these risks, they include: the Planning Act (2008), Planning Policy Statement 1 (PPS1), Planning Policy Statement 25 (PPS 25): Development and Flood Risk, Building Regulations (2006), the Flood and Water Management Act (2010) and the Civil Contingencies Act (2004).
Some of the key policy levers for managing climate change risk are shown in Table A1.1 in Appendix 1. The reference numbers (BU1, etc) refer to the risks analysed in this report, as listed in Table 3.3.
1.4.3 Devolved Policy
How policy is implemented varies across the devolved administrations. Some of the key differences are explored below.
Scotland
The Scottish Government is committed to implementing climate change adaptation policy through the Climate Change (Scotland) Act (2009), which governs Scottish climate policy. The Act requires public bodies in Scotland to ensure that they put measures in place to help with the implementation of an adaptation programme. The Act contains an adaptation reporting power, which requires public bodies to report on their adaptation strategies; however, unlike in England, there are currently no plans to use this power. Additionally, the adaptation reporting power in force in the English Climate Change Act (2008) is broader, enabling Government to require private businesses and organisations that perform a public function (such as utility companies) to report on their adaptation plans.
The Scottish Government and its agencies oversee adaptation policy. Scottish Enterprise, Scottish Environment Protection Agency and the Scottish Climate Change Impacts Partnership (SCCIP) have central roles in mainstreaming adaptation into the management strategies of Scottish businesses.
Wales
The Welsh Government sets out its vision for providing the conditions and framework to enable the private sector to grow and flourish in Economic Renewal: a new direction

Business, Industry and Services 9
(2010). A prominent sub-sector in Wales is tourism, which relies heavily on the condition of the environment. Consistent with its central organising principle of sustainable development, the Welsh Government’s Sustainable Tourism Framework (2007) highlights the need to manage and adapt to climate change as being of critical importance to the future of sustainable tourism in Wales.
One of the five priorities set out in Economic Renewal is the need for investment in high-quality and sustainable infrastructure. This priority is also recognised in the Welsh Government’s Energy Policy Statement, Spatial Plan and Transport Strategy.
Through the Climate Change Strategy for Wales, the Welsh Government is implementing an Adaptation Framework, which is designed to incorporate climate change adaptation into decision-making in the private, public and voluntary sectors. The Strategy was developed and is being delivered in Partnership with the Climate Change Commission for Wales that aims to drive action on climate change in Wales. The business community is represented on the Commission by the Confederation of British Industries (Wales) and the Federation of Small Businesses. The Climate Change Strategy and the Climate Change Communications and Engagement Strategy include commitments to engage with private sector organisations, highlighting the need for businesses to understand and plan for the threats and opportunities arising from a changing climate.
Planning Policy Wales helps to ensure the resilience of the built environment and reduce the risk of disruption to business activities as a result of climate change. This is supplemented by Technical Advice Notes (TANs), including TAN15 – Development and Flood Risk, and TAN22 - Sustainable Buildings. Building Regulations will be devolved in January 2012, after which time the Welsh Government will be able to set standards for new buildings, including non-domestic buildings, and intends to utilise these powers to improve further the resilience of the built environment to climate change.
Northern Ireland
The Climate Change Act (2008) is implemented in Northern Ireland by the Northern Irish Executive and the Adaptation Reporting Power operates here in the same way as it does in England. The Northern Ireland strategy for adaptation is laid out in the report ‘Preparing for a Changing Climate in Northern Ireland’ (2007).
Climate change adaptation policy in Northern Ireland is largely transposed from UK policy and is managed by a series of regional strategies (such as the Region Transportation Strategy for Northern Ireland), many of which fall under the Regional Development Strategy managed by the Department for Regional Development. Planning policy, as with the other UK regions, is devolved to local councils.
1.5 Structure of this report
Following this introduction chapter, Chapter 2 presents the risk assessment methodology adopted in the CCRA. The subsequent and remaining chapters of the report then broadly follow the risk assessment steps outlined in Chapter 2 and Figure 2.2. Chapter headings and sub-headings clearly make reference the relevant step of the risk assessment methodology.
Chapter 3 provides an overview of the risks and opportunities identified for the sector. It is linked to the full list of identified risks located in Appendix 1.
Chapter 4 contains the main body of the analysis. In this chapter, an assessment and quantification of the key risks / opportunities is presented. For each risk identified for the Business, Industry and Services sector, the approach taken is to include as applicable:
10 Business, Industry and Services
An introduction and supporting evidence
Details of identified metrics and presentation of the “response function”
Incorporation of future climate change projections
Presentation of data assumptions and limitations
Conclusions
The majority of the technical and supporting information (data tables and figures) for the risk analysis is located in Appendix 2. These are referenced as necessary in the text (e.g. Table A2.* and Figure A2.*).
Chapter 5 considers the way in which the social and economic future of the UK may affect the risks and Chapter 6 presents possible economic impacts of the 10 selected risks.
Chapter 7 introduces the adaptive capacity of the Business, Industry and Services sector as a whole, as well as the sub-sectors this report focuses on. An assessment of current adaptive capacity across the sectors is the subject of an ongoing Defra study.
Finally, Chapter 8 summarises the main conclusions of this report, outlining the limitations of the current methodology, including strengths and weaknesses, together with the main challenges the Business, Industry and Services sector faces regarding climate change adaptation.

Business, Industry and Services 11
2. Methods
2.1 Introduction: CCRA Framework
The overall aim of the CCRA is to inform UK adaptation policy by assessing the main current and future risks (threats and opportunities) posed by the current climate and future climate change for the UK to the year 2100. The overall approach to the risk assessment and subsequent adaptation plan is based on the UK Climate Impacts Programme (UKCIP) Risk and Uncertainty Framework (UKCIP, 2003). The framework comprises eight stages as shown in Figure 2.1. The CCRA has undertaken the Stages 1, 2 and 3 as outlined below. Stages 4 and 5 will be addressed as part of a separate economic assessment, entitled the ‘Economics of Climate Resilience’, and the remaining stages will be implemented by the UK Government and Devolved Administrations. The framework presents a continual process that can adapt as new evidence and policy emerges; in the case of the CCRA the process will be revisited every five years.
Figure 2.1 Stages of the CCRA (yellow) and other actions for Government (grey)
Adapted from UKCIP (2003)
Stage 1 is defined by the aim of the CCRA project, to undertake an assessment of the main risks (including both threats and opportunities) posed by climate change that will have social, environmental and economic consequences for the UK.
Stage 2 established decision-making criteria for the study, which were used to inform the selection of impacts for analysis in Stage 3. These criteria are the social, environmental and economic magnitude of consequences and the urgency of taking adaptation action for UK society as a whole.
Stage 3 covers the risk assessment process. This involved a tiered assessment of risks with Tier 1 (broad level) identifying a broad range of potential impacts and Tier 2 (detailed level) providing a more detailed

12 Business, Industry and Services
analysis including quantification and monetisation of some impacts. A list of climate change impacts was developed based on eleven sectors with further impacts added to cover cross-cutting issues and impacts which fell between sectors. This list of climate change impacts is referred to as the ‘Tier 1 list of impacts’. This list contained over 700 impacts – too many to analyse in detail as part of this first CCRA. A consolidated list of the highest priority climate change impacts for analysis was developed and referred to as the ‘Tier 2 list of impacts’. This report presents the risk assessment for Tier 2 impacts.
The background to the framework and approach used for each of the first three stages is set out in more detail in the CCRA Method Report (Defra, 2010b). This chapter aims to summarise the CCRA method for the risk assessment stage (Stage 3 in the framework above) because this includes the specific steps for which results are presented in this report.
2.2 Outline of the method used to assess impacts, consequences and risks
The risk assessment presented in this report is the focus of Stage 3 in the CCRA Framework (see Figure 2.1). This was done through a series of steps as set out in Figure 2.2. These steps are explained in Sections 2.3 - 2.7 below and are discussed in more detail in the CCRA Method report (Defra, 2010).
The components of the assessment sought to:
Identify and characterise the impacts of climate change.
This was achieved by developing the Tier 1 list of impacts, which included impacts across eleven sectors as well as impacts not covered by the sectors and arising from cross sector links (presented in Chapter 3.1 and 3.2).
Identify the main risks for closer analysis.
This involved the selection of Tier 2 impacts for further analysis from the long list of impacts in Tier 1. Higher priority impacts were selected by stakeholder groups based on the social, environmental and economic magnitude of impacts and the urgency of taking action (presented in Chapter 3.3).
Assess current and future risk, using climate projections and considering socio-economic factors.
The risk assessment was done by developing ‘response functions’ that provide a relationship between changes in climate with specific consequences based on analysis of historic data, the use of models or expert elicitation. In some cases this was not possible, and a narrative approach was taken instead. The UKCP09 climate projections and other climate models were then applied to assess future risks. The potential impact of changes in future society and the economy was also considered to understand the combined effects for future scenarios (presented in Chapter 5).
Assess vulnerability of the UK as a whole.
This involved:
i. a high level review of Government policy on climate change in the eleven sectors (see Chapter 1 of this report)

Business, Industry and Services 13
ii. a high level assessment of social vulnerability to the climate change impacts (see Appendix 4 of this report)
iii. a high level assessment of the adaptive capacity of the sectors. This is the subject of an ongoing study by Defra to be reported later in 2012, but see Chapter 7 of this report for a preliminary view and Section 2.4 below for an overview of the approach).
Report on risks to inform action.
This report presents the results of the risk assessment for the Business, Industry and Services sector. The results for the other ten sectors are presented in similar reports and the CCRA Evidence Report (CCRA, 2012) draws together the main findings from the whole project, including consideration of cross-linkages, and outlines the risks to the UK as a whole.
Figure 2.2 Steps of the CCRA Method (that cover Stage 3 of the CCRA Framework: Assess risks)

14 Business, Industry and Services
2.3 Identify and characterise the impacts
Step 1 – Literature review and Tier 1 analysis
This step scoped the potential impacts of climate change on the UK based on existing evidence and collating the findings from literature reviews, stakeholder participation through workshops, correspondence with wider stakeholders and soliciting expert opinion. This work developed the Tier 1 list of impacts (see Appendix 1). The Tier 1 impacts have not been analysed in detail; high level discussion of these impacts is provided in Chapter 3 of this report.
Due to the natural diversity of the Business, Industry and Services sector, the Tier 1 analysis involved the scoping of climate change impacts and risks for the following three sub-sectors:
1. Financial services (banks, pension funds and insurance) and tourism (Acclimatise, 2010a)
2. Food and beverage manufacturing (Acclimatise, 2010b)
3. Primary extractive industries (oil, gas and mining) and chemical manufacturing (Acclimatise, 2010c).
Step 2 – Cross sectoral and indirect impacts
The Tier 1 lists for the eleven sectors in CCRA were compared and developed further to include cross-sectoral and indirect impacts. This was done by ‘Systematic Mapping’, which sets out a flow chart to link causes and effects in a logical process. The impacts that were identified in this step were added to the Tier 1 list of impacts.
2.4 Assess vulnerability
Step 3 – Review of Policy
Government policy on climate change develops and changes rapidly to keep pace with emerging science and understanding of how to respond through mitigation and adaptation. This report includes an overview of selected relevant policy in Chapter 1 as this provides important context for understanding how risks that are influenced by climate relate to existing policies. This information will be expanded in the Economics of Climate Resilience project and the National Adaptation Programme.
Step 4 – Social Vulnerability
The vulnerability of different groups in society to the climate change risks for each sector was considered at a high level through a check list. The completed check list for the Business, Industry and Services sector is provided in Appendix 4. This information is provided for context; it is not a detailed assessment of social vulnerability to specific risks. Note that this step is different from Step 10, which considers how future changes in society may affect the risks.
Step 5 – Adaptive Capacity
The adaptive capacity of a sector is the ability of the sector as a whole, including the organisations involved in working in the sector, to devise and implement effective adaptation strategies in response to information about potential future climate impacts. A high level initial overview of the adaptive capacity of the Business, Industry and Services sector has been carried out through literature review and is presented in Chapter 7. This information is provided for context. An assessment of adaptive capacity is ongoing and will be reported on later in 2012.

Business, Industry and Services 15
2.5 Identify the main risks
Step 6 – Selection of Tier 2 impacts
The Tier 1 list of impacts for each sector that resulted from Step 2 (see above) was consolidated to select the higher priority impacts for analysis in Tier 2. Firstly, similar or overlapping impacts were grouped where possible in a simple cluster analysis, which is provided in Chapter 3. Secondly, the Tier 2 impacts were selected using a simple multi-criteria assessment based on the following criteria:
the social, economic and environmental magnitude of impacts
overall confidence in the available evidence
the urgency with which adaptation decisions needs to be taken.
Each of these criteria were allocated a score of 1 (low), 2 (medium) or 3 (high) and the impacts with highest scores over all criteria were selected for Tier 2 analysis. The scoring for each sector was carried out based on expert judgement and feedback from expert consultation workshops (or telephone interviews). Checks were carried out to ensure that a consistent approach was taken across all the sectors. The results of the scoring process are provided in Appendix 1.
Step 7 – Identifying risk metrics
For each impact in the Tier 2 list, one or more risk metrics were identified. Risk metrics provide a measure of the impacts or consequences of climate change, related to specific climate variables or biophysical impacts. For example, in the Business, Industry and Services sector report, one of the risks identified is an increase in monetary losses as a result of an increasing proportion of industrial assets at risk from flooding. The risk metrics identified to measure the consequences of this risk included, expected annual damage costs (£) for non-residential property, loss of staff time (days) and proportion of business turnover lost (£).The risk metrics were developed to provide a spread of information about economic, environmental and social consequences. The metrics have been referenced using the sector acronym and a number; the Business, Industry and Services sector metrics are referenced as BU1 to BU10.
2.6 Assess current and future risk
Step 8 – Response functions
This step established how each risk metric varied with one or more climate variables using available data or previous modelling work. This step was only possible where evidence existed to relate metrics to specific climate drivers, and has not been possible for all of the tier 2 impacts. This step was carried out by developing a ‘response function’, which is a relationship to show how the risk metric varies with change in climate variables. Some of the response functions were qualitative, based on expert elicitation, whereas others were quantitative.
Step 9 – Estimates of changes in selected climate change scenarios
The response functions were used to assess the magnitude of consequences the UK could face due to climate change by making use of the UKCP09 climate projections. This step used the response functions to provide estimates of future risk under three different emissions scenarios (high carbon emissions, A1FI; medium emissions, A1B; low emissions, B1; see http://ukclimateprojections.defra.gov.uk/content/view/1367/687/ for further details), three future 30-year time periods (centred on the 2020s, 2050s and 2080s) and for three probability levels (10, 50 and 90 percent, see http://ukclimateprojections.defra.gov.uk/content/view/1277/500/ for further details),

16 Business, Industry and Services
associated with single or combined climate variables. The probability levels are cumulative and denote the degree of confidence in the change given; for example 90% suggests that it is thought very unlikely that the change will be higher than this; 50% suggests that it is thought equally likely that the change will be higher or lower than this; and 10% suggests that it is thought very unlikely that the change will be lower than this. 90% does not mean that the change is 90% likely to occur, for example.
The changes given in the UKCP09 projections are generally from a 1961-1990 baseline.
The purpose of this step is to provide the estimates for the level of future risk (threat or opportunity), as measured by each risk metric.
Step 10 – Socio-economic change
It is recognised that many of the risk metrics in the CCRA are influenced by a wide range of drivers, not just by climate change. The way in which the social and economic future of the UK develops will influence the risk metrics. Growth in population is one of the major drivers in influencing risk metrics and may result in much larger changes than if the present day population is assumed. For some of the sectors where this driver is particularly important, future projections for change in population have been considered to adjust the magnitude of the estimated risks derived in Step 9.
For all of the sectors, a broad consideration has been made of how different changes in our society and economy may influence future risks and opportunities. The dimensions of socio-economic change that were considered are:
Population needs/demands (high/low)
Global stability (high/low)
Distribution of wealth (even/uneven)
Consumer driver values and wealth (sustainable/unsustainable)
Level of Government decision making (local/national)
Land use change/management (high/low Government input).
The full details of these dimensions and the assessment of the influence they have on the Business, Industry and Services sector is provided in Chapter 5. Note: this step is different from Step 4, which considers how the risks may affect society; whereas this step considers how changes in society may affect the risks.
Step 11 – Economic impacts
Based on standard investment appraisal approaches (HM Treasury, 2003) and existing evidence, some of the risks were expressed in monetary terms. This provides a broad estimate of the costs associated with the risks and is presented in Chapter 6 of this report. A more detailed analysis of the costs of climate change will be carried out in a study on the Economics of Climate Resilience8.
2.7 Report on risks
Step 12 – Report outputs
The main report outputs from the work undertaken for the CCRA are:
8 http://www.defra.gov.uk/environment/climate/government/

Business, Industry and Services 17
The eleven sector reports (this is the sector report for the Business, Industry and Services sector), which present the overview of impacts developed from Tier 1 and the detailed risk analysis carried out in Tier 2.
The Evidence Report, which draws together the main findings from all the sectors into a smaller number of overarching themes.
Reports for the Devolved Administrations for Scotland, Wales and Northern Ireland to provide conclusions that are relevant to their country.

18 Business, Industry and Services
3. Impacts and Risk Metrics
3.1 Introduction and Tier 1 analysis Step 1
The Tier 1 analysis involved the development of a long list of impacts of climate change (the ‘Tier 1 list’), from which the Tier 2 was selected (Section 3.3). The Tier 1 list of impacts is contained in Appendix 1.
The physical effects of climate change will present threats and opportunities across a wide variety of Business, Industry and Services sub-sectors. For the CCRA, the following sub-sectors were used as illustrative examples to highlight the range of climate-related issues and challenges the sector as a whole faces: financial services; tourism; food and beverage manufacturing; primary extractives (oil, gas and mining); and chemical manufacturing. Current vulnerability to climate-related impacts for the sector can be divided into the following common themes:
Assets: Fixed and workforce (e.g. infrastructure damage, workforce exposure to health and safety risks).
Operations: Supply of services, customer demand and regulatory environment (e.g. financial performance, markets shift due to change in public attitudes and / or legislation).
Procurement: Raw materials, supply chain and logistics (e.g. supply of water, energy and materials, reliance on vulnerable transport networks).
Environment: Natural and built, plus local community (e.g. climate-sensitive resources and conflict over their use).
These impacts have the potential to create the following consequences for individual businesses and collective sub-sectors within the Business, Industry and Services sector:
Financial performance (revenue loss / gain)
Additional costs (capital expenditure (capex) and operational expenditure (opex))
Operational disruption
Loss of staff work hours
Corporate reputation
Elevated stakeholder interest
Additional regulatory requirements
Contractual issues
Litigation
New market opportunities and product diversification.
In 2008, KPMG released a report that focused on the impacts of climate change for a range of business sub-sectors, including each of the sub-sectors addressed in the CCRA Tier 1 analysis. As a consequence, the KPMG report was one of the key
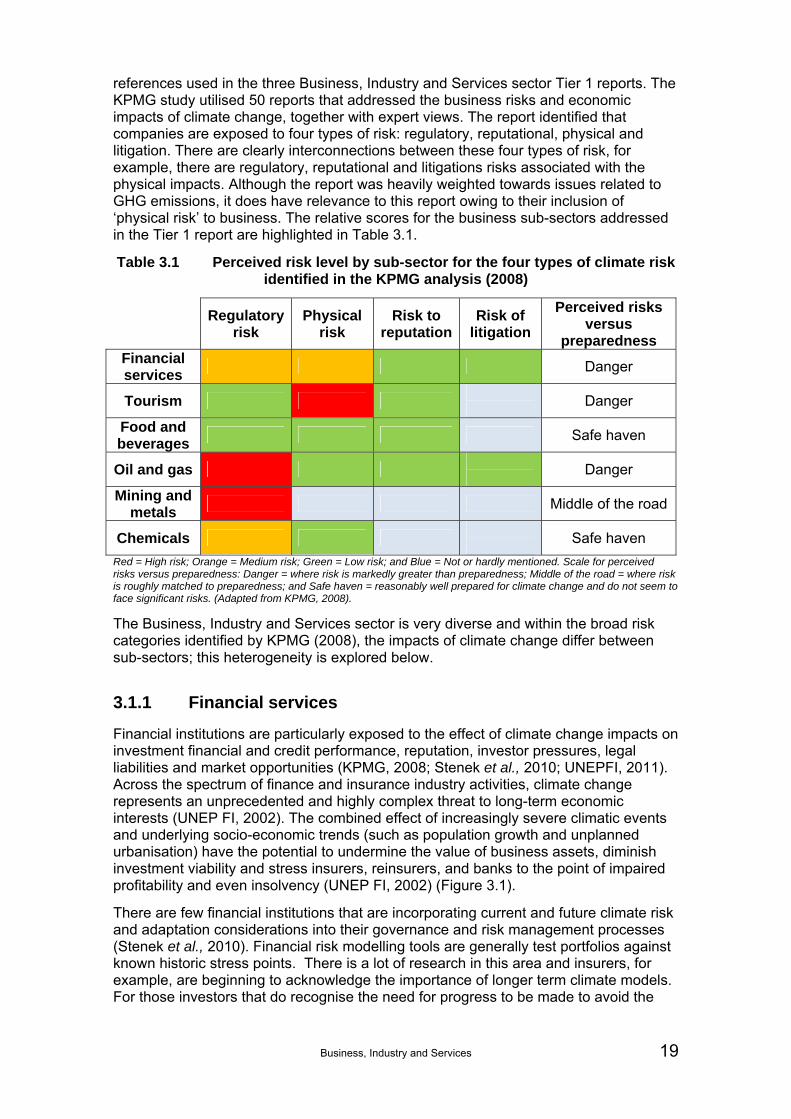
Business, Industry and Services 19
references used in the three Business, Industry and Services sector Tier 1 reports. The KPMG study utilised 50 reports that addressed the business risks and economic impacts of climate change, together with expert views. The report identified that companies are exposed to four types of risk: regulatory, reputational, physical and litigation. There are clearly interconnections between these four types of risk, for example, there are regulatory, reputational and litigations risks associated with the physical impacts. Although the report was heavily weighted towards issues related to GHG emissions, it does have relevance to this report owing to their inclusion of ‘physical risk’ to business. The relative scores for the business sub-sectors addressed in the Tier 1 report are highlighted in Table 3.1.
Table 3.1 Perceived risk level by sub-sector for the four types of climate risk identified in the KPMG analysis (2008)
Regulatory risk
Physical risk
Risk to reputation
Risk of litigation
Perceived risks versus
preparedness Financial services
Danger
Tourism
Danger
Food and beverages
Safe haven
Oil and gas
Danger
Mining and metals
Middle of the road
Chemicals
Safe haven
Red = High risk; Orange = Medium risk; Green = Low risk; and Blue = Not or hardly mentioned. Scale for perceived risks versus preparedness: Danger = where risk is markedly greater than preparedness; Middle of the road = where risk is roughly matched to preparedness; and Safe haven = reasonably well prepared for climate change and do not seem to face significant risks. (Adapted from KPMG, 2008).
The Business, Industry and Services sector is very diverse and within the broad risk categories identified by KPMG (2008), the impacts of climate change differ between sub-sectors; this heterogeneity is explored below.
3.1.1 Financial services
Financial institutions are particularly exposed to the effect of climate change impacts on investment financial and credit performance, reputation, investor pressures, legal liabilities and market opportunities (KPMG, 2008; Stenek et al., 2010; UNEPFI, 2011). Across the spectrum of finance and insurance industry activities, climate change represents an unprecedented and highly complex threat to long-term economic interests (UNEP FI, 2002). The combined effect of increasingly severe climatic events and underlying socio-economic trends (such as population growth and unplanned urbanisation) have the potential to undermine the value of business assets, diminish investment viability and stress insurers, reinsurers, and banks to the point of impaired profitability and even insolvency (UNEP FI, 2002) (Figure 3.1).
There are few financial institutions that are incorporating current and future climate risk and adaptation considerations into their governance and risk management processes (Stenek et al., 2010). Financial risk modelling tools are generally test portfolios against known historic stress points. There is a lot of research in this area and insurers, for example, are beginning to acknowledge the importance of longer term climate models. For those investors that do recognise the need for progress to be made to avoid the

20 Business, Industry and Services
economic consequences of failing to adapt, there are many opportunities to finance adaptation (INCR, 2010).
Figure 3.1 Potential climate change impacts on the financial sector (assuming no adaptation)
For banks, insurers and pension funds climate change represents operational risks (in the form of risks to buildings, infrastructure and staff) and market risks - risks to customers (retail and commercial), and to their investment and lending portfolios (Acclimatise, 2010a). The exposure through their investment portfolios occurs indirectly, yet represents a significant risk to the sector, as evidenced by the position of this risk at the top of the Tier 2 ranking (Section 3.3).
Within the UK financial services sector, exposure to climate change will be highly variable, both between different organisations and financial investments. While asset diversification constitutes one of the basic principles through which risk is spread, each company operates according to its own performance measures, thresholds and success criteria.
Furthermore, financial institutions can have very different investment portfolios and risk exposures. Undoubtedly, financial investments will not be affected by climate change in the same way; while all sectors of the economy are exposed to climate through some pathway or another (such as the wider impacts of climate change on operating conditions or essential service infrastructure), some sectors (such as agriculture or water) feature a high degree of climate sensitivity (Huddleston et al., 2009).
However, the following factors can be used as a guide to determine the degree of potential severity of climate change consequences to financial institutions:
The nature of the investment or investment portfolio (e.g. investments in sectors relying heavily on natural resources, such as water, may in general
Business, Industry and Services 21
be more sensitive to climate change than investments in sectors relying on manufactured goods).
The geographic location of the investment or investment portfolio (e.g. coastal areas, water-stressed and flood-prone regions are likely to be particularly vulnerable to climate change).
The adaptive capacity of the investment and resilience of management practices in place (e.g. low levels of debt may be relatively favourable indicators of resilience to climate-related impacts).
The nature and duration of investment (e.g. long-term investments may be particularly exposed to climate change; in general, equity may be more exposed to climate-related impacts than debt).
Sound risk management, robust governance and good disclosure within financial institutions themselves are a necessary condition for resilience, as shown by the 2008-2009 financial crisis (Stenek et al., 2010; Acclimatise, 2009c).
It is worth noting that due to its importance in the global financial system, the UK financial services sector is not only exposed to climate-related hazards affecting our country, but also to the impacts of a changing climate in foreign jurisdictions where investees operate or have assets, or where branch offices of UK-owned institutions are located. For instance, it is known that Hurricane Katrina in 2005 had a ‘ripple’ effect on UK fund performance. The composition of cross-border investments shows that the UK is very dependent on developed regions of the world (particularly North America and Europe). However, there remain significant cross-border investments between the UK and emerging markets, where the challenges presented by climate change are expected to be magnified in comparison to developed economies (Stenek et al., 2010).
3.1.2 Tourism
With its close connections to the environment and climate itself, tourism is considered to be a highly climate-sensitive industry (Simpson et al., 2008). The United Nations World Tourism Organisation, together with the United National Environment Programme and the World Metrological Organisation (UNWTO-UNEP-WMO, 2008) highlighted four broad categories of climate change impacts likely to affect the tourism industry globally, although much of these could apply to the UK, through shifting tourism destinations, their competitiveness and sustainability. These four categories are summarised as:
Direct climatic impacts (e.g. suitability of locations, seasonality in demand, operating costs).
Indirect environmental change impacts (e.g. water availability, biodiversity loss, increased natural hazards, damage to infrastructure).
Indirect impacts of mitigation policies on tourist mobility (e.g. national / international policies that seek to reduce GHG emissions).
Indirect societal change impacts (e.g. reduction in the distribution of global GDP, national / international security).
One of the main opportunities highlighted in the Tier 1 report was the potential benefit of warmer temperatures for the UK-based tourism industry, with a possible expansion of new and existing tourist destinations. The projected northward shift in “tourist comfort” means that there is the potential for the UK to capture some of the southern European tourist market. This opportunity is explored further in Section 4.2.10.

22 Business, Industry and Services
3.1.3 Food and beverages
The food and beverages manufacturing industries are exposed to climate change, largely through their dependence on long, complex supply chains, where input commodities are sourced globally and food and drink products are exported around the world (Acclimatise, 2010b). The main impacts climate change may have on the food and beverage manufacturing industry are as follows (Acclimatise, 2010b):
Security of primary commodity supply
Food and drink quality (e.g. bacterial growth)
Impacts to factories and depots
Worker health and safety (e.g. heat stress)
Environmental compliance
Utility supplies (water, electricity and gas)
Commodity price fluctuation and increases.
3.1.4 Primary extractive industries
Primary extractive industries are widely perceived to be at risk from climate change (Acclimatise, 2010c) for several reasons:
1. They are reliant upon long-lived and capital-intensive assets.
2. The majority operate in regions that are the most vulnerable to climate change, including the Arctic, offshore environments and developing countries.
3. They have extensive product transportation networks and rely on deep and complex supply chains, both of which make operations vulnerable to disruption.
4. In developing countries, they depend on workforces and communities that are geographically and socio-economically vulnerable to a changing climate.
5. The legacy of pollution left by historical activities is a major environmental issue for such industries, and there is the potential that climate change-related environmental impacts will increase pollution risks and make fragile environments even more stressed.
As a result, companies within the primary extractive industry are particularly at risk from climate change-driven impacts, from both direct physical impacts (including day-to-day and seasonal variability in weather and extreme events) and indirectly through reputation and brand value, and legal and regulatory challenges (Acclimatise, 2010c).
3.1.5 Chemical manufacturing
The concentration of chemical manufacturing assets along the coast and riverside ports, as a result of the sub-sector’s heavy reliance on maritime logistics and pipeline infrastructure, means that they are particularly exposed to physical risks, such as coastal erosion and flooding by sea level rise, tidal and storm surges (Acclimatise, 2010c). Future physical risks for chemical manufacturing companies are centred on the sub-sectors:

Business, Industry and Services 23
1. Use of water and subsequent discharge (environmental compliance)
2. Security of supply chains
3. Impacts to factories and depots
4. Worker health and safety (e.g. heat stress)
5. Utility supplies (water, electricity and gas)
6. Commodity price fluctuation and increases
7. Storage and transportation of volatile chemicals, plus disposal of hazardous waste (Acclimatise, 2010c).
On the other hand, leading chemical manufacturing companies advocate their position as part of the solution to tackling the effects of climate change rather than part of the problem (Ceres, 2006; Lehman Brothers, 2007; EEF, 2009; Kandel, 2009). Products from the chemical industry could be used in many adaptive technologies, in the development of new materials and in aiding the acceleration of technical advances (Deutsche Bank, 2007; Lehman Brothers, 2007).
3.2 Cross-sectoral and indirect risks Step 2
This section explores cross-sectoral links based on the systematic mapping of causes, processes and consequences; and identifies the risks in other sector reports that are pertinent to the sector.
Many of the risks examined for this sector are linked or interact with risks in other sectors of the CCRA. This means that some risks that are pertinent to the Business, Industry and Services sector are not addressed in this report because they have been covered in one, or more, of the other sector reports. In addition, some of the impacts identified in this sector have far-reaching consequences across other sectors. As such, this report should be read within the context of the above associated sector reports.
Important linkages with other sectors and respective Tier 2 impacts, detailed in sub-bullet points include the following:
Floods (and to a lesser extent coastal erosion) impact on many aspects of the Business, Industry and Services sector, including direct effects on assets, business disruption, investment portfolios and insurance:
- FL6: Residential property at risk of flooding
- FL7: Non residential property at risk of flooding
- FL8: Transport links at risk of flooding
- FL11: Energy generation and distribution installations at risk of flooding.
Food and beverage sub-sector impacts will cascade to the Agricultural sector and vice versa:
- AG1: Mean yield variability with summer rainfall
- AG2: Flooding risk to crop and pasture land
- AG3: Crop diseases
The availability of water for industry and business is directly related to the Water sector, which includes supply and demand across all sectors:

24 Business, Industry and Services
- WA1: Relative aridity
- WA2: Low river flows
- WA4: Water demand
- WA5: Water supply demand deficit
- WA8b: Number of sites with unsustainable abstractions (industry)
Disruption to transport is covered in the Transport sector:
- TR2: Landslide impact on the road network
- TR5: Rail buckling
- TR6: Bridge scour
Disruption to energy supplies is covered in the Energy sector:
- EN1: Flooding of energy infrastructure
- EN10: Energy transmission efficiency
Impacts on buildings are covered in the Built Environment sector:
- BE3: Overheating of buildings.
Systematic Mapping
The systematic mapping process provides a clear indication of the important inter-relationships between Business, Industry and Services sector and the other 10 sectors of the CCRA, whether they are natural environment/ resource-based sectors (e.g. biodiversity or energy) or infrastructure-based sectors (e.g. built environment and transport) (Table 3.2).
Subjective grouping of an inter-sector cluster analysis identified six themes, as shown in the Systematic Mapping report, Section 4.2 (HR Wallingford, 2011).
Throughout the systematic mapping process, the number of consequences attributed to the Business, Industry and Services sector increased with every successive pass. For all other sectors, the opposite occurred. This suggests that for many sectors of the CCRA, the overall end-point consequence (regardless of the sector) is very likely to be an effect on the Business, Industry and Services sector, either through changes (typically adverse, but often beneficial) in revenues or business growth/ continuity. Indeed it is noticeable that the final consequence of many impacts relates to the Business, Industry and Services sector.
An example of this interaction is illustrated in Figure 3.2, which shows a selected systematic map extracted for the Business, Industry and Services sector. It highlights the causes and consequences over 4 tiers leading to an effect on water demand for business via the agricultural and built environment sectors.

Business, Industry and Services 25
Table 3.2 Some interrelationships between Business, Industry and Services and other sectors
Systematic mapping Pass No.
Description Sector Report Note
5 Health care service demands
Health
Changes in the demand for health care may have an effect on workers through changes in access to health care and knock-on effects on productivity.
5 Energy demand Energy
Changes in energy demand may increases prices for business or mean that there are additional requirements for high demand industries to consider alternative sources, including private power generation.
5 Human illness/ morbidity
Health Changes in human health may affect business through seasonal or annual declines in productivity.
5 Land availability/ suitability
Built environment A reduction in suitable land for business and industry to develop may hinder growth.
5 Raw water quality Water
Decline or changes in water quality may affect business and industry by increasing treatment costs or utilising alternative sources.
4 Mine water outbreak Water
Acid mine drainage may affect business and industry by reducing bathing water quality in rivers and estuaries and/ or increase treatment costs of water for industrial or agricultural users.
4 Development sites Built environment A reduction in suitable land for business and industry to develop may hinder growth.
4 Travel demand Transport
Increasing demand for travel in certain parts of the UK’s road, rail, sea and air network may cause increasing delays for business and supply chains.
4 Renewable energy potential
Energy Opportunities for business are possible from a changing socio-economic situation.
4 Land use Built environment
A reduction in suitable land for business and industry to develop may hinder growth. Also agriculture/ forestry may be affected.
4 Marine loss/ damage Marine
Loss of fisheries and associated economically important marine areas will affect businesses that rely of natural marine resources.
3 Loading (waves) Marine Increased wave pressure may affect shipping and port operations, with a subsequent effect on supply chains.
3 Ship passage through arctic
Marine Global supply chains may be enhanced by the emergence of new arctic routes.
3 Port operations Marine Increased disruption to port operations may affect supply chains.
3 Damage to shipping Marine Increased disruption to shipping operations may affect supply chains.

26 Business, Industry and Services
Systematic mapping Pass No.
Description Sector Report Note
3 Pests/ mould Agriculture
Agricultural industry and other associated businesses along supply chains could be affected by increased prevalence of pests/ mould at source or during transit/ storage.
3 Potential yield Agriculture/ Forestry
Agricultural/ forestry industry and other associated businesses along supply chain would be affected by decreases in yield. Also increases in yield for certain crops may have a beneficial effect.
3 Discolouration of potable water
Water Water companies may be affected increased treatment costs associated with discoloured water.
3 Tree/ crop damage Agriculture/ Forestry
Agricultural/ forestry industry and other associated businesses along supply chain would be affected by increased tree/ crop damage.
3 Housing demand Built environment Increased demand for housing, if not met by adequate supply, may affect the ability of business to attract workers.
2 Condensation ICT failure
Energy Increased condensation may affect ICT and communication equipment.
2 Drying time for products (paints)
Built environment
The construction industry may be affected by schedule delays resulting from increased drying times for paints and other products.
2 Non-native species invasion
Biodiversity Tourism and leisure may be affected by non-native species invasion. Also blighted areas may be closed to visitors.
2 Lifestyle patterns Health
Changes in lifestyle may benefit business through increased health, outdoor living, etc. promoting greater productivity.
2 Plant growth Agriculture
Agricultural/ forestry industry and other associated businesses along supply chain would be affected (adverse and beneficial) by changes in plant growth.
2 Habitat condition/ extent
Biodiversity Tourism may be affected by changes in biodiversity and the attractiveness of natural areas of the UK.

Business, Industry and Services 27
Figure 3.2 Systematic map for the Business, Industry and Services sector based on 4th pass cause of “water demand”
3.3 Selection of Tier 2 impacts Step 6
Following the production of the Tier 1 reports and consultation activities, a wide range of over 120 impacts, risks and consequences were identified for the Business, Industry and Services sector. It is important to note that many of the risks identified in the original Tier 1 reports are equally applicable to other sub-sectors of Business, Industry and Services, not just those addressed in these reports.
The key and marginal risks for the Business, Industry and Services sector are outlined in Table 3.3. This table explores the link between climate effect, impact, risk and consequence, with details of the scoring criteria (economic, social and environmental consequence, plus likelihood and urgency) and a short commentary on the significance of the risk for the Business, Industry and Services sector. The most important risks, plus a selection of lesser (marginal) risks, were taken forward into the Tier 2 analysis. The four marginal risks included in the analysis were at the request of stakeholders and reviewers (peer-reviewers and Government departments), with further justification of inclusion or exclusion presented in the “Comments” column in Table 3.3. Appendix 1 contains the full list of risks for the Business, Industry and Services sector, with scores presented.

28
Table 3.3 Key and marginal risks for the Business, Industry and Services sector
This table explores the link between climate effect, impact, risk and consequence, with details of the scoring criteria (economic, social and environmental consequence, plus likelihood and urgency) and a short commentary on the significance of the risk for the Business, Industry and Services sector.
Climate Effect
Impact Risk Consequence Scoring criteria Comment
KEY RISKS (above threshold score = 30)1
Likelihood: 3
Extreme events and incremental climate change
Wide variety of effects on investments
Reduced returns for UK financial institutions’ investments due to the absence of mainstreaming climate risk and adaptation into decision-making processes
Reduced financial performance and financial losses
Urgency: 2
As presented in Chapter 1.3, the financial services sector is a key component of the UK economy and internationally recognised as a core market, with several trillions of pounds in invested. Underestimation of climate change is likely to produce multiple exposures and risks, both within this sector and the wider economy, hence the high economic and social consequence scores.
Likelihood: 3
Incremental sea level rise and extreme events (storm surge and high precipitation)
Coastal erosion and inundation, and fluvial flooding of tourist assets
An increase in monetary losses as a result of an increasing proportion of UK tourist assets (natural and built) at risk from flooding
Asset damage and financial losses
Urgency: 3
Damage or loss of natural and built tourist assets is likely to be economically very detrimental to the UK-based tourism industry. It is likely that there are limited coastal defences in many locations and no industry wide coordination/understanding of risks; hence the likelihood and urgency for action are both high.

29
Climate Effect
Impact Risk Consequence Scoring criteria Comment
Likelihood: 3
Low precipitation
Low river flows and reduced groundwater recharge
A decrease in water (groundwater and surface water) availability for industrial usage
Operational disruption and increased operational costs
Urgency: 3
This risk is important across a number of business sub-sectors, with the potential to have significant consequences for operational expenditure and create conflict with other water users, which may cause reputational issues for the companies involved. The cross-sectoral nature of this risk and its far-reaching consequences results in a high urgency score.
Likelihood: 3
Incremental sea level rise and extreme events (storm surge and high precipitation)
Coastal erosion and inundation, and fluvial flooding of industrial assets
An increase in monetary losses as a result of interruption to business from flooding
Asset damage and financial losses
Urgency: 2
The concentration of industrial assets (oil, gas and chemical manufacturing) in coastal and riverside locations makes them particularly exposed to coastal and fluvial climate change impacts. The economic influence of these sub-sectors results in a high economic consequence score. Exposure is dependent upon levels of defence and understanding of the risk; many industrial facilities already have active risk management procedures and a level of existing protection, so exposure is reduced and hence urgency for action is lower than that for tourist assets, for example.

30
Climate Effect
Impact Risk Consequence Scoring criteria Comment
Likelihood: 3
Extreme events and incremental climate change
Flooding, heat-or wind-induced damage to ICT infrastructure
A decrease in productivity and revenues due to ICT loss/ disruption
Asset damage, operational disruption and financial losses
Urgency: 2
Across business sub-sectors, ICT forms a fundamental part of organisations systems and transactions. With the high value of transaction rates per minute, unplanned ICT downtime represents a significant financial risk to the sector. From a business continuity perspective, it is likely that these risks are largely understood and planned for; hence the urgency of response is considered moderate.
Likelihood: 3
Extreme events Flooding, heat-or wind-induced damage to insured property
Increased exposure for mortgage lenders
Reduced financial performance and financial losses
Urgency: 2
Risks to properties are well understood so although likely to happen there is a low score for urgency. Economic and social score is moderate as property will be devalued, etc. Environmental impact is limited from a property perspective.

31
Climate Effect Impact Risk Consequence Scoring criteria Comment
MARGINAL RISKS (above threshold score = 25)1. Those risks selected for Tier 2 analysis are marked by 2
Likelihood: 2
Incremental sea level rise and extreme events (storm surge and high precipitation)
Flood damage to insured property
An increase in insurance industry exposure due to flooding 2
Reduced financial performance and financial losses
Urgency: 3
Insurance products are currently determined largely, but not exclusively, by historic risk profiles. An increase in extreme event frequency or geographic clustering is likely to create significant challenges for the insurance industry. If products do not consider future climate impacts, there is the potential that the insurance industry may face significant economic consequences. The urgency is considered high, due to the need for industry-wide coordinated action. Some action is already underway and therefore there is a moderate likelihood score.
Likelihood: 3
Incremental climate change
Amelioration of climatic conditions conducive to tourism activities
An expansion of new or existing tourist destinations in the UK2
Increased revenue for the tourism sub-sector
Urgency: 2
An increase in temperatures may create opportunities for the UK-based tourism industry, as the appeal of the UK as a tourism destination improves. The increase in visitor numbers will translate into increased revenue. The UK-based tourism industry is largely dominated by SME’s, with relatively high adaptive capacity and an entrepreneurial-spirit; hence the urgency for action is viewed as moderate.

32
Climate Effect Impact Risk Consequence Scoring criteria Comment
Likelihood: 3
Extreme events Physical damage to transport and supply chain infrastructure
A decrease in output for UK businesses due to an increase in supply chain disruption as a result of extreme events2
Operational disruption and financial losses
Urgency: 2
Across the sector, the supply chain (source, storage, transport) is likely to be highly sensitive to extreme events. Exposure to disruption is dependent on the complexity and flexibility of the supply chain (e.g. use of multiple suppliers, transport modes), which is likely to be highly variable between and within sub-sectors. As a result, a moderate urgency score is assigned.
Likelihood: 3
Increase in average temperatures and extreme events (heat waves)
High ambient air temperatures
Loss of staff hours due to high internal building temperatures2
Operational disruption and reduced profitability
Urgency: 2
This risk is likely to be more prevalent in urban areas (due to urban heat island effects) and in industrial / manufacturing sub-sectors, with moderate social consequences and minimal economic consequences. The largely localised nature of this risk results in a moderate urgency score.

33
Climate Effect Impact Risk Consequence Scoring criteria Comment
Likelihood: 3
Incremental sea level rise and extreme events (storm surge and high precipitation)
Coastal erosion and inundation, and fluvial flooding of transport infrastructure
Disruption from flooding of assets, transport links and supply chain
Operational disruption and financial losses
Urgency: 2
This risk is a sub-set of the supply chain risk described above (and hence not taken further in the Tier 2 analysis). This risk focuses purely on the impacts from coastal erosion, inundation and fluvial flooding on transport infrastructure; impacts that are likely to occur at a local or regional scale. Furthermore, many of the UK’s major transport facilities (e.g. ports, airports) already have active risk management procedures and a level of existing protection; hence urgency for action is considered moderate.
Likelihood: 3
Extreme events and incremental climate change
Wide variety of effects on investments
Loss of reputation due to interplay between environmental, community and climate change pressures
Reputational damage, loss of investor confidence and reduced financial performance
Urgency: 2
Climate change has the potential to create or exacerbate tensions that lead to reputational damage, by impacting shareholder values, the surrounding environments and local communities. Once stakeholders become aware of company exposure to climate change risks, there are potential economic consequences through knock-on effects on brand equity and share value. This risk is largely confined to large multi-national companies, with significant fixed assets and hence not entirely typical for the Business, Industry and Services sector. Due to this reason, this risk has not taken forward into the Tier 2 analysis.

34
Climate Effect Impact Risk Consequence Scoring criteria Comment
Likelihood: 2
Incremental climate change
Changes in the mobility, etc. of contaminants, whether held at surface or below ground.
Incremental climate change may mean that there is an underestimation of decommissioning liabilities and end of life costs
Decommissioning provisions (which are treated in additions to debt) create future debt burden
Urgency: 2
Decommissioning of large fixed assets is a complex and expensive procedure. Due to the long-lifespan of such assets, it is unlikely that climate change impacts have been considered in decommissioning obligations, with the danger that costs have been underestimated. Given the number of assets across industrial sectors that will be decommissioned over coming decades, the economic consequences could be significant. Furthermore, poorly scoped decommissioning could have environmental consequences. This risk is largely confined to the oil, gas and chemical manufacturing sub-sectors and hence not entirely typical for the Business, Industry and Services sector. Due to this reason, this risk has not taken forward into the Tier 2 analysis.
Likelihood: 3
Increase in average temperatures and extreme events (heat waves)
Increased air temperature leads to increased energy usage for cooling systems for machinery
Increased operational costs and reduced financial performance
Urgency: 2
Climate change has the potential to impact industrial asset performance, maintenance procedures and design. An incremental increase in temperature is likely to reduce equipment efficiency or cause failure, with associated economic consequences. Furthermore, adaptation actions (e.g. increased cooling systems) will have implications for emissions management and compliance. This risk is largely confined to industrial sub-sectors and hence not entirely typical for the Business, Industry and Services sector. Due to this reason, this risk has not taken forward into the Tier 2 analysis.

35
Climate Effect Impact Risk Consequence Scoring criteria Comment
Likelihood: 3
Low precipitation and increase water temperature
Low river flows and high river temperatures
Seasonal precipitation and water temperature effects wastewater treatment systems
Increased operational costs and regulatory compliance issues
Urgency: 2
Climate change is likely to cause a reduction in river flow and as a result, the capacity of rivers and lakes to dilute industrial effluent may also be reduced. As a consequence, there may be the requirement for increased effluent treatment prior to discharge to meet more stringent discharge limits on water quality. This may result in higher costs for compliance, due to requirements to step-up environmental monitoring and potential installation of additional effluent treatment to ensure continued compliance. This risk is largely confined to industrial sub-sectors and hence not entirely typical for the Business, Industry and Services sector. Due to this reason, this risk has not taken forward into the Tier 2 analysis.
Likelihood: 2
Incremental climate change
Reduction in the availability of natural resources
Incremental climate change may lead to higher risk of conflict and environmental incidents which could affect environmental and social licence to operate with loss of consumer confidence
Reputational damage, loss of consumer confidence and reduced financial performance
Urgency: 2
Climate change is likely to present a number of challenges to the management of natural resources, with the potential for conflicts to arise with other users and interested groups. Stakeholder perceptions and expectations have the potential to affect a company’s license to operate and the regulatory environment, together with their reputation. Multi-national companies with operations in regions already experiencing resource stress are likely to be more exposed. The issue of national security and international interventions was explored more generally in the Foresight (2011a) “International Dimensions of Climate Change” report and as such, this risk has not taken forward into the Tier 2 analysis.
Notes 1 These threshold values were selected to provide a degree of consistency with other sectors, in order to facilitate a comparison of impacts across sectors. See Table A1.2 for a list of all Tier 1 scores and Defra (2010b) for formula used to score. 2 Included in Tier 2 assessments, on request by stakeholders and reviewers (peer-reviewers and Government departments).

36 Business, Industry and Services
3.4 Identification of risk metrics Step 7
The ten selected Tier 2 impacts are listed in Table 3.4. The next step is to identify risk metrics for each impact (see Step 7, Section 2.5).
The Business, Industry and Services sector is typified by a lack of publicly available quantitative data. Information that is currently collected is often considered commercially sensitive and remains undisclosed for confidentiality purposes. There are limited regulatory requirements on the sector to report the current and future projected impacts of climate change or its proposals for adapting to climate change, other than for those organisations that report under the Adaptation Reporting Power9.
Furthermore, the consequences for business are usually economic, making the links between climate impacts and consequences complex. As such, the development of useful risk metrics is challenging, but possible in some cases.
Following review and liaison with sector representatives, the metrics available for the priority risks and opportunities in this sector are shown in Table 3.4. Further information on the elaboration of these risk metrics is included in Chapter 4.
Table 3.4 Selection of risk metrics
Ref. No. Risk Description Risk metric considered in the analysis
BU1
Reduced returns for UK financial institutions’ investments due to the absence of mainstreaming climate risk and adaptation into decision-making processes
Internal rate of return (£)
Tangible and intangible asset value (£)
BU2
An increase in monetary losses as a result of an increasing proportion of UK tourist assets (natural and built) at risk from flooding
Number of UK beaches and English fixed tourist assets and infrastructure
Tourism Direct Gross Value Added (TDGVA) (£)
Avertive Expenditure (£)
BU3
A decrease in water (groundwater and surface water) availability for industrial usage
Number of industrial surface- and groundwater abstractions (total and consumptive) per England and Wales river basin district (RBD)
%-age total industrial abstractions within compliant water bodies per region (England and Wales)
Turnover equivalent of the impact of changes in water abstraction analysed using selected groups of the standard industry classifications
BU4
An increase in monetary losses as a result of interruption to business from flooding
Business interruption costs based on annual gross incurred weather-related insurance claims (£)
Expected Annual Damages insurance claims for Non-Residential Property (£)
9 For example, utilities such as water and energy companies, transport organisations such as airport operators, harbour authorities, etc. For the full list see: http://www.defra.gov.uk/environment/climate/documents/rp-list.pdf

Business, Industry and Services 37
Ref. No. Risk Description Risk metric considered in the analysis
Loss of staff time and proportion of business turnover due to increased flood risk, analysed using section and selected division level standard industry classifications
BU5
A decrease in productivity and revenues due to ICT loss/ disruption
Number of days of productivity lost per annum
Loss in business revenues (£) per annum
BU6
Increased exposure for mortgage lenders
Number of UK properties
Gross mortgage value (£) for residential property by UKCP09 region (England and Wales)
BU7
An increase in insurance industry exposure due to flooding
Annual weather-damage related insurance claims (£) for commercial and domestic properties
Number of properties in England and Wales inside the 1:75 year flood (fluvial and tidal) return period flood zone
BU8 An expansion of new or existing tourist destinations in the UK
Tourism Comfort Index (TCI)
Tourism Direct Gross Value Added (TDGVA) (£)
Serviced accommodation room occupancy days per annum
BU9 A decrease in output for UK businesses due to an increase in supply chain disruption as a result of extreme events
Internal rate of return (£)
Tangible and intangible asset value (£)
BU10 Loss of staff hours due to high internal building temperatures
Lost productivity as a result of over-heating in the workplace, analysed using section and selected division level standard industry classifications

38 Business, Industry and Services
4. Sector Risk Analysis
4.1 Introduction and response functions Step 8
This chapter forms the main body of the report, with the results and discussion of the Tier 2 analysis presented. As outlined in Section 2.6, the CCRA methodology utilises response functions, which define how climate impacts and their consequences on the Business Industry and Services sector vary with key climate variables (e.g. mean and maximum temperature or precipitation), based on past and current observations and expert interpretation. This relationship can then be scaled using climate projections to determine the future risk to the sector. The selection of response functions for the Business, Industry and Services sector is presented in Table 4.1.
As explained in Sections 2.6 and Section 3.4, due to the inherent complexity of the sector and data inadequacies, it was not always possible to determine suitable response functions. Where this is the case, a brief explanation is given in Table 4.1 and Step 9 of the methodology (estimates of changes in selected climate change scenarios) involved a qualitative literature review, to further elaborate on the potential implications of climate change.
Table 4.1 Selection of response functions
Ref. No.
Risk Description Response function available? In cases where none is available, a brief explanation is also given.
BU1
Reduced returns for UK financial institutions’ investments due to the absence of mainstreaming climate risk and adaptation into decision-making processes
No
Financial services sector contains a diversity of actors
International exposure
Intrinsic vulnerability
Limited substantive evidence of the consequences of changes in climate on UK financial institutions
Myriad of socio-economic factors (e.g. exchange rates, financial regulations) mask any potential climate change effect
BU2
An increase in monetary losses as a result of an increasing proportion of UK tourist assets (natural and built) at risk from flooding
Yes
BU3 A decrease in water (groundwater and surface water) availability for industrial usage
Yes
BU4 An increase in monetary losses as a result of an increasing proportion of industrial assets at risk from flooding
Yes

Business, Industry and Services 39
Ref. No.
Risk Description Response function available? In cases where none is available, a brief explanation is also given.
BU5 A decrease in productivity and revenues due to ICT loss/ disruption
No
Very little suitable literature that specifically considers the potential impacts of climate change on ICT and its knock-on effects to business
BU6 Increased exposure for mortgage lenders
Yes
BU7 An increase in insurance industry exposure due to flooding
Yes
BU8 An expansion of new or existing tourist destinations in the UK
Yes
BU9 A decrease in output for UK businesses due to an increase in supply chain disruption as a result of extreme events
No
Supply chains are highly complex, with a network of interconnected, yet independent elements
Many climatic factors can disrupt supply chains, making a single response function too simplistic
BU10 Loss of staff hours due to high internal building temperatures
Yes
4.2 Estimates of changes in selected climate change scenarios
Step 9
This section explores the impacts of climate change on the ten selected Business, Industry and Services sector risks (Table 4.1). Where response functions are available, UKCP09 projections are applied to these response functions to estimate consequences under different future scenarios. The results presented in this section are for climate change impacts only, i.e. they consider the impacts of climate change under today’s socio-economic baseline. Social and economic drivers are only introduced in Chapter 5.
M Confidence assessment from high (H) to low (L)
3 High opportunity (positive)
2 Medium opportunity (positive)
1 Low opportunity (positive)
1 Low risk (negative)
2 Medium risk (negative)
For each metric a scorecard is given at the start of each section to indicate the confidence in the estimates given and the level of risk or opportunity. Confidence is assessed as high (H), medium (M) or low (L). Risks and opportunities are scored either high (3) medium (2) or low (1) (shown to the right). These are given for the lower (l), central (c) and upper (u) estimates for the 2020s, 2050s and 2080s. Further information is provided in Appendix 1. Where estimates are uncertain, or no data is available, this is stated in the scorecard. 3 High risk (negative)

40 Business, Industry and Services
4.2.1 Reduced returns for UK financial institutions’ investments due to the absence of mainstreaming climate risk and adaptation into decision-making processes (BU1)
Summary Class
2020s 2050s 2080s Metric code
Risk description
Co
nfi
den
ce
l c U l c u l c u
BU1 Reduced returns for UK financial institutions’ investments due to the absence of mainstreaming climate risk and adaptation into decision-making processes
L Too uncertain
Introduction
For the financial services sub-sector, the most significant climate-related risk is that financial institutions fail to mainstream climate change adaptation considerations into their investment decisions. Currently, there are no (or very few) financial institutions that are incorporating current and future climate risk and adaptation considerations into their governance and risk management processes (Stenek et al., 2010). This view was supported by Mercer and the Cambridge Programme for Sustainability Leadership in discussions with them made as part of this study10. Research has shown that financial institutions that fail to integrate climate risk and adaptation considerations into their processes are likely to be affected by climate change through:
Financial and credit performance of individual investments and investment portfolios (loans, equity, guarantees, etc.).
Reputation, if by failing to assess and manage climate risks institutions fall short of growing stakeholder expectations on adaptation.
Investor pressures for climate risk and adaptation disclosure, and climate resilient risk management.
Legal liabilities, if decisions fail to take into account the reasonably foreseeable impacts of climate change and information is not provided on the material risks of climate change.
Market changes in the event of a change in demand for finance from governments, commercial and individual clients. For the financial institutions, this may represent a lost opportunity to finance adaptation (Stenek et al., 2010; KPMG, 2008; UNEPFI, 2011).
Each of these consequences are explored in more detail below, utilising published information to illustrate the state of knowledge on the interactions between the financial performance and the risks to individual investments and investment portfolios for UK financial companies, and their exposure to climate change.
Reduced financial and credit performance
Past weather events provide evidence of how climate-related events can affect ‘real sector’ (non-financial sector) investments and, in return, affect the financial and credit performance of debt, equity and other financial instruments (as shown in Box 4.1). It is
10 Entec, Pers. Comm., 2010.

Business, Industry and Services 41
worth noting, however, that climate factors are often part of a combination of other factors influencing credit-worthiness and profitability.
Under a changing climate, the use of historic climate data in financial models and credit risk analysis to make projections is no longer robust. The potential consequences are inaccurate forward-looking estimates, inadequate instrument pricing and structuring, higher default on loan repayments, and lower return on equity. For example, if an institution guarantees, as part of a risk sharing facility, loans to farmers in an area severely affected by water scarcity, it may have to cover higher losses than expected due increased rates of loan default as a result of reduced revenues (Stenek et al., 2010).
While recognition of current financial and credit risks due to climate change varies between financial institutions, most agree that they will become important in the future. Yet, climate change risk considerations are still not being incorporated into mainstream investment considerations (FairPensions, 2009).
Box 4.1 Examples of consequences of climate-related events on financial and credit performance of ‘real sector’ investments
Market conditions
Changes in customer needs, behaviours and demand in response to climatic changes will affect the revenues of a number of companies that fail to adapt to these changes. For instance, retailers that understand how weather affects sales and plan supply accordingly stand to benefit from climate-related impacts. For example, the hot UK summer of 2006 caused a reduction in total sales of 5% for the month of July (department stores reported that trade decreased by 7%).
Production output
The 2003 summer heat wave in Europe led to large losses in the agricultural sector totalling 13 billion Euros (~£11bn) in the European Union. For example, there was a 10% and 20% decrease in wheat output in the UK and France respectively, compared to the previous year. As wheat fodder is one of the principal ingredients of livestock feed, there were fears that reduced European wheat production would increase animal feed prices and affect farming revenues and investors (animal feed representing a significant share of total animal production costs, e.g. <60% for pigs). This justified intervention by the European Commission and European countries. Note that 2003 summer temperatures were considered exceptionally high (corresponding to a 1 in 500-year event), but are likely to become ‘normal’ by the 2040s and occur once every two years.
In Brazil, severe droughts led to major power disruptions as the country relies heavily on hydroelectric power. The cost to the national economy was estimated to be approximately US$20 billion (the equivalent of 2% of Brazil’s GDP). Individual power companies suffered significant losses: in 2001, AES Tiete had to postpone repayment of a US$300 million bond due to reduced revenues.
Commodity prices
Future increased volatility of commodity prices is expected in response to climate change. Research has found that Australian droughts have played a role in the sharp wheat price increases observed between 2006 and 2008. Such commodity price increases can affect revenues for industries using agricultural products as production inputs (such as animal production, food and beverage, and pulp and paper), although there are differences between producers depending on the amount of gross margins and on the capacity to pass-on price increases. For instance, in the wake of the 2008 global food crisis, major food and beverage producers suffered significant

42 Business, Industry and Services
increases in raw material prices: brewers (Scottish & Newcastle and Greene King) reported yearly price rises of 25%, 50% and 150% for malted barley, apples and hops in 2008 and Domino's Pizza announced a 48% reduction in its profits for the 4th quarter of 2008, due to the rising raw material bill.
Operating costs
Some assets will require higher maintenance costs to cope with climate change impacts. For instance, a section of the railway between London and Penzance in Southern England is subject to repeated speed restrictions and closures at Dawlish due to seawater overtopping. Sea level has been rapidly rising in the area at a rate of 450mm per year since the mid-19th century. The owner and operator of the rail line, Network Rail, spend significant amounts in repair and maintenance. Yearly costs for the most affected section average £500,000. With accelerated sea level rise, future seawater overtopping at Dawlish is projected to increase (between 120 and 115% compared to 1961-1990) and further affect the balance sheet of the operator.
(Sources: Morisson et al., 2009; Wight et al., 2008; Telegraph, 2008; RSSB, 2008; Acclimatise, 2006; McKie, 2006; COPA-COGECA, 2004; Stott et al., 2004.)
Reduced reputation
Most financial institutions with lending activities consider reputational risks from climate change as being already relevant today and agree that it will gain importance in the future (UNEPFI, 2011).
Large amounts of research on climate change adaptation have been done by civil society organisations, which highlight the level of stakeholder interest in the issue. Stakeholder expectations with regards to how UK financial institutions should integrate climate risk and adaptation considerations in their decision-making processes are changing and could affect the reputation of those financial institutions, which fail to mainstream climate change adaptation.
There are a number of on-going stakeholder-led developments, which are likely to result in higher pressure on financial companies to increase the climate resilience of their investment decisions and support adaptation investments, especially in developing countries where vulnerability is high and climate change threatens development progress. The most important stakeholder-led developments are presented in Box 4.2.
Furthermore, there could be significant consequences if financial institutions fail to take note of the impacts of climate change on the environmental or social performance of their investments. For instance, they may be criticised for supporting non-climate resilient projects or, worse, projects promoting “mal-adaptation” (e.g. high water withdrawals in water-stressed areas) (Morison et al., 2009). In some cases, concerns over climate risks and adaptation can influence government and community support of a project, as highlighted in Box 4.3.
Business, Industry and Services 43
Box 4.2 Major on-going stakeholder-led developments pushing for climate change adaptation mainstreaming
The review of the International Finance Corporation (IFC) Performance Standards on Social and Environmental Sustainability are likely to include climate change adaptation requirements, which is expected to influence a number of global finance standards, including the Equator Principles, to which many UK institutions are signatories.
Recent work by international financial institutions, such as the World Bank, the IFC and the European Bank for Reconstruction and Development (EBRD), are setting examples of good practice of mainstreaming climate risk management in banking activities.
The European Commission is revising its Environmental Impact Assessment (EIA) Directive. As indicated by the 2009 White Paper “Adapting to climate change: towards a European framework for action”, climate change adaptation should be included in the scope of this revision, which could mean that UK financial institutions will have to include such considerations in their due diligence processes for projects within the European Union.
In many countries, knowledge of climate change impacts is starting to influence national and local sector strategies, and regulatory frameworks, through the inclusion of climate change resilience considerations. For example, the World Bank Energy Sector Management Assistance Programme (ESMAP) is assisting governments to develop energy policies that are resilient to future climate change.
(Source: IFC, 2010: Stenek et al., 2010; World Bank, 2010b; European Commission, 2010 and 2009)
Box 4.3 Community and governmental opposition to mining project in Chile fuelled by climate-related concerns
In certain parts of the world, physical climate change impacts on water resources and communities are starting to affect planned projects.
Barrick Gold Corporation is facing strong stakeholder opposition to its Pascua-Lama project on the Argentina-Chile border to exploit gold, silver and copper reserves, though governments have approved the project.
Communities fear that mine construction and exploitation will further accelerate glacier melting (through dust deposition on the glacier), reduce water availability and contaminate water supplies. It appears that this perception of project risk to water could be linked to observations of receding glaciers. The company argues that glaciers have been receding for years because of temperature rise and that the project has state-of-the-art management measures in place to avoid impacts that could accelerate melting in the future.
The Argentinean and Chilean governments have also been hardening their positions in relation to mining operations near glaciers due to their vulnerability to climate change. A bill to curb mining activities in ice zones was recently passed by the Argentinean Parliament, which could make it more costly or even impossible for Barrick Gold to exploit the Pascua-Lama site, despite having committed already US$1.2 billion of the pre-production budget at the end of 2010.
(Source: Brenning, 2008; Barrick Gold, 2010; and Mines and Communities, 2010)

44 Business, Industry and Services
Investor pressures
There are a number of investor-led initiatives promoting corporate disclosures on physical climate risks and adaptation, including:
The Carbon Disclosure Project (CDP). In the UK, this is an independent not-for-profit organisation that sends out annual questionnaires on climate change mitigation and adaptation to the world’s largest private companies on behalf of 534 institutional investors with US$64 trillion in assets under management11. The CDP investor questionnaire includes questions on physical climate change risks, adaptation and governance, and companies’ answers are scrutinised by analysts and stakeholders.
The Investor Network on Climate Risks (INCR). This is a US initiative that supports more than 90 institutional investors with assets exceeding US$9 trillion in understanding the financial opportunities and risks of physical climate change12.
While these types of initiatives are non-mandatory, they may trigger in the short- to medium-term increased investor scrutiny with regards climate risk disclosure, higher scrutiny by stakeholders on climate risk management and increased activity of groups advocating for socially and environmentally responsible investment, including possibly shareholder resolutions on such issues (Baker and McKenzie, 2010).
Such a risk is particularly high in light of recent legislative and regulatory developments on mandatory climate risk disclosure in a number of countries. First, the UK Climate Change Act of 2008 empowers the Secretary of State to require companies with assets critical to the UK economy to disclose their risks and adaptation actions. In 2010, financial regulators in the US and Canada published guidance on existing requirements relating to disclosure of material risks, which informed public companies that disclosure of climate change risks can be required when they can be considered material13.
Legal liabilities
A number of lawyers acknowledge that there is now enough information available on the impacts of climate change to consider them “reasonably foreseeable” (Stenek et al., 2010; Dowden, 2005; Dowden et al., 2005). Company directors or asset managers who fail to take these impacts into account may incur liability in negligence (LCCP Finance Group, 2009). This contrasts sharply with the view among financial institutions that the level of information on current and future climate risks is not sufficient (UNEPFI, 2011).
Furthermore, landmark reports have stated that inclusion of environmental, social and governance considerations (including climate change impacts) in investment analysis falls under the fiduciary duty that asset managers legally owe their clients in most jurisdictions (UNEPFI, 2005 and 2009).
Finally, there is increasing attention from the legal community on the potential inconsistency between mandatory and voluntary corporate disclosures relating to climate risks and adaptation. Information provided in non-statutory documents, such as media advertisements or statements, can sometimes contradict or go further than what
11 See https://www.cdproject.net/en-US/WhatWeDo/Pages/overview.aspx (Accessed 14/01/2011). 12 See http://www.incr.com/ (Accessed 14/01/2011). 13 See www.sec.gov/news/press/2010/2010-15.htm and http://www.davis.ca/en/blog/Climate-Change-Law-Practice-Group/2010/11/04/Ontario-Securities-Commission-Releases-New-Guidelines-for-Environmental-Reporting (Accessed 13/01/2011).

Business, Industry and Services 45
is disclosed in formal disclosures, creating potential legal liabilities14 (Baker and McKenzie, 2010).
Lost opportunity to finance adaptation
Climate change is expected to have a profound economic impact (Stern, 2006). Some sectors and regions of the world will be economically favoured by changing climatic conditions, while others will see their competitiveness altered. Further, as climate change accelerates this century, adaptation investments to reduce vulnerability and exploit opportunities will likely increase.
Though there are uncertainties, climate change adaptation costs have been estimated at between US$70 and 100 billion per year by 205015, with East Asia and Pacific and Latin America and the Caribbean bearing the highest cost (World Bank, 2010). Distribution of adaptation costs per sector shows that infrastructure, coastal zones, water supply and flood protection will bear the largest share of total adaptation costs (World Bank, 2010a)16.
Financial institutions have an opportunity to take a leading role in providing finance to climate change adaptation (Stenek et al., 2010):
"A financial services sector that understands climate change and pro-actively drives adaptation is not only in the highest interest of broader economic stability and the societal well-being it underpins; it is clear that it will increasingly be in the very interest of financial institutions themselves" (UNEPFI, 2011).
Failure to understand climate risks and priorities for adaptation investment and adapt finance offerings accordingly could lead to missed revenues for the UK financial services industry.
Barriers to climate risk management mainstreaming by UK financial institutions
Having presented the risks resulting from failure of financial institutions to mainstream climate risk management into their decision-making processes, it is useful to briefly identify some of the barriers preventing this. In order to make progress towards this goal, it is proposed that reducing the intensity of these restraining forces would be the most effective option.
Surveys have shown that financial institutions do not feel sufficiently well informed on climate risks and adaptation to mainstream these considerations in their decision-making processes (UNEPFI, 2011). They report the need for user-friendly projections, analyses and advice on how to interpret climate-related information and evaluate quality and confidence of results. Information on future changes for a certain location or a defined time horizon is also required. The quality of information is also reported to vary across world regions and economic sectors (UNEP-FI, 2011).
Gradual changes in average climate conditions are often difficult to identify because of the lack of available evidence. Furthermore, there is little recognition of the potential investment implications of changes in average
14 For example, Columbia Law School in the US maintains a Climate Change Securities Disclosures Resource Centre, see http://www.law.columbia.edu/centers/climatechange/resources/securities#rules (Accessed 14/01/2010). 15 Depending on the climate change scenario retained and whether the positive impacts of climate change are deduced from adaptation costs or not. 16 Note that other economic assessments of climate change adaptation costs have found either lower (UNFCCC, 2007) or higher adaptation costs (Parry et al., 2009). There appears, however, to be a consensus that adaptation represents a significant financial challenge and will affect disproportionally certain regions of the world and economic sectors.

46 Business, Industry and Services
climate conditions. However, it is likely that these changes may have material consequences when investment critical thresholds are breached, possibly resulting in unforeseen operational costs, unplanned capital investment or falling revenues (Acclimatise, 2009d). A practical example of the effect of changing average climatic conditions on investments is given in Box 4.4.
UK equity fund managers expect governments will not achieve or implement strong legislation or regulation, short-term pressures to generate profit and the lack of standardised framework to disclose information (Trucost, 2009).
Box 4.4 Example of impact of average changes in climate on investments
Over 85% of Albania’s electrical power output originates from five large hydropower plants. Climate variability explains the large difference between hydropower production in very dry years and in abnormally wet years (2,900 GWh approximately). The combined effect of droughts, lack of investment in transmission and distribution systems, and absence of diversified energy generation assets explains recent difficulties in maintaining the country’s energy security, such as common power cuts.
Between 1961 and 1990, Albania has overall become drier, with annual average precipitation decreasing by over 1% in certain areas of the country. Due to climate change, summer precipitation is projected to decrease by 10% and 20% by the 2020s and 2050s, respectively. (There is less agreement between climate models on changes in average winter precipitation). Furthermore, annual average temperatures are expected to increase by about 1 to 2°C by the 2020s and 3°C by the 2050s, with the greatest temperature increases expected to occur in the summer months.
The coupled effect of average changes in temperature and rainfall (summer drying and rising temperatures) will lead to significant compound risks for the power industry in Albania, including:
Reduced annual runoff of ~20% by the 2050s, with expected decreases in electricity generation of ~15%
Increased demand for air conditioning and refrigeration in the summer when hydropower production is most constrained by reduced rainfall
Competition of small hydropower plants with other water users, such as agriculture, which will face a greater irrigation need and receives legal priority over water use.
(Source: World Bank, 2008; World Bank, 2010b; Bruci, 2008) There are some companies and organisations that have started on the journey towards climate resilience, including:
Barclays are developing their understanding of the potential impact of climate change, and the possible need and mechanisms for incorporating them into credit risk analysis and management, through support of various climate research programmes (Acclimatise, 2009c).
HSBC has established a Climate Change Centre of Excellence, which analyses the commercial implications of a changing climate for HSBC businesses and clients. It also aims to enhance knowledge or risks and opportunities and ensure integration within HSBC’s core financial services business (Stenek et al., 2010).

Business, Industry and Services 47
UK Universities Superannuation Scheme and other investment advisers are researching the implications of changing climatic conditions for key investment value drivers (such as efficiency and availability of assets for power investments) and demonstrate progress in knowledge of asset managers of the consequences of climate change impacts (Acclimatise 2009e, 2009f, 2009g, 2009h).
Group of 14 institutional asset owners and investors from around the world that work with Mercer, the UK Carbon Trust and the International Finance Corporation to explore the potential impact of climate change projections on asset allocation, as well as volatility and correlations among asset classes, regions and sectors17.
However, much more progress is needed if the risks of climate change for UK financial institutions are to be adequately managed and the opportunities to finance adaptation realised (INCR, 2010).
Key assumptions and limitations
The performance of financial institutions is dependent on many socio-economic drivers and discerning the effect of climate change is particularly challenging. This is made even more difficult due to the fact that information on credit scores and revenue is deemed commercially sensitive and therefore not widely available in the public domain. This naturally leads to information gaps when undertaking an assessment of climate-related risks and financial performance. Data that would enable such assessments to take place include internal rate of return and tangible and intangible asset value.
Conclusion
Whilst reduced returns and/or increased risks to investments of UK financial companies represent one of the largest climate change exposures for the UK industry as a whole, it has not been possible to undertake quantitative analysis on the basis of the available information. A detailed literature review reveals, however, the main potential consequences of failing to mainstream climate risk management into investment practices are: (i) reduced return on investment or credit performance of investments; (ii) reduced reputation; (iii) increased investor pressure; (iv) legal liabilities; and (v) lost business opportunity to finance adaptation.
Progress to take account of climate risk and adaptation considerations in UK financial institutions is slow and faces considerable barriers, such as the lack of knowledge and perceived lack of information. Failure to resolve these issues could ultimately affect the competitiveness of the UK financial services industry in the international market place. Furthermore, by mainstreaming climate risk management into their processes and practices, UK financial institutions have a role to play in promoting climate resilient ‘real sector’ investments.
Due to the potentially large economic consequence of this risk to the UK economy, it is recommended that it becomes a focus for further work in preparation for the next CCRA. For this to occur, there are significant challenges overcome, largely around the knowledge and data gaps that occur due to the confidential nature of credit scores and revenue information.
17 Some of the investor partners include AP1, APG, AustralianSuper, British Columbia Investment Management Corporation (bcIMC), CalPERS, CalSTRS, the Environment Agency Pension Scheme, the Maryland State Retirement and Pension System, the Norwegian Government Pension Fund, the Ontario Municipal Employees Retirement System (OMERS), PGGM and VicSuper Pty Ltd.

48 Business, Industry and Services
4.2.2 An increase in monetary losses as a result of an increasing proportion of UK tourist assets (natural and built) at risk from flooding (BU2)
Summary Class
2020s 2050s 2080s Metric code
Risk description
Co
nfi
den
ce
l c u l c u l c u
BU2 Monetary losses as a result of an increasing proportion of UK tourist assets at risk from flooding
M 1 1 2 2 2 3 2 3 3
Introduction
Although tourist assets are dispersed across the UK, there are concentrations in certain locations, for example along the coast and rivers (e.g. London). This makes them particularly susceptible to coastal (sea level rise and storm) and fluvial (river) flooding. In some areas of the UK (e.g. Cardiff), relative sea level is projected to increase by around 0.44 m (0.37 to 0.53 m) by the end of the 21st century (UKCP09). Such changes have affected, and will continue to affect, the tourism industry through increased infrastructure damage, additional emergency preparedness requirements, higher operating expenses (e.g. insurance, backup water and power systems, and evacuations) and business interruptions (Simpson et al., 2008).
This metric considers the impact of climate change on both:
1. Natural tourism assets, by exploring the impact of sea level rise on beach area throughout the UK; and
2. Built tourism assets and infrastructure, by assessing the numbers of tourist visitor attractions and facilities in England which are at risk from fluvial flooding and the potential associated increase in monetary losses.
4.2.3 The impact of sea level rise on beach area
During the last century, global average sea level rose by ~1.7 mm per year (Church and White, 2006), believed to be due to a number of factors including thermal expansion of warming ocean waters and melting of land-based glaciers. After adjustments for natural land movements, the average rate of sea level rise around the UK during the last century was approximately 1 mm per year (UKCP09). However, the rate for the 1990s and 2000s has been higher than this value (UKCP09). Future projections suggest that sea level change will display significant regional differences, due to land rise/ fall (due to post-Ice Age isostatic readjustment). For example, the most dramatic increases in sea level are anticipated in London and eastern England, where the land is subsiding (Shennan and Horton, 2002; Rennie and Hansom, 2011).
As sea level rises, the response on the open coast varies depending on the geomorphology but in all cases will result in some form of marine transgression. Beaches, dunes and shingle ridges will tend to ‘roll’ landwards, whereas cliffs are slowly eroded allowing the beach shore-face to migrate landwards. Where this is constrained, either by slowly eroding cliffs or sea defences, ‘coastal squeeze’ will occur, with the consequence that the area of beach and other natural coastal assets is reduced (Taylor et al., 2004). Furthermore, the combination of higher sea levels and greater loading from wave action will increase damage to natural and built assets

Business, Industry and Services 49
(Townend, 1994). Beaches are one of the key natural tourism assets in the UK and any change in their extent would clearly have a major impact on seaside resorts.
Metric response function
In order to gain an appreciation of the magnitude of the risk from projected sea level rise to these natural tourist assets, a high level assessment of the potential loss of beach area has been undertaken in this Tier 2 analysis.
The number and length of beaches around England, Scotland and Wales has been digitised from OS Maps (Figure A2.1). For Northern Ireland, the beach lengths were assessed using Google Earth. The projected sea level rise for England and Wales, Scotland and Northern Ireland, combined with an assumed slope for the (lower) beach, was used to estimate the amount of beach area lost.
Climate change projections
Using the UKCP09 projections for future sea level rise, there is a risk of beach loss of 3 – 16 km2 (300 – 1600 hectares) by the 2020s, rising to 12 – 61 km2 (1200 – 6100 hectares) by the 2080s (which is between approximately 3% and 7% of total beach area). Uncertainty in the estimate is considered by testing the results against different assumptions on beach slope and on proportion of beaches that might be affected (Table A2.1).
Key assumptions and limitations
There are a number of key assumptions and limitations with this methodology:
For all the beaches considered, it was assumed that the beach high water mark is unable to move landwards.
Beaches on most of the 291 inhabited islands around the UK, including the beaches of the Outer Hebrides, were excluded from this analysis.
The accuracy of the analysis is constrained by the resolution of the beach dataset. It is known that the Environment Agency is in the process of compiling a detailed dataset, which would enable a more detailed estimate to be made, but that this dataset is unfortunately not yet available.
Coastal geomorphology, oceanography and sediment transport processes are very complex and difficult to model. This analysis takes a very simplistic view; it is important to stress that localised responses will depend on the regional geomorphological setting.
Conclusions
The consequence of the estimated change in beach area is to contribute to increased pressure for space in some of these beaches, when demand is already high in the summer months and potentially may increase in the future (see Section 4.2.10). Beaches particularly exposed to loss of area could experience reduced popularity, as overcrowding dissuades visitors and as a consequence, the local tourist economy suffers. Conversely, beaches less vulnerable to physical change could become increasingly attractive, leading to “honeypots”, which providing the carrying capacity of the destination ecosystem, infrastructure network and social system can support increased numbers, would result in thriving local tourist economies.

50 Business, Industry and Services
4.2.4 Number of tourist visitor attractions and facilities at risk from fluvial flooding
Current projections suggest that flooding may increase in the winter due to increased winter rainfall. The increasing trend in the UK to cater for visitors all year round means that the tourism industry may be impacted, with tourist attractions and facilities damaged by floods. In addition, as temperature rises, it is likely that the frequency and magnitude of intense summer storms may increase. Tourists are particularly active in the outdoors during this season and as a consequence may be affected. Visitor discomfort, distress, injury or fatality could result in significant negative public relations and reputational risks for the destination and businesses involved. Negative public relations could follow the cancellation or postponement of bookings due to weather-related events, and ultimately reduce visitor numbers and revenues (DCMS, 2010a). As an illustration, Box 4.5 describes the impacts of the floods of 2007 on the UK’s tourism and leisure sector.
Box 4.5 Impacts of floods of summer 2007 on tourism and leisure sector
During the 2007 floods, businesses in the tourism and leisure sector suffered with fewer customers and lost revenue. Some hotels benefited from people displaced by the floods, demands for takeaways increased, with people unable to cook, and building firms were inundated as the recovery process began.
English Heritage and National Trust visitor attractions were significantly affected by the floods of summer 2007, as well as numerous World Heritage Sites, suffering both physical damage and lost revenue. World Heritage Sites affected included Birdoswald Roman Fort (part of the Hadrian’s Wall Site), Fountains Abbey, Ironbridge Gorge, Derwent Valley Mills and Blenheim Palace. Many listed properties were also affected. During August 2007, DCMS18 announce a £1 million cash injection to promote tourism, rural destinations and visitor attractions, which is likely to have been a response to the flood losses.
(Source: Pitt, 2008)
Metric response function
A range of stakeholders across the UK were contacted to obtain data on tourism assets at risk of flooding. Responses received indicated that data was either not available or incomplete, and as a consequence the data used in this metric has been based on research undertaken by DCMS (2010b). This study focused upon assets in England and unfortunately at present no equivalent sources have been identified to enable analysis to be extended to the Devolved Administrations (DAs).
By drawing on published material from partner organisations (e.g. English Heritage, 2009; Visit Britain’s National Tourism Product Database, 2009), the DCMS report (DCMS, 2010b) made an assessment of the number of buildings within the tourism and leisure sectors in England at risk from fluvial flooding.
Utilising the Environment Agency's flood risk zone map (2008), 33,069 English buildings within the tourism and leisure sector were identified as being in areas within Flood Zone 3 (High Risk). These include listed buildings and churches (Table A2.2), a range of tourist buildings and assets (Table A2.3) and arts, theatres, museums and archive buildings (Table A2.4). Areas within Flood Zone 3 are those affected by a 1 in 100 year return period fluvial event or a 1 in 200 year return period tidal event. The flood zones do not account for protection afforded by flood defences. In the
18 Department for Culture Media and Sport

Business, Industry and Services 51
assessment by DCMS (2010b), by far the most numerous building type exposed to flood risk were English listed buildings and churches, with 28,659 identified.
Climate change projections
Utilising UKCP09 data and work carried out by the CCRA Floods sector (Ramsbottom et al., 2012), change in the return period of flood for the current area (which has a return period for 1 in 100 years) has been projected for the 2020s, 2050s and 2080s for England and Wales (Table A2.5 and Table A2.6). The data shows how the risk to the tourism assets currently located in the English Flood Zone 3 zone may change in the future, with assets currently at risk projected to become more so. The 1 in 100 year flood event19 is projected to become approximately twice as frequent (range of no increase in frequency to 7 times increase in frequency) by the 2050s and 3-5 times more frequent (range of no increase in frequency to 12 times increase in frequency) by the 2080s. These are average UK estimates and are based on the medium emissions scenario and p50 (50% probability level) estimate.
Key assumptions and limitations
There are a number of limitations with the methodology outlined above:
Whilst the data show how the risk to tourism assets currently located in the English Flood Zone 3 zone may change, it is limited in that there is no expansion of the geographical area of Flood Zone 3.
Changes in flood frequency are average values for the UK as a whole; significant regional and local variability is likely to exist.
The breakdown of risk by coastal or fluvial flooding was unavailable for this assessment.
Location information for each of the assets highlighted in Table A2.2 to Table A2.4 was not available for this assessment.
As a consequence of these limitations, it has not possible to provide a quantified estimate of tourism assets at risk. However, potential financial implications from flooding on built tourism assets are explored below.
Increase in monetary losses associated with risk of flooding
There have been a number of regional studies that examine climate impacts on the visitor economy (e.g. McEvoy et al., 2006, Frost, et al., 2010), some of which include the impact of flooding. No previous studies, however, have been identified that have evaluated the impact flooding currently has or is predicted have upon Tourism Direct Gross Value Added (TDGVA) at a national scale. There are also standard approaches to considering flood risk in relation to recreational gains and losses (Multi-Coloured manual, 2005 and updated 2010) but these are based upon visitor numbers; figures unavailable for this study.
As presented in Table A2.5 and Table A2.6, it is clear that flood risk is going to change in each region and that ultimately this will have impacts on total TDGVA. As discussed above, however, it has not been possible in this analysis to establish what proportion of total tourism assets are located in each English region of Flood Zone 3, and therefore what proportion of the TDGVA will be affected as a result of flooding.
Nevertheless, a high level estimate can be made of the potential value of the risk to properties highlighted in Table A2.2 through the concept of ‘Avertive Expenditure’; an established method used to conservatively assess the value of damages to sites of national or international importance, that otherwise might simply be considered
19 The threshold definition for assets at risk of fluvial flooding to fall into Flood Zone 3

52 Business, Industry and Services
‘priceless’. A damage cost is simply calculated by estimating the cost of a flood bund around each building. Assuming the average length of bund required is 150m, at a nominal average UK construction cost of £5,000 per metre, and an expected lifetime of 50 years, this equates to a total present-day annual average ‘damage’ value20 of £40,000 per year21. Considering the changes to flood frequency highlighted in Table A2.5, this annual average damage cost estimate for the 312 buildings listed in Table A2.4 would increase to £100,000 by the 2050s and £0.12-0.24 million by the 2080s.
Assessing the value of damages to assets in Table A2.3 is more difficult, even at such a simplified level as undertaken above. The reason is simply the broad range of assets described, including natural features, holiday villages, and campsites. The financial impact of tourism assets at risk of flooding has therefore not been fully assessed, and could be significantly higher than the figures estimated above.
Furthermore, it is worth highlighting that climate-related impacts to the tourism sector are much broader. For example in summer 2010, heavy rainfall in Cornwall led to severe flooding and closure of the railway line into the county as a result of landslips. These are the worst floods Cornwall has experienced since Boscastle in August 2004, which cost insurers £15 million.
Conclusions
The tourism sector forms a large part of the local economy for many communities in the UK, particularly on the coast. Increasingly, the impacts of climate change will offer both challenges and opportunities (as discussed in Section 4.2.10) for the tourism sub-sector. Increased flooding is likely to have an adverse impact. Whilst fluvial flooding and coastal storms are more likely to occur outside the traditional summer tourist season, the risk of summer flooding will increase and sea level rise is an ever-increasing threat.
Many tourist visitor attractions and facilities are at risk of flooding and this risk is likely to increase. Unfortunately, it has not been possible to fully monetise the risk of fluvial flooding on built tourism assets, but even this qualitative analysis shows how the risk of flooding is projected to increase, with increased risk to tourist assets in the absence of appropriate defence measures. It is also worth noting that the historical and cultural importance of some assets makes the impact of flooding especially significant, while at the same time posing particular adaptation challenges.
4.2.5 A decrease in water (groundwater and surface water) availability for industrial usage (BU3)
Summary Class
2020s 2050s 2080s Metric code
Risk description
Co
nfi
den
ce
L c u l c u l c u
BU3 A decrease in water availability for industrial usage
L 1 1 2 1 2 3 1 3 3
Introduction
The amount of water that can be abstracted for public water supply, agriculture and industry is sensitive to the annual water balance and subject to changing licence conditions (Rance et al., 2012). One of the key findings of the Water sector report is that water abstraction may become unsustainable in a large proportion of UK rivers due
20 Assumes all floods of 1 in 100 years and greater cause the same damage 21 0.01 (return period) x (£5,000*0.02) x 150m x 312 buildings

Business, Industry and Services 53
to low summer flows (Rance et al., 2012). A shift in seasonal and/or total availability of water resources, as a result of climate change, has the potential to have significant impacts on industry in the UK.
Industrial abstraction should be viewed in the context of other abstraction sectors, as changes in water resource availability will have an effect on the way in which all abstraction is regulated. The responses and adaptive approaches of other sectors, (especially that of public water supply, as the dominant sector), will determine the extent of any effect on industrial abstraction. This work is derived from analysis undertaken in the Water sector Tier 2 analysis, focused on England and Wales, and supported by the information described below.
Metric response function
Total industrial abstraction per River Basin District (RBD) in England and Wales were taken from the abstraction datasets of the Environment Agency’s Water Resources GIS (WRGIS)22. These datasets originate from the Environment Agency’s National Abstraction License Database (NALD) and have been processed by Environment Agency staff through the Catchment Abstraction Management Strategies (CAMS). Industrial and total abstraction data for each RBD were obtained by summing the individual abstractions within the boundary of the RBD.
The industrial abstraction dataset (Table A2.7 and Figure A2.2) contains information on:
Abstraction sources licensed to industry, including the proportion from rivers, lakes or the ground, but not from estuaries or where industrial processes use treated mains supply from the public water supply network.
Distribution of licensed abstraction across RBDs.
The locations of industrial abstractions and their relative size distribution across England and Wales.
Total abstractions and total consumptive abstraction, which is defined as the total water used and not returned to the environment through discharge. For this reason total consumptive abstraction will always be lower than total abstraction.
As noted previously, it is important to understand industrial abstraction in the context of total abstraction. Figure 4.1 shows total abstraction in each RDB, compared to the total industrial abstraction. A number of key points are worth highlighting from the industrial abstraction dataset (Figure 4.1 and Table A2.7):
Industrial abstraction is a small proportion of the total amount of water abstracted in most RBDs (with the exception of the North West); the majority is used by public water supply providers.
The majority of industrial abstraction is in the north west of England, centred on the large urban conurbations of Manchester and Liverpool. Abstraction in the area is mostly from surface water, with some groundwater. It should be noted, however, that a significant proportion ~70% is returned to the environment after use.
The second most significant area for industrial abstraction is located in the south east of England, where industrial abstraction forms a significant proportion of total abstractions in this region.
22 September 2010 version
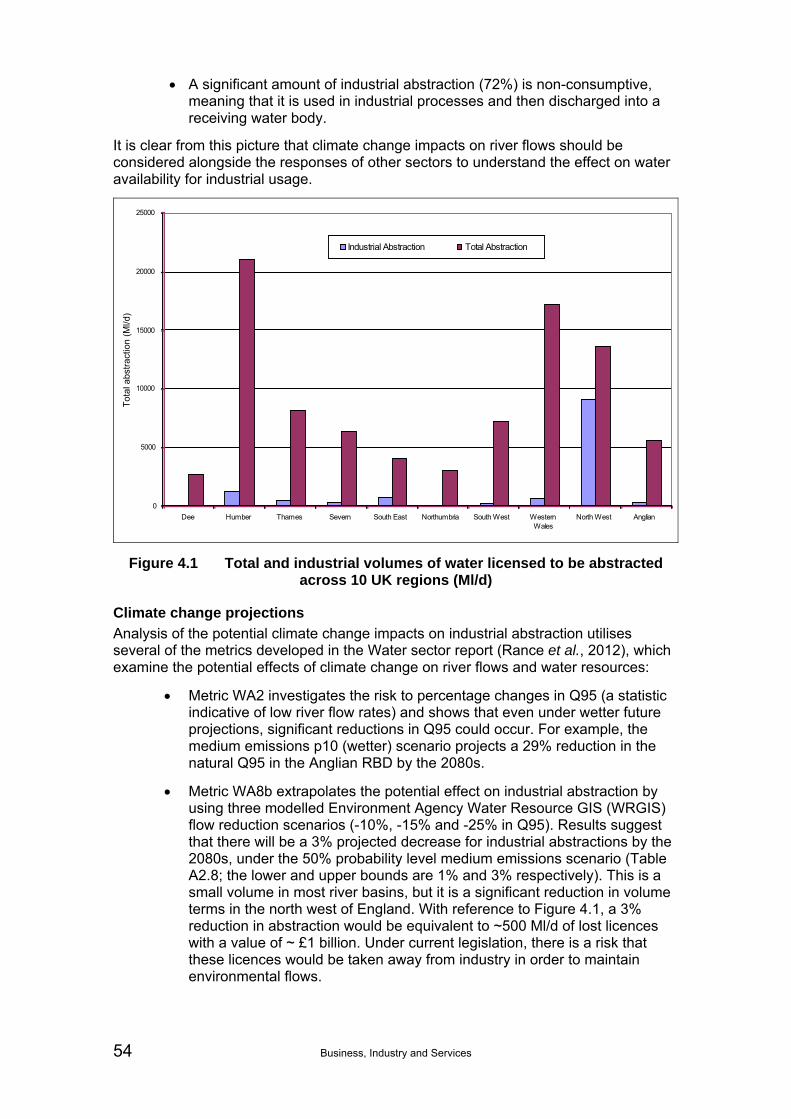
54 Business, Industry and Services
A significant amount of industrial abstraction (72%) is non-consumptive, meaning that it is used in industrial processes and then discharged into a receiving water body.
It is clear from this picture that climate change impacts on river flows should be considered alongside the responses of other sectors to understand the effect on water availability for industrial usage.
0
5000
10000
15000
20000
25000
Dee Humber Thames Severn South East Northumbria South West WesternWales
North West Anglian
Tot
al a
bstr
actio
n (M
l/d)
Industrial Abstraction Total Abstraction
Figure 4.1 Total and industrial volumes of water licensed to be abstracted across 10 UK regions (Ml/d)
Climate change projections
Analysis of the potential climate change impacts on industrial abstraction utilises several of the metrics developed in the Water sector report (Rance et al., 2012), which examine the potential effects of climate change on river flows and water resources:
Metric WA2 investigates the risk to percentage changes in Q95 (a statistic indicative of low river flow rates) and shows that even under wetter future projections, significant reductions in Q95 could occur. For example, the medium emissions p10 (wetter) scenario projects a 29% reduction in the natural Q95 in the Anglian RBD by the 2080s.
Metric WA8b extrapolates the potential effect on industrial abstraction by using three modelled Environment Agency Water Resource GIS (WRGIS) flow reduction scenarios (-10%, -15% and -25% in Q95). Results suggest that there will be a 3% projected decrease for industrial abstractions by the 2080s, under the 50% probability level medium emissions scenario (Table A2.8; the lower and upper bounds are 1% and 3% respectively). This is a small volume in most river basins, but it is a significant reduction in volume terms in the north west of England. With reference to Figure 4.1, a 3% reduction in abstraction would be equivalent to ~500 Ml/d of lost licences with a value of ~ £1 billion. Under current legislation, there is a risk that these licences would be taken away from industry in order to maintain environmental flows.

Business, Industry and Services 55
Building on this analysis, a further assessment was made to find the total amount of industrial abstraction that fell within water bodies where there was a flow surplus against Water Framework Directive flow thresholds. These water bodies would be classified as locations where further resources were available for abstraction.
From this research, it is apparent that the proportion of industrial abstraction in water bodies with resource available for further abstraction decreases with a reduction in natural flow (Table A2.9). This relationship, however, is not linear and will vary depending on the flow conditions and regulatory constraints in individual river reaches. Abstraction will be more constrained in the English south east, south west, Anglian and Severn RBDs (where 13% of total industrial abstraction occurs), although the degree of constraint and the time period over which it happens varies between scenarios. For the north west of England, however, there is likely to be less of a constraint on abstraction. Nevertheless, it should be noted that the large amount of industrial abstraction in this area could mean that a small shift in long-term availability, which consistently affects time of peak demand, could translate into a significant risk for industrial processes.
Exposure of water sensitive industries
The analysis above provides an overall indication of the exposure of businesses in general to potential shortages in water supply. However, to manage this exposure in any meaningful way requires a more detailed disaggregation of the risk in terms of the different types of business being impacted. One way of doing this is to make use of the Standard Industry Classification (SIC) 2007 classification23.
To examine the sensitivity to water abstraction, those businesses with a requirement for either their own abstraction licences, or the supply of large quantities of water, were identified subjectively at the group level of the SIC. These business locations are then mapped against the information on water abstraction generated for metric WA8b in the Water sector report (Rance et al., 2012), as described above. The results were aggregated at the section level, comprising sections A to F24 of the SIC. The need for water is assumed to be a necessary contributor to overall turnover and the change in water abstractions scaled in proportion to the individual turnover of businesses affected, assuming access is restricted for 1 year in 10 (see Table A2.10). This by no means represents the real cost to business of having reduced access to water but provides a surrogate measure. A more detailed investigation of water dependency for individual groups of industries would be needed to develop more realistic estimates.
For each SIC section, the results were summed on a 10 km grid to provide a high-level indication of the spatial distribution (e.g. Figure A2.3) and to the UKCP09 regions for spatial climate change maps (e.g. Figure A2.4). The results for Sections A to F are summarised in Table A2.11, considering the case with no adaptation and then scaled based on efficiency savings of 20% to provide an indication of the order of the costs with some adaptation.
Results of the SIC data analysis indicate that the present day (2010) turnover of the businesses requiring water abstraction (summed over sections A-F) amount to some £294 billion. By far the largest section is manufacturing (C), with an annual turnover of £192 billion. The next two largest sections are mining (B) and electricity & gas (D) with turnovers of £23 and £65 billion, respectively. Comparing 2010 data to 2009 data, however, it becomes apparent that significant inter-annual variations in turnover occurred (~20%), presumably reflecting changing market conditions.
23 http://www.statistics.gov.uk/StatBase/Product.asp?vlnk=14012&Pos=&ColRank=1&Rank=224 24 A = Agriculture, forestry and fishing; B = Mining and quarrying; C = Manufacturing; D = Electricity, gas, steam and air conditioning supply; E = Water supply, sewerage, waste management and remediation activities; F = Construction.

56 Business, Industry and Services
Under the various climate change projections, most sections experience a loss of abstraction equivalent to 0.2% of turnover by the 2020s increasing to 0.4% by the 2050s and between 0.5 and 0.6% by the 2080s (Table A2.11). Agriculture, which has a relatively small turnover of £40 million, is an exception but may experience a loss of abstraction equivalent to 0.5% of turnover by the 2020s increasing to 0.9-1.0% by the 2050s. Allowing for some adaptation these figures are typically reduced by 0.1%, although for agriculture the reduction is over 0.2%. Construction would also appear to be more sensitive based on the 2010 data but this is presumably highly dependent on the location of major construction schemes.
Key assumptions and limitations
There are a number of limitations with the methodology outlined above:
Total industrial abstraction per RBD is only provided for England and Wales.
For assessment WA8b, the method of extrapolation of the original modelling to larger flow reductions has the potential to produce significant inaccuracies and the exact figures produced by this assessment should be treated with some caution.
Whilst the SIC data provides a UK-wide coverage, the water abstraction data are limited to England and parts of Wales. Coverage is therefore limited to that of the abstraction data.
The estimates of loss of abstraction equivalent turnover do not represent the real cost to business resulting from reduced access to water. However, it does provide a surrogate measure and allows the relative change to be evaluated in relation to individual industries. A more detailed investigation of water dependency for individual groups of industries would be needed to develop more realistic estimates.
Conclusion
The tentative conclusion that can be drawn from this analysis is that climate change could affect the industrial sector’s access to water. For the majority of the country, however, (with the exception of the north west of England), this must be put in the context of industrial demand being a small part of the total, with public water supply abstraction being the main use of water. It is also shown that the projected changes to industrial abstractions coming from sustainable sources is relatively small (-3%) in comparison to agriculture (-11%) and the consequences in terms of compliance with low flow limits will be greatest for the north west of England.
It is possible that the extent of adaptive measures practised by other sectors (e.g. public water supply) or changes in regulatory controls could have more of a day-to-day impact on industrial abstractors than any absolute changes in water availability. Thus, though constraints on supply as a result of climate change do have the potential to affect industrial use, the wider constraints on water supply will possibly have a larger, albeit more indirect, effect.

Business, Industry and Services 57
4.2.6 An increase in monetary losses as a result of interruption to business from flooding (BU4)
Summary Class
2020s 2050s 2080s Metric code
Risk description
Co
nfi
den
ce
l c u l c u l c u
BU4 An increase in monetary losses as a result of interruption to business from flooding
M 1 1 2 1 2 2 2 2 2
Introduction
In April 2004, Foresight published its Future Flooding report (Foresight, 2004). Subsequently updated following the large-scale flooding in 2007 (see Box 4.6), the report highlighted that climate change is an important factor in increasing flood risk, particularly through the impacts of rising sea levels and more stormy weather. Estimates for annual UK damage from flooding could rise from the present level of approximately £1 billion to about £28 billion by the 2080s, assuming there is no additional investment to manage the flood risk other than what is presently available. Note: these estimates are an underestimate of the total cost of flooding, as they do not include consequential losses (e.g. due to transport disruption).
The financial implications of flooding for the Business, Industry and Services sector include issues such as:
Direct damage to buildings, materials and other assets
Workforce health and safety infringements
Environmental non-compliance
Box 4.6 Impact of 2007 floods on businesses
Many business properties were flooded during the summer 2007 floods, resulting in damage to premises, equipment and fittings, and loss of stock. They also suffered disruption of business. The method of cost estimation is similar to that used for domestic properties, namely identifying the number of properties affected and the average cost of damage. There are similar challenges interpreting available data.
Estimates of the number of commercial properties flooded ranged between 7,100 and 7,300 according to Defra (2007) and Pitt (2008) respectively. The ABI subsequently estimated that 8,000 business premises had been affected. According to the ABI, there were in June 2009 35,000 insurance claims by businesses associated with the summer 2007 floods; far exceeding the number of commercial properties that were reportedly flooded. This is presumably because businesses submitted claims against more than one insurance policy, and possibly because multiple claims were made on individual policies.
In addition to damage costs, some businesses claimed compensation from insurance for disruption to businesses where this involved extra costs and lost income. For example, it is known that disruption was acute in many locations, such as in Sheffield, where disruption to business was reported at £50 million.
Furthermore, a survey by the Chartered Management Institute found that the effects of flooding were felt well beyond the workplace and impacted on staff availability, suppliers, customer demand as well as direct impacts such as loss of power and flooded premises.
Overall, the total economic costs associated with business impacts caused by the 2007 floods were estimated as £740 million.
(Source: Environment Agency, 2010)

58 Business, Industry and Services
Changes to market demand
Business interruption.
The remainder of this section focuses upon the financial implications for business arising from interruption and the spatial distribution of lost turnover / staff days lost due to flooding, with a focus on England and Wales. This focus is a function of the data available, which was supplied by the Environment Agency.
Metric response function
Determining interruption
Business interruption is determined in this response function through three steps. These are explained below.
Step 1:
The Expected Annual Damages (EAD) associated with Non-Residential Properties (NRP) has been calculated in the Floods and Coastal Erosion sector report (Ramsbottom et al., 2012) for England and Wales, fluvial and/or tidal flooding only (metric FL7b). This provides an indication of how damage costs relating to NRPs might change under future climate projections. These data have been used in the estimation of the increased costs of business interruption due to climate change. In this case, a change in the EAD can be used to scale a similar rise in the losses due to interruption. The current EAD for NRP are estimated to be about £560 million. This includes all types of NRP and therefore is greater than the equivalent value for properties associated with business.
Step 2:
The cost of business interruption following flooding between 2002 and 2009 are shown in Figure 4.2, using gross incurred claims data from the ABI for the UK. Unfortunately the data provided by the ABI was not disaggregated into different weather events; for example, losses incurred from windstorms were not collected separately from flooding. To circumvent this issue, the proportion of flood claims (out of all weather related claims) for domestic property was used as a proxy to estimate this number. This proportional cost has therefore been taken to represent the financial impact of business interruption caused by flooding.

Business, Industry and Services 59
Figure 4.2 Cost of business interruption in the UK (£m) due to flooding Based on insurance claims as a proportion of total losses due to weather events.
The total business interruption costs for the eight-year period is approximately £150 million. This includes 2007, which was a record-breaking year in terms of insurance claims, as the floods in this year were the most severe weather-related event that the UK has experienced in decades (Environment Agency, 2010). Therefore, the average claims for UK business interruption for any one year associated with flooding are estimated to be approximately £20m. This is the baseline business interruption cost due to flooding at present.
Step 3:
Another important component of interruption is the loss of staff time. Standard Industry Classification (SIC) information is used to identify the businesses and number of staff that are located within a zone of ‘significant likelihood of flooding’25 in England and Wales. An average length of flood disruption was gleaned from previous experiences; the 2007 floods (>1 in 200 year event) created an average length of disruption of 8.75 days (Chartered Management Institute, 2008), which was considered too high, therefore a value of 3 days was used to reflect the lower annual probability of a flooding event (1:75).
To estimate the average annual lost staff time, a value of 3 days was multiplied by the annual probability of a flood event (1.3%) and the number of staff employed within the 1:75 year flood zone. Using this approach, it is estimated that the annual average days lost is 105,000, which is around 0.05% of the staff days of businesses in the flood zone. With an average staff cost of £150 (ONS web site), this generates a value of interruption of about £5.8 million. This is a simplistic approach, but it suffices to give an order of magnitude to the potential consequence for business.
Staff time lost data were also used to scale the turnover of businesses in the flood plain (assuming 250 working days per year). This assumes that turnover is proportional to staff time, which, whilst true for some businesses, is not universally the case. For the
25 Defined as the 1.3% (1:75) annual probability of flooding. This probability was chosen because it was used in the Environment Agency, Long Term Investment Strategy (LTIS) (2009) analysis, which forms the basis of the CCRA analysis of flood risk (Ramsbottom et al., 2012).

60 Business, Industry and Services
present-day (2010), SIC data estimates turnover of businesses (summed over Sections A-R, see Figure A2.6) amount to £151 billion and employ over 1 million staff.
Climate change projections
Drawing together the information from the three steps above, a value for the expected increase in business interruption costs to can be estimated for future climate change (2020s, 2050s and 2080s). These costs do not include consequential losses.
The projected increase in EAD for NRP in England and Wales are shown in Table A2.12, which has been taken from the Floods and Coastal Erosion sector report (Ramsbottom et al., 2012). Assuming that business interruption costs increase at the same rate as EAD, and taking the baseline present-day business interruption cost of £20 million per year, this equates to an estimated increase in average annual cost to UK businesses of disruption due to flooding of: £24-50 million by the 2020s, £26-72 million by the 2050s and £34-96 million by the 2080s (across all climate scenarios considered by CCRA).
In terms of staff time lost, estimates for 2020s, 2050s and 2080s suggest that this may increase by 0-50%, 0-71% and 10-81% respectively. This equates to annual costs of £5.8–8.7 million by the 2020s, £5.8-9.9 million by the 2050s and £6.4–10.5 million by the 2080s for businesses located within the zone of significant flood risk.
Regional exposure of business in England and Wales
Similar to BU3 (see Section 4.2.5), SIC data is used to gain an appreciation of the spatial patterns of flood risk for the Business, Industry and Services sector. In the case, wholesale and retail trade SIC data was used as an example of the potential effects.
When mapped for England and Wales, this data shows turnover losses increasing particularly in the Midlands and eastern counties, although not as significantly as one might expect (see Figure A2.6). Changes in future staff days lost is more significant however, with particularly pronounced changes in the south and east of the country, although under the high emissions scenario, p90 situation in 2080, all regions of England and Wales become more affected (see Figure A2.5).
For some businesses in flood prone areas with defences that are already close to being vulnerable to the “significant” risk level (1.3%) used in the analysis, the onset of the increase in risk is in the short to medium term. This may however, be influenced by improvements to defences and further development of the strategic programmes of flood risk management.
Key assumptions and limitations
There are a number of key assumptions and limitations with this methodology:
It is assumed that business continuity losses are proportional to changes in Expected Annual Damages (EAD) associated with Non-Residential Properties (NRP).
Proportion of flood losses out of all weather related claims are the same for business and domestic customers.
The 8-year average business continuity figure could be overestimated, given the small sample size, which includes the 2007 event.
The 8-year average business continuity figure does not include uninsured / unclaimed losses. It is likely therefore that the true baseline cost of business disruption caused by flooding is greater than the £20 million per year used in the above estimate.

Business, Industry and Services 61
The loss figures are likely to underestimate business continuity risk as they do not include uninsured losses and disruption to business activity, supply chains, etc.
There is a mismatch in terms of UK-wide EAD for NRP data and the other data used in this section, which only relates to England and Wales. This is explained in the text above.
Figures are purely indicative and should be treated with caution.
Conclusions
The financial impact of business and industry assets at risk of flooding includes direct damage to assets and business interruption during and following a flood. An estimate has been made of business interruption costs caused by flooding, which indicate that these could increase by 20-150% by the 2020s rising to a 70-380% increase in the 2080s. Considering just the lost staff time component of business interruption also suggests an increase but to a lesser extent, with the increase to the 2080s being approximately 10-80%.
Direct damages to properties have been estimated in the Floods and Coastal Erosion sector report (Ramsbottom et al., 2012).
4.2.7 A decrease in productivity and revenues due to ICT loss/ disruption (BU5)
Summary Class
2020s 2050s 2080s Metric code
Risk description
Co
nfi
den
ce
l c u l c u l c u
BU5 A decrease in productivity and revenues due to ICT loss/ disruption
L Too Uncertain
Introduction
A recent report (AEA, 2010) produced for Defra found that “UK plc.” is heavily reliant on the effective functioning of the Information and Communication Technologies (ICT) sub-sector for a number of reasons:
98% of business is reliant on technology to power their day-to-day operations
84% of UK businesses are estimated to be heavily dependent on their IT systems
90% of high street purchases are transacted using plastic cards which depends on wired and wireless communications to work
£50 billion of consumer purchases and sales in Britain take place wholly online
In the high street, stock ordering, inventory control and the cash tills are all completely dependent on electronic communications
4.2 million people in the UK are estimated to work flexibly – the vast majority of these use broadband and other technology to work remotely.

62 Business, Industry and Services
The report suggests there is substantial scope for growth in these numbers. Weather has already disrupted the provision of services and the increasing dependence on ICT means that the consequences of these weather events could become more significant (AEA, 2010).
Climate change risks for ICT
The AEA report states that the majority of devices (e.g. laptop computers, mobile phones, etc.) typically used in the UK already have operating tolerances to temperature and humidity that will accommodate UKCP09 projected temperature changes – both peak and average – provided they are appropriately installed and maintained.
It is, according to the report, the ICT enabling infrastructure that is vulnerable to the environmental conditions surrounding it. For example, those elements of the infrastructure which are below ground are vulnerable to flooding (see Box 4.7), rising groundwater levels, water ingress (particularly during times of snow melt or flooding), subsidence caused by drought or flooding, and consequential risks arising from damage to other elements of the infrastructure (AEA, 2010). For example, following a fire in underground cable tunnels in Manchester in March 2004, more than 130,000 homes and businesses across the north west of England were without BT voice and data services. Although this event is not necessarily weather related, it gives an indication of the impact of a severe event to the ICT enabling infrastructure. Furthermore, most international communications (95%) are routed via submarine fibre-optic cables, which are both cheaper and quicker than satellite (Carter et al., 2009). It is estimated that worldwide there is ~1 million km of submarine cable, which may be increasingly vulnerable to underwater turbulence as a result of extreme weather events (Carter et al., 2009).
Above ground, infrastructure (e.g. masts, antennae, switch boxes, aerials, overhead wires and cables) is at risk from precipitation (e.g. water ingress, snow melt), wind, snow (e.g. weight), unstable ground conditions (e.g. flooding, subsidence) and changes in humidity. High humidity can lead to condensation and the risk of water ingress and short-circuiting of equipment. There is also risk to the serviceable lifespan of the artefacts brought about by increased environmental stress (e.g. high winds, greater temperatures) (AEA, 2010).
ICT is dependent on electricity supplies, and therefore any failure of supplies arising from climate change will directly impact on ICT systems. The Energy sector report (McColl et al., 2012) has considered the main risks arising from climate change on electricity generation and distribution. Specific risks identified include the impact of flooding on electricity distribution, for example flooding of sub-stations. Incidents such as the collapse of bridges during floods can also disrupt connections (as bridges are often used as a river crossing for cables and other services).
Perhaps the greatest risks are the currently unknown potential future impacts of climate change. For example, fires arising from excessive heat or flood damage to critical components could lead to major failures. A major flood event covering a large geographical area could affect many elements of the system leading to widespread failures.
These types of major disruptions to ICT would affect all businesses and may take considerable time to restore services. Whilst the probability of such events occurring is currently considered to be very low, the consequences could be very high. In the future, the consequences will be further exacerbated because of the increasing reliance of all sectors and business on ICT, and also because the frequency and severity of the kinds of weather events that currently disrupt ICT are likely to increase.

Business, Industry and Services 63
Box 4.7 Case Study: Flooding at BT Exchange in Paddington, London
It is possible for localised incidents to have a considerable impact, as was experienced when a major flood occurred at a BT exchange in Paddington, London. The flood subsequently led to an electrical fire and affected broadband and telephone services across the UK for several hours in March 2010 (AEA, 2010).
According to Gradwell, a business ISP, 437 local exchanges and up to 37,500 Datastream circuits were affected with nationwide repercussions on communications. Vodafone also reported that its network was hit by the incident.
(Source: The Register, 2010)
Vulnerability and exposed groups
The AEA (2010) report suggests that very few impacts are expected to affect the entire national network. The localised effects of weather-related disruption, however, are generally expected to increase and could increasingly affect individual businesses and home workers in vulnerable locations.
The potential for equity issues amongst SMEs related to the impacts of climate change in the ICT sector has been recognised (AEA, 2010). Rural single-sited SMEs are potentially more vulnerable to localised weather-related disruption to their ICT than larger multinational companies. Large businesses are often based in large urban centres and have flexibility in managing their ICT systems, for example, transferring their ICT requirements between sites around the world to avoid weather risks.
Remote workers may also be at particular risk, which is of concern as the UK is already experiencing a shift to home-working and remote working (relying on both broadband and mobile telephony systems). Indeed, a 2009 market-wide exercise (Financial Services Authority, 2010) to assess and improve the UK financial sector’s ability to deal with major operational disruption found that, due to high levels of resilience and backup on-site, disruption to a particular telecommunications provider was more of a problem in the context of remote-working than in-office operations.
Several participants in the FSA (2010) study noted that if a key domestic provider (such as BT) were inoperable for a sustained period, it would render their remote-working solution ineffective. Many firms noted that while they had high levels of resilience built into access points to Internet service providers at the company end, they would not know how to increase resilience at the home-user end. The Electronic Communications Resilience and Response Group found that there are also particular risks as telephone companies move towards the adoption of Next Generation Network IP technologies (EC-RRG). The diversity of the present network may be reduced and switching will be concentrated in fewer nodes than at present (Cabinet Office, 2010). This again may have an impact on the home-worker.
The business sector is also exposed to the international interdependence of the ICT sector, which includes the provision of materials and devices, as well as the hosting, storage and transmission of the data itself. The expansion of international digital off-shoring and international data centres may mean that the UK experiences additional vulnerability in the face of climate change. For instance, rising sea levels and extreme weather events will also affect the operation of data centres and service centres in low lying areas, such as the Netherlands and vulnerable areas of the sub-continent of India (AEA, 2010). Changing patterns of activity and predicted trends towards ‘cloud computing’, will lead to the requirement for additional data storage sites (Bein et al., 2010), which represents a significant cost of construction and maintenance for business.

64 Business, Industry and Services
Key assumptions and limitations
Although historical case studies provide information of weather-related disruptions to IT, these tend to be isolated and robust data is currently not available to provide meaningful estimates of potential climate change impacts.
Conclusions
It has not been possible to provide an estimate of the number of days that might be lost due to disruption to ICT owing to a lack of suitable information. The risk of major ICT disruption due to climate change is considered to be relatively low for large businesses. The risks for smaller companies (including SMEs) and remote workers are, however, greater, particularly if they are located in relatively remote areas where they may be dependent on single electricity and telecommunications connections.
Perhaps the greatest risks are the currently unknown potential future impacts of climate change, for example major widespread weather events. Whilst the probability of such events occurring is currently considered to be very low, the consequences could be very high.
4.2.8 Increased exposure for mortgage lenders (BU6)
Summary Class
2020s 2050s 2080s Metric code
Risk description
Co
nfi
den
ce
l c u l c u l c u
BU6 Increased exposure for mortgage lenders
L 2 2 2 2 2 2 2 2 3
Introduction
Climate change is expected to cause an increase in flood probability to properties, including flooding from tidal, fluvial and surface water sources (Pitt, 2008). As the probability of flooding increases, insurance for properties that flood may be increasingly costly or difficult to obtain in certain circumstances. There are already cases in the UK where property insurance is either not obtainable or very expensive.
It is a standard condition of all mortgages for a property that they are covered by standard buildings insurance, including flood cover, for the full term mortgage, in order to protect the borrower and the lender. Most properties in the UK are insurable on normal terms, under an agreement reached between the Association of British Insurers (ABI) and Government in 2002 (and updated in 2005 and 2008), known as the Statement of Principles. In order for this situation to continue, Government has committed to capital investment in flood management and to the control of development in flood risk areas through the planning system. Mortgage lenders have a keen interest in insurance remaining widely available, thereby ensuring that mortgages can be offered in flood risk areas.
Insurers have committed to continue to make flood insurance for domestic properties and small businesses built before 1 January 2009 available as a feature of standard household and small business policies until 2013, if flooding is not a significant likelihood26, or if flooding is a significant likelihood but defences are planned that will reduce likelihood below that threshold.
If insurance cover is no longer widely available it could leave borrower and lender exposed. As such, the desire to retain flooding cover, as a standard aspect of buildings
26 ‘Significant likelihood’ is defined as a 1.3% or 1 in 75 annual probability of flooding or greater.

Business, Industry and Services 65
insurance, is important for the continued operation of the mortgage, and the wider housing, market in its current form.
Initial assumptions:
House buyers may not be able to obtain new mortgages, re-mortgage, nor afford high insurance costs on properties where an unacceptable risk of flooding is considered by insurers, thus affecting both market growth and the reputation of lenders (and insurers).
Should a flood event occur, customer’s homes with no insurance cover (due to unaffordable flood insurance or no cover available) may default on mortgage repayments as a result of the cost of damage repairs. This increases lender’s exposure.
Housing areas where insurance cover is expensive, or difficult to obtain may be affected by property blight – a reduction in the stock asset value both within affected areas, but also potentially inferred in immediately adjacent areas due to a perceived issue. This could potentially leave mortgage lenders with assets that are insufficient to cover loans values (negative equity).
The remainder of this section is concerned with estimating the overall gross mortgage fund value at potential risk in England and Wales as a result of the changes in the availability of flood cover (as part of building insurance). These figures are then placed in the context of research on flooding and property value undertaken by RICS (2009) and expert elicitation, and subsequently adjusted. The key findings of the RICS research are shown in the following extracted list (RICS, 2009):
The evidence indicates that flooding has only a temporary impact on property values, and after three years prices had returned to their normal level.
Flood events in low risk areas had no impact on property prices.
Being designated at high risk of flooding has had no effect on property values in areas with no flood events.
Insurance remains available to householders, with flood risk not being the major factor in determining levels of premium.
At point of purchase, there was not a high level of awareness among homeowners as to the flood risk to their property, and this is particularly true among longer-term homeowners.
The fact that flooding does not have a major impact does suggest that current insurance and risk disclosure regimes may not be encouraging behaviours that reduces the danger of damage from flooding.
Metric response function
For the purposes of this analysis, the number of properties in England and Wales at significant likelihood of flooding (river or tidal) is used as an indicator of the impact of flooding on the availability of insurance, and consequently on the gross level of mortgage lending exposed (metrics FL6a and FL7a in the Floods and Coastal Erosion sector). Here, the baseline (current) sea level and river flow peak data are used to derive the existing level of ‘significant likelihood of flooding’ (1 in 75 year annual probability or greater) to properties in different regions (by numbers of properties).

66 Business, Industry and Services
The mortgage fund value (£) of properties at significant likelihood of flooding is calculated for each English region and Wales using a number of important components. These are as follows:
1. The overall ratio (%) of mortgage to property price is calculated using the average UK house price (Land Registry, 2011; Halifax, 2011) and the average UK mortgage value (pers. comm. Council of Mortgage Lenders, 2011). As such an average mortgage in the UK is estimated to be 68% of the average house price.
2. The number of properties in 1 in 75 year fluvial and tidal flood prone areas of England and Wales is calculated (see Appendix 8 in the Flood Sector report).
3. The number of properties in England that have mortgages (pers. comm. FSA, 2011). This is estimated at 48% for England, and is assumed to be similar for Wales. As such the gross mortgage fund value can therefore be reduced from 68% of the overall gross total property value in the UK by 48%, to reflect that not all properties in England and Wales have mortgages. This equates to 33% of the total property value in England and Wales that is mortgaged.
4. Climate change projections can then be used to scale the change in number of properties, and therefore the mortgage fund potentially at risk from tidal and fluvial flooding in England and Wales, assuming there is no additional investment to manage the flood risk other than what is presently available.
Climate change projections
An assessment of this risk metric has been made based on:
the number of properties in England and Wales at significant likelihood of flooding
how this may influence insurance affordability and availability.
The estimated maximum number of properties at ‘significant likelihood’ of river and tidal flooding under the climate change scenarios has been estimated as part of the Floods and Coastal Erosion sector analysis (Ramsbottom et al., 2012) and cover England and Wales only. The mortgage fund value of these properties has been estimated using the four steps described above and the results are provided in Tables A2.16 and A2.17.
This assessment indicates that in some regions of England and Wales there is already a high fund value for mortgages associated with properties at ‘significant likelihood’ of river and tidal flooding. It is estimated that there are about 370,000 residential properties in England and Wales at ‘significant likelihood’ of river and tidal flooding out of a total of 24.3 million residential properties. This is projected to rise to between 530,000 and 1.5 million by the 2050s and between 700,000 and 2.1 million by the 2080s, based on the assumption that flood defences remain at today’s coverage and standards. The overall mortgage fund value of properties that is estimated to be at significant likelihood of flooding is of the order of £46 billion by the 2050s and £52 billion by the 2080s (at today’s prices). The mortgage fund value at risk due to insurance becoming unaffordable or unavailable is a small proportion of this total for the following reasons:
The gross value at risk suggests that if insurance cover is unavailable, or unacceptably high, the full (100%) value of the mortgage fund could be lost due to blight with both owner and lender equity lost. This is likely to be an

Business, Industry and Services 67
overestimation. The reduction in mortgage fund value is linked to the property value. RICS (2009) found that only three years after a flood, in many cases, properties returned to pre-flood values. Temporary devaluation ranged from zero to 30% of market value.
Supply and demand of property (market effects) will have a greater influence than climate change under the existing Statement of Principles and therefore attributing gross value at risk solely to climate change in isolation is inaccurate. However, the future scope of this is uncertain.
This RICS study suggested that many residents on flood plains had experienced difficulties renewing insurance policies but in general insurance was available at a reasonable price for residents. Homeowners that experienced difficulties usually obtained better terms by switching insurance company.
The gross value at risk estimates quoted assumes no management by insurance and mortgage lenders other than what is currently applied. This is highly unlikely and therefore the gross value at risk overestimates the issue.
Currently, only in extreme cases are mortgages declined on the basis of flood risk. This is supported by the RICS study that suggested that insurance was currently available in most instances and that flood risk was not a major factor in determining premiums.
Only a small proportion of homes with a 1 in 75 or greater annual probability of flooding will suffer flood damages in any given year on average.
The housing market may respond to flood risk through reduced house prices for properties in exposed areas. This in turn may reduce the value of mortgages at risk and the exposure of lenders.
The risk to capital value of homes does not necessarily translate to a loss to the lender; the lender incurs loss if the owner fails to repay their mortgage.
It is therefore reasonable to adjust down the value of mortgage fund value at risk. Assuming 5% to 15%27 of the value is at risk this reduces the risk to £1 to 8 billion in the 2050s and £2 to 9 billion in the 2080s (at today’s prices).
These figures provide an indication of the estimated fund value at risk where mortgage provision may be affected by changes in insurance cover in the future if there is no adaptive action.
In reality, the uncertainty around the true value at risk is extremely high. This work does, however, highlight the interconnected nature of Government flood policy, insurance and mortgage provision. The results indicate that there is a major opportunity to potentially develop new products for homeowners that will allow for insurance and mortgage provision in areas of ‘significant likelihood’ of river and tidal flooding.
Assumptions and limitations
More data is needed to accurately discern the distribution and value of at risk mortgage assets now and in the future across the UK. Data used only covers England and Wales.
27 Note that this assumption is not supported by data but is a judgement estimation based on the bullet points above. The judgement estimation in this case, is based on discussion with a number of Government Departments and important non-governmental stakeholders.

68 Business, Industry and Services
The management of flood risk is clearly not a new issue for primarily financial institutions and insurance companies. As such this forecast serves to underline the process of adaptation already occurring, however, the magnitude of the numbers involved, should provide added impetus to making such changes take place.
The number of properties in England and Wales that are considered by Defra and the Environment Agency to be at significant likelihood of river and tidal flooding28 may increase because of surface water flooding. The 2007 summer floods in some cases were caused, or significantly exacerbated, by inefficient urban drainage in the face of torrential rainfall. This will not necessarily be remedied by increased spending on flood defences, and also needs to be considered in terms of the insurability and mortgage-ability of properties. Indeed, it is projected that such intense storms could become increasingly frequent as the impacts of climate change become more prevalent, bringing into question the risk level for thousands of homes that were previously thought to be safe from repeated flooding. Managing the location of new housing development is a major challenge that needs to both meet regional demand and recognise that flood risk is changing.
More generally, there is a great deal of uncertainty in relation to future Government policy, its agreements with insurers on covering flood risk, and the likely levels of Government investment on flood management. The figures presented in this analysis underline the importance of this risk to the UK economy.
Conclusion
The increase in flood risk expected as a result of climate change could affect the availability and affordability of insurance and therefore the availability of mortgages, and the potential blight on asset value for properties at high risk of flooding. This assertion is subject to high uncertainty.
An assessment has been made of the impacts of increased flooding based on:
the number of properties in England and Wales at significant likelihood of flooding
how this may influence insurance affordability and availability.
The mortgage fund value at risk due to insurance becoming unaffordable or unavailable may be of the order of £1 to 8 billion by the 2050s and £2 to 9 billion by the 2080s, assuming the value at risk is 5% to 15% of the total value at significant likelihood of flooding, and that this does not spur cost-effective adaptation activity.
4.2.9 An increase in insurance industry exposure due to flooding (BU7)
Summary Class
2020s 2050s 2080s Metric code
Risk description
Co
nfi
den
ce
l c u l c u l c u
BU7 An increase in insurance industry exposure due to flooding
M 3 3 3 3 3 3 3 3 3
28 Greater than a flood event every 1 in 75 years.

Business, Industry and Services 69
Introduction
As a whole, the insurance industry has seen an increase in weather-related claims over recent decades (Figure 4.3), largely due to an increasing number of extreme events. Munich Re (2010) recently emphasised the likely link between the increasing number of weather extremes and climate change. This concern is not new within the insurance industry. In 2007, Pricewaterhouse Coopers published results from a survey of 100 insurance industry representatives from 21 countries that indicated climate change was the fourth most important issue for the industry (out of 33 identified), with natural disasters being the second.
Data available from the ABI provides insights into the recent cost of weather-related claims in the UK. The cost of weather-related damage claims between 2001 and 2009 is shown in Figure 4.3. Domestic data includes damage from flood and storm, while the commercial data is all claims in the weather-related category (although claims due to burst pipes have been excluded from both). As discussed in Section 4.2.6 (risk metric BU4), Figure 4.3 clearly illustrates the impact of the unusually widespread and severe floods of summer 2007. It has been estimated that ~£3 billion of the summer 2007 loss was covered by insurance, with insurers receiving ~165,000 claims. To put this into context, this is eight times the combined cost of the floods in Carlisle in 2005 and in Boscastle in 2004 (both localised events) and makes it the most costly insured weather event in the UK (ABI, 2007). In fact, the widespread flooding of 2007 led to an underwriting loss for the UK property insurance market of £1.5 billion (ABI, 2010).
Figure 4.3 Insurance payout for weather related claims in the UK (£m) (Source: ABI)
Note: From 2004, companies were asked to report a further split in their "escape of water" claims. This has led to a great reduction in weather related claims as misreported figures have now been eliminated.
The impact of climate change on both the level of premiums charged and level of capital required by insurance companies is expected to be considerable. For example, for a 4°C temperature rise, insured flood losses in the UK could lead to insurance rate increases of 21% and a further £1.9 billion could be added to the £5.9 billion capital requirement (ABI, 2009).
Metric response function
The baseline insurance claim data is taken to be the UK average from between 2001 and 2009 (for commercial and domestic property). The baseline number of properties deemed at significant risk of flooding (over 1 in 75 year flood plain) is also calculated.

70 Business, Industry and Services
The change in the number of properties at risk can then be determined according to the climate change scenario and the insurance claims can be scaled accordingly.
Excluding data from 2007 (given the extreme level of this event), an estimated average annual claim for flooding in the domestic sector is calculated to be approximately £135m and for commercial property approximately £70m between 2001 and 2009. If the 2007 event is included, these average figures (for the nine-years 2001 to 2009) are ~£180 million and £100 million respectively.
An analysis of the number of commercial and residential properties at significant likelihood of flooding (from tidal and fluvial sources) has been carried out, including projections of future change as a result of climate change and socio-economic change (metrics FL6a and FL7a, Ramsbottom et al., 2012). This provides a total number of properties at risk in England and Wales (although many of which may not hold adequate insurance cover). This is the baseline risk, which is scaled according to the climate change scenario (and also number of new properties being built).
Climate change projections
To provide a proxy for national flood risk, an average proportional increase in the number of properties at risk has been determined (based on regional change). The projected increases in residential properties at risk of tidal and fluvial flooding are shown in Table A2.18. A summary of the number of residential and commercial properties at significant risk of flooding by the 2020s, 2050s and 2080s is given in Table A2.19.
The results suggest that the combined domestic and commercial claims could double by the 2020s (p50), and furthermore, see an almost three-fold increase by the 2050s and an increase of between three and four times by the 2080s, assuming that flood defences remain at today’s coverage and standards. This equates to an estimate average annual total claim for flood related damage of the order of £700 million to £1bn a year by the 2080s (based on present day costs). This is about a third of the total weather-related insurance claims in the record year of 2007.
These results are compared with a recent ABI research paper (ABI, 2009) that sought to monetise projected climate change impacts. The approach developed in the study combined results from recent climate model outputs, diverse published data and scientific literature to monetise potential impacts. The research estimated that the impact values of climate change, assuming a global temperature rise of 4°C, are as follows:
Average annual insured losses from inland flooding in Great Britain could rise by 14% to £633 million.
The insured inland flood 100-year loss could rise by 30% to £5.4 billion and the 200-year loss could rise by 32% to £7.9 billion.
The methods used in the ABI (2009) study are not directly comparable to that employed in the CCRA, so it is not possible to make a direct comparison with the findings. In particular, the study did not look at the impact of rising sea levels on the risk of coastal flooding in the future. There are also differences in the way in which climate projections have been applied. Furthermore, baseline present day figures used in the ABI analysis were higher than those derived in the CCRA analysis. To refine both estimates, more robust studies are required. At this stage, it is acknowledged that the overall impact to the industry is unclear.
Key assumptions and limitations
There are a number of key assumptions and limitations with this methodology:
Business, Industry and Services 71
Given the short time-series sampled, it is difficult to robustly link the impacts of climate change to any recorded increase in insurance payout costs. It is stressed that these figures only provide an approximate estimate of average annual claims made and are uncertain.
Regional variations are neglected in this methodology, due to a lack of flood data for Scotland and Northern Ireland. Assumptions were made that the average exposure to flood risk across England and Wales is a reasonable approximation for Scotland and Northern Ireland.
This methodology assumes that provision of flood damage insurance cover will remain on the same basis as currently provided.
The estimation that payout costs increase in the future and have increased in the past cannot necessarily be viewed as a risk to insurance companies associated with climate change, if this is matched by higher and adjusted premiums. This would therefore only be problem if this was not anticipated and accommodated for by insurance companies.
If premiums are adjusted accordingly by the industry, a change in risk can be managed. However, the rise in premiums may eventually become unsustainable in some geographical areas.
Conclusions
It is estimated that annual insurance payout costs for flooding in the UK for both domestic and non-domestic property could increase from a present-day annual average of £200 - £300 million, to ~£1 billion by the 2080s (at present-day prices) as a result of climate change. What is important to understand, however, is that payout costs are not necessarily the central issue here. Instead there are a number of key issues:
High capital requirements. This requirement would be needed to make the necessary payouts to claimants, particularly during more frequent or extreme and widespread weather-related events.
The increasing unpredictability in our climate means that the risks of a particularly extreme and widespread event occurring, such as flooding, cannot be priced by the insurance industry accurately, and thus premiums may not be sufficient to cover subsequent pay-out costs. Conversely, an overly conservative pricing of policies by some insurers may affect competitiveness. In some circumstances, insurers know what they should charge but if they do charge these prices, people may struggle to obtain insurance.
Mismanagement many lead to a loss of brand value and market share.
The likelihood of the points above occurring is dependent on the action taken by the insurance industry; it is highly unlikely that they will do nothing. However, this part of the risk assessment process considers risk without management and/ or market changes, and therefore these statements should be considered in this context. The reinsurance market, which is only currently a small part of the domestic insurance market, will be another option for managing risk, but once again, consideration of the benefits of reinsurance are outside the scope of this risk assessment. The risk is thus fundamentally one of how well the industry understands weather-related risk, and how this may vary as climate changes, which is discussed further in Chapter 7 (Adaptive capacity).

72 Business, Industry and Services
4.2.10 An expansion of new or existing tourist destinations in the UK (BU8)
Summary Class
2020s 2050s 2080s Metric code
Risk description
Co
nfi
den
ce
l c u l c u l c u
BU8 An expansion of tourist destinations in the UK
L 1 2 3 2 2 3 2 3 3
Introduction
Future climate change is likely to cause major changes in the distribution of tourists around the world and different trends for tourism, both in the UK and overseas. Historically, one of the longest-established major movements of international tourists has been the annual migration of northern Europeans to the Mediterranean, during a relatively confined summer season (Viner, 2006). An estimated 84% of the international tourists that visit the Mediterranean come from Europe, mostly from northern and western countries (Amelung and Viner, 2006).
Based on modelling studies, future climate change is likely to make countries at higher latitudes and altitudes more attractive as a tourist destination, due to the poleward shift in the “Tourism Comfort Index” (TCI) (Hamilton et al., 2005; Amelung and Viner, 2006; Amelung and Moreno, 2009). Consequently, providing planning and adaptation are considered carefully, future climate change represents an opportunity for that part of the UK tourism industry whose operations and assets are largely based in the UK.
Metric response function
The TCI was developed in 1985 by Mieczkowski to rate climatic conditions for outdoor recreational activities. The index is based on the notion of “human comfort”, utilising five sub-indices as follows: (1) daytime thermal comfort index (maximum daily temperature (˚C) and minimum daily relative humidity (%)); (2) daily thermal comfort index (mean daily temperature (˚C) and mean daily relative humidity (%)); (3) precipitation (total precipitation (mm)); (4) sunshine (total hours of sunshine); and (5) wind (average wind speed (km/h). The index is weighted and calculated as follows:
All the TCI sub-indices have a maximum value of 5. The maximum value of the index is 100. Based on a location’s index value, its suitability for tourism activity is then rated on a scale from -30 to 100. Mieczkowski (1985) divided this scale into 10 categories, ranging from ‘ideal’ (90 to 100), ‘excellent’ (80 to 89), ‘very good’ (70 to 79), ‘good’ (60-69) and ‘marginal’ (40-49) to ‘extremely unfavourable’ (10 to 19) and ‘impossible’ (9 to –30).
Climate change projections
Application of the TCI to explore the possible effects of climate change on the suitability of tourism destinations only started in earnest during the middle of the last decade, with
Tourism Comfort Index (TCI) Equation TCI = 2 . (4 . ThCDT + ThCDL + 2 . Sun . Prec + Wind)
TCI = Tourism Climate Index ThCDT = Daytime Thermal Comfort Index ThCDL = Daily Thermal Comfort Index Sun = Index of the amount of sunshine Prec = Index of the amount of precipitation Wind = Index of the appreciation of wind

Business, Industry and Services 73
research focused on the world as a whole (Amelung et al., 2007), Canada (Scott et al., 2004), the Mediterranean (Amelung and Viner, 2006) and northwestern Europe (Nicolls and Amelung, 2008). These studies form part of a small volume of peer-reviewed publications, and as such, it can be concluded that research addressing the interactions between climate change and tourism is very much still in its infancy.
The study of Amelung and Viner (2006) examined future climate change projections for the Mediterranean region, in order to anticipate possible changes in tourism within this region and northern Europe. For the last few decades (1960-1990), most of the Mediterranean region is considered ‘good’ or ‘very good’ for tourist comfort, with scores in excess of 60 (Amelung and Viner, 2006). For the same periods, scores for northern and western Europe are rated ‘acceptable’ (40-60) during the summer months (Amelung and Viner, 2006). Experiments with climate change projections suggest that the Mediterranean will become too hot in summer, with northern Europe having a more attractive climate (Amelung and Viner, 2006). Furthermore, the Mediterranean region may become a more pleasant destination in spring and autumn, as highlighted by a bi-model distribution in TCI values for the 2080s in Figure 4.4 (Amelung and Viner, 2006).
0
10
20
30
40
50
60
70
80
90
100
Jan Feb Mar Apr May June July Aug Sept Oct Nov Dec
Tourism
Comfort Index
a) Balearics (Spain)
1970s
2080s
0
10
20
30
40
50
60
70
80
90
100
Jan Feb Mar Apr May June July Aug Sept Oct Nov Dec
Tourism
Comfort Index
b) Blackpool (UK)
1970s
2080s
Figure 4.4 Developments in Tourism Comfort Index (TCI)
Distributions for a) the Balearics and b) Blackpool in the 1970s and 2080s, according to the IPCC (2000) A1F1 Special Report on Emissions Scenarios (SRES).
(Adapted from Amelung and Viner, 2006). A value in excess of 60 is considered a “good” tourist comfort.
In the UK, research published in 2010 by South West Tourism, in partnership with South West Environment Agency and Amelung Advies (a Netherlands-based organisation), investigated the 2009 UK Climate Projections (UKCP09) for the south west region of England and explored the likely impact on tourism comfort and seasonality in the 2020s and 2050s. The south west of England is Britain’s most popular holiday destination, with UK residents alone making over 20 million trips to the region in 2007 (Visit Britain, 2007). The tourism sector is one of the South West's largest economies, with over 22 million staying visitors and 96 million day visitors accounting for approximately 8% of the South West’s GVA and supporting around 240,000 jobs (South West Tourism, 2007).
The results of the South West Tourism study (2010) predict that the TCI scores will improve for the whole region for both the 2020s and 2050s (Table A2.20 and Figure 4.5); a result that is consistent with previous international studies (e.g. Hamilton et al., 2005; Amelung and Viner, 2006). At the 90% probability level, the improvement in TCI is particularly marked and by the 2050s a large proportion of the region achieves the ‘ideal’ TCI score for the months of July and August (South West Tourism, 2010). The TCI improvement is greatest for the shoulder months of June and September, with a

74 Business, Industry and Services
reduction in seasonality, which has the potential to widen the ‘holiday’ season (South West Tourism, 2010).
Key assumptions and limitations
Despite the wide use of the TCI, this index does have a number of limitations:
It has been considered too coarse an indicator, as it is insensitive to the large variety of weather requirements that are posed by tourist activities.
A lack of consideration of additional climate variables that are important to tourism-related activities.
Empirical validation of the index is relatively weak, with the index based heavily on expert judgement (Moreno and Amelung, 2009).
Progress has been made in addressing these issues and improving the climate indices for tourism. De Freitas et al., (2008) proposed a new index that accounts for the overriding properties of some weather aspects and acknowledges the existence of intercultural differences in climate preferences. Morgan et al., (2000) also developed a tailor-made climate index for beach tourism, based on Mieczkowski’s TCI, but fine-tuned with empirical information (the stated preferences of actual beach users, through survey data).

Business, Industry and Services 75
TCI July 1970s, 50% probability TCI July 2050s, 90% probability
TCI July 2020s, 50% probability TCI August 2050s, 90% probability
TCI July 2050s, 50% probability
Figure 4.5 Tourism Comfort Index (TCI) scores
Source: South West Tourism (2010)
Validating the link between climate and tourist behaviour
In the study of Amelung and Viner (2006), the performance of the TCI as a predictor of tourist demand was tested for the Balearics, with encouraging results. In 2002, the six months with TCI scores over 75 accounted for 88% of total nights spent that year; whereas in the remaining six months, in which scores did not exceed 60, visitation levels were very low (Amelung and Viner, 2006). These results are in agreement with findings from tourist surveys from which ‘the climate’ emerged as the Balearics’ single most important attractor, receiving 76% of responses (Amelung and Viner, 2006). For

76 Business, Industry and Services
the UK, a different story emerges, in that historically the weather has not been a primary consideration for visitors, with heritage, culture, the natural environment, and visiting friends and family tending to be much more important determinants (McEvoy et al., 2006).
The UK heat wave in August 2003 was used in the study by South West Tourism (2010) to investigate the impact on occupancy levels in tourist accommodation. The high temperatures (>31 ˚C) experienced in the UK attracted record numbers of visitors to ‘honeypot’ locations, such as Bournemouth and Poole, leading to accommodation reaching capacity and significant over-crowding on local beaches. In the case of Bournemouth, serviced accommodation room occupancy figures over a six-year period for the corresponding month show a distinct change (Table A2.21). Data for the months either side of the August heat wave show occupancy levels as normal in comparison to the rest of the year and the following years, which suggest that the August 2003 peak could be a direct result of the heat wave (South West Tourism, 2010). Projections suggest that extremely hot August temperatures, such as those experienced in 2003, whereby the average temperature was 3.4°C above normal in the UK, may occur as often as one year in five by the 2050s, and three years in five by the 2080s (Stott et al., 2003).
In this analysis for the CCRA, the link between temperature and room occupancy was further explored using Met Office temperature anomaly data29 and Enjoy England monthly room occupancy data30 for the years between 2001 and 2009. For the whole of the UK, there appears to be some degree of correlation between temperature and the level of accommodation room occupancy, with years that experienced warmer than average summer months (e.g. 2003, 2006) linked to a higher degree of room occupancy (Figure A2.7). A couple of anomalies do exist, however, including the fact that highest room occupancy across the UK for this period was experienced in 2007, when temperatures were below average for the months of July and August. This could potentially be explained by people assuming these months would be warm based on the experiences of the previous few years (which were warmer than average).
Exploring visitor behaviour further, by studying the link between temperature and annual bedroom occupancy by location of establishment (in this case, seaside locations), there also appears to be a broad correlation between temperature and visits to the seaside (Figure A2.8). A tentative assumption could be that it is these locations that will experience the most benefit from increasing tourist comfort in the face of future climate change.
It is difficult to justify, however, a direct causal link between climate and holiday trends, and furthermore, even more difficult to make quantitative projections for the future. This is because additional factors (e.g. the national economy, change in consumer spending levels, exchange rates and world events, including terrorism and disease) play a role in holiday decisions.
Consequences for visitor numbers and the UK-based tourism industry
The projected northward shift in the TCI means that there is the potential for the UK to capture some of the southern European tourist market. Modelling studies predict that the impact for the UK would be to reduce outbound tourism (i.e. an increase in domestic holidays in the UK) and reduce inbound tourism slightly (the balance being broadly positive for the tourism industry as a whole) (Hamilton et al., 2005). The same study, also suggests that later in the century the relative increase declines, as the UK becomes too hot (Hamilton and Tol, 2007).
29 http://www.metoffice.gov.uk/climate/uk/anomalygraphs/ 30 http://www.enjoyengland.com/corporate/corporate-information/research-and-insights/statistics/UKOS/UKOS.aspx

Business, Industry and Services 77
In addition to the change in the number of domestic tourists in the UK, there may be a shift in the regional distribution of tourists (from both the UK and internationally) under future climate change projections (Hamilton and Tol, 2007). By 2080, the general pattern for both domestic and international tourists is for the south of England to have a reduced market share, whilst Scotland, the north of England and Wales to have an increased market share (Hamilton and Tol, 2007). In the high scenario, for the majority of regions the change is not greater than half a percent; however, the exceptions are London with a drop of 1.19 % in the high scenario and the regions of Highlands and Islands and eastern Scotland with market share increases of 0.54 and 0.66 %, respectively (Hamilton and Tol, 2007). In absolute terms, however, all regions will have increasing numbers of tourists during the 21st century (Metroeconomica, 2006a). Furthermore, Taylor and Ortiz (2009) discovered that climate influences are particularly important in some months and not in others; domestic tourism is particularly sensitive to climate in March and April and is not sensitive at all in February and October.
Overall for the UK, Pinnegar et al., (2006) summarise the main consequences that climate change may have for tourism and coastal areas as:
Decline in numbers of UK outbound tourists visiting the Mediterranean during summer months.
Increase in domestic tourism within the UK.
Increase in overseas tourists visiting Britain during summer months for coastal (sun, sea, sand) tourism.
Increasing pressures on the coastal zones and waters on the UK.
Quantifying future visitor numbers and economic consequences
An estimation of the economic impact of climate change on tourism would need to consider likely changes to numbers of visitors from abroad, changes to numbers of trips by UK nationals overseas, and changes to spending patterns by UK nationals holidaying in the UK, as well as changes to pressures on infrastructure, accommodation services and food and drink, as well as the impact of projected changes to sea level, water quality, and beach area.
Several studies have used previous ‘hot’ summers as a potential analogue with which to estimate the impact of future hot summers on the UK tourism industry (e.g. WISE report, 1999; Agnew and Palutikof, 2006; Taylor and Ortiz, 2009). The influence of the hot summer of 1995 and 2003 has been shown to have a positive impact on tourist numbers, but a mixed impact on tourist expenditures (WISE report, 1999; Agnew and Palutikof, 2006; Taylor and Ortiz, 2009). A summer warming of 1 ºC is estimated to increase domestic holidays by 0.8–4.7 % (WISE report, 1999). Based on regressions, Agnew and Palutikof (2006) estimate a net increase of £309 million for tourism expenditure due to the hot weather in the UK in 1995.
For the 2003 summer heat wave, Defra (2006b) estimate the impacts at between £17.6 million and £41.2 million for England. Using panel data models, Taylor and Ortiz (2009) quantify the impacts of the summer 2003 heat wave at between £11.48 million and £23.54 million for England. Assuming that the impacts on tourism in Scotland and Wales were similar to those in England, this gave an estimated impact on domestic tourism expenditures of between £14.79 million to £30.32 million from the effect of the summer of 2003 (Taylor and Ortiz, 2009). UKCP09 projections state that for the UK as a whole, under the medium scenario (A1B), a hot ‘1995-type’ August increases from a 1% chance of occurring in the 2020s, to 63% in the 2080s; this will clearly have significant implications for the tourism industry in the UK.

78 Business, Industry and Services
Using a modelling approach, Amelung and Moreno (2009) provided projections of tourist activity, to estimate the role of climate and to explore the effects of climate change. To quantify the economic impact, Amelung and Moreno (2009) developed an equation to convert change in bed nights into tourist expenditures using a value for expenditure per bed night across the EU. Across Europe, the authors predict large increases in bed nights in 2080 (compared to 1970s), with the British Isles experiencing a 3 – 18 % increase in bed nights depending on climate scenario (2.5 °C – 5.4 °C). Across Europe, this equates to an increase in annual expenditure between €529 – 3105 million (under a flexible season situation) and between €474 – 3432 million (under a fixed season situation, i.e. school holidays remain same and people forced to shift holiday location) (Amelung and Moreno, 2009).
Conclusions
Tourism is climate-sensitive and changes in the weather, seasons and climate will impact on the tourism industry affecting the health of destinations, choice of trip and tourist spending. Modelling studies that utilise the TCI indicate that future climate change is likely to result in an improvement in the attractiveness of the UK as a tourism destination and furthermore, extend the tourist season. As exemplified in the south west of England, the climate for tourism activity is projected to not change significantly in the winter but both shoulder seasons are likely to experience an improvement, and in the height of the summer could become excellent and even ideal especially under the 90% probability by 2050 (South West Tourism, 2010). This in turn could mean more visitors, not only throughout the season but also at peak times.
Alongside this climatic amelioration, however, the incidence in severe weather events (e.g. flooding, heat waves and drought) is projected to increase. These events have the potential to directly and indirectly affect tourism (see Section 4.2.2 and Box 4.5).
Projected changes in climate will need careful consideration in both regional and local tourism development, management and planning. Climate change will not only affect tourism through changes in thermal conditions, but also through ecosystem change, impacts on infrastructure and services, effect on access and transport prices, and even changes in economic growth and prosperity (Stern, 2007). This leads to challenges relating to the carrying capacity of the destination, which can be grouped into four categories (McEvoy et al., 2006):
Physical capacity: the point at which site facilities (such as car parks, visitor centres) or access routes become congested.
Ecological capacity: the level at which unacceptable change starts to occur in floristic composition, soil structure and wildlife populations.
Perceptual or social capacity: the point at which the recreational experience starts to deteriorate.
Economic capacity: the threshold beyond which the investment needed to sustain environmental quality becomes prohibitive.

Business, Industry and Services 79
4.2.11 A decrease in output for UK businesses due to an increase in supply chain disruption as a result of extreme events (BU9)
Summary Class
2020s 2050s 2080s Metric code
Risk description
Co
nfi
den
ce
l c u l c u l c u
BU9 A decrease in output for UK businesses due to an increase in supply chain disruption as a result of extreme events
L Too Uncertain
Introduction
In recent years, lean supply chains have become the standard. Businesses have invested considerable effort in maximising efficiency by delivering products to the customer with minimal waste. This is achieved by streamlining operations across all links in the supply chain, from procurement and manufacturing to warehousing and transportation. Leanness has brought efficiency and cost savings, but it has also resulted in increased risk of disruption. A survey from the Business Continuity Institute, which analysed responses from businesses in 35 countries, showed that over 70% of respondents recorded at least one supply chain disruption in 2010 (BCI, 2010). Adverse weather was the main cause of disruption, with 53% of businesses citing this as contributing to recent supply chain disruption.
Supply chain disruptions can cause significant harm to business operations. They can raise costs, trigger inventory accumulations, and reduce a business’ market share. A broken or damaged chain puts production and distribution in jeopardy, reducing revenue when goods cannot be manufactured or delivered. Disruptions can also affect credibility with customers, investors and other stakeholders. A fifth of businesses surveyed in the BCI study admitted they had suffered damage to their brand or reputation as a result of supply chain disruptions.
Climatic factors have the potential to disrupt UK businesses’ supply chains by affecting availability of natural resources and raw materials, or by causing distribution delays (Foresight, 2011a). Climate change represents a key challenge to the security of supply and price of essential commodities that are imported to the UK (Lewis et al., 2010). The manufacturing sub-sector is in turn dependent on a secure supply of electricity, water and transportation (Lewis et al., 2010). Any climate-driven problems with electricity or water supply, or the transportation of raw materials and manufactured goods, would affect the production and trade of manufactured goods in a way that would be difficult to adapt to (Lewis et al., 2010). The climate is also a factor in market demand for goods. If extreme weather events affect key suppliers, and no alternate supply is available, then supply chains are severely interrupted. Each of these risks is likely to increase as the climate changes.
Climate change risks to retail supply chains
All UK businesses, regardless of sector, location and size, are faced with direct and indirect climate change impacts on raw materials and supply chains. The agricultural and manufacturing sectors are vulnerable to direct impacts that affect supply of input materials. General retailers are less exposed to direct risks, but they face knock-on impacts in terms of transportation and distribution impacts. Infrastructure for transport and utilities is particularly vulnerable, and therefore places at risk wholesale and retail trade businesses. Retailers should also not only consider the effects of extreme events on supply chains, but also the incremental effects. As both extreme and incremental

80 Business, Industry and Services
effects potentially become increasingly apparent, businesses will experience knock-on effects through their business models, potentially increasing costs and reducing competitiveness.
Availability of natural resources and raw materials
The retail sector is heavily reliant on raw materials as inputs to manufacturing processes. Climate related impacts on the supply of these resources could reverberate through supply chains to affect business performance. Although UK agriculture provided around 60% of food for UK consumers (Defra, 2010c), imports of raw materials continue to be very important for UK retail supply chains. The following discussion looks at the availability of natural resources and raw materials for global supply chains.
Several climatic variables (e.g., temperature, radiation, precipitation, soil moisture and wind speed) affect the processes that drive productivity of agricultural raw materials and fibre feedstock. Crops generally grow better when CO2 concentrations are higher, however growth, development and yield can all be constrained by climatic thresholds (e.g. lower than average rainfall). As discussed in the Agriculture sector report, the most favourable climatic conditions for individual crop species often exist over a relatively small area. As a result, though species may continue to grow in current locations, they may face competition from other species better suited to altered climate conditions, and suffer a consequent drop in quality.
Animal yields are less sensitive to gradual changes in climate, though they are vulnerable to extremes of heat and water stress. Aquaculture is most at risk from increased water temperatures, access to clean water supplies and ocean acidification as a result of increased concentrations of atmospheric carbon dioxide (Foresight, 2011b).
Climate change will result in migration of new pests and diseases, which affect individual commercial crops and animals. In the western Canadian province of British Columbia, recent warming has helped the mountain pine beetle to survive in climates it would normally find inhospitable (Carroll et al., 2006). In 2006 alone, 9.2 million ha of forest were in an advanced stage of attack from the beetle, and by end of 2006 the cumulative outbreak area affected was estimated at 130,000km2 (close to the total area of England). Timber losses are estimated to be more than 435m m3, with additional losses outside the commercial forest, according to Natural Resources Canada. Mountain pine beetles are expected to wipe out 80% of the province’s pine forest by 2013.
Short-term extreme events, like exceptionally strong winds or floods, can also have negative impacts on commercial crop productivity. Increasing temperature alone is likely to lead to an increase in fire in timber-growing areas. Depending on the region, however, changes in precipitation frequency and intensity may counteract this effect, possibly even leading to a decrease in fire activity. Compound climatic stressors (e.g. high temperatures combined with decreased rainfall) can increase vulnerability in the agricultural sector as a whole. Finally, farmers with smallholdings are likely to be disproportionately sensitive to extreme events, and vulnerable to an additional range of socio-economic pressures, including demographic shifts, urban sprawl, and pollution. Against this backdrop of changing climatic conditions, agricultural production must also keep pace with growing demand for food from an expanding world population (Foresight, 2011b).
Stocks of non-agricultural raw materials can also affected by extreme weather events. Queensland, Australia, which produces about one-third of the world’s supply of coking coal (used in the production of steel) suffered widespread flooding in early 2011. Flooded mines left export stocks stranded in port, pushing up the global prices of both coking coal and thermal coal, which is used for power plants (New York Times, 2011).

Business, Industry and Services 81
The recent review of future resource risks faced by UK business acknowledges several climate-related risks to the food and drink industry, including rising costs of raw materials, rising costs of water and energy (which are likely to negatively impact food production, processing and transportation), and rising costs of timber, with knock-on impacts on packaging prices for manufacturing and processing (Defra, 2010c). Agricultural yields and commodity prices are likely to become more volatile as the climate changes. Disruptions in trade may also drive up prices. UK business will be faced with increasing costs as they endeavour to source raw materials from new areas of the world in response to changes in the geographical viability of crops, or the unreliability of supply. As a potential response, businesses may find it easier to maintain supplies in the event of disruption by diversifying supply chains and providing additional storage capacity to carry higher inventories of input products and raw materials.
Reliability of transport systems
Transportation systems are critical to the supply chains they support. In addition to direct climate change impacts on the production of key resources and commodities, the security of supply to the UK will be affected by the impact of climate change on transportation (Lewis et al., 2010). Global transport networks are likely to be affected by climate change as much as any commodity itself (Lewis et al., 2010). Climate change will affect transportation hubs, such as ports and airports, as well as the transportation networks such as shipping routes, air routes and road and rail networks (Lewis et al., 2010). Globally, many cities, large trading and transport hubs lie in low lying regions, which are most vulnerable to rising sea levels and coastal-related natural hazards expected from climate change. When transport disruptions occur, many supply chains break down and take a long time to recover, with significant costs to business.
The UK is highly reliant on international infrastructure for energy transportation and communications networks (Foresight, 2011a). Furthermore, the growing global reliance on oil and gas reserves in the Middle East is leading to longer, more complex supply chains which are inherently more vulnerable to disruption (Foresight, 2011a). Climate change has the potential to affect energy security, with potential negative impacts for the supply chain and businesses dependent on a reliable supply and stable energy costs.
As demonstrated by the December 2010 snow chaos that disrupted Heathrow for five days, affected about a million passengers and cost the airport group £24m, transportation system performance is keenly sensitive to weather effects, even in the current climate. Because the design of transportation infrastructure incorporates a pragmatic range of temperatures and precipitation as reflected by the local climate, these systems are likely to be increasingly affected by a changing climate. Impacts may result from gradual, incremental changes in key climatic variable (e.g. increasingly hot summers will cause more frequent rail buckling; see the Transport Sector report for a detailed discussion of this risk). Impacts may also occur as a result of extreme climatic events, such as widespread floods or storms.
The Transport sector report focuses on road transport systems, as 90% of national transport needs are provided by roads in the UK. Because UK businesses’ supply chains are global in nature, a brief discussion of climate risks to all transport modes is included in this section.
Longer periods of higher temperatures, combined with traffic loading and speed, can damage roads in several ways, including softening of asphalt that leads to rutting from heavy traffic. The projected increase in heavy precipitation in the UK is likely to cause increases in weather-related accidents and traffic disruptions (see Box 4.8). Increases in precipitation and wind speeds may lead to worse driving conditions. This may result in increased numbers of accidents, and therefore delays on the road network. If more
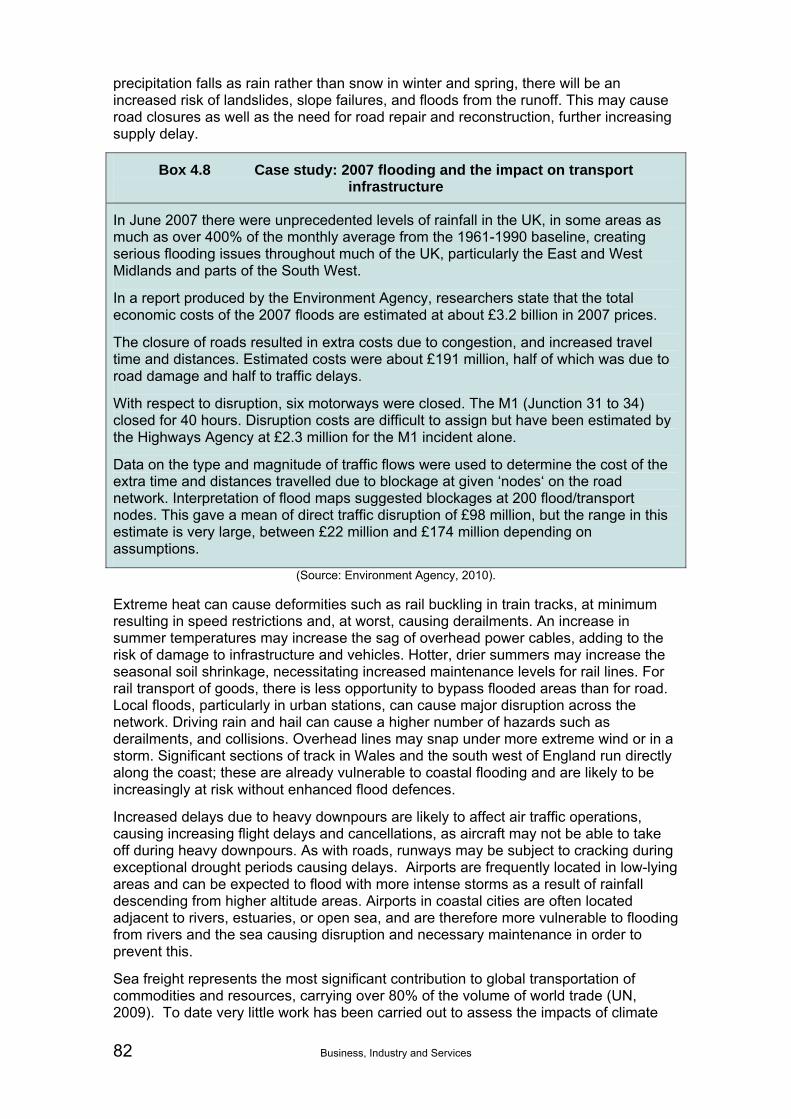
82 Business, Industry and Services
precipitation falls as rain rather than snow in winter and spring, there will be an increased risk of landslides, slope failures, and floods from the runoff. This may cause road closures as well as the need for road repair and reconstruction, further increasing supply delay.
Box 4.8 Case study: 2007 flooding and the impact on transport infrastructure
In June 2007 there were unprecedented levels of rainfall in the UK, in some areas as much as over 400% of the monthly average from the 1961-1990 baseline, creating serious flooding issues throughout much of the UK, particularly the East and West Midlands and parts of the South West.
In a report produced by the Environment Agency, researchers state that the total economic costs of the 2007 floods are estimated at about £3.2 billion in 2007 prices.
The closure of roads resulted in extra costs due to congestion, and increased travel time and distances. Estimated costs were about £191 million, half of which was due to road damage and half to traffic delays.
With respect to disruption, six motorways were closed. The M1 (Junction 31 to 34) closed for 40 hours. Disruption costs are difficult to assign but have been estimated by the Highways Agency at £2.3 million for the M1 incident alone.
Data on the type and magnitude of traffic flows were used to determine the cost of the extra time and distances travelled due to blockage at given ‘nodes‘ on the road network. Interpretation of flood maps suggested blockages at 200 flood/transport nodes. This gave a mean of direct traffic disruption of £98 million, but the range in this estimate is very large, between £22 million and £174 million depending on assumptions.
(Source: Environment Agency, 2010). Extreme heat can cause deformities such as rail buckling in train tracks, at minimum resulting in speed restrictions and, at worst, causing derailments. An increase in summer temperatures may increase the sag of overhead power cables, adding to the risk of damage to infrastructure and vehicles. Hotter, drier summers may increase the seasonal soil shrinkage, necessitating increased maintenance levels for rail lines. For rail transport of goods, there is less opportunity to bypass flooded areas than for road. Local floods, particularly in urban stations, can cause major disruption across the network. Driving rain and hail can cause a higher number of hazards such as derailments, and collisions. Overhead lines may snap under more extreme wind or in a storm. Significant sections of track in Wales and the south west of England run directly along the coast; these are already vulnerable to coastal flooding and are likely to be increasingly at risk without enhanced flood defences.
Increased delays due to heavy downpours are likely to affect air traffic operations, causing increasing flight delays and cancellations, as aircraft may not be able to take off during heavy downpours. As with roads, runways may be subject to cracking during exceptional drought periods causing delays. Airports are frequently located in low-lying areas and can be expected to flood with more intense storms as a result of rainfall descending from higher altitude areas. Airports in coastal cities are often located adjacent to rivers, estuaries, or open sea, and are therefore more vulnerable to flooding from rivers and the sea causing disruption and necessary maintenance in order to prevent this.
Sea freight represents the most significant contribution to global transportation of commodities and resources, carrying over 80% of the volume of world trade (UN, 2009). To date very little work has been carried out to assess the impacts of climate

Business, Industry and Services 83
change on ports and shipping. However, a scoping report of behalf of Associated British Ports (2007) identified a number of potential consequences of marine climate change. Using a risk matrix, which took into account scientific uncertainties, the probability of an impact occurring, and the economic severity of any impact, the following main issues were highlighted:
Delays, closure of ports and prevention of port activities arising from flooding and severe weather
Damage to infrastructure and cargo from flooding and severe weather
Changes to sedimentation and tidal patterns leading to increases in the costs of maintaining navigation channels.
A number of studies have attempted to assess the possible impact of future climate change on the operation of roll-on-roll-off ferries throughout Europe (Woolf et al., 2004; Weisse et al., 2009). One such case study included assessing the potential disruption of future climate change, due to changes in wave climate on the operation of roll-on-roll-off ferries to the Western Isles of Scotland. The Western Isles of Scotland are remote, sparsely populated and are highly dependent on maritime activities. In particular ferry services are vital to the region. At the same time, the seas to the west and north of Scotland are among the roughest in the world during autumn and winter, making maintenance of a reliable ferry service both difficult and expensive. A deterioration in wave climate in response to either natural variability in the North Atlantic Oscillation (NOA) or as a regional response to anthropogenic climate change is a distinct possibility. By analysing the contemporary response to shifts in the NOA, Woolf et al., (2004) projected a significant (although admittedly uncertain) increase in ferry service disruption in the future, as a consequence of deterioration in wave climate. Further discussion regarding the disruption to marine transport due to climate change can be found in CCRA Marine sector report.
The economic cost of adverse wave climate in the region is currently of the order of £10 million per annum. These costs are very small compared to the cost of ‘climate change’ globally. The current case can be identified, however, as an example of an exceptionally high per capita cost to a particular community of an adverse climate, mediated by the impact on the safety and reliability of a maritime service (Woolf et al., 2004; Weisse et al., 2009). Further information on the ferry services routes, passenger numbers and the impacts of potential disruption are provided in the CCRA Marine and Fisheries sector report.
At present, confidence in the wind projections from Global Climate Models (GCMs) and downscaled Regional Climate Models (RCMs) is very low, with some models suggesting that the UK might experience fewer storms and others suggesting an increase. Thus the confidence in projections of wind and storms from the models underlying UKCP09 were also considered unreliable and uncertain. Wave heights around the UK depend on winds and storms both locally and in the wider Atlantic. Measurements of wave heights in UK waters have indicated substantial variability in wave height, depending on season and location. Although there have been no clear trends over the twentieth century, the wave climate seems to have roughened appreciably between the 1960s and the 1990s.
Due to the uncertainty regarding future changes in extreme wind conditions (and hence waves), it was decided not to consider storm-related disruptions to port operations beyond the work described above. More detail on these topics is, however, provided in the CCRA Marine and Fisheries sector report.
Chill chains (used to transport frozen or perishable products from producer to consumer) are also at risk during hotter weather. Higher temperatures may increase

84 Business, Industry and Services
refrigeration needs for goods during transport, raising transportation costs due to reductions in fuel efficiency of transport vehicles.
Key assumptions and limitations
Because supply chains are complex and dependent on a network of interconnected, yet independent, elements, it is not possible to develop a clear and direct causal link between climate change and supply chain disruption. Many climatic factors (e.g. heat, precipitation, melting, flooding) can break supply chains, making a single response function too simplistic.
Import intensity could be considered as a proxy for climate change risk, as businesses which are heavily dependent on foreign imports are exposed to climate impacts in other parts of the world. However, this is a narrow view which ignores the fact that even domestic suppliers can be affected by extreme weather events or changes in climatic thresholds. Moreover, it is the ability of retailers and manufacturer to shift suppliers that is more important than the level of international imports, as it is entirely possible that a UK retailer with no imports may be highly vulnerable to climate change if the retailer has limited or no alternative suppliers.
Conclusions
Supply chain disruptions are costly to business. A report that assessed supply chain integrity showed that disruptions negatively affect company stock price, return on assets, and return on sales (Pricewaterhouse Coopers, 2008). The report also shows that businesses do not tend to recover quickly from supply chain disruptions. On average, affected companies’ share prices dropped 9% below the benchmark group, and two-thirds of affected companies were lagging their peers in stock price performance a year after the disruption.
Climate change will cause shifts in both average conditions and the frequency and severity of extreme climate events. These shifts have the potential to affect every aspect of the business supply chain, often in ways that are gradual, diffuse or indirect. Increasing globalisation, outsourcing and just-in-time approaches to inventory already create significant risk exposure. It may be more difficult to map out and understand supplier relationships (supply chain visibility) and contain costs under continuing climate change. Climate-related disruptions all over the globe will affect suppliers in their own locations, with knock-on risks UK businesses.
4.2.12 Loss of staff hours due to high internal building temperatures (BU10)
Summary Class
2020s 2050s 2080s Metric code
Risk description
Co
nfi
den
ce
l c u l c u l c u
BU10 Loss of staff hours due to high internal building temperatures31 M 1 2 2 1 2 3 1 2 3
31 This has been scored using expert opinion and the percentage reductions in productivity rather than the potential economic losses. The potential economic costs have been considered in the economic analysis in the Evidence Report and the more general topic of overheating in buildings has been assessed as one of the most significant risks for the Built Environment.

Business, Industry and Services 85
Introduction
Changes in climate will clearly influence both the heating and cooling energy demand within buildings. Modern factory buildings, due to their design characteristics, are more vulnerable to climate change, through increased ambient air temperatures, and reduced cloud cover (increasing UV radiation), as well as heat created by plant and machinery, IT equipment and lighting. Internal building temperatures are likely to increase throughout the year and especially during summer months. With respect to cooling requirements, longer, drier summer periods may cause overheating in naturally ventilated buildings and affect the capacity of low energy cooling systems to provide comfortable conditions across all building types. These changes may have knock-on implications for worker health and safety, productivity and product quality.
The issue of overheating of buildings has been considered in the Built Environment sector report, metric BE3 (Capon & Oakley, 2012). This considered the number of days per year when the temperature exceeds a comfort level, which is taken as the threshold for overheating. To relate this to business interests, this risk metric has been extended to consider the implications of overheating on productivity in the work place. Using data from the Inter-departmental Business Register (IDBR), it was possible to make a preliminary assessment of the impact on different business sectors, by utilising regional projections for more frequent warm days during the summer months and statistics for staff numbers.
Metric response function
The combination of overheating and warm weather periods has been observed to produce two responses in the workforce; increased absenteeism (Kronos, 2007) and reduced productivity (Parsons, 2009). The fall in productivity when working in high temperatures has been examined by National Institute of Occupational Safety and Health in the US (CEBR, 2003; NIOSH, 1986). A response function based on an interpretation of their estimates is presented in Figure 4.6.
A baseline was established using the same time series data used in the Built Environment sector report (Armstrong et al., 2010; Capon & Oakley, 2012). The data consists of average daily maximum temperature on those days when the temperature exceeds 26°C, covering England and Wales. A value of 26°C was used to allow for the effect of solar gains, building performance and the fact that some productivity loss starts to be observed at around this temperature (Figure 4.6). This is, however, lower than the CIBSE guidance, which suggests a value of 28°C is more appropriate (CIBSE, 2006). As a sensitivity check, the analysis was repeated using this higher value.
25 30 35 400
20
40
60
80
Temperature (deg C)
Fal
l in
prod
ucti
vity
(%
)
0 10 20 3010
20
30
40
time (hr)
Tem
pera
ture
(de
g C
)
26
Figure 4.6 Fall in productivity as a function of temperature Interpreted from NIOSH (1986) estimates (left plot). Function used to estimate duration above threshold based
on min, max and mean daily temperatures, compared with observations for a typical hot day32 (right plot).
32 Based on observed air temperatures in Southampton on 27 June 2010 (source: www.sotonmet.co.uk)

86 Business, Industry and Services
An initial model using the daily maxima, the average number of days over the threshold and the response function for loss of productivity was found to significantly overstate the impact. A more detailed model was therefore developed comprising the following:
Tmax – the maximum daily temperature was available in the observation record and was scaled using the UKCP09 projections for the summer seasonal average of the maximum air temperature.
Tmean – the mean daily temperature was also available in the observed record and was scaled using the UKCP09 projections for the summer seasonal average of the mean air temperature.
N – number of days that Tmax exceeds the threshold (either 26°C or 28°C). For the projections this was found by counting the number of exceedances having re-scaled Tmax.
D – the duration of exceedance. The hourly variation of temperature over the day was approximated by a sine curve. This is illustrated in Figure 4. against some measured date, where the modelled curve is generated using Tmax and Tmean. An upper bound was placed on the duration of half a working day, to account for lunch breaks and the increasing likelihood of a shift in work time practices as sustained hot periods become more routine (e.g. early starts or long lunch breaks).
P – the loss in productivity was found by estimating the percentage loss in productivity, p, at the daily maximum temperature, using the scaled value of Tmax and the response function (Figure 4.). The daily loss was then the product of the duration and the percentage loss in productivity, again assuming a sine wave growth and decay (P=2.D.p/π). These values were then summed for each region of England and Wales to get the loss in productivity in days. To take account of existing cooling infrastructure (predominantly in modern offices and factory spaces) the values were then halved. No further adjustment was made, however, to take account of any future provision of cooling.
Climate change projections
Using the UKCP09 climate projections, the loss of productivity due to overheating was calculated for the UKCP09 regions, and the various epochs (2020s, 2050s, 2080s), emissions scenarios (high, medium, low) and probability levels (p10, p50, p90). The UKCP09 temperature variables, used to scale Tmax and Tmean, were adjusted by 0.5°C for all epochs, to address the fact that baseline conditions are for the period 1960-90 (with the period post-1990) has experienced temperature increases of 0.5°C. The results using a 26 ºC threshold are presented in Table A2.22 and those for a 28 ºC threshold in Table A2.23.
The results suggest a potential doubling in lost productivity as an upper bound by 2020 (p90 values), with little change at the lower bound (p10 values). By the 2050s, the central estimate is for an average 3-fold increase, rising to an average increase of 8-9 times for the high emission, p90 case. This pattern continues into the 2080s, with roughly a 50% increase in lost productivity for the p10 case, and an increase of between 10-50 times for the high emissions, p90 case.
The values derived from the observed data using a 26°C threshold are typically double the values based on a 28°C threshold. For the 2020s, this reduces to an 80% difference and continues to fall to a difference of around 20% by the 2080s. The reason that the lower threshold produced higher values is simply that a far greater number of days exceed the lower threshold and therefore make a contribution to the summed value of lost productivity.

Business, Industry and Services 87
Exposure of sections and divisions of industries
This analysis makes use of the Standard Industry Classification (SIC) data, described in Section 4.2.5, to relate the exposure of sections and selected divisions of industries to overheating in factory or office work spaces. For each SIC section, the results were summed on a 10 km grid to provide a high-level indication of the spatial distribution (e.g. Figure A2.9) and to the UKCP09 regions for spatial climate change maps (e.g. Figure A2.10) and tabular summaries (e.g. Table A2.24). The regional changes in lost productivity are used to factor the staff numbers of those businesses in each group examined.
The 2010 SIC data indicates that the present day turnover of businesses (summed over sections A-R) amounts to £3.8 trillion, employing over 23 million staff. Currently the annual average days lost, using the 26°C threshold, is some 5 million, which is 0.1% of the staff time available. Using the 28°C threshold, this reduces to 3 million or 0.06% of the staff time available. Using the lost staff days and an average staff cost of £150 (average wage, plus social costs), this equates to a value of £770 million, which is 0.09% of payroll costs and 0.02% of turnover for the 26°C threshold (£460 million, 0.05% of payroll costs and 0.01% of turnover for the 28°C threshold).
Scaling the costs in a similar manner to the lost production estimates above, this produces an estimated increase in costs to £3.6 billion by 2080 (medium emissions, central estimate), with a range of £1.1 to £15.2 billion (low emissions, lower estimate to high emission, upper estimate). Summary results, summed across sections A-R and compared across the 26°C and 28°C threshold, are given in Table A2.25.
Similar to the results for flooding-induced loss of staff time (Section 4.2.6), wholesale and retail is the most exposed section, with the health and education sections next, due to the high staff numbers employed in these sections.
Key assumptions and limitations
There are a number of key assumptions and limitations with this methodology:
The metric response function needs is based on US studies and therefore needs to be validated for UK conditions.
It is likely that productivity is not simply a function of temperature, with other factors such as humidity, ventilation and building solar gain also important.
Some researchers have suggested that temperatures can be much closer to the physiological tolerance curve before there is any significant impairment of mental capacity (Hancock, 1981); this would suggest that the curve in Figure 4.6 may be overly pessimistic.
The range of results generated by the two temperature thresholds (26°C and 28°C) provide an indication of the uncertainty associated with this methodology. A better understanding of the impact of high temperatures on worker efficiency would provide more accurate estimates of potential impacts for business turnover and profitability.
Worker acclimatisation has been excluded from the analysis. It is suggested that after 7-10 days of sustained exposure, workers start to develop some degree of acclimatisation, although they still do not work as efficiently as in cooler environments (NIOSH, 1986). As a consequence, the estimates for the 2050s and 2080s are likely to be an overestimate.
Adaptation measures, such as improvements in building design, ventilation (including air conditioning), and potentially adaptive work practices to avoid

88 Business, Industry and Services
working in the heat of the day, have been ignored. Such adaptations will all reduce the impact, whereas loss of green space and any increase in the urban heat island effect (see Built Environment sector report) are likely to exacerbate the problem.
Conclusions
The implications on workforce productivity due to overheating in the work place have the potential to have serious consequences for the Business, Industry and Services sector, unless suitable adaptation measures are introduced. At the upper bounds and using the 26°C threshold, the results suggest that the cost of loss in productivity due to building temperature could increase from a baseline of £770 million in 2010 to between £850 million and £1.6 billion in the 2020s; between £1.1 billion and £5.3 billion in the 2050s and between £1.2 billion and £15.2 billion in the 2080s.

Business, Industry and Services 89
5. Socio-Economic Change Step 10
5.1 Introduction
It is recognised that many of the risk metrics in CCRA are influenced by a wide range of drivers, not just by climate change. The way in which the social and economic future of the UK develops will influence the risk metrics. This chapter provided a high-level discussion of how different changes in our society and economy may influence the risks and opportunities identified in Chapter 4. The dimensions of socio-economic change that were considered are:
Population needs/demands (high/low)
This dimension is intended to encapsulate drivers of population size and distribution (geographically and demographically) and the pressure population creates in terms of housing, education etc. One extreme is that there is a high degree of demand on natural, economic and social resources (demand exceeds supply and more people are exposed to risk); the other is that demand is very low (supply exceeds demand and people are less exposed to risk).
Global stability (high/low)
This dimension describes drivers based on world events that would increase or decrease global stability (e.g. war, natural disasters, economic instability). The extremes are higher global stability (with little pressure on Governments and people) compared to today, and lower global stability (with a high degree of pressure on Governments and people that outweigh other priorities) compared to today.
Distribution of wealth (even/uneven)
This dimension considers the distribution of wealth amongst the British population; the extremes being whether it is more even compared to today or more uneven (with a strong gradient between the rich and poor) compared to today.
Consumer driven values and wealth (sustainable/unsustainable)
Globalisation and consumerism are the primary drivers here, specifically movement towards or away from consumerism values. The extremes are that consumers prioritise their time for working and the generation of wealth, with a focus on the consumption of material market goods and services compared to today; and consumers reduce the importance of work and wealth generation in favour of leisure and less materialism, with a focus on the consumption of non-market goods and services, such as conservation and recreational activities in green spaces.
Level of Government decision-making (local/national)
This relates to how centralised adaptation policy making is; the extremes being whether there is a completely centralised policy compared to today; or whether there is a very small central Government input and high degree of localism in decision-making compared to today.
Land use change/management (high/low Government input)
These dimensions relate to aspects of urbanisation versus rural development. The extremes are that looser planning restrictions might increase development in rural areas (building on the green belt, power stations, etc.) compared to today, versus

90 Business, Industry and Services
tighter planning that might increase urban development (more brown field sites) compared to today.
5.2 Estimates of changes in selected social and economic futures
For each risk metric, a summary of relevant socio-economic drivers is provided in Table 5.1. Arguably, the most important dimension of change to the Business, Industry and Services sector is the level of Government decision-making, both in the UK and internationally. The international nature of certain sub-sectors, for example financial services, and individual companies, means that global stability has the potential to have significant implications for these groups. Global stability is dependent upon effective structures for global governance, legal instruments, and the maintenance of international networks of trade and diplomacy (Foresight, 2011a). As such, it is important for the UK to understand how these networks will be affected as the world experiences changes in temperature, extreme weather, sea level rise and precipitation from climate change in the decades ahead (Foresight, 2011a).
It is also worth noting that many of the risks have an assumed level of autonomous adaptation, for example, policy relating to the development of new homes in areas at risk of flooding. Activity in the various sub-sectors of the Business, Industry and Services sector are often driven by changes in regulation, which again highlights the sensitivity of this sector to the level of Government decision-making.

91
Table 5.1 Socio-economic change summary, with extreme scenarios highlighted where applicable
Business, Industry and Services sector risks and opportunities
Population needs/demands (high/low)
Global stability (high/low)
Distribution of wealth (even/uneven)
Consumer driven values and wealth (sustainable/
unsustainable)
Level of Government decision-making (local/national)
Land use change/management
(high/low Government input)
BU1 Fund performance Population size: n/a
Population distribution: With an ageing population, there will a greater volume of pension funds and consequently an increasing number of elderly people may be exposed to negative fund performance.
(High): This has a major negative impact on financial institutions.
n/a Generation of wealth and investment funding are closely linked.
Depending on the level of Government decision-making, support or control of businesses in this sub-sector could be affected (adversely or beneficially).
n/a
BU2 Tourism financial Population size (High): Increased demand for tourist facilities will put pressure on natural assets and infrastructure.
Changes in tourism will affect financial performance, including both opportunities and threats.
(High): This affects the willingness of people to travel, and changes tourist destination choices.
Changes in tourism will affect financial performance of UK-based foreign operators.
This will affect the type of tourism services required.
Changes in tourism will affect financial performance.
This will affect the type of tourism services required.
Changes in tourism will affect financial performance.
Depending on the level of Government decision-making, support or control of businesses in this sub-sector could be affected (adversely or beneficially).
(Low input): Less restrictive planning control may place more tourism assets in areas prone to natural hazards, which may be exacerbated due climate change.
BU3 Water availability Population size (High): Increased pressure on public water supply, which could mean that business may increasingly be competing with communities and other users for a limited water supply and have abstraction licenses adjusted.
n/a n/a (Sustainable): Pressure on water resources will reduce, although this may be counteracted by increasing population, etc.
Depending on the level of Government decision-making, support or control of businesses in this sub-sector could be affected (adversely or beneficially).
(Low input): Less restrictive planning controls may place more properties in areas with water scarcity.
BU4 Flooding & industry
Population size (High): May alter flood management priorities. It is possible that this shift in priorities may affect industrial flood protection policy.
n/a n/a (Unsustainable): This will increase the material impacts of flooding.
Depending on the level of Government decision-making, support or control of businesses in this sub-sector could be affected (adversely or beneficially).
(Low input): Less restrictive planning controls may place more industrial sites at risk to flooding.

92
Business, Industry and Services sector risks and opportunities
Population needs/demands (high/low)
Global stability (high/low)
Distribution of wealth (even/uneven)
Consumer driven values and wealth (sustainable/
unsustainable)
Level of Government decision-making (local/national)
Land use change/management
(high/low Government input)
BU5 ICT Population size (High): Demand for ICT will increase, and the impacts of disruption will be greater.
(High): Important international links and networks could be negatively affected.
n/a (Sustainable): If working from home is increased, there is a greater risk of loss in productivity due to ICT failure.
Depending on the level of Government decision-making, support or control of businesses in this sub-sector could be affected (adversely or beneficially).
n/a
BU6 Mortgage provision
Population size (High): May exacerbate the issue of exposure of homes located in areas of significant flood risk. If unmanaged, house stock asset value may be affected if insurance becomes increasingly difficult to obtain.
n/a The housing market is sensitive to the distribution of wealth. The loss of mortgage provision could lead to less affluent people living in flood risk areas without insurance, hence increasing vulnerability.
(Unsustainable): Increasing demand for homes and wealth may exacerbate issues around flood risk and mortgage provision.
(National): More centralised Government policy making may mean that Government will continue to reach agreement with the ABI to maintain insurability of properties.
(Low input): Less restrictive planning controls may place more properties at risk of flooding.
BU7 Insurance claims Population size (High): Growth of the insurance industry, together with increased exposure to weather-related claims.
The results shown for the “Principal” socio-economic scenario show an increase of about 30% compared with climate change only results by the 2050s (and 45% by the 2080s).
n/a n/a Levels of wealth affect insurance claims.
Depending on the level of Government decision-making, support or control of businesses in this sub-sector could be affected (adversely or beneficially).
(Low input): Less restrictive planning controls may place more properties at risk of natural hazards, which may be exacerbated due climate change.
BU8 tourism opportunities
Population size (High) and ageing demographic: May increase opportunities for domestic tourist industry. These factors are likely to contribute to an increased seasonal spread of holidays, higher demand for short breaks, and the need for “time-efficient” access to destinations (McEvoy et al., 2006).
(High): There is the potential for increased revenues in the domestic tourism market, as people change their choice of destination.
This will affect the type of tourism services required as tourism expands to meet future needs. Values placed on different types of tourism activities may alter (e.g. nature-based tourism).
(Unsustainable): Increasing globalisation and wealth may affect the demand for new domestic holidays.
Depending on the level of Government decision-making, support or control of businesses in this sub-sector could be affected (adversely or beneficially).
(Low input): Less restrictive planning controls may allow the tourism sector to expand without undue control to meet increasing consumer needs.

93
Business, Industry and Services sector risks and opportunities
Population needs/demands (high/low)
Global stability (high/low)
Distribution of wealth (even/uneven)
Consumer driven values and wealth (sustainable/
unsustainable)
Level of Government decision-making (local/national)
Land use change/management
(high/low Government input)
BU9 Supply chains Population size (High): May lead to disruption, particularly in terms of increased congestions on road networks, for example.
(High): This has a major negative effect on suppliers, transport and logistics and retailers.
Larger companies may be able to secure alternative suppliers and become more resilient to supply chain disruption than SMEs.
(Unsustainable): Increasing wealth and consumer demand will increase the number and potential complexity of supply chains.
Depending on the level of Government decision-making, support or control of businesses in this sub-sector could be affected (adversely or beneficially).
n/a
BU10 Overheating Population size (High): Increased competition for energy in meeting local cooling demands exacerbates risk in commercial buildings. Demand surges for cooling energy more likely to cause short-term interruptions in supply systems.
n/a More widespread autonomous adaptation in terms of retrofit measures and targeted programmes seeking to improve thermal comfort conditions but SMEs may lag behind larger businesses.
(Sustainable): A shift in the balance of industries, to more local-based manufacturing, may result in increase the numbers of manual workers, who are more exposed. However, a shift in the balance from work to leisure time may decrease exposure.
(National): Coordinated centralised efforts to improve building performance standards via Building Regulations and other drivers means risk of overheating in buildings is likely to be reduced via adaptation measures.
n/a
n/a = not applicable

94 Business, Industry and Services
6. Costs Step 11
6.1 Introduction
Climate change adaptation decisions that are designed to reduce climate change risks inevitably involved making trade-offs concerning the use of scarce economic resources. To the extent that economic efficiency is an important criterion in informing such decision-making, it is useful to express climate change risks in monetary terms, so that they can be:
Assessed and compared directly (using £ as a common metric) and
Compared against the costs of reducing such risks by adaptation.
For the CCRA, a monetisation exercise has been undertaken to allow an initial comparison of the relative importance of different risks within and between sectors. Since money is a metric with which people are familiar, it may also serve as an effective way of communicating the possible extent of climate change risks in the UK and help raise awareness.
Where possible, an attempt has been made to express the size of individual risks (as described in this report) in monetary terms (cost per year) however, due to a lack of available data it has sometimes been necessary to use alternative costs (repair or adaption) to provide an estimate. A summary of the results is provided in Table 6.1.
A variety of methods have been used to determine the costs. In broad terms, these methods can be categorised according to whether they are based on:
Market prices (MP)
Non-market values (NMV) or
Informed judgement (IJ).
Informed judgement has been used where there is no quantitative evidence and was based on extrapolation and/or interpretation of existing data.
In general terms, these three categories of method have differing degrees of uncertainty attached to them, with market prices being the most certain and informed judgement being the least certain. It is important to stress that the confidence and uncertainty of consequences differs. Therefore, care must be taken in directly comparing the results. Whilst we attempt to use the best monetary valuation data available, the matching-up of physical and monetary data is to be understood as an approximation only.
Further, it is important to highlight that some results are presented for a scenario of future climate change only, whilst others include climate change under assumptions of future socio-economic change. There are also some important cross-sector links, or areas where there is the risk of double counting impacts: these are highlighted on Table 6.1.
The basic approach to the costing analysis is, for each impact category considered, to multiply relevant unit values (market prices or non-market prices) by the physical impacts identified in earlier sections of this sector report. The total value to society of any risk is taken to be the sum of the values of the different individuals affected. This distinguishes this system of values from one based on ‘expert’ preferences, or on the

Business, Industry and Services 95
preferences of political leaders. However, due to the availability of data, it has sometimes been necessary to use alternative approaches (e.g. repair or adaptation costs) to provide indicative estimates.
There are a number of methodological issues that have to be addressed in making this conversion (Boyd and Hunt, 2004; Metroeconomica, 2006b) including the compatibility between physical units and monetary units and the selection of unit values that address market and non-market impacts. As far as possible, physical and monetary units have been reconciled. The selection of unit values is justified in the explanation of the method used to monetise each risk metric. The aim is to express the risk in terms of its effects on social welfare, as measured by the preferences of individuals in the affected population. Individual preferences are expressed in two, theoretically equivalent, ways. These are:
The minimum payment an individual is willing to accept (WTA) for bearing the risk or
The maximum amount an individual is willing to pay (WTP) to avoid the risk.
There are also other issues (beyond this scoping analysis) in terms of impacts that have non-marginal effects on the UK economy, the treatment of distributional variations in impacts, and the aggregation of impact cost estimates over sectors and time.
6.2 Economic impacts
A number of the risks analysed for the Business, Industry and Services sector (as presented in Chapter 4) involved an assessment of the economic impacts. This is largely because the end-point consequence for business is monetary loss or gain. As a result, analysis of economic impacts utilises the Sector Risk Analysis data (Chapter 4) as a starting point.
A summary of the monetary estimates is provided in Table 6.1. BU6 and BU7 specifically do not seek to measure such costs and as a consequence they are separately bordered in Table 6.1. Furthermore, since these values are derived from analysis undertaken in other sector reports, they should not be seen to be additive to the cost estimates derived.
The economic impacts are presented:
In terms of constant 2010 prices, rather than as a present value or equivalent annual cost. (It is recommended that if these values are used in subsequent analysis, present values should be adopted – The HM Treasury Green Book (2007) recommends 3.5% discount rates).
For each of the UKCP09 climate scenarios (low, medium and high). For each climate scenario, a probability density function (pdf) has been generated; the CCRA has used data from the 10% (p10), 50% (p50) and 90% (p90) of this pdf, and results are presented for these three data points on the climate scenario pdf.
Assuming no specific mitigation scenario, in addition to the current commitment from the UK Government.
Across four population scenarios (current, low, principal and high).
Against risk baselines (2008) and the climate baselines (1961-1990).

96 Business, Industry and Services
Assuming no planned adaptation additional to what is in place at the present time.
Table 6.1 Summary of results in £million per annum (2010 prices, no uplift or discounting) – climate change signal only (current socio-economics) – relative
change from baseline period. Medium p50 scenario
Risk metrics 2020s 2050s 2080s Estimation Method
Confidence ranking
Notes
BU1 Reduced returns for UK financial institutions’ investments due to the absence of mainstreaming climate risk and adaptation into decision-making processes.
-H? -H? -H? Informed
Judgement L L
Likely to be double counted with risks in other sectors such as floods, agriculture, transport and health. Should not be interpreted as welfare impact.
BU2 An increase in monetary losses as a result of an increasing proportion of UK tourist assets (natural and built) at risk from flooding.
-L -L -M Market Prices
M
Maintenance costs used, equating to adaptation costs. Therefore likely to be lower bound of true welfare costs.
Links with Flooding.
BU3 A decrease in water (groundwater and surface water) availability for industrial usage.
-L -L -L Non-Market
Values M
Double counting with WA5. Links with Water.
BU4 An increase in monetary losses as a result of interruption to business from flooding.
-H -H -VH Market Price H
Double counting with FL7. Links with Flooding. Should not be interpreted as welfare impact.
BU5 A decrease in productivity and revenues due to ICT loss/ disruption.
-L -L -L Informed
Judgement L
Qualitative risk assessment.
BU6 Increased exposure for mortgage lenders.
- - - H
Double counting with FL6. Links with Flooding. Should not be interpreted as welfare impact.
BU7 An increase in insurance industry exposure due to flooding.
-VH -VH -VH Market Price H
Double counting with FL6 and FL7. Links with Flooding. Should not be interpreted as welfare impact.
BU8 An expansion of new or existing tourist destinations in the UK.
+H? +H? +H? Informed
Judgement/ Market Price
L
Expenditure estimates extrapolated from literature. Should not be interpreted as welfare impact.

Business, Industry and Services 97
Risk metrics 2020s 2050s 2080s Estimation Method
Confidence ranking
Notes
BU9 A decrease in output for UK businesses due to an increase in supply chain disruption as a result of extreme events.
-M? -M? -H? Informed
Judgement L
Qualitative risk assessment.
BU10 Loss of staff hours due to high internal building temperatures. -H? H - VH?
-H - VH?
Market Price L
Underlying physical risk assessment very uncertain. This overlaps with BE3 and also involves double counting with energy for cooling.
Note: - signifies a negative impact or loss; + signifies benefits or cost reductions.
Impact Cost Ranking: L = £1-9m/pa M = £10-99m, H = £100-999m, VH= £1000m+, ? = not possible to assess
Monetisation Confidence Ranking:
Ranking Description Colour code High Indicates significant confidence in the data, models and
assumptions used in monetisation and their applicability to the current assessment.
Medium Implies that there are some limitations regarding consistency and completeness of the data, models and assumptions used in monetisation.
Low Indicates that the knowledge base used for monetisation is extremely limited.
The following sub-sections review the monetary data available through the Sector Risk Analysis (Chapter 4) and provide justifications for their adoption or reasons against their use.
6.3 Presentation of results, uplifts and discounting
Consistent with other sectors, the results below are presented in terms of constant current prices for the three time periods considered in the CCRA i.e. the 2020s, 2050s and 2080s. The results are presented in this way to facilitate direct comparison.
At this stage, we have not presented the values below as a present value or equivalent annual cost. However, the use of the values in subsequent analysis, for example in looking at the costs and benefits of adaptation options to reduce these impacts, would need to work with present values. For this, the values below would need to be adjusted and discounted. For discounting, the Green Book recommends 3.5% discount rates/factors (HMT, 2007) noting that for longer time periods as assessed here, this requires the use of the declining discount rate scheme.

98 Business, Industry and Services
6.3.1 Reduced returns for UK financial institutions’ investments due to the absence of mainstreaming climate risk and adaptation into decision-making processes (BU1)
As discussed in Section 4.2.1, there is limited substantive evidence on the consequences of changes in climate on UK financial institutions. The most significant consequences are expected to occur if financial institutions fail to mainstream climate change adaptation considerations into their investment decisions, through changes in investment financial and/or credit performance. Furthermore, financial institutions are exposed to reputational risks, investor pressures, legal liabilities and changes in demand for finance.
Whilst reduced returns and/or increased risks to investments of UK financial companies represent one of the largest climate change exposures for the UK industry as a whole, it has not been possible to undertake quantitative analysis on the basis of the available information. With no quantitative basis to work with, support is given to the speculative conjecture that the size of this risk is potentially high. It should be noted, however, that there are likely to be large overlap – and potential double counting – with risks in other sectors such as floods, agriculture, transport and health. As highlighted in Section 4.2.1, opportunities are also likely to arise, with financial institutions responding to adaptation needs.
6.3.2 An increase in monetary losses as a result of an increasing proportion of UK tourist assets (natural and built) at risk from flooding (BU2)
In Section 4.2.2, an estimate was made of the potential value of tourist built assets (arts, theatre, museum and library) at risk from coastal and riverine flooding in England. It is recognised that the costs to tourist activity that may be impacted by coastal and river flooding are likely to be significant. Preventative expenditures in the form of the cost of flood bunds around each of the building were used. These can be seen as adaptation costs and can best be interpreted as lower bound estimates of willingness to pay (WTP), assuming that they are implemented. Whilst there are likely to be important impacts on local areas, however, it is not certain that the welfare loss will be significant in aggregate since tourists are likely to change their destination.
Mid-point estimates for the 312 buildings listed in Table A2.4 generated annual climate change attributable costs of £0.1 million by the 2050s and £0.2 million by the 2080s. In order to derive an indicative estimate of the potential aggregate size of this risk, estimates have been scaled-up over the 28,659 listed buildings and churches of national or international importance located in England in Flood Risk Zone 3, and listed in Table A2.2. This produces annual climate change attributable costs of £9 million by the 2050s and £18 million by the 2080s. These can therefore be categorised as a low cost ranking in the 2020s and 2050s and a medium ranking in the 2080s (Table 6.1).
6.3.3 A decrease in water (groundwater and surface water) availability for industrial usage (BU3)
As discussed in Section 4.2.5, the amount of water that can be abstracted for public water supply, agriculture and industry is sensitive to the annual water balance and subject to changing licence conditions. One of the key findings of the Water sector report is that water abstraction may become unsustainable in a large proportion of the UK’s rivers due to low summer flows. A shift in seasonal and/or total availability of water resources, as a result of climate change, has the potential to have significant impacts on the Business, Industry and Services sector in the UK. It is, however,

Business, Industry and Services 99
important to remember that industrial abstraction should be viewed in the context of other abstraction sectors, particularly agriculture, which expected to become increasingly important in a future where food security is emphasised in UK public policy. The importance of water for agriculture is discussed further in the Water sector report.
As described in the Water sector report, industrial users holding abstraction rights are likely to be willing to pay to prevent licence withdrawal or be prepared to accept compensation. To estimate WTP, abstraction charges may be used to generate estimates of costs to industry. It is important to note that the findings of RPA (1999), who undertook an informal survey of a number of sectoral users, suggest that the charges are set below WTP levels.
The change in total value of industrial abstractions that may be prevented if catchments switch from being sustainable to unsustainable is presented in Table A3.1 (for abstraction from local catchments) and Table A3.2 (for abstraction from downstream catchments). As might be expected, the costs increase across low to high emission scenarios, and across time periods to the end of the century (relative to current day risk baseline). Annual climate change attributable costs are under £3.5 million across all emissions scenarios and time periods and can therefore be categorised as a low cost ranking (Table 6.1). Furthermore, it is important to highlight that the scale of these results is low compared with WA5 (supply demand deficits). This finding is consistent with the conclusion drawn in Section 4.2.5, that the projected changes to industrial abstractions coming from sustainable sources are relatively small in comparison to agriculture.
It is possible that the extent of adaptive measures put in place by other sectors (e.g. public water supply) or changes in regulatory controls could have more of a day-to-day impact on industrial abstractors, than any absolute changes in water availability. Thus, though constraints on supply as a result of climate change do have the potential to effect industrial use, the wider constraints on water supply will possibly have a larger, albeit more indirect, effect.
6.3.4 An increase in monetary losses as a result of interruption to business from flooding (BU4)
This metric focuses upon the financial impact on industry arising from business interruption, including damage to assets and lost staff time. The Floods Sector report made estimates of Expected Annual Damage (EAD) relating to the Non-Residential Property (NRP) in England and Wales resulting from fluvial and tidal flooding (Table A3.3). The damage costs from flooding to NRPs are shown to increase across the three time periods, so that by the 2080s under the medium climate scenario (p50) annual costs are projected to increase by a factor of three, compared to the current (2008) baseline.
In addition to damage costs, some businesses claim compensation from insurance for disruption to businesses where flooding involves extra costs and lost income. It is assumed that business interruption costs increase at the same rate as EAD and the figures do not include socio-economic change. Estimated average annual cost to businesses of disruption due to flooding: £24-50 million by the 2020s, £26-72 million by the 2050s and £34-96 million by the 2080s (current figure: £20 million).
The cost ranking in Table 6.1 is based on the sum of the flood damages and business interruption costs.

100 Business, Industry and Services
6.3.5 A decrease in productivity and revenues due to ICT loss/ disruption (BU5)
As discussed in Section 4.2.5, it is the ICT enabling infrastructure that is vulnerable to the environmental conditions surrounding it. Whilst it has been acknowledged that weather already has the potential to interrupt or reduce the quality of ICT services, there is as yet very little prior work that specifically considers the potential impacts of climate change on ICT33 and its knock-on effects to business. As a consequence, it has not been possible to provide an estimate of the number of days that might be lost due to disruption to ICT owing to a lack of suitable information. It is judged, however, that the risk of major ICT disruption due to climate change is likely to be relatively low for large businesses. The risks for smaller companies (including SMEs) and remote workers may be significant, particularly if they are located in relatively remote areas where they may be dependent on single electricity and telecommunications connections. On the basis of this assessment, an indicative judgement is made that this risk has a low cost ranking across the three time periods (Table 6.1).
6.3.6 Increased exposure for mortgage lenders (BU6)
As presented in Section 4.2.8, this risk concerned with the impact of increasing flood risk on mortgage lending revenues, as a function of market changes and the important issue of asset devaluation in the event of the loss of insurance cover. The number of properties at significant likelihood of flooding (coastal and fluvial) is used as an indicator of the impact of flooding on the availability of insurance, and consequently on the level of mortgage lending exposed. This risk metric is not concerned with a welfare impact, which is presented in the Flood sector report (FL6: Properties at significant risk of flooding). The risk to the Business, Industry and Services sector is the scale of the mortgage fund value of properties at significant likelihood of flooding, where insurance may become unaffordable or unavailable.
The results from Section 4.2.8 for the mortgage fund value at significant likelihood of flooding are provided in Tables A2.16 and A2.17. The mortgage fund value at risk due to insurance becoming unaffordable or unavailable is less that the total value at significant likelihood of flooding; an 85 to 95% reduction in these costs is suggested as a result the following reasons:
The gross value at risk (100%) is a large overestimation. RICS (2009) found that only three years after a flood, in many cases, properties returned to pre-flood values. Temporary devaluation ranged from zero to 30% of market value.
Supply and demand of property (market effects) will have a greater influence than climate change under the existing Statement of Principle.
The RICS study suggested that in general homeowners that experienced difficulties usually obtained better terms by switching insurance company.
The gross value at risk estimates quoted assumes no management by insurance and mortgage lenders other than what is currently applied.
Currently, only in extreme cases are mortgages declined on the basis of flood risk. The RICS study suggested that insurance was currently available in most instances and that flood risk was not a major factor in determining premiums.
33 For the purposes of this report, ICT is taken to mean the whole of the networks, systems and artefacts which enable the transmission, receipt, capture, storage and manipulation of voice and data traffic on and across electronic devices.
Business, Industry and Services 101
It should be highlighted that the values given are total asset values, rather than annual costs, and are therefore not comparable to results presented elsewhere in the risk assessment.
6.3.7 An increase in insurance industry exposure due to flooding (BU7)
As presented in Section 4.2.7, the baseline insurance claim data is taken to be the UK average from between 2001 and 2009 (for commercial and domestic property). The baseline number of properties deemed at significant risk of flooding (over 1 in 75 year flood plain) is also calculated. The change in the number of properties at risk is then determined according to the climate change scenario and the insurance claims are scaled accordingly. Similar to risk BU6, this risk is not concerned with a welfare impact, which is presented in the Flood sector report (FL6: Properties at significant risk of flooding). The risk to the Business, Industry and Services sector is the scale of the payout costs associated with flooding. Therefore, the results from Section 4.2.9 are reproduced in this economic assessment.
The estimates suggest that the combined annual average domestic and commercial claims could increase to: £250-400 million by the 2020s and £0.5-1 billion by the 2080s (current figure: £200 to £300 million).
6.3.8 An expansion of new or existing tourist destinations in the UK (BU8)
The assessment in Section 4.2.10 of the potential impacts of climate change on UK tourism destinations did not provide quantitative estimates. Utilising the results from a previously published study (Hamilton, Tol and Hunt, in Metroeconomica, 2006a), however, the scale of the potential impacts can be gleaned. It is important to note that this study considered the international dimension, through an assessment of the comparative advantage for the UK as a tourist destination against other countries, and domestic and international tourist flows.
The total change in tourism expenditure as a result of climate change across each of the scenarios and time periods is presented in Table A3.4, Table A3.5 and Table A3.6. These results do include the effects of population growth and use UKCIP02 climate scenarios. Nonetheless, they are useful in highlighting that the changes in expenditure attributable to climate change may be significant. There is a strong upward trend in tourism expenditure compared to the baseline, due to rising numbers of international tourists. The figures show the level of total tourism expenditure in each region, with on average 80% being attributable to the increase in domestic tourism (Metroeconomica, 2006a). It is suggested that this opportunity has the potential to have high cost ranking across the three time periods (Table 6.1).
6.3.9 A decrease in output for UK businesses due to an increase in supply chain disruption as a result of extreme events (BU9)
As discussed in Section 4.2.11, supply chain disruption can cause significant harm to business operations. Retail supply chains are complex and dependent on a network of interconnected, yet independent, elements. As a consequence, the risk assessment above judges that it is not possible to develop a clear and direct causal link between climate change and supply chain disruption across the whole of the Business, Industry and Services sector. The risk assessment provides no quantitative assessment of the

102 Business, Industry and Services
potential supply side disruption due to extreme events and therefore it is difficult to attach an economic estimate to such events.
There are a number of studies that derive estimates of the economic impacts of extreme events on UK business. For example, the summer 2007 floods in England were estimated to cause £740 million of damage (Environment Agency, 2010). On an international level, climate change presents a number of risks to the UK food and drink sector, through the sourcing of raw materials and foodstuffs. It is suggested that climate change impacts may affect agricultural yields and their subsequent supply price (Parry et al., 2000). This possibility is explored in Hunt et al., (2009), suggesting that the production and preserving of meat and poultry meat, operation of dairies and cheese making, and the manufacture of prepared feeds for farm animals are the most vulnerable sub-sectors, with the potential to suffer profitability losses of 10-20% in the 2020s and by 20-40% in the 2080s. On the basis of this and similar evidence, an informed judgement is that this impact may justify an indicative medium or high cost ranking, though with a high degree of uncertainty (Table 6.1).
6.3.10 Loss of staff hours due to high internal building temperatures (BU10)
As highlighted in Section 4.2.12, longer, drier summer periods may cause overheating in naturally ventilated buildings and affect the capacity of low energy cooling systems to provide comfortable conditions across all building types. These changes may have knock-on implications for workers’ health and safety, their productivity and the quality of the products they produce. The issue of overheating of buildings and the potential effects on productivity have been considered in the Built Environment sector (BE3) (Capon & Oakley, 2012).
The results presented in Section 4.2.12 suggest that climate change is likely to increase the number of days above the temperature threshold significantly, particularly in the south east of England and London, and especially in the later time periods (2080s). This would lead to potentially high costs, from reduced productivity and lost work time, potentially in the order of hundreds of millions or even billions of pounds annually by later time periods. As a consequence, a high to very high cost ranking is assigned to this risk (Table 6.1).
These figures assume no adaptation, which is unlikely, particularly in the private sector. Faced with rising temperatures, companies are likely to adjust the working environment to avoid falls in productivity and in direct response to occupational health legislation/guidance. The indicative results above may therefore be an over-estimate of the actual costs likely to occur.
There are cross-sectoral linkages with energy cooling costs, both in the current and future stock of office buildings over time (including retrofit and refurbishment cycles). Adding energy cooling costs to these productivity costs will involve double counting, as both scenarios will not occur together.

Business, Industry and Services 103
7. Adaptive Capacity Step 5
7.1 Overview Adaptive capacity considers the ability of a system to design or implement effective adaptation strategies to adjust to information about potential climate change, to moderate potential damages, to take advantage of opportunities, or to cope with the consequences (Ballard, 2009, after IPCC, 2007). This can be considered as having two components; the inherent biological and ecological adaptive capacity of ecosystems and the socio-economic factors determining the ability to implement planned adaptation measures (Lindner et al., 2010). Considering adaptive capacity is essential for adaptation planning and the CCRA project has included work in this area that will contribute to the ongoing Economics of Climate Resilience study and the National Adaptation Programme. The CCRA work on adaptive capacity focuses on structural and organisational adaptive capacity and this chapter provides an overview of the assessment approach. The subsequent sections of this chapter provide an overview of the findings from other work on adaptive capacity in the business, industry and services sector that has been carried out.
The climate change risks for any sector can only be fully understood by taking into account that sector’s level of adaptive capacity. Climate change risks can be reduced or worsened depending on how well we recognise and prepare for them. The consequences of climate change are not limited to its direct impacts. Social and physical infrastructure, the backdrop against which climate change occurs, must also be considered. If such infrastructure is maladapted, the economic, social or environmental cost of climate impacts may be much greater; other consequences could also be considerably more detrimental than they otherwise might have been. Avoiding maladaptation is one outcome of high adaptive capacity; high adaptive capacity lowers the negative consequence of climate impacts. Conversely, low adaptive capacity increases the negative consequences.
7.2 Assessing structural and organisational adaptive capacity
The methods used for assessing structural and organisational adaptive capacity in the CCRA are based on the PACT framework34. The work included a preliminary literature- and expert interview-based assessment of all eleven sectors in the CCRA. This was followed by more detailed analysis for the following sectors:
Business, Industry and Services (focusing on the finance sector)
Transport (focusing on road and rail)
Built Environment (focusing on house building)
Health
Biodiversity and Ecosystem Services
Water 34 PACT was developed in the UK as one of the outcomes of the ESPACE Project (European Spatial Planning: Adapting to Climate Events) http://www.pact.co/home.

104 Business, Industry and Services
Structural adaptive capacity
The extent to which a system is free of structural barriers to change that makes it hard to devise and implement effective adaptation strategies to prepare for future impacts. This covers issues such as:
Decision timescales: This considers the lifetimes of decisions, from their conception to the point when their effects are no longer felt. The longer this period is, the greater the uncertainty as to the effects of climate change impacts. Cost-effective adaptation becomes harder. Potential climate impacts also become more extreme over longer timescales. This means that a greater scale of adaptation may need to be considered, and that the barriers to adaptation resulting from 'lock-in' to maladapted processes become more pronounced (Stafford-Smith et al., 2011). Adaptive capacity is therefore lower, and maladaptation more likely, when long-lasting decisions are taken.
Activity levels: This considers what opportunities are there for adaptation, and on what scale. The frequency with which assets are replaced or created determines how many opportunities there will be to take action which increases adaptive capacity.35 In addition, when a lot of asset replacement and/or new investment is expected, there will be more chances to learn from experience, which increases adaptive capacity.
Maladaptation: This evaluates the effect of decisions already made on adaptive capacity. Long-term previous decisions which have reduced adaptive capacity are often difficult or expensive to reverse. Such decisions were made either before climate change was recognised as an issue, or more recently as a result of poor organisational capacity. Such maladaptation makes implementing effective strategies much harder.
Sector (or industry) complexity: This refers to the level of interaction between stakeholders within an industry, or with outside industries and groups, that is required to facilitate effective decision-making. Complexity is higher (and adaptive capacity lower) when many stakeholders are involved in decision-making and when their agendas (e.g. their financial interests) differ substantially.
Organisational adaptive capacity
Organisational adaptive capacity is the extent to which human capacity has developed to enable organisations to devise and implement effective adaptation strategies. Effective adaptation requires decision-making that takes account of an uncertain future and avoids locking-out future options that might be more cost-effective if climate impacts become more severe, or arrive more rapidly, than expected. The PACT framework used to assess this recognises different levels of adaptation. This framework is arranged in a hierarchy of ‘Response Levels’ (‘RLs’), as set out below, of increasing capacity36. These levels do not supersede one another; instead, each one builds on the experiences and practices built up in the previous response level. Organisations may need to be active on all levels for an effective adaptation programme. An RL4 organisation focused on breakthrough projects still needs to be stakeholder-responsive, for example.
RL1: Core Business Focused: At this level, organisations see no benefit from adapting; if change is required of them, it should both be very
35This differs from ‘Decision timescales’ because investment in a sector is not continuous but varies over time, with periods of high investment being followed by periods of little or no investment. 36 The PACT framework contains six response levels: those cited are the most relevant to the adaptation field.

Business, Industry and Services 105
straightforward to implement and also incentivised, e.g. through ‘carrots’ and ‘sticks’.
RL2: Stakeholder Responsive: At early stages of adaptation, organisations lack basic skills, information, processes and also skilled people; they need very clear advice and information plus regulations that are straightforward enough to help them get started.
RL3: Efficient Management: As organisations begin to professionalise adaptation, they become more self-directing, able to handle short term impacts up to 10 years (Stafford-Smith et al., 2011). They need professional networks, best practice guidelines, management standards, etc.
RL4: Breakthrough projects: When impacts beyond 10 years need to be considered, organisations may need to consider more radical adaptation options. As well as high quality support from scientists, they may need support with the costs of innovation.
RL5: Strategic Resilience: Adapting a whole region or industry for long-term climate impacts of 30 years or more requires lead organisations to develop very advanced capacity that is able to co-ordinate and support action by a wide range of actors over programmes that are likely to last for many years.
7.3 Adaptive Capacity in the Business, Industry and Services Sector
A review carried out on responses to the Carbon Disclosure Project’s 2008 survey (Acclimatise, 2009c) compared performance on adaptation among FTSE 350 companies. This gave some information on the extent to which business organisations have begun the process of adaptation. The focus was on early stage adaptation activities rather than on the much more sophisticated adaptation activities that would be required, for instance at a period of major investment in long-lasting assets. This means that low scores indicate with relatively high confidence that adaptation activity is absent, but that relatively high scores do not necessarily indicate that adaptation activities are sufficient, or even necessarily very far developed. The results indicated:
A potentially low average take up of adaptation actions across the FTSE350 companies reviewed.
Sectors that scored relatively highly were water, chemicals, pharmaceuticals, energy utilities, insurance and extractive industries. However, for the reasons given above, it cannot be assumed that these industries were then taking actions at a sufficiently advanced level to meet the challenges that they are facing.
Sectors that scored relatively lowly were healthcare equipment and services (but note that this does not include NHS services), IT, aerospace and defence, automobiles and components, commercial services and supplies, and energy. For the reasons given above, this is likely to indicate that these industries were not then taking much if any action on adaptation.
It is important to note that the impact of adaptation decisions made by one organisation, or an industry as a whole, can have a major beneficial or detrimental effect on the resilience of other organisations or sectors. As such, decision-making needs to be cognisant of potential knock-on effects.

106 Business, Industry and Services
Innovation is also an important attribute in the adaptive capacity of UK businesses (Acclimatise, 2009d). Those UK companies that are, by their very nature innovators (both in terms of technology and process), are likely to be some of the most equipped to deal with the risks, and exploit the opportunities, presented by climate change in a global market. They are more likely to be skilled in conceptualising potential risks and opportunities, and taking the advantages that may become available.
There are also a number of potential opportunities that may result as a consequence of climate change. These are centred on: (i) exploiting market shifts, through re-positioning and the development of new products and services; (ii) improving business processes; and (iii) showing business leadership. These are discussed individually below. For the UK, these opportunities may result from potentially having a global advantage to respond to risks due to higher awareness of risks and leading science/regulatory frameworks. As such, the UK is in a prime position to help others adapt across the world.
As acknowledged in the International Dimensions of Climate Change report (Foresight, 2011a), business and financial services are key sectors of the UK economy, and opportunities will arise in areas of UK strength: science and engineering, in insurance and in climate forecasting, and where there is a need to reduce emissions or adapt to climate change. Investment opportunities include a wide range of green technologies, particularly in the energy sector, such as wind power, and carbon capture and storage (Foresight, 2011a).
The most forward-thinking companies regard climate change as an opportunity re-assess business processes and risk management procedures. For example, some manufacturing companies are using the argument of climate change to get closer to suppliers, to reduce both costs and carbon in their supply chain. They are actively pursuing supplier chain management, whereby companies develop formalised and robust ways of managing, monitoring and developing supplier performance (EEF, 2009).
There will also be opportunities for the businesses to influence on the global stage, by playing a leading role as others grapple with the challenges of climate change. There are business incentives for doing this; leading companies may directly reduce their costs and also gain competitive advantage of the market based on their “green” credentials. However, more importantly, their actions may also contribute to the sustainable development of local communities and societies in adapting to the impacts of climate change.

Business, Industry and Services 107
8. Conclusions
8.1 Key findings Based on the analysis of key risks to the Business, Industry and Services sector, this report concludes the sector is highly vulnerable to a changing climate, both extreme (acute) events and incremental (chronic) climate change. Climate change impacts are likely to be felt across the spectrum of sub-sectors and from SMEs to large multi-national corporations.
The key climate change consequences identified for this sector relate to the potential gains or losses in revenue, associated with the adverse and beneficial effects on fixed assets, workforce, procurement (raw materials, supply chains and logistics), operations (supply of services, customer demands and regulatory requirements) and environmental and social performance.
Key climatic impacts identified include flooding and coastal erosion, which would have negative effects on tourist assets (both natural and built) as well as industrial facilities. Flooding also represents an important and ever present issue for insurance and mortgage providers, with potential increased exposure to both lender and borrower in the future. Increased levels of flooding, as well as more frequent extreme weather events, could also have the potential to increase disruption to UK businesses’ supply chains and ICT networks. Further impacts identified in this report include a potential decrease in water availability for industrial and other commercial purposes. Warmer temperatures may also increase the numbers of staff hours lost due to a likely increase in high internal building temperatures.
In terms of major opportunities, warmer temperatures are likely to increase the attractiveness of the UK as a tourism destination. This will increase revenues and extend the tourist season providing a substantial opportunity within this sector, but only if the sector is prepared this increasing demand and the UK has the necessary infrastructure and resources.
8.2 Limitations of current methodology
This risk assessment has been hampered by a lack of publicly available quantitative data. Information that is currently collected is often considered commercially sensitive and remains undisclosed for confidentiality purposes. There are limited regulatory requirements on the sector to report the current and future projected impacts of climate change or its proposals for adapting to climate change, other than for those organisations that will report under the Adaptation Reporting Power37. Furthermore, the consequences for business are usually economic, making the links between climate impacts and consequences complex. Due to these factors, the development of useful risk metrics was challenging, and not possible in some cases.
This lack of information is recognised by others; a recent report by the Adaptation Sub Committee (ASC, 2010) stated that ‘in some cases, inadequate or insufficiently accurate climate risk information is preventing organisations from building a business case for adaptation, for example on surface water flooding risks’. While the authors do not see this as a reason for delaying action, it is important to support the development of better climate information.
37 For example, utilities such as water and energy companies, transport organisations such as airport operators, harbour authorities, etc. For the full list see: http://www.defra.gov.uk/environment/climate/documents/rp-list.pdf

108 Business, Industry and Services
Of particular concern is the lack of information in relation to how well climate risks are being considered by fund managers, indeed the evidence suggests the primary climate focus to date has been on carbon related risk. As a global market with direct consequence for the UK economy and investors, the impacts of climate change could be significant. Also within the financial sector, uncertainty in relation to flood risk to homes, provision of insurance cover and hence mortgages presents a challenge, and indications are that costs or loss of asset value could be significant.
A further limitation of the current CCRA methodology for the Business, Industry and Services sector is the restricted geographical focus of the assessment, with emphasis placed predominantly on the UK. The notion of a UK ‘only’ CCRA for business is not representative of the global market in which the UK operates. The Business, Industry and Services sector is influenced to a very large degree by international issues including investments, supply of materials and international markets. Many of these are influenced by present-day climate and future climate change to some degree. This is a similar conclusion to that drawn by the recent Foresight (2011a) report:
“The consequences for the UK of climate change occurring in other parts of the world could be as important as climate change directly affecting these shores... To address the risks to the UK from climate change impacts overseas, it is crucial that government departments work across existing boundaries between domestic and international policy”.
The Foresight (2011a) study on international dimensions of climate change was carried out as part of the CCRA. There is a lack of evidence for assessing climate change risks at an international level, so the Foresight (2011a) report is at a higher level than this CCRA report for the UK.
8.3 Challenges to overcome The report has identified a number of important challenges the Business, Industry and Services sector and Government needs to overcome. These are broadly aligned with a recent publication from the CBI (2010), which identifies the following challenges for business and industry:
The challenge of mainstreaming climate change considerations into standard business practices.
Meeting adaptation goals whilst maintaining other corporate goals with respect to sustainability.
There will be an increasing expectation for corporate reporting to disclose material climate-related risks.
Some businesses will be challenged to ‘go it alone’ and the sharing of non-commercially sensitive climate change adaptation information within or across should be encouraged.
Challenges to business with cover six key areas – supply chains, assets, operations, markets, regulatory compliance and business reputation.
To overcome these challenges and provide a robust link between the physical impacts of climate change and the risks facing the Business, Industry and Services sector, numerous actors will need to be involved, including climate scientists, risk analysts, the private sector and Government. Uncertainty can no longer be used as an excuse for inaction and a co-ordinated and collaborative approach is urgently needed.

Business, Industry and Services 109
9. References CCRA Sector Reports
(all reports form part of the UK 2012 Climate Change Risk Assessment, Defra, London)
McColl, L., Angelini, T. and Betts, R. (2012)
CCRA Risk Assessment for the Energy Sector
Moffat, A.J., Morison, J.I.L., Nicoll, B., and Bain, V. (2012)
CCRA Risk Assessment for the Forestry Sector
Brown, I., Ridder, B., Alumbaugh, P., Barnett, C., Brooks, A., Duffy, L., Webbon, C., Nash, E., Townend, I., Black, H. and Hough, R. (2012)
CCRA Risk Assessment for the Biodiversity and Ecosystem Services Sector
Hames D and Vardoulakis S (2012) CCRA Risk Assessment for the Health Sector
Knox, J.W., Hurford, A., Hargreaves, L. and Wall, E. (2012)
CCRA Risk Assessment for the Agriculture Sector
Capon, R. and Oakley, G. (2012) CCRA Risk Assessment for the Built Environment Sector
Ramsbottom, D., Sayers, P. and Panzeri, M. (2012)
CCRA Risk Assessment for the Floods and Coastal Erosion Sector
Rance, J., Wade, S.D., Hurford, A.P., Bottius, E. and Reynard, N.S. (2012)
CCRA Risk Assessment for the Water Sector
Thornes, J., Rennie, M., Marsden, H. and Chapman, L. (2012)
CCRA Risk Assessment for the Transport Sector
Pinnegar, J., Watt, T., and Kennedy, K. (2012)
CCRA Risk Assessment for the Marine and Fisheries Sector
Other references
Acclimatise (2006). The adaptation tipping point: are UK businesses climate proof? Acclimatise and UKCIP: Oxford.
Acclimatise (2009a). Building business resilience to inevitable climate change. Carbon Disclosure Project Report 2008. Global mining. Oxford.
Acclimatise (2009b). Building business resilience to inevitable climate change. Carbon Disclosure Project Report 2008. Global oil and gas. Oxford.
Acclimatise, (2009c). Building Business Resilience to Inevitable Climate Change. Carbon Disclosure Project Report. FTSE 350. Oxford.
Acclimatise (2009d). Managing the Unavoidable: investment implications of a changing climate.
Acclimatise (2009e). Briefing report for Henderson Global Investors, Insight Investment, Railpen Investments and Universities Superannuation Scheme. UK energy generation. Understanding the investment implications of adapting to climate change.

110 Business, Industry and Services
Acclimatise (2009f). Briefing report for Henderson Global Investors, Insight Investment, Railpen Investments and Universities Superannuation Scheme. UK water sector. Understanding the investment implications of adapting to climate change.
Acclimatise (2009g). Briefing report for Henderson Global Investors, Insight Investment, Railpen Investments and Universities Superannuation Scheme. Oil and gas. Understanding the investment implications of adapting to climate change.
Acclimatise (2009h). Briefing report for Henderson Global Investors, Insight Investment, Railpen Investments and Universities Superannuation Scheme. UK commercial property. Understanding the investment implications of adapting to climate change.
Acclimatise (2010a). UK CCRA, Business and Industry Services Sector. Financial Services and Tourism. Phase 1 Report.
Acclimatise (2010b). UK CCRA, Business and Industry Services Sector. Food and beverages. Phase 1 Report.
Acclimatise (2010c). UK CCRA, Business and Industry Services Sector. Primary extractive industries and chemical manufacturing. Phase 1 Report.
AEA (2010). Adapting the ICT Sector to the Impacts of Climate Change, Final Report, AEA Group, May 2010.
Agnew, M.D., and Palutikof, J. (2006). Impacts of short-term climate variability in the UK on demand for domestic and international tourism. Climate Research 31: 109–120.
Amelung, B. and Viner, D. (2006). Mediterranean Tourism: Exploring the Future with the Tourism.Climatic Index, Journal of Sustainable Tourism, 14: 4, 349-366
Amelung, B., Nicholls, S., and Viner, D. (2007). Implications of global climate change for tourism flows and seasonality. Journal of Travel Research 45(3): 285–296.
Amelung, B. and Moreno, A. (2009). Tourism Assessment. In Climate change impacts in Europe. Final report of the PESETA research project. Edited by Ciscar, J, -C.
Armstrong, B., Chalabi Z., Fenn B., Hajat S., Kovats S., Milojevic A. and Wilkinson P. (2010). Association of mortality with high temperatures in a temperate climate: England and Wales. Journal of Epidemiology Community Health.
ASC (2010). How well prepared is the UK for climate change? 1st Progress Report 2010, Adaptation Sub-Committee, September 2010
Association of British Insurers (ABI) (2007). Summer floods 2007: learning the lesson. November.
Association of British Insurers (ABI) (2008). Revised Statement Of Principles On The Provision Of Flood Insurance.
Association of British Insurers (ABI) (2009) The Financial Risks of Climate Change. Examining the financial implications of climate change using climate models and insurance catastrophe risk models. Research Paper No 19. Report by AIR Worldwide Corp. and the Met Office for the Association of British Insurers (ABI).
Association of British Insurers (ABI) (2010). Data Bulletin.
Ballard, D.I. (2009). Working Paper on Adaptive Capacity. Working Paper 1 for the UK’s Climate Change Risk Assessment 2012 and Economic Analysis. Alexander Ballard Ltd for HR Wallingford Ltd.
Bank of England (2010). Consolidated worldwide external claims of UK-owned monetary financial institutions. Bank of England Statistical Release. Available at

Business, Industry and Services 111
http://www.bankofengland.co.uk/statistics/cwc/2010/sep/cwcsr.pdf (Accessed 11/01/2011).
Barrick Gold (2010). Website, http://www.barrick.com/GlobalOperations/SouthAmerica/PascuaLamaProject/default.aspx (Accessed 10/01/2011)
Bein, D. Bein, W. and Phoba, S. (2010). Efficient Data Centers, Cloud Computing in the Future of Distributed Computing. IEEE Computer Society p70-75.
BIS (2011). Department for Business, Innovation and Skills website: http://www.bis.gov.uk/about (Accessed 10/12/2010)
Boyd, R. and Hunt, A. (2004). Costing the impacts of climate change in the UK: overview of guidelines, UKCIP Technical Report. UKCIP, Oxford, July 2004
Brenning, A. (2008). The impact of mining on rock glaciers: examples from Central Chile. In: Orlove, B. S., Wiegandt, E., and Luckman, B. (eds.) Darkening peaks: glacier retreat, science, and society. University of California Press, Berkeley. Chapter 14, 196-205pp
Bruci, E. (2008). Climate variability and trends in Albania. IWE, Tirana Polytechnic University, Tirana, Albania.
Cabinet Office (2010). http://www.cabinetoffice.gov.uk/media/299511/telecommunications_sector_intro.pdf (Accessed 10/12/ 2010)
Carroll, A.L., Régnière, J., Logan, J.A., Taylor, S.W., Bentz, B. and Powell, J.A. (2006). Impacts of Climate Change on Range Expansion by the Mountain Pine Beetle. Mountain Pine Beetle Initiative Working Paper, Natural Resources Canada, Canadian Forest Service, Pacific Forestry Centre, Victoria, BC.
Carter, L. Burnett, D. and Drew, S. (2009). Submarine Cables and Oceans – Connecting the World. UNEP-WCMC.
Cazenave, A. and Llovel, W. (2010). Contemporary Sea Level Rise. Annual Review of Marince Science, 2, 145-173.
CBI (2010). Whatever the weather: managing the risks from a changing climate, The CBI climate change board, Confederation of British Industry, September 2010
CCRA (2012). CCRA Evidence Report. Defra, London.
CEBR (2003). Press release. See also reference to NIOSH study by same source in Telegraph, July 2006, http://www.telegraph.co.uk/finance/2943770/Heatwave-costs-a-cool-211m-a-day.html (Accessed 20/01/2011)
Ceres (2006). Corporate Governance and Climate Change: Making the Connection.
Chartered Management Institute (2008). Business Continuity Management 2008 https://www.managers.org.uk/sites/default/files/user35/CMI_-_Business_Continuity_Management_March_2008_-_Full_Report.pdf
Church, J. A., and White, N. J. (2006). A 20th century acceleration in global sea-level rise, Geophysical Research Letters, 33, L01602, doi:10.1029/2005GL024826
CIBSE (2006). Guide A: Environmental Design
Comiso, J.C., Parkinson, C.L., Gernsten L., and Stock, L. (2008). Accelerated decline in the Arctic sea ice cover. Geophysical Research Letters, 35, L01703.
Communities and Local Government (2010). Housing and Planning Statistics 2010.

112 Business, Industry and Services
COPA-COGECA (European farmers and European agri-cooperatives) (2004). Assessment of the impact of the heat wave and drought of the summer 2003 on agriculture and forestry, available at: http://www.meteo.uni-koeln.de/content/forschung/klimadiagnose/summerheat2003/pocc_03_78i4_1e.pdf (Accessed 20/01/2010).
DCMS (2010a). Sector Briefing Note. Tourism.
DCMS (2010b). Climate Change Impacts Study. Phase 1 Summary Report.
DECC (2010). http://www.decc.gov.uk/en/content/cms/what_we_do/uk_supply/energy_mix/coal/industry/industry.aspx (Accessed 19/07/2010)
Defra. (2000) Guidelines for Environmental Risk Assessment and Management, Department for Environment, Food and Rural Affairs, UK. At: http://www.defra.gov.uk/environment/quality/risk/eramguide/index.htm
Defra (2006). Flood and Coastal Defence Appraisal Guidance, FCDPAG3 Economic Appraisal, Supplementary Note to Operating Authorities – Climate Change Impacts http://www.defra.gov.uk/environment/flooding/documents/policy/guidance/fcdpag/fcd3climate.pdf
Defra (2009). UK Climate Projections. At: http://ukclimateprojections.defra.gov.uk/
Defra (2009). Food Statistics Pocketbook, ONS statistics
Defra (2010). ‘Food 2030’. January 2010.
Defra (2010a). Method for undertaking the CCRA, Report No: D.1.3.3, UK 2012 Climate Change Risk Assessment, Defra, London undertaken by HR Wallingford Ltd, The Met Office, Alexander Ballard Ltd, Collingwood Environmental Planning, Entec Ltd UK, Paul Watkiss Associates, Metroeconomica.
Defra (2010b). Method for undertaking the CCRA Part II – Detailed Method for Stage 3: Assess Risk, UK 2012 Climate Change Risk Assessment, Defra, London, Report No. D2.1.1 by HR Wallingford Ltd, The Met Office, Alexander Ballard Ltd, Collingwood Environmental Planning, Entec Ltd UK, Paul Watkiss Associates, Metroeconomica.
Defra (2010c). Review of the future resource risks faced by UK business and an assessment of future viability – SCP0905/EVO458, Defra, London undertaken by AEA Technology Plc, Metroeconomica Ltd, C-Tech Innovation Limited.
Deloitte and Oxford Economics (2010). The Economic Contribution of the Visitor Economy – UK and the nations. http://www.visitbritain.org/Images/Economic%20case%20for%20the%20Visitor%20Economy%20-%20Phase%202%20-%2026%20July%202010%20-%20FINAL_tcm139-192073.pdf (Access 20/01/2011)
Department for Business, Innovation and Skills (2010). BIS Climate Change Adaptation Plan.
Deutsche Bank (2007). Climate Change and Sectors: Some like it hot! Deutsche Bank Research, July 5, 2007
Dowden, M. (2005). “The Forecast Predicts Legal Liabilities.” Practice and Law. Estates Gazette. 12 November 2005.
Dowden, M., and Marks, A.C. (2005). “Come Rain or Shine.” Practice and Law. Estates Gazette. 16 July 2005.
Business, Industry and Services 113
EC-RRG. Telecommunications Networks – a vital part of the Critical National Infrastructure. Version 1.1
EEF (2009). Seizing the initiative. Climate change survey 2009.
Environment Agency (2009). Flooding in England: A National Assessment of Flood Risk.
Environment Agency (2010). The costs of the summer 2007 floods in England. Flood and Coastal Erosion Risk Management Research and Development Programme. Project SC070039/R1.
European Commission (2009). “Adapting to Climate Change: Towards a European Framework for Action.” White Paper COM(2009)147/4. Brussels: CEC.
European Commission (2010). Website: http://ec.europa.eu/environment/consultations/eia.htm (Accessed 14/01/2010).
FairPensions (2009). Preparing for the Storm? UK Fund Managers and the Risks & Opportunities of Climate Change.
Financial Services Authority (2010). Market-wide Exercise 2009 Report.
Foresight (2004). Future Flooding report
Foresight (2011a). International Dimensions of Climate Change. The Government Office for Science. London.
Foresight (2011b). The Future of Food and Farming. Final Project Report. The Government Office for Science, London.
Freitas de, C. R., Scott, D. and McBoyle, G. (2008). ‘A second generation climate index for tourism (CIT): Specification and verification’. International Journal of Biometeorology 52: 399–407.
Friedlingstein, P., Houghten, R.A., Marland, G., Hacklar, J., Boden, T.A., Conway, T.J., Canadell, J.G., Raupach, M.R., Ciais, P. and Le Quéré, C. (2010). Update on CO2
emissions. Nature Geoscience 3: 811–812.
Frost, D., Harris, D., Garod, B., Lindley, S., Cavan, G., Goodess, C., Agnew, M. (2010). The Impact of the Climate change on the Welsh Visitor Economy, Visit Wales, Welsh Assembly Government
Hamilton, J.M., Maddison, D.J., and Tol, R.S.J. (2005). Climate change and international tourism: a simulation study. Global Environmental Change 15 (3): 253–266.
Hamilton, J.M., and Tol, R.S.J. (2007). The impact of climate change on tourism in Germany, the UK and Ireland: a simulation study. Regional Environmental Change 7: 161–172.
Hancock, P.A. (1981). Heat stress impairment of mental performance: A revision of tolerance limits, Aviat.Space Environ.Med., 52(3), 177-180.
HM Government, and Association of British Insurers (2008). ABI / Government Statement On Flooding And Insurance For England.
HM Treasury (2003). The Treasury Green Book – Appraisal and Evaluation in Central Government. London.
HM Treasury (2009). UK international financial services – the future. A report from UK based financial services to the Government. Available at
114 Business, Industry and Services
http://www.thehedgefundjournal.com/research/treasury/uk-internationalfinancialservices070509.pdf (Accessed 11/01/2011).
HM Treasury Department for Business Innovation and Skills (BIS) (2010). Financing a private sector recovery. Presented to Parliament by the Secretary of State for Business, Innovation and Skills by Command of Her Majesty. Available at http://www.bis.gov.uk/assets/biscore/corporate/docs/f/10-1081-financing-private-sector-recovery.pdf (Accessed 11/01/2011).
HM Treasury, Department for Business Innovation and Skills (BIS) (2011) The Plan For Growth, Crown Publishing
HM Treasury (2011). Financial Services Policy Agenda, Available at http://www.hm-treasury.gov.uk/fin_policy_agenda_index.htm. (Accessed 20/07/2011)
HM Treasury (2011). Pers. comm. July 2011.
HR Wallingford (2011). Systematic Mapping, Project deliverable number D2.7.3, Report for the UK 2012 Climate Change Risk Assessment, Defra, London, undertaken by HR Wallingford Ltd, The Met Office, Alexander Ballard Ltd, Collingwood Environmental Planning, Entec Ltd UK, Paul Watkiss Associates, Metroeconomica
Hunt, A. Watkiss P. and Horrocks, L. (2009) International Impacts of Climate Change on the UK. Report for Defra, London.
IMF (2010). UK Trade Performance: Patterns in UK and Global Trade Growth, ONS data: World Economic Outlook database.
IPCC (2007). Climate Change 2007: Synthesis Report. Contribution of Working Groups I, II and III to the Fourth Assessment Report of the Intergovernmental Panel on Climate Change
ISCCC (2009). International Scientific Congress Climate Change: Global Risks, Challenges & Decisions – Synthesis Report. ISCCC, Copenhagen.
Jenkins, G.J., Perry, M.C., and Prior, M.J.O. (2007). The Climate of the United Kingdom and Recent Trends. Met Office Hadley Centre, UK.
Kandel, R.S. (2009). Turning the tide on climate change. pp99. http://www.cefic.org/files/publications/Book-climate-change/ (Accessed 22/7/2010)
Kronos (2007). Sunny skies and High Temperatures Have Employees Suffering From Seasonal Absence Syndrome, www.kronos.com
KPMG (2008). Climate Changes Your Business. KPMG‘s review of the business risks and economic impacts at sector level.
Lehman Brothers (2007). The Business of Climate Change: Challenges and Opportunities.
Le Quéré, C., Raupach, M.R., Canadell, J.G., and Marland, G.M. (2009). Trends in the sources and sinks of carbon dioxide. Nature Geosciences, 2, 831-836.
Lewis,K., Witham,C. and McCarthy, R. (2010). Physical resources and commodities and climate change. Report prepared by the Met Office Hadley Centre on behalf of the Foresight International Dimensions of Climate Change programme.
McEvoy, D., Handley, J.F., Cavan, G., Aylen, J., Lindley, S., McMorrow, J. and Glynn, S. (2006). Climate Change and the Visitor Economy: the challenges and opportunities for England’s Northwest, Sustainability Northwest (Manchester) and UKCIP (Oxford).

Business, Industry and Services 115
Mckie, R. (2006) “God’s Railway’ under threat”. Guardian.com http://www.guardian.co.uk/environment/2006/jun/04/science. transportintheuk (accessed June 4 2010)
Mieczkowski, Z. (1985). The tourism climatic index: a method of evaluating world climates for tourism. Can Geogr 29(3): 220-233
Mines and Communities (2010). Website, http://www.minesandcommunities.org/ (Accessed 20/1/2011)
Met Office (2007). http://www.metoffice.gov.uk/climate/uk/interesting/june2007/index.html (Accessed 18/2/2010)
Metroeconomica (2006a). Quantify the Cost of Impacts and Adaptation. Climate Change Impacts and Adaptation: Cross-Regional Research Programme, (Task 2 Report on the Costs of the Hot Summer of 2003) published by Defra.
Metroeconomica (2006b). Climate Change Impacts and Adaptation: Cross-Regional Research Programme Project E. Published by Defra, London.
Moreno, A. and Amelung, B. (2009). Climate change and tourist comfort on Europe's beaches in Summer: a reassessment. Coastal Management 37(6): 550-568.
Morrison, J., Morikawa, M. Murphy, M. and Schulte, P. (2009). Water Scarcity and Climate Change: Growing Risks for Businesses and Investors. Boston: Ceres; Oakland, Calif.: Pacific Institute.
Multi-coloured Manual, Middlesex University Flood Hazards Research Centre, (2005 and updated 2010).
Munich Re (2010). http://www.munichre.com/en/media_relations/press_releases/2010/2010_09_27_press_release.aspx (Accessed 10 December 2010)
New York Times (2011). Floods Take Toll on Australia Economy. Published 4th January, online.
NIOSH (1986). Criteria for a Recommended Standard: Occupational Exposure to Hot Environments (Revised Criteria 1986), The National Institute for Occupational Safety and Health (NIOSH), USA, Report No: Publication No. 86-113, 1-151.
Nostromo Research (2009). London calling on today’s state of corporate mine play. http://www.minesandcommunities.org/article.php?a=9202 (accessed 19/07/2010)
ONS (2009). Foreign Direct Investment 2007 Report, published February 2009.
Parsons, K. (2009). Maintaining health, comfort and productivity in heat waves, Global Health Action, Vol. 2, pp. 2057.
Pitt, M. (2008). Learning Lessons from the 2007 Floods. Cabinet Office, London.
Pricewaterhouse Coopers (2007). ‘Too Much Regulation Tops Insurance Risks.’ Centre for the Study of Financial Information and PricewaterhouseCoopers. News Release, May 25.
PriceWaterhouse Coopers (2008). From vulnerable to valuable: how integrity can transform a supply chain. Achieving operational excellence series.
Rennie, A.F. and Hansom, J.D., (2011). Sea level trend reversal: land uplift outpaced by sea level rise on Scotaland's coast, Geomorphology, 125(1), 193-202.
116 Business, Industry and Services
RICS (2009). Findings in Built and Rural Environments. Fibreseries. Floodings and Property Prices. http://www.rics.org/site/download_feed.aspx?fileID=4025&fileExtension=PDF (Accessed 20/1/2011)
RSSB (Rail Standards Safety Board) (2008). ‘Impacts of Climate Change on Coastal Rail Infrastructure’. RSSB Research Brief. June 2008
Scott, D., McBoyle, G. and Schwartzentruber, M. (2004). Climate change and the distribution of climatic resources for tourism in North America’. Climate Research 27(2): 105-117.
Shennan I. and Horton, B. (2002). Holocene land- and sea-level changes in Great Britain, J Quaternary Science, 17(5-6), 511-526.
Simpson, M.C., Gössling, S., Scott, D., Hall, C.M. and Gladin, E. (2008). Climate Change Adaptation and Mitigation in the Tourism Sector: Frameworks, Tools and Practices. UNEP, University of Oxford, UNWTO, WMO: Paris, France.
South West Tourism (2007). Value of Tourism. South West Tourism: Exeter
South West Tourism (2010). Cost-a South West: What could tomorrow’s weather and climate look like for tourism in the South West of England? UK Climate Projections National Case Study.
Stafford-Smith, M., Horrocks, L., Harvey, A. and Hamilton, C. (2011): Rethinking Adaptation for a 4°C World. Philosophical Transactions Royal Society, 369, 196-216.
Stenek, V., Amado, J.-C., and Connell, R. (2010). Climate Risk and Financial Institutions. International Finance Corporation.
Stern, N. (2006). The Stern Review on the Economics of Climate Change, Cambridge University Press
Stott, P. A., Stone, D.A. and Allen, M.R. (2004). Human contribution to the European heatwave of 2003. Nature, 432, 610-614. Corrigem. Nature, 436, 1200.
Taylor, J.A., Murdock, A.P., Pontee, N.I. (2004). A macroscale analysis of coastal steepening around the coast of England and Wales, The Geographical Journal, 170(3), 179-188.
Taylor, T. and Ortiz, R.A. (2009). Impacts of climate change on domestic tourism in the UK: a panel data estimation. Tourism Economics 15 (4): 803–812.
Telegraph (2008). High commodity prices are hard to swallow. 9 March 2008. Available online at http://www.telegraph.co.uk/finance/markets/2785737/High-commodity-prices-are-hard-to-swallow.html (Accessed 13/01/11).
The Cabinet Office (2008). Food Matters: Towards a Strategy for the 21st Century
Townend, I.H. (1994). Variation in design conditions in response to sea-level rise, Proc.Instn Civ.Engrs., Marit.& Energy, 106(Sept), 205-213.
Turner, A., Haldane, A. and Woolley, P. (2010). The Future of Finance: The LSE Report. London School of Economics and Political Science.
UKCIP (2003). Climate adaptation: Risk, uncertainty and decision making. Willows, R. and Connell, R., UK Climate Impacts Programme, Oxford, UK.
UK Trade & Investment (2010). A Menu for the World – An Investor’s Guide to the UK Food and Drink Industry

Business, Industry and Services 117
UN (2009). Multi-year Expert Meeting on Transport and Trade Facilitation – Maritime Transport and the Climate Change Challenge. Geneva, UN.
UNEP FI (2002). Climate Change & the Financial Services Industry. Module 1 – Threats and Opportunities. http://www.unepfi.org/fileadmin/documents/cc_fin_serv_ind_module1_2002.pdf
UNEP FI Climate Change Working Group (CCWG) (2006). Adaptation and Vulnerability to Climate Change: The Role of the Finance Sector. CEO Briefing. http://www.unepfi.org/fileadmin/documents/CEO_briefing_adaptation_vulnerability_2006.pdf (Accessed 20/1/2011)
UNEP FI, Asset Management Working Group (2005). A legal framework for the integration of environmental, social and governance issues into institutional investment. Geneva: UNEPFI.
UNEP FI, Asset Management Working Group (2009). Fiduciary Responsibility: Legal and Practical Aspects of Integrating Environmental, Social and Governance Issues Into Institutional Investment. Geneva: UNEPFI.
UNEP FI and Sustainable Business Institute (2011). Advancing adaptation through climate information services. Results of a global survey on the information requirements of the financial sector.
Viner, D. (2006). Editorial: Tourism and its Interactions with Climate Change, Journal of Sustainable Tourism, 14: 4, 317-322
Weisse, R., von Storch, H., Callies, U., Chrastansky, A., Feser, F., Grabemann, I., Guenther, H., Winterfeldt, J., Woth, K., Pluess, A., Stoye, T., Tellkamp, J. (2009). Regional Meteorological-Marine Reanalyses and Climate Change Projections, Bull.Amer.Meteor.Soc., 90(6), 849-860.
Wight, M., and Laffan, J. (2008). Rising prices for agricultural commodities. Australian Department of Foreign Affairs and Trade. Available at: http://www.dfat.gov.au/PUBLICATIONS/stats-pubs/rising_prices_for_agricultural_commodities.pdf (Accessed 05/02/2010).
WISE (Weather Impacts on Natural, Social and Economic Systems) (1999). Final Report Contract ENV4-CT97-0448. University of East Anglia, Norwich, UK.
Woolf , D.K., Coll, J., Gibb, S., Challenor, P.G. (2006). Sensitivity of ferry services to the Western Isles of Scotland to changes in wave climate. Proceedings of OMAE04 23rd International Conference on Offshore Mechanics and Arctic Engineering, June 20-25, 2004, Vancouver, British Columbia, Canada.
World Bank (2008). Project Appraisal Document on a Proposed Credit in the amount of SDR 21.7 million (US$35.3 million equivalent) to Albania for a Dam Safety Project (Phase 5) in support of the South East Europe APL Program. World Bank.
World Bank (2010b). Climate Vulnerability Assessments: An Assessment of Climate Change Vulnerability, Risk, and Adaptation in Albania’s Energy Sector. Energy Sector Management Assistance Programme. Available at http://siteresources.worldbank.org/INTECA/Resources/FINAL_CESVAP_AlbaniaClimateVulnerabilityAssmntEnglish.pdf (Accessed 14/01/2011)

118 Business, Industry and Services
Data sets:
Association of British Insurers, Property Claims Data 2010 (Qtr 2)
Chartered Management Institute (2008) for average length of disruption to businesses from flooding https://www.managers.org.uk/sites/default/files/user35/CMI_-_Business_Continuity_Management_March_2008_-_Full_Report.pdf
English Heritage’s Listed Buildings database (2009) taken from DCMS (2010b)
Enjoy England monthly room occupancy data: http://www.enjoyengland.com/corporate/corporate-information/research-and-insights/statistics/UKOS/UKOS.aspx
Environment Agency 2010, Water Resources GIS (WRGIS) September 2010
Environment Agency's Long Term Investment Strategy (LTIS) analysis: http://publications.environment-agency.gov.uk/pdf/GEHO0609BQDF-E-E.pdf
Google Earth for beach lengths in Northern Ireland
Halifax (2011) UK House price value taken from the Halifax website, October 2011. Also reported in the Financial Times.
Land Registry of England and Wales (2011). Average house prices (for metric BU6). Crown copyright (for August 2011).
Met Office Hadley centre observation datasets web site: http://hadobs.metoffice.com/index.html
Met Office temperature anomaly data: http://www.metoffice.gov.uk/climate/uk/anomalygraphs/
Office of National Statistics for average staff costs
Ordnance Survey digital database for beach lengths in England, Wales and Scotland
Standard Industry Classification (SIC) 2007 http://www.statistics.gov.uk/StatBase/Product.asp?vlnk=14012&Pos=&ColRank=1&Rank=224
UKCP09 web site: http://ukclimateprojections-ui.defra.gov.uk
Visit Britain’s National Tourism Products Database (2009) taken from DCMS (2010b)

Business, Industry and Services 119
Appendices

120 Business, Industry and Services

121
Appendix 1 Policy background, scoring of Tier 1 impacts and risk scoring explanation
Table A1.1 Policy Mechanisms Governing Climate Change Adaptation for the Business, Industry and Services Sector
Risk Relevant sub-
sector
UK Government Policy &
Programmes Further Information and Devolved Policy
BU1
Reduced returns for UK financial institutions’ investments due to the absence of mainstreaming climate risk and adaptation into decision-making processes
Financial services
1. The Climate Change Act (2008) containing the Adaptation Reporting Power.
2. Departmental Adaptation Plans (DAPs)
3. National Indicator 188 (NI188)
4. UK Climate Impacts Programme
The Climate Change Act 2008 and the Adaptation Reporting Power is the primary legislative means to influence behaviour on climate change adaptation. It allows Government to direct organisations to report on their adaptation progress. Reporting organisations are expected to highlight potential opportunities as well as risks. Scotland has its own Climate Change (Scotland) Act 2009, which contains an Adaptation Reporting Power for public authorities although the Scottish Government has no plans to use it at the current time.
Departmental Adaptation Plans (DAPs) have been undertaken by each UK Government department in an effort to increase the mainstreaming of adaptation into future policy. The DAP for BIS acknowledges the Government’s role in helping businesses to incorporate climate change adaptation into their management strategies.
Now revoked, NI188 was an adaptation performance indicator. It aimed to embed the management of climate change risks and opportunities across each local authority’s services. It required local authorities to assess and rate their progress in identifying and managing climate change risks. Wales does not have NI188 (Local Authority Adaptation Plans). Instead, adaptation is dealt with by ‘Outcome Agreements’ with Local Authorities.
Soon to be integrated into the remit of the Environment Agency, the UKCIP has developed a number of tools that help business mainstream adaptation into their management plans. One such tool is the Business Areas Climate Assessment Tool (BACLIAT), a simple checklist that can be used to assess the potential
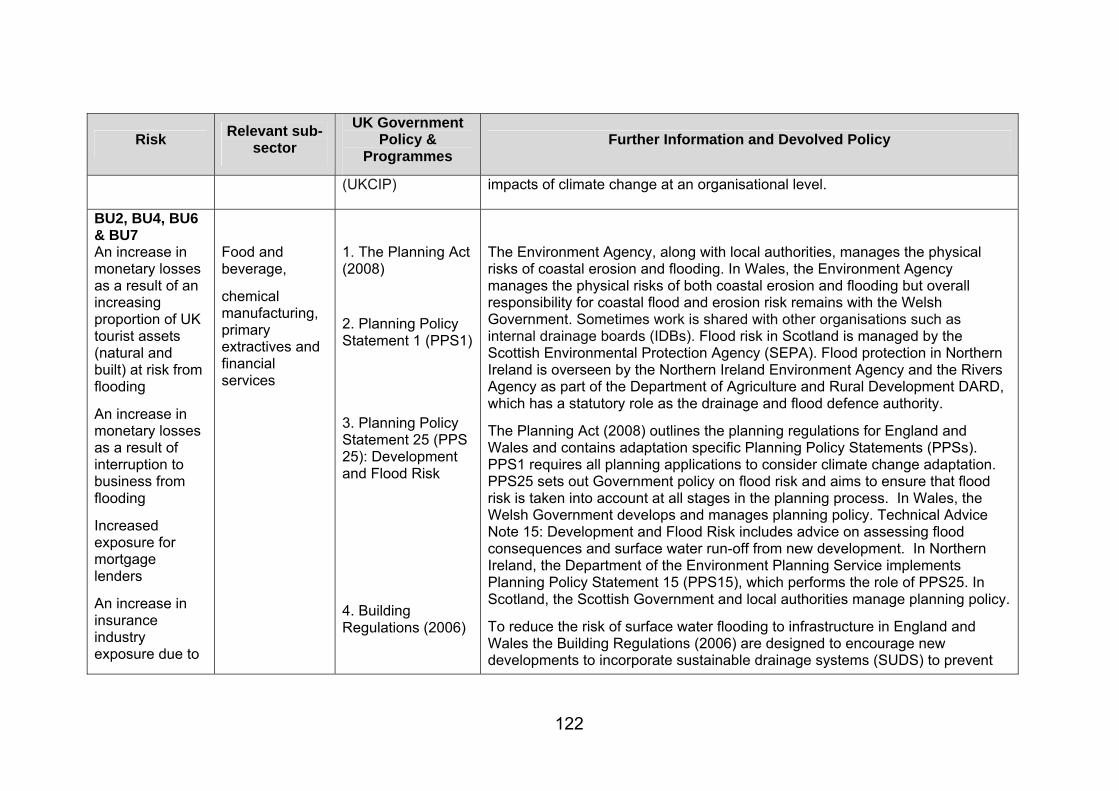
122
Risk Relevant sub-
sector
UK Government Policy &
Programmes Further Information and Devolved Policy
(UKCIP) impacts of climate change at an organisational level.
BU2, BU4, BU6 & BU7 An increase in monetary losses as a result of an increasing proportion of UK tourist assets (natural and built) at risk from flooding
An increase in monetary losses as a result of interruption to business from flooding
Increased exposure for mortgage lenders
An increase in insurance industry exposure due to
Food and beverage,
chemical manufacturing, primary extractives and financial services
1. The Planning Act (2008)
2. Planning Policy Statement 1 (PPS1)
3. Planning Policy Statement 25 (PPS 25): Development and Flood Risk
4. Building Regulations (2006)
The Environment Agency, along with local authorities, manages the physical risks of coastal erosion and flooding. In Wales, the Environment Agency manages the physical risks of both coastal erosion and flooding but overall responsibility for coastal flood and erosion risk remains with the Welsh Government. Sometimes work is shared with other organisations such as internal drainage boards (IDBs). Flood risk in Scotland is managed by the Scottish Environmental Protection Agency (SEPA). Flood protection in Northern Ireland is overseen by the Northern Ireland Environment Agency and the Rivers Agency as part of the Department of Agriculture and Rural Development DARD, which has a statutory role as the drainage and flood defence authority.
The Planning Act (2008) outlines the planning regulations for England and Wales and contains adaptation specific Planning Policy Statements (PPSs). PPS1 requires all planning applications to consider climate change adaptation. PPS25 sets out Government policy on flood risk and aims to ensure that flood risk is taken into account at all stages in the planning process. In Wales, the Welsh Government develops and manages planning policy. Technical Advice Note 15: Development and Flood Risk includes advice on assessing flood consequences and surface water run-off from new development. In Northern Ireland, the Department of the Environment Planning Service implements Planning Policy Statement 15 (PPS15), which performs the role of PPS25. In Scotland, the Scottish Government and local authorities manage planning policy.
To reduce the risk of surface water flooding to infrastructure in England and Wales the Building Regulations (2006) are designed to encourage new developments to incorporate sustainable drainage systems (SUDS) to prevent

123
Risk Relevant sub-
sector
UK Government Policy &
Programmes Further Information and Devolved Policy
flooding
5. UK Climate Projections 2009 (UKCP09)
6. Flood and Water Management Act (2010)
7. Civil Contingencies Act (2004)
sewers becoming overloaded during storms. Building Regulations will be devolved to Wales in January 2012. In Scotland and Northern Ireland, the Scottish Government and Northern Ireland Assembly have responsibility within its jurisdiction respectively.
In order to help the insurance industry the UK Government produced UKCP09. This gives probabilistic climate data. The Environment Agency is also helping the industry acquire new data to help risk calculation for surface water flooding.
The Flood and Water Management Act (2010) provides for lead local flood authorities. Under the Act the lead local flood authorities have duties to develop, maintain and apply a strategy for local flood risk management in their areas, maintain a register of assets, and establish sustainable drainage systems approval bodies.
The Civil Contingencies Act 2004 (CCA) provides a single framework for civil protection and sets out the practical actions that need to be taken in the event of a flood.
BU3
A decrease in water (groundwater and surface water) availability for industrial usage
Chemical manufacturing, primary extractives and food and beverages
1. Pricing Mechanisms and licensing
2. Building Regulations (2006)
3. Flood and Water Management Act
Pricing mechanisms and licensing are used to protect groundwater and surface water resources. The Environment Agency oversees water abstraction licences in England and Wales that regulate the amount of water industry can abstract; these measures are helping to drive change, particularly in the agri-food sector.
The Building Regulations encourage new developments to incorporate sustainable drainage systems (SUDS) to avoid overloading sewers during storms and to recharge groundwater. Building Regulations will be devolved to Wales in January 2012.
The Flood and Water Management Act (2010) and the Land Drainage Act (1991)

124
Risk Relevant sub-
sector
UK Government Policy &
Programmes Further Information and Devolved Policy
(2010)
4. Land Drainage Act (1991)
provide for surface and groundwater abstraction management, led by lead local flood authorities.
BU5
A decrease in productivity and revenues due to ICT loss/ disruption
Tourism, food and beverage, chemical manufacturing, primary extractives and financial services
1. The Infrastructure and Adaptation Project.
The Infrastructure & Adaptation project was set up by the UK Government’s Adapting to Climate Change Programme in 2009. It examines how to improve the climate resilience of infrastructure. One of the 4 areas it looked at was ICT. The main threats identified were damage to infrastructure from flooding and extreme weather. Protection against these threats can be seen in the policy frameworks for managing flooding and planning.
BU8
An expansion of new or existing tourist destinations in the UK
Tourism
1. Shoreline Management Plans (SMPs)
2. UK Climate Impacts Programme (UKCIP)
The Environment Agency in England and Wales manages risks of coastal erosion and flooding in conjunction with local authorities. It also oversees the Shoreline Management Plans (SMPs). SMPs provide an assessment of the risks associated with coastal processes and present a long-term policy framework to reduce these risks. They are managed operationally at the local level by the relevant local authorities.
The UKCIP provides detailed information on possible climate scenarios for the UK and is an important data source for understanding how tourism might be affected by climate change.
Policy for the devolved administrations is overseen by the Scottish Government, Welsh Government and Northern Irish Assembly in conjunction with their respective tourist boards.

125
Risk Relevant sub-
sector
UK Government Policy &
Programmes Further Information and Devolved Policy
BU9
A decrease in output for UK businesses due to an increase in supply chain disruption as a result of extreme events
Chemical manufacturing, food and beverage, and primary extractives
1. The Infrastructure and Adaptation Project
2. Planning Policy Guidance 14 (PPG14)
3. UK Climate Impacts Programme (UKCIP)
The infrastructure and adaptation project, as well as the Departmental Adaptation Plan (DAP) for the UK Department of Transport governs the risks posed to supply chain infrastructure.
Planning and flood risk policy is instrumental in protecting this infrastructure against possible climate change risks. For example, Planning Policy Guidance 14 (PPG14) sets out the broad planning and technical issues regarding development on unstable land.
In Northern Ireland, the Assembly passed a Regional Transportation Strategy (2002-2012) as part of the wider Regional Development strategy. The strategy includes plans for increasing resilience to climate change, with particular focus on the road network.
BU10
Loss of staff hours due to high internal building temperatures
1. The Climate Change Act (2008) – Adaptation Reporting Power.
2. The Building Regulations (Approved Document L – 2006)
3. UK Climate Impacts
The Adaptation Reporting Power contained in the Climate Change Act (2008) requires organisations to report on their adaptation plans. This incorporates the possible risk of high building temperatures to employees.
The Building Regulations (Approved Document L – 2006) requires builders to consider heat gains as well as heat losses in domestic buildings and to prevent solar gain.
The UKCIP introduced the Adaptation and Resilience in a Changing Climate (ARCC) programme, which provides funding to support engineering research on

126
Risk Relevant sub-
sector
UK Government Policy &
Programmes Further Information and Devolved Policy
Programme (UKCIP)
adaptation options for buildings, infrastructure and utilities.
Health authorities in England, Scotland, Wales and Northern Ireland all have a key role to play in supporting research into the health implications of heat waves. In England, Defra produced the heat wave strategy in conjunction with the Department of Health and the Health Protection Agency. The Welsh Government has produced a Heatwave Plan for Wales. The responsible authority in Scotland is Health Protection Scotland. In Northern Ireland, the Department of Health, Social Services and Public Safety (DHSSPS) works closely with the UK Government’s Department of Health to implement policy in this area.

Business, Industry and Services 127
Table A1.2 Scoring of all the identified Tier 1 impacts.
Risk description Sub-sector Economic Score
Environ. Score
Social Score
Likelihood Score
Urgency Score
Total Score
Reduced returns for UK financial institutions’ investments due to the absence of mainstreaming climate risk and adaptation into decision-making processes
Financial 3 1 3 3 2 51.85
An increase in monetary losses as a result of an increasing proportion of UK tourist assets (natural and built) at risk from flooding
Tourism 2 1 1 3 3 44.44
A decrease in water (groundwater and surface water) availability for industrial usage
All industries 2 1 1 3 3 44.44
An increase in monetary losses as a result of interruption to business from flooding
All industries, except tourism
3 1 1 3 2 37.04
A decrease in productivity and revenues due to ICT loss/ disruption
All industries 3 1 1 3 2 37.04
Increased exposure for mortgage lenders
Financial 2 1 2 3 2 37.04
Change in bumblebee disease affecting soft fruit industry
Food/ Beverages
1 3 1 3 2 37.04
An increase in insurance industry exposure due to flooding
Financial 2 1 1 2 3 29.63
Incremental climate change may mean that there is an underestimation of decommissioning liabilities and end of life costs
All industries 3 2 1 2 2 29.63
Increased air temperature leads to increased energy usage for cooling systems for machinery
All industries 2 1 1 3 2 29.63
Loss of staff hours due to high internal building temperatures
All industries 1 1 2 3 2 29.63
Disruption from flooding of assets, transport links and supply chain
All industries 2 1 1 3 2 29.63
Increased scrutiny of investments and loss of reputation due to interplay between environmental, community and climate change pressures
Financial 2 1 1 3 2 29.63
Incremental climate change may lead to higher risk of conflict and environmental incidents which could affect environmental and social licence to operate with loss of consumer confidence
Extractives/ Chem/ Tourism
2 2 2 2 2 29.63
An expansion of new or existing tourist destinations in the UK (opportunity)
Tourism 2 1 1 3 2 29.63

128 Business, Industry and Services
Risk description Sub-sector Economic Score
Environ. Score
Social Score
Likelihood Score
Urgency Score
Total Score
A decrease in output for UK businesses due to an increase in supply chain disruption as a result of extreme events
All industries 2 1 1 3 2 29.63
Flooding (fluvial or pluvial) affects leads to loss/ temporary failure of assets and delays with increased CAPEX/ OPEX
All industries 3 1 1 2 2 24.69
Reliability and security of energy supply may be impacts as a result of heat wave, storms, flood, etc
All industries 3 1 1 2 2 24.69
Increasing temperature will affect the storage and shelf life of some products leading to increased storage management and costs. May also affect supply chains
Chemicals/ Food/ Beverages
2 2 1 2 2 24.69
Milder winters reduced demand for energy (including hydrocarbon based fuels) and impact profits
Oil and Gas 3 1 1 2 2 24.69
Climate change may affect price and availability of raw product used in food manufacturing
Food/ Beverages
2 1 2 2 2 24.69
Increased frequency of extreme events may lead to price volatility affecting suppliers
Food/ Beverages
2 1 2 2 2 24.69
Reduced precipitation and increased evaporation leads to stress on water resources and declining quality which creates specific conflict with other water users (public and other industries). Important for UK companies overseas
Extractives/ Chem
2 2 1 2 2 24.69
Extreme weather and changes to rainfall patterns impacts storage, supply and disposal of volatile and hazardous chemicals and could cause environmental compliance issues due to accidental and increased diffuse releases of contaminants, changes to pathways between contaminant - receptor and increased limitation on disposal options. Potential liability issues
All industries 2 2 1 2 2 24.69
Increasing temperatures could affect outdoor workers from heat stress. Also UV exposure on cloudless days
All industries 1 1 1 3 2 22.22
Flash flooding on impermeable ground around facilities may affect local communities downstream and surrounding environmental quality
All industries 1 1 1 3 2 22.22

Business, Industry and Services 129
Risk description Sub-sector Economic Score
Environ. Score
Social Score
Likelihood Score
Urgency Score
Total Score
Increased demand for air conditioning leads to additional CAPEX/ OPEX
All industries 1 1 1 3 2 22.22
Increase disruption to transportation of people (air and sea) due to change in availability of calm weather windows
All industries 2 1 1 2 2 19.75
Loss of natural resource that attracts tourists leading to loss of revenue and requirement to shift assets
Tourism 2 1 1 2 2 19.75
Damage to corporate reputation from increased scrutiny of lack of management of climate change risks
All industries 2 1 1 2 2 19.75
ESIA does not take into account climate change, either due to national or lender requirements. Lack of sufficient consideration of climate change may lead to negative reputation, effects on lender/ proponent contracts and increased CAPEX/ OPEX
All industries 2 1 1 2 2 19.75
Increased electricity outages and increased levels of competition for energy resource compared with other users demands
Tourism 2 1 1 2 2 19.75
Increased frequency of extreme events increase disruption (i.e. road/rail) and reduces opportunity for transport (particularly air and sea) affecting transport of tourists
Tourism 2 1 1 2 2 19.75
Long-term effects on infrastructure that supports tourism leads to disruption and loss of revenue
Tourism 2 1 1 2 2 19.75
Incremental climate change leads to litigation between contracted parties and contracts do not adequately foresee and manage climate change risks
All industries 2 1 1 2 2 19.75
Increased opportunities for transfer of goods due to melting of arctic sea ice (opportunity)
All industries 2 2 1 3 1 18.52
Extreme weather (including storms, lightning, etc) damaging assets leading to increased CAPEX/ OPEX
All industries 2 1 2 3 1 18.52
Extreme events may affect third-party infrastructure and utilities that will lead to reduced production capacity, operational disruption and delays in returning to full production, with potential for financial loss
All industries 3 1 1 3 1 18.52
Increased air and sea temperatures leads to the opportunity of new maritime routes which may provide more economic routes for bulk cargoes (opportunity)
All industries 2 2 1 3 1 18.52

130 Business, Industry and Services
Risk description Sub-sector Economic Score
Environ. Score
Social Score
Likelihood Score
Urgency Score
Total Score
Extreme events may lead to increased insurance costs
All industries 3 1 1 3 1 18.52
For UK based multinational, climate change may affect workforce in developing countries
Food/ Beverages
2 1 2 3 1 18.52
Increased drying of buildings leading to damage and costs
All industries 1 1 1 2 2 14.81
Increase in fire risk due to drier conditions
All industries 1 1 1 2 2 14.81
Increased loss of revenue for local tourism due to changes in fish stocks
Tourism 1 1 1 2 2 14.81
Increased air temperature leads to changes in consumer demands with increase in sales of products that sell better in warmer weather (opportunity)
Food/ Beverages
2 1 1 3 1 14.81
Water resource abstraction licences revoked or reduced during droughts. May lead to closure or reduced operations due to secondary effects, such as maintaining dust suppression compliance limits
Mining 2 1 1 3 1 14.81
Increased temperatures could affect air quality (e.g. Dust and GL ozone), leading to respiratory issues in exposed workers
All industries 1 1 2 3 1 14.81
Decreased energy costs from reduced indoor space warming in winter (opportunity)
All industries 2 1 1 3 1 14.81
Incremental climate change may exacerbate negative impacts on neighbouring communities, with litigation, increased security risks
All industries 2 1 1 3 1 14.81
Increased regulation of climate change risk in investment delays commercial arrangements
Financial 2 1 1 3 1 14.81
Warmers sea temperatures increases non-native marine species - hazard to swimmers
Tourism 2 1 1 3 1 14.81
Warmer sea temperature promote algal growth affecting coastal destinations
Tourism 2 1 1 3 1 14.81
Warmer sea temperature benefits swimming/ coastal tourism (opportunity)
Tourism 2 1 1 3 1 14.81
Coastal Tourism increased as temperature rises (opportunity)
Tourism 2 1 1 3 1 14.81
Increased opportunity (or risk) and demand for outdoor leisure, sport and tourism
Tourism 2 1 1 3 1 14.81

Business, Industry and Services 131
Risk description Sub-sector Economic Score
Environ. Score
Social Score
Likelihood Score
Urgency Score
Total Score
Increased air temperature leads to changes in consumer demands with reduction in sales of products that sell worse in warmer weather
Food/ Beverages
2 1 1 3 1 14.81
Extreme weather causes HSE and labour compliance issues, with risk of employer and public liability cover being compromised where climate change not included in HSE risk assessments
All industries 2 1 2 2 1 12.35
Increase market for climate resilient property may increase (benefit) property values (opportunity)
Financial 2 1 2 2 1 12.35
Increasing temperatures leading to increased maintenance costs (CAPEX/OPEX), arising from thermal stressing of pipe work which leads to leaks, storage tank pressures, etc
Extractives/ Chem/ Manufacturing
2 2 1 2 1 12.35
Water scarcity leads to effects on procurement of raw agriculture inputs, including animals-based inputs through higher feed prices
Food/ Beverages
2 1 2 2 1 12.35
Cultivation of fish, shellfish and aquatic plants, dairy and poultry yields particularly vulnerable to climate change lead to increased OPEX, loss of market share through rising costs and loss of revenue
Food/ Beverages
2 1 2 2 1 12.35
Increased demand for urban green/ blue space as temperatures increase leads to increase sales and additional CAPEX (opportunity)
Tourism 3 1 1 2 1 12.35
Business opportunity to develop new materials, biotechnology, energy efficiency and carbon capture technology to aid adaptation and transition to low carbon economy (opportunity)
Chemicals 2 2 1 2 1 12.35
Increased product demand and financial gain from increased range of weather-related products (e.g. weather derivatives) (opportunity)
Financial 3 1 1 2 1 12.35
Increased opportunities for reinsurance due to increased likelihood of weather related claims (opportunity)
Financial 3 1 1 2 1 12.35
Migration of pests and diseases into work area. Potential to affect HSE performance
Extractives/ Chem
1 1 1 3 1 11.11

132 Business, Industry and Services
Risk description Sub-sector Economic Score
Environ. Score
Social Score
Likelihood Score
Urgency Score
Total Score
Work force heat stress leading to operational inefficiency and potential litigation
Tourism 1 1 1 3 1 11.11
Seasonal precipitation and water temperature effects wastewater treatment systems
Food/ Beverages
1 2 1 2 1 9.88
Opportunity for reduced equipment specification and costs from reduced ice loading or cold temperature running requirements (opportunity)
Extractives/ Chem
2 1 1 2 1 9.88
Reduced precipitation will affect runoff and fluvial flows. Insufficient dilution may lead to pollution of water courses and affect local communities and habitats
Extractives/ Chem
1 2 1 2 1 9.88
Canal and river navigation difficult to maintain during drought
Tourism 2 1 1 2 1 9.88
Increased awareness of climate change means products that are 'greener' and have credible climate change benefits will sell better (opportunity)
Food/ Beverages
1 2 1 2 1 9.88
Reduction in frost and snow damage to infrastructure affecting maintenance requirements (opportunity)
All industries 2 1 1 2 1 9.88
Increased winter rainfall/ extreme precipitation and soil moisture change through the year may cause subsidence, heave, erosion and landslip with risk to assets, supply chain, etc
All industries 1 1 1 1 2 7.41
More intense rainfall causes rain penetration in buildings affecting structural integrity and value of property
All industries 1 1 1 2 1 7.41
Loss of assets and increased maintenance due to extreme precipitation
All industries 1 1 1 2 1 7.41
Extreme events may lead to wholesale and retail energy price volatility
All industries 1 1 1 2 1 7.41
Cloud cover increased natural light in buildings leading to lower OPEX/ CAPEX
All industries 1 1 1 2 1 7.41
Increased legal exposure and food safety becomes more on an issue in a warmer climate
Food/ Beverages/ Tourism
1 1 1 2 1 7.41
Increased frequency of lightening strikes
All industries 1 1 1 2 1 7.41
Acid mine drainage scenarios become more complicated to manage as groundwater flow regimes change both annually and seasonally
Mining 1 1 1 2 1 7.41

Business, Industry and Services 133
Risk description Sub-sector Economic Score
Environ. Score
Social Score
Likelihood Score
Urgency Score
Total Score
Reduction in building damage and deterioration due to condensation (opportunity)
All industries 1 1 1 2 1 7.41
Sea level rise reduces air gap on offshore assets leading to closure or CAPEX to raise asset
Oil and Gas 2 2 1 1 1 6.17
Incremental climate change leads to regulatory regime change in UK which may make UK companies less competitive than less stringent countries. Industry moves abroad.
Chemicals 2 1 2 1 1 6.17
During extreme events emergency response could be compromised leading to evacuation times increased and worker HS issues
Extractives/ Chem
2 1 1 1 1 4.94
Climate impacts on communities may lead to more stringent controls leading to increased risk of litigation
Food/ Beverages
2 1 1 1 1 4.94
Increased lightning strikes affecting tourism and personnel
Tourism 1 1 1 1 1 3.70
Incremental climate change leading to increased costs of goods and services, and reduced availability of certain raw materials and packaging leading to decreased profit margins
All industries 1 1 1 1 1 3.70
Sea level rise and coastal change may affect sector businesses that rely on marine transport and port facilities leading to downtime, loss of productions and HSE implications
All industries 1 1 1 1 1 3.70
Incremental climate change may affect maritime boundaries and enhance geo-political risk to UK companies working overseas
Oil and Gas 1 1 1 1 1 3.70
Incremental climate change may lead to an opportunity for diversification of businesses. Diversification of energy mix (opportunity)
Extractives 1 1 1 1 1 3.70
Decrease in indoor air quality due to change in outdoor air quality and release of solvents from drying of building materials
All industries 1 1 1 1 1 3.70
Decrease in tourism due to increase in bacterial growth in coastal areas, rivers and lakes
Tourism 1 1 1 1 1 3.70
Increased occurrence of waterlogging on business and industrial sites
All industries 1 1 1 1 1 3.70
Increased exposure of workers to VOCs affecting revenue
All industries 1 1 1 1 1 3.70

134 Business, Industry and Services
Table A1.3 defines the magnitude classes used in the assessment. These were used for scoring impacts in the Tier 2 selection process as well as for scoring risk levels for the scorecards presented for each metric in Chapter 4. For the scorecard, the risk/opportunity level relates to the most relevant of the economic/environmental/social criteria.
Table A1.3 Guidance on classification of relative magnitude: qualitative descriptions of high, medium and low classes
Class Economic Environmental Social
Hig
h
Major and recurrent damage to property and infrastructure
Major consequence on regional and national economy
Major cross-sector consequences
Major disruption or loss of national or international transport links
Major loss/gain of employment opportunities
~ £100 million for a single event or per year
Major loss or decline in long-term quality of valued species/habitat/landscape
Major or long-term decline in status/condition of sites of international/national significance
Widespread Failure of ecosystem function or services
Widespread decline in land/water/air quality
Major cross-sector consequences
~ 5000 ha lost/gained
~ 10000 km river water quality affected
Potential for many fatalities or serious harm
Loss or major disruption to utilities (water/gas/electricity)
Major consequences on vulnerable groups
Increase in national health burden
Large reduction in community services
Major damage or loss of cultural assets/high symbolic value
Major role for emergency services
Major impacts on personal security e.g. increased crime
~million affected
~1000’s harmed
~100 fatalities
Med
ium
Widespread damage to property and infrastructure
Influence on regional economy
Consequences on operations & service provision initiating contingency plans
Minor disruption of national transport links
Moderate cross-sector consequences
Moderate loss/gain of employment opportunities
~ £10 million per event or year
Important/medium-term consequences on species/habitat/landscape
Medium-term or moderate loss of quality/status of sites of national importance
Regional decline in land/water/air quality
Medium-term or Regional loss/decline in ecosystem services
Moderate cross-sector consequences
~ 500 ha lost/gained
~ 1000 km river water quality affected
Significant numbers affected
Minor disruption to utilities (water/gas/electricity)
Increased inequality, e.g. through rising costs of service provision
Consequence on health burden
Moderate reduction in community services
Moderate increased role for emergency services
Minor impacts on personal security
~thousands affected, ~100s harmed, ~10 fatalities
Lo
w
Minor or very local consequences
No consequence on national or regional economy
Localised disruption of transport ~ £1 million per event or year
Short-term/reversible effects on species/habitat/landscape or ecosystem services
Localised decline in land/water/air quality
Short-term loss/minor decline in quality/status of designated sites
~ 50 ha of valued habitats damaged/improved
~ 100 km river quality affected
Small numbers affected
Small reduction in community services
Within ‘coping range’
~1000’s affected

Business, Industry and Services 135
The levels of confidence used by the CCRA can be broadly summarised as follows:
Low - Expert view based on limited information, e.g. anecdotal evidence.
Medium - Estimation of potential impacts or consequences, grounded in theory, using accepted methods and with some agreement across the sector.
High - Reliable analysis and methods, with a strong theoretical basis, subject to peer review and accepted within a sector as 'fit for purpose'.
The lower, central and upper estimates provided in the scorecards relate to the range of the estimated risk or opportunity level. For risk metrics that have been quantified with UKCP09 and response functions, this range relates to the results that are given for the low emissions, 10% probability level (lower); medium emissions, 50% probability level (central); and high emissions, 90% probability level (upper). For the risk metrics that have been estimated with a more qualitative approach, these estimates cover the range of potential outcomes given the evidence provided.
The CCRA analysis uses three discrete time periods to estimate future risks up to the year 2100: the 2020s (2010 to 2039), 2050s (2040 to 2069) and the 2080s (2070 to 2099).This is consistent with the UKCP09 projections.

136 Business, Industry and Services

Business, Industry and Services 137
Appendix 2 Response functions and the application of climate projections
BU2- Supporting data
Figure A2.1 Map of beaches around England, Scotland and Wales.
Note: Northern Ireland was excluded from the digitisation phase, but included in the calculations of beach loss.
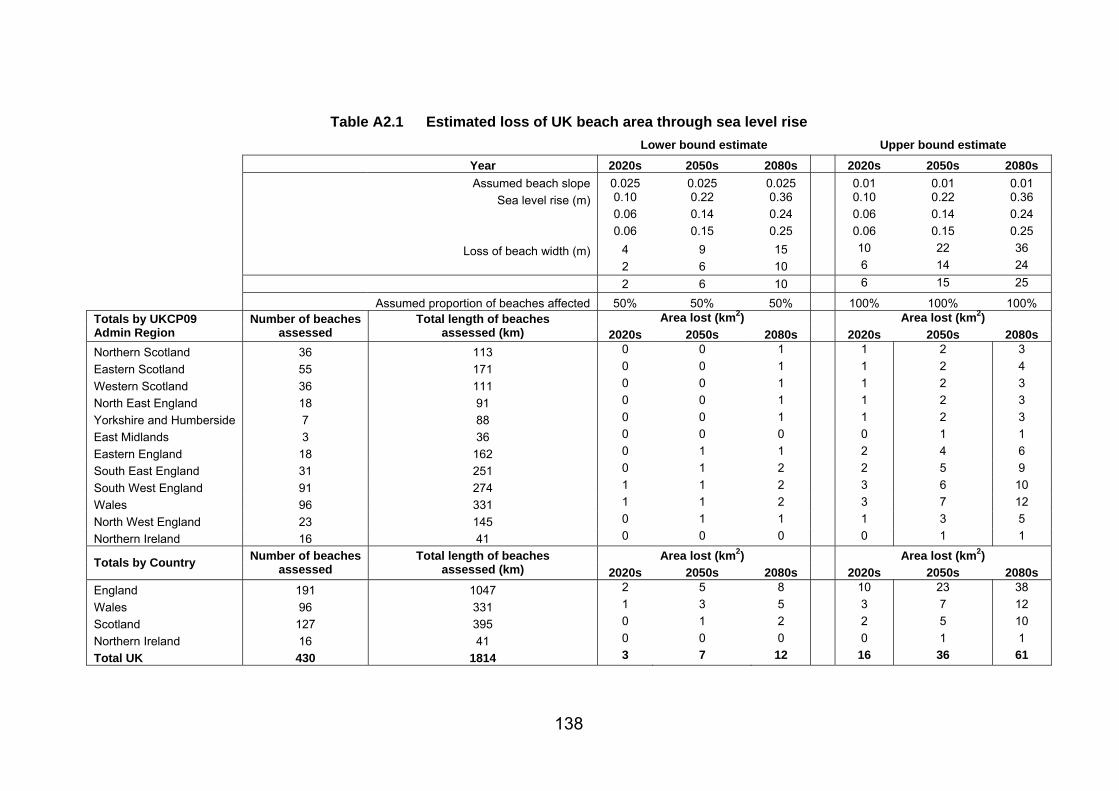
138
Table A2.1 Estimated loss of UK beach area through sea level rise
Lower bound estimate Upper bound estimate
Year 2020s 2050s 2080s 2020s 2050s 2080s
Assumed beach slope 0.025 0.025 0.025 0.01 0.01 0.01
Sea level rise (m) 0.10 0.22 0.36 0.10 0.22 0.36
0.06 0.14 0.24 0.06 0.14 0.24
0.06 0.15 0.25 0.06 0.15 0.25
Loss of beach width (m) 4 9 15 10 22 36
2 6 10 6 14 24
2 6 10 6 15 25
Assumed proportion of beaches affected 50% 50% 50% 100% 100% 100% Area lost (km2) Area lost (km2) Totals by UKCP09
Admin Region Number of beaches
assessed Total length of beaches
assessed (km) 2020s 2050s 2080s 2020s 2050s 2080s
Northern Scotland 36 113 0 0 1 1 2 3
Eastern Scotland 55 171 0 0 1 1 2 4
Western Scotland 36 111 0 0 1 1 2 3
North East England 18 91 0 0 1 1 2 3
Yorkshire and Humberside 7 88 0 0 1 1 2 3
East Midlands 3 36 0 0 0 0 1 1
Eastern England 18 162 0 1 1 2 4 6
South East England 31 251 0 1 2 2 5 9
South West England 91 274 1 1 2 3 6 10
Wales 96 331 1 1 2 3 7 12
North West England 23 145 0 1 1 1 3 5
Northern Ireland 16 41 0 0 0 0 1 1
Area lost (km2) Area lost (km2) Totals by Country
Number of beaches assessed
Total length of beaches assessed (km) 2020s 2050s 2080s 2020s 2050s 2080s
England 191 1047 2 5 8 10 23 38
Wales 96 331 1 3 5 3 7 12
Scotland 127 395 0 1 2 2 5 10
Northern Ireland 16 41 0 0 0 0 1 1
Total UK 430 1814 3 7 12 16 36 61

Business, Industry and Services 139
Table A2.2 Listed buildings and churches of national or international importance located in England in Flood Risk Zone 3 (by region)
East of England East Midlands London Count in Flood Count in Flood Count in Flood Grade38 Zone 3 Grade Zone 3 Grade Zone 3 A 2 A 0 A 0 B 0 B 3 B 3 C 0 C 2 C 2 I 78 I 120 I 113 II 3124 II 2427 II 2301 II* 250 II* 162 II* 203
Total 3454 Total 2714 Total 2622
North East North West South East Count in Flood Count in Flood Count in Flood Grade Zone 3 Grade Zone 3 Grade Zone 3 A 0 A 0 A 3 B 0 B 2 B 7 C 0 C 0 C 2 I 37 I 47 I 163 II 911 II 1558 II 5069 II* 69 II* 105 II* 277
Total 1017 Total 1712 Total 5521
South West West Midlands Yorkshire & Humber Count in Flood Count in Flood Count in Flood Grade Zone 3 Grade Zone 3 Grade Zone 3 A 0 A 0 A 0 B 2 B 0 B 0 C 1 C 0 C 0 I 160 I 43 I 18 II 5813 II 1914 II 3084 II* 304 II* 139 II* 141
Total 6280 Total 2096 Total 3243
Source: English Heritage, 2009. Total listed building and churches in Flood Zone 3 = 28,659
38 The heritage buildings are based on the following classification: Listed Churches, grade A = Exceptional Interest, often internationally important, grade B = Particularly important, of more than special interest, and grade C = Nationally important, of special interest. Other Listed Buildings, grade I = Exceptional Interest, often internationally important, grade II = Particularly important, of more than special interest; and grade II* = Nationally important, of special interest. (Source: English Heritage, 2009).

140 Business, Industry and Services
Table A2.3 Number of tourism buildings and assets located in England in Flood Risk Zone 3
Facility Count Animal-Centred Attraction 99
B&B 734
Campus 5
Caravan and Camping 195
Entertainment, Eating or Drinking Venue 106
Food/Drink-Centred Attraction 12
Garden/Environmental Attraction 74
Historic Site/Structure 246
Holiday Village 5
Hostel 19
Hotel 401
Museum/Heritage/Visitor Centre 314
Natural Feature 130
Retail 84
Science & Technology 14
Self Catering 1328
Serviced Apartments 9
Sightseeing & Transport 135
Sport & Leisure 2
Sports, Health & Fitness 116
Themed Attraction 61
Workplace 9
Total 4098*
Source: Visit Britain’s National Tourism Product Database, 2009.
Table A2.4 Number of arts, theatre and museum, library and archive buildings located in Flood Risk Zone 3
Arts buildings 116
Theatre buildings 119
Museum, library and archive buildings 77
Total 312
Source: The Arts Council’s Regionally Funded Organisations (RFO) database, The Theatres Trust, The Museums, Libraries and Archives Council (MLA), 2009

Business, Industry and Services 141
Table A2.5 Projected Future Sea Level Rise Return Periods by CCRA region, based on UKCP09 data
Future Sea Level Rise Return Periods
2020s 2050s 2080s
UKCP09 Region
Baseline Med p10
Med p50
Medp90
Lowp10
Lowp50
Medp50
Highp50
Highp90
Lowp10
Low p50
Med p50
Highp50
Highp90
East Midlands 100 80.1 70.0 61.2 61.2 45.8 36.8 28.1 16.1 41.0 20.4 15.5 11.0 4.2 East of England 100 83.2 74.7 67.1 66.9 54.3 48.4 39.8 23.5 51.1 29.3 22.6 17.0 7.8
London 100 83.1 73.8 65.5 66.5 52.8 45.2 36.5 20.6 50.0 26.6 19.9 14.7 6.2
North East 100 88.6 79.6 71.4 75.8 61.6 55.9 47.4 27.8 61.6 40.4 30.3 21.9 10.2
North West 100 91.0 82.5 74.8 80.2 66.4 61.2 55.0 34.9 68.5 50.0 37.9 27.0 12.8
South East 100 83.9 75.0 66.9 66.9 53.8 48.1 38.9 21.6 51.9 28.4 20.9 15.4 5.9
South West 100 72.6 61.6 52.2 50.0 29.7 23.1 18.0 9.3 23.4 12.2 8.2 5.1 1.4 Yorkshire and The Humber 100 79.7 69.1 59.9 60.2 42.9 34.3 25.0 14.1 39.7 18.8 14.0 9.4 3.1
Wales 100 80.4 69.0 59.2 61.0 42.9 35.1 27.0 14.1 42.9 19.4 14.0 9.1 3.1
Table A2.6 Projected Future Fluvial Return Periods by CCRA region, based on UKCP09 data
Future Fluvial Return Periods
2020s 2050s 2080s
Med Med Med Low Low Med High High Low Low Med High High UKCP09 Region Baseline p10 p50 p90 p10 p50 p50 p50 p90 p10 p50 p50 p50 p90
East Midlands 100 99.5
64.1
39.8
100
55.8
50.0
46.4
26.9
89.0
45.9
40.3
33.7
16.0
East of England 100
100
79.7
53.4
100
71.0
65.4
62.0
37.7
100
60.5
54.7
46.1
23.5
London 100 10
77.5
48.0
100
72.3
62.0
58.5
31.3
100
56.8
49.5
39.3
19.3
North East 100 98.9 49.8 27.4 100 42.9 36.1 31.7 14.8 64.6 32.7 28.5 21.3 8.6
North West 100 76.3 47.3 31.9 100 50.6 34.9 24.6 16.4 59.3 33.4 28.5 19.0 9.5
South East 100 100 77.3 47.5 100 67.2 59.1 55.5 27.6 96.6 53.1 46.2 36.3 19.4
South West 100 100 56.7 34.5 100 51.5 41.1 39.7 19.6 75.1 36.4 30.9 22.9 11.8 West Midlands 100 99.5 59.8 35.6 100 50.2 43.8 39.3 21.3 84.1 38.2 33.7 25.6 11.8 Yorkshire and The Humber 100 99.2 48.2 25.5 100 40.8 34.4 30.6 15.4 78.1 31.0 25.5 20.7 8.2
Wales 100 84.7 51.5 32.7 100 47.9 36.8 29.7 18.0 64.9 32.9 28.2 20.4 10.3

142 Business, Industry and Services
BU3- Supporting data
Table A2.7 Industrial abstraction distribution across RBDs based on the fully licensed amounts in the September 2010 version of the Environment Agency
Water Resources (WRGIS)
Distribution of industrial abstraction across RBDs as a percentage of total industrial abstraction
Distribution of consumptive industrial abstraction across RBDs as a percentage of total consumptive industrial abstraction
RBD
Groundwater Surface Water Total Groundwater Surface Water Total
Anglian 12% 1% 2% 7% 0% 2%
Dee 1% 0% 0% 1% 0% 0%
Humber 26% 7% 9% 23% 5% 9%
North West 18% 76% 68% 19% 85% 73%
Severn 9% 2% 3% 18% 2% 5%
South East 5% 6% 6% 2% 0% 1%
Northumbria 1% 0% 0% 2% 0% 1%
South West 5% 1% 2% 6% 1% 2%
Thames 22% 1% 4% 20% 1% 5%
West Wales 1% 6% 5% 1% 4% 4%
Total Industrial Abstraction (Ml/d)
1778 11544 13322 657 3111 3768
Table A2.8 Percentage change in industrial abstractions coming from sustainable sources under three future emissions scenarios and considering
downstream catchment water availability
Low Emissions Medium Emissions High Emissions
p10 (wet)
p50 (mid)
p90 (dry)
p10 (wet)
p50 (mid)
p90 (dry)
p10 (wet)
p50 (mid)
p90 (dry)
2020s 1 -1 -2 1 -1 -2 0 -1 -2 2050s -1 -2 -2 -1 -2 -3 -1 -2 -3 2080s -1 -2 -3 -2 -3 -3 -2 -3 -3

Business, Industry and Services 143
Table A2.9 Percentage of total industrial abstraction within compliant water bodies (water bodies in which there is resource available for future abstraction at
the Q9539) under 3 flow reduction scenarios
Percentage reduction in low flows
Name Baseline
-10 -15 -25
Anglian 15% 14% 14% 11%
Dee 0% 0% 0% 0%
Humber 13% 12% 12% 11%
North West England 4% 3% 3% 3%
Northumbria 3% 3% 3% 3%
Severn 17% 12% 11% 4%
South East England 25% 20% 20% 1%
South West England 35% 28% 19% 18%
Thames 9% 9% 9% 8%
West Wales 6% 4% 3% 1%
39 A statistic indicative of low river flow rates during the summer season

144
Figure A2.2 The locations of industrial abstractions and their relative size distribution across England and Wales

Business, Industry and Services 145
Figure A2.3 Map showing the spatial distribution of the turnover equivalent to the loss of water abstraction for Section C - Manufacturing. Data are for the
central estimate of the medium emissions scenario in 2050
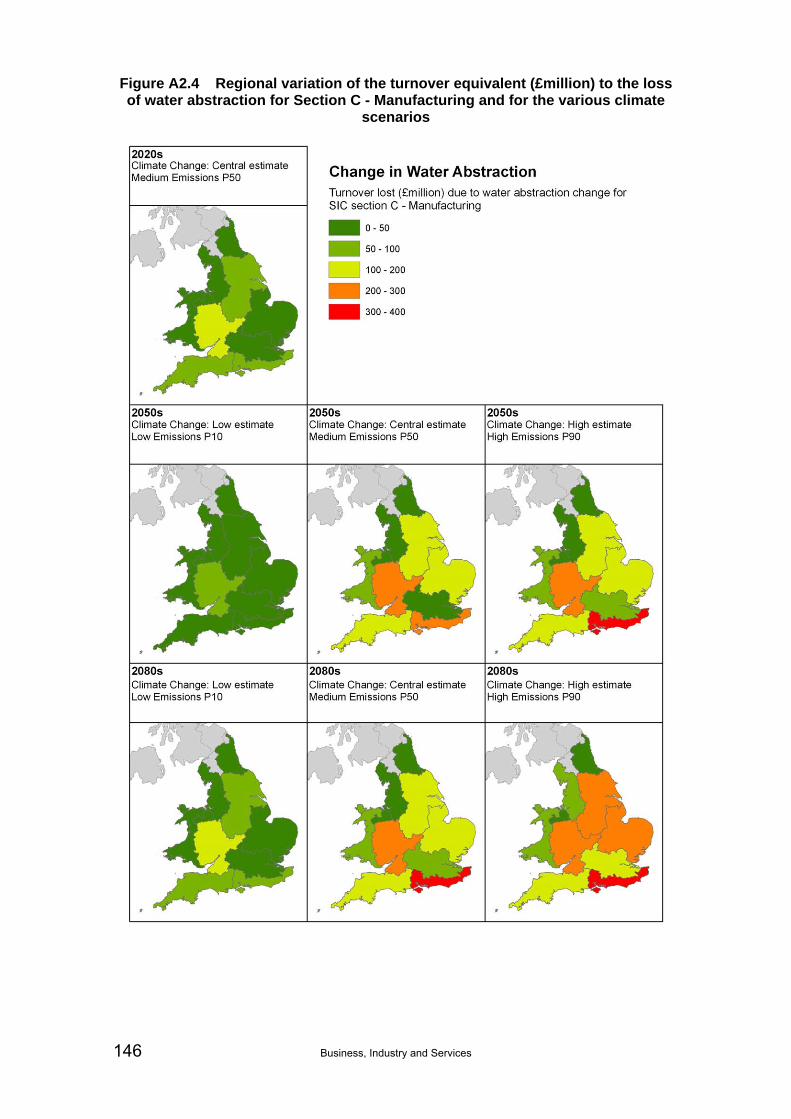
146 Business, Industry and Services
Figure A2.4 Regional variation of the turnover equivalent (£million) to the loss of water abstraction for Section C - Manufacturing and for the various climate
scenarios

Business, Industry and Services 147
Table A2.10 Regional estimates of the turnover equivalent to the loss of water abstraction for Section C – Manufacturing (£m)
Turnover (£m) Annual Medium Medium Medium Low Medium High Low Medium High
Region Turnover p10 p50 p90 p10 p50 p90 p10 p50 p90
Anglian 21620 0 15 77 10 89 138 22 122 181
Dee 4282 0 0 0 0 0 0 0 0 0
Humber 47883 0 41 75 35 89 144 41 126 193
Northumbria 7081 0 0 0 0 0 2 0 1 4
North West England 32644 0 18 28 12 30 38 20 35 46
South East England 15363 0 53 156 28 223 295 62 294 296
Severn 15418 0 83 169 71 172 179 101 177 186
South West England 5985 0 74 86 32 90 108 76 102 124
Thames 28209 0 0 26 0 35 73 5 61 106West Wales 13459 0 24 47 13 55 56 25 55 57
20802020 2050

148
Table A2.11 Indicative loss in turnover based on lost staff time due to reductions in available water abstraction (£m). Based on selected Groups within the SIC that are likely to be impacted and then summed by Section. Table (a) makes no allowance for adaptation
and Table (b) includes some provision for adaptation
Lost Turnover (£m) 2010
(a) No adaptation Annual Medium Medium Medium Low Medium High Low Medium High
SIC Section Turnover p10 p50 p90 p10 p50 p90 p10 p50 p90
A Agriculture, Forestry and Fishing 41 0 0 0 0 0 0 0 0 1
B Mining and Quarrying 22950 0 15 46 9 56 94 21 82 126
C Manufacturing 191944 0 385 831 253 977 1291 439 1217 1491
D Electricity, Gas, Steam and Air conditioning supply 65184 0 107 229 89 248 316 127 295 372
E Water supply, Waste management and Remediation activities 12268 0 18 38 13 43 58 21 54 71
F Construction 1958 0 15 21 7 23 28 16 26 31
Total all activities 294345 0 541 1166 372 1348 1788 625 1674 2092
2020 2050 2080
Lost Turnover (£m) 2010
(b) Including adaptation Annual Medium Medium Medium Low Medium High Low Medium High
SIC Section Turnover p10 p50 p90 p10 p50 p90 p10 p50 p90
A Agriculture, Forestry and Fishing 41 0 0 0 0 0 0 0 0 0
B Mining and Quarrying 22950 0 12 37 8 45 75 17 65 101
C Manufacturing 191944 0 308 665 202 782 1033 352 974 1193
D Electricity, Gas, Steam and Air conditioning supply 65184 0 86 183 72 199 253 102 236 298
E Water supply, Waste management and Remediation activities 12268 0 14 31 10 34 47 16 43 57
F Construction 1958 0 12 17 6 18 22 13 21 25
Total all activities 294345 0 432 933 298 1079 1430 500 1339 1674
2020 2050 2080

Business Industry and Services 149
BU4- Supporting data
Table A2.12 Increase in Non-Residential Properties (NPR) at significant risk of fluvial or tidal flooding (within the 1 in 75 yr flood plain). The values are given as
factors above the baseline
2020s 2050s 2080s
Medium Medium Medium Low Medium High Low Medium High
Measure Baseline p10 p50 p90 p10 p50 p90 p10 p50 p90 NRP (No.) 191,400 1.2 1.6 1.9 1.4 2.0 2.3 1.8 2.3 2.5 EAD (£m) 560 1.2 1.8 2.5 1.3 2.4 3.6 1.7 3.0 4.8
(Source: Floods sector report (Ramsbottom et al., 2012), based on Environment Agency’s Long Term Investment Strategy (LTIS))
Table A2.13 Regional estimates of staff days lost due to flooding for Section G – Wholesale and Retail Trade; repair of Motor Vehicles and Motorcycles
2020s 2050s 2080s Staff days lost Medium Medium Medium Low Medium High Low Medium High
Region Baseline p10 p50 p90 p10 p50 p90 p10 p50 p90
East Midlands 1000 1000 1400 1700 1000 1600 1900 1000 1800 2000
East of England 800 800 1100 1200 800 1100 1300 800 1200 1400
London 700 700 900 1000 700 900 1200 700 1000 1300
North East 200 200 200 200 200 200 300 200 200 300
North West 400 600 1000 1200 400 1200 1400 800 1300 1600
South East 2000 2000 2200 2400 2000 2300 2600 2000 2400 2800
South West 1400 1400 1600 1700 1400 1600 2000 1400 1700 2100
West Midlands 500 500 900 1300 500 1100 1500 500 1300 1700
Yorkshire & Humberside 1400 1400 1900 2100 1400 2100 2200 1600 2100 2200
Wales 700 700 800 900 700 900 1000 800 900 1100

150
Table A2.14 Indicative lost staff time due to flooding (days) sub-divided by Sections of the Standard Industry Classification (SIC)
Lost staff time (thousands) 2020s 2050s 2080s Observed Medium Medium Medium Low Medium High Low Medium High
SIC Section Baseline p10 p50 p90 p10 p50 p90 p10 p50 p90
A Agriculture, Forestry and Fishing 0 0 0 0 0 0 0 0 0 0
B Mining and Quarrying 0 0 0 0 0 0 0 0 0 0
C Manufacturing 4 4 6 7 4 7 8 5 7 9
D Electricity, Gas, Steam and Air conditioning supply 0 0 0 0 0 0 0 0 0 0
E Water supply, Waste management and Remediation activities 0 0 1 1 0 1 1 0 1 1
F Construction 2 2 2 3 2 2 3 2 3 3
G Wholesale and Retail trade; … 8 9 11 13 8 12 14 9 13 15
H Transportation and Storage 2 2 3 3 2 3 4 2 3 5
I Accommodation and Food services 2 3 3 3 2 3 4 3 3 4
J Information and Communication 2 2 2 2 2 2 2 2 2 2
K Financial and Insurance activities 2 2 2 3 2 3 3 2 3 3
L Real Estate activities 1 1 1 1 1 1 1 1 1 1
M Professional, Scientific and Technical activities 3 3 3 4 3 4 4 3 4 5
N Administrative and Support Service activities 4 4 4 5 4 5 6 4 5 6
O Public Administration and Defence; … 2 3 3 4 2 4 4 3 4 4
P Education 2 2 2 3 2 3 4 2 3 4
Q Human Health and Social Work activities 3 3 4 5 3 5 6 4 5 6
R Arts, Entertainment and Recreation 1 1 2 2 1 2 2 1 2 2
Total all activities 39 40 50 58 39 55 66 42 59 70

151
Table A2.15 Indicative lost staff time due to flooding (days) sub-divided by Division of the Standard Industry Classification (SIC)
Lost staff time (to the nearest 100 days) 2020s 2050s 2080s
Observed Medium Medium Medium Low Medium High Low Medium High
SIC Division Baseline p10 p50 p90 p10 p50 p90 p10 p50 p90
10 Manufacture of food products 700 700 1000 1200 700 1100 1300 800 1300 1400 11 Manufacture of beverages 100 100 100 100 100 100 100 100 100 100 12 Manufacture of tobacco products 0 0 0 0 0 0 0 0 0 0 13 Manufacture of textiles 100 100 200 300 100 300 300 200 300 400 14 Manufacture of wearing apparel 0 0 0 0 0 0 100 0 100 100 15 Manufacture of leather and related products 0 0 0 0 0 0 0 0 0 0 16 Manufacture of wood and of products of wood and cork, … 0 0 0 0 0 0 0 0 0 0 17 Manufacture of paper and paper products 0 0 0 0 0 0 0 0 0 100 18 Printing and reproduction of recorded media 100 100 100 200 100 200 300 100 200 300 19 Manufacture of coke and refined petroleum products 0 0 0 0 0 0 0 0 0 0 20 Manufacture of chemicals and chemical products 100 100 100 200 100 200 200 100 200 200 21 Manufacture of basic pharmaceutical products … 0 0 0 100 0 0 100 0 100 100 22 Manufacture of rubber and plastic products 400 400 500 600 400 600 600 400 600 700 23 Manufacture of other non-metallic mineral products 0 0 100 100 0 100 100 0 100 100 24 Manufacture of basic metals 0 0 100 100 0 100 100 0 100 100 25 Manufacture of fabricated metal products, … 600 600 900 1100 600 900 1200 700 1000 1200 26 Manufacture of computer, electronic and optical products 200 200 200 200 200 200 300 200 200 400 27 Manufacture of electrical equipment 0 0 100 100 0 100 200 0 100 300 28 Manufacture of machinery and equipment n.e.c. 200 200 500 700 200 600 800 300 800 800 29 Manufacture of motor vehicles, trailers and semi-trailers 100 100 100 200 100 200 200 100 200 200 30 Manufacture of other transport equipment 0 0 400 400 0 400 400 100 400 400 31 Manufacture of furniture 100 100 200 200 100 200 200 100 200 200 32 Other manufacturing 0 0 200 200 0 200 300 200 200 400 33 Repair and installation of machinery and equipment 0 0 0 0 0 0 0 0 0 0 36 Water collection, treatment and supply 0 0 0 0 0 0 0 0 0 0 37 Sewerage 0 0 0 0 0 0 0 0 0 0 38 Waste collection, treatment and disposal activities; … 0 0 0 0 0 0 0 0 0 0 39 Remediation activities and other waste management services 0 0 0 0 0 0 0 0 0 0 47 Retail trade, except of motor vehicles and motorcycles 14 14 32 32 14 32 32 14 32 32
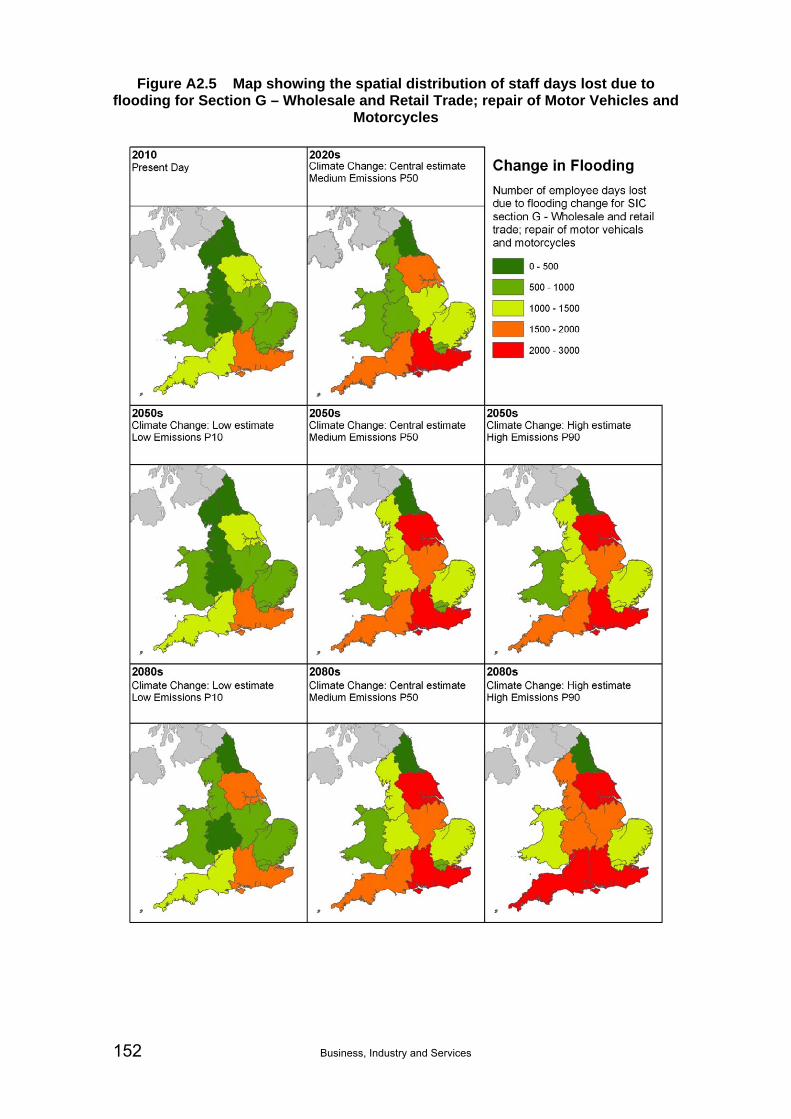
152 Business, Industry and Services
Figure A2.5 Map showing the spatial distribution of staff days lost due to flooding for Section G – Wholesale and Retail Trade; repair of Motor Vehicles and
Motorcycles

Business, Industry and Services 153
Figure A2.6 Map showing the spatial distribution of turnover lost (£ millions) due to flooding for Section G – Wholesale and Retail Trade; repair of Motor
Vehicles and Motorcycles

154
BU6 - Supporting data
Table A2.16 Estimated value of residential mortgage fund at significant likelihood of river flooding (£bn, England and Wales)
Med Med Med Low Low Med High High Low Low Med High Highp10 p50 p90 p10 p50 p50 p50 p90 p10 p50 p50 p50 p90
East Midlands £118,990 1.78 1.79£ 3.36£ 4.39£ 1.78£ 3.78£ 4.05£ 4.19£ 4.61£ 2.08£ 4.21£ 4.38£ 4.52£ 4.76£ East of England £84,714 0.85 0.85£ 1.29£ 1.77£ 0.85£ 1.48£ 1.61£ 1.66£ 1.88£ 0.85£ 1.68£ 1.76£ 1.83£ 1.94£
London £236,979 2.87 2.87£ 3.88£ 6.56£ 2.87£ 4.21£ 5.06£ 5.40£ 9.07£ 2.87£ 5.57£ 6.40£ 7.69£ 11.97£
North East £69,159 0.31 0.31£ 0.49£ 0.56£ 0.31£ 0.51£ 0.53£ 0.54£ 0.63£ 0.44£ 0.54£ 0.56£ 0.59£ 0.68£
North West £76,665 0.54 1.54£ 2.41£ 2.57£ 0.54£ 2.35£ 2.55£ 2.61£ 2.65£ 2.16£ 2.56£ 2.59£ 2.64£ 2.70£
South East £140,813 4.02 4.02£ 4.65£ 5.47£ 4.02£ 5.00£ 5.23£ 5.32£ 5.63£ 4.05£ 5.37£ 5.49£ 5.58£ 5.64£
South West £117,670 1.78 1.78£ 3.32£ 3.49£ 1.78£ 3.38£ 3.44£ 3.45£ 3.60£ 2.94£ 3.47£ 3.51£ 3.57£ 3.68£ West Midlands £88,866 0.33 0.33£ 0.85£ 1.21£ 0.33£ 1.02£ 1.11£ 1.17£ 1.31£ 0.46£ 1.18£ 1.22£ 1.29£ 1.33£
Yorkshire and The Humber £82,372 1.02 1.02£ 2.25£ 2.46£ 1.02£ 2.35£ 2.41£ 2.44£ 2.48£ 1.54£ 2.43£ 2.46£ 2.47£ 2.49£
Wales £79,880 1.04 1.25£ 1.74£ 1.90£ 1.06£ 1.78£ 1.88£ 1.92£ 1.96£ 1.57£ 1.90£ 1.92£ 1.95£ 1.99£
2020s 2050s 2080s
UKCP09 Region
Average Mortgage Value* Baseline**
Note this is without population growth and is in £ billion.
* Calculated by multiplying the national average mortgage ratio to value by the average value per region.
** calculated by multiplying the average mortgage value by the number of properties at significant likelihood and the % of properties with a mortgage

155
Table A2.17 Estimated value of residential mortgage fund at significant likelihood of tidal flooding (£bn, England and Wales)
Med Med Med Low Low Med High High Low Low Med High Highp10 p50 p90 p10 p50 p50 p50 p90 p10 p50 p50 p50 p90
East Midlands £118,990 1.30 1.50 1.63 1.74 1.74 1.89 1.95 1.99 2.08 1.92 2.05 2.08 2.10 2.16 East of England £84,714 0.23 0.41 0.54 0.66 0.67 0.87 0.94 1.02 1.16 0.92 1.11 1.17 1.24 1.36
London £236,979 0.49 0.67 0.83 1.01 0.99 1.38 1.60 1.87 2.69 1.46 2.27 2.72 3.30 5.00
North East £69,159 0.08 0.08 0.09 0.09 0.09 0.10 0.10 0.11 0.12 0.10 0.11 0.12 0.12 0.13
North West £76,665 0.13 0.28 0.46 0.62 0.48 0.77 0.88 0.97 1.12 0.73 1.03 1.10 1.16 1.25
South East £140,813 1.66 2.45 2.99 3.49 3.42 4.24 4.54 4.84 5.34 4.37 5.13 5.35 5.53 5.81
South West £117,670 1.16 2.16 2.47 2.66 2.70 2.83 2.86 2.88 2.91 2.85 2.90 2.91 2.92 2.94 West Midlands £88,866
Yorkshire and The Humber £82,372 0.59 1.82 2.55 3.20 3.16 4.13 4.48 4.81 5.30 4.29 5.12 5.31 5.45 5.60
Wales £79,880 0.68 0.88 1.01 1.11 1.08 1.21 1.25 1.29 1.37 1.22 1.33 1.37 1.42 1.52
2020s 2050s 2080s
UKCP09 Region
Average Mortgage Value* Baseline**
Note this is without population growth and is in £ billion.
* Calculated by multiplying the national average mortgage ratio to value by the average value per region.
** calculated by multiplying the average mortgage value by the number of properties at significant likelihood and the % of properties with a mortgage

156 Business, Industry and Services
BU7 – Supporting data
Table A2.18 Average proportional increase in number residential properties at significant risk of flooding (percentage)
a) Fluvial flooding
2020s 2050s 2080s Medium Medium Medium Low Low Medium High High Low Low Medium High High
p10 p50 p90 p10 p50 p50 p50 p90 p10 p50 p50 p50 p90
21 103 147 0 116 132 139 167 57 139 147 158 183
Note: Based on CCRA Flood sector analysis of flood risk in England and Wales
b) Tidal flooding
2020s 2050s 2080s Medium Medium Medium Low Low Medium High High Low Low Medium High High
p10 p50 p90 p10 p50 p50 p50 p90 p10 p50 p50 p50 p90
69 118 163 149 221 249 277 331 226 305 331 357 418
Note: Based on CCRA Flood sector analysis of flood risk in England and Wales
Table A2.19 Properties at significant risk of fluvial and tidal flooding (p50 Medium Emissions climate change scenario)
a) Residential properties
Epoch Properties at risk (thousands) (climate change only)
Increase over present day (%) (climate change only)
2008 366 0 2020s 691 90 2050s 868 140 2080s 962 160 b) Non-Residential properties
Epoch Properties at risk (thousands) (climate change only)
Increase over present day (%) (climate change only)
2008 191 0 2020s 300 60 2050s 350 80 2080s 377 100 c) Total number of properties
Epoch Properties at risk (thousands) (climate change only)
Increase over present day (%) (climate change only)
2008 557 0 2020s 991 80 2050s 1219 120 2080s 1339 140

Business, Industry and Services 157
BU8 – Supporting data
Table A2.20 TCI scores for Grid Square 1690 (extreme SW) for the 1970s and 50% probability level for 2020s and 2050s
Month 1970s 2020s 2050s Change 1970 to 2050
January 29.1 29.6 30.3 1.2
February 33.7 32.7 32.6 -1.1
March 40.7 42.6 42.8 2.1
April 51.2 51.5 53.8 2.6
May 55.3 59.5 63.1 7.8
June 63.2 70.4 78.8 15.6
July 72.2 76.7 81.7 9.5
August 69.7 77.3 82.4 12.7
September 57.3 63.5 71.5 14.2
October 43.4 46.4 48.6 5.2
November 35.7 36 36.4 0.7
December 31.2 32.1 32.2 1
(Source: South West Tourism, 2010).
Table A2.21 Serviced accommodation room occupancy figures from 2003 to 2008 for Bournemouth
Bournemouth – August 2003 Heatwave 2004 2005 2006 2007 2008
Room occupancy 87 75 82 78 69 72
(Source: South West Tourism, 2010).

158 Business, Industry and Services
Figure A2.7 UK temperature anomaly data for the months of June, July, August and September and room occupancy data for serviced accommodation,
averaged over the same period
65
66
67
68
69
70
71
72
‐1
‐0.5
0
0.5
1
1.5
2
2.5
3
3.5
2001 2002 2003 2004 2005 2006 2007 2008 2009
UK room occupancy (%)
Difference in
temperature from 1971‐2000 average
(˚C)
Year
June
July
August
Sept
Average room occupancy (June‐Sept)
(Source: Met Office and Enjoy England).
Figure A2.8 UK temperature anomaly data for the months of June, July, August and September and annual room occupancy data for serviced accommodation in
seaside locations
48
49
50
51
52
53
54
55
56
57
‐1
‐0.5
0
0.5
1
1.5
2
2.5
3
3.5
2001 2002 2003 2004 2005 2006 2007 2008 2009
UK room occupancy (%)
Difference in
temperature from 1971‐2000 average
(˚C)
Year
June
July
August
Sept
Seaside
(Source: Met Office and Enjoy England).

Business, Industry and Services 159
BU10 – Supporting data
Table A2.22 Lost production days per year per employee for days exceeding 26oC with an adjustment to take account of the underlying changes since the
time of the baseline period (1960-90)
2020s 2050s 2080s Medium Medium Medium Low Medium High Low Medium High
Region Baseline p10 p50 p90 p10 p50 p90 p10 p50 p90
East Midlands 0.25 0.29 0.37 0.49 0.36 0.64 1.55 0.37 1.09 4.36
East of England 0.33 0.36 0.47 0.65 0.47 0.87 2.08 0.48 1.44 5.50
London 0.53 0.58 0.77 1.03 0.74 1.33 3.05 0.77 2.14 7.47
North East 0.05 0.05 0.09 0.15 0.08 0.21 0.63 0.08 0.43 2.39
North West 0.13 0.15 0.21 0.30 0.20 0.38 0.97 0.20 0.67 3.14
South East 0.27 0.31 0.43 0.61 0.41 0.83 2.21 0.43 1.45 6.25
South West 0.11 0.12 0.20 0.32 0.19 0.46 1.51 0.20 0.92 5.35
West Midlands 0.25 0.28 0.38 0.55 0.36 0.71 1.75 0.39 1.21 5.22 Yorkshire & Humberside
0.16 0.18 0.25 0.33 0.24 0.42 1.05 0.25 0.72 3.05
Wales 0.08 0.09 0.13 0.21 0.12 0.29 0.89 0.13 0.59 3.47
Table A2.23 Lost production days per year per employee for days exceeding 28oC with an adjustment to take account of the underlying changes since the
time of the baseline period (1960-90)
2020s 2050s 2080s Medium Medium Medium Low Medium High Low Medium High
Region Baseline p10 p50 p90 p10 p50 p90 p10 p50 p90
East Midlands 0.15 0.17 0.24 0.33 0.23 0.44 1.14 0.24 0.73 3.66
East of England 0.18 0.21 0.31 0.43 0.30 0.57 1.55 0.31 1.00 4.79
London 0.36 0.39 0.54 0.72 0.51 0.98 2.46 0.54 1.64 6.73
North East 0.01 0.02 0.03 0.06 0.02 0.09 0.37 0.02 0.23 1.75
North West 0.08 0.09 0.13 0.18 0.12 0.23 0.67 0.12 0.45 2.35
South East 0.15 0.18 0.25 0.39 0.25 0.53 1.61 0.26 1.00 5.51
South West 0.06 0.07 0.10 0.16 0.09 0.26 0.99 0.10 0.56 4.56
West Midlands 0.14 0.17 0.24 0.35 0.23 0.48 1.29 0.25 0.86 4.50 Yorkshire & Humberside
0.07 0.08 0.12 0.19 0.12 0.26 0.69 0.13 0.47 2.39
Wales 0.04 0.05 0.08 0.12 0.07 0.15 0.54 0.08 0.34 2.59
Table A2.24 Regional estimates of the lost productivity due to overheating (employee days) for Section K - Financial and Insurance activities
2020s 2050s 2080s Medium Medium Medium Low Medium High Low Medium High
Region Baseline p10 p50 p90 p10 p50 p90 p10 p50 p90
East Midlands 8000 9400 12200 16000 11700 21100 50700 12300 35600 142800
East of England 19000 21300 27900 38600 27500 51300 123000 28100 84900 324500
London 154000 169700 225600 300400 215200 387600 891500 225700 626600 2184100
North East 1000 1200 2100 3300 1800 4500 13800 1800 9300 52000
North West 12000 12700 18500 25800 17400 32800 84400 17700 58200 273700
South East 28000 32300 44100 63000 42800 85800 229600 44700 151000 649300
South West 8000 9100 14700 23400 14000 33700 111200 14900 67600 395000
West Midlands 15000 17300 23900 34000 22500 44100 109000 24100 75500 324700Yorkshire & Humberside
12000 13900 19500 25800 18600 32900 82500 19700 56400 240400
Wales 2000 2400 3400 5500 3200 7500 22800 3500 15000 89000
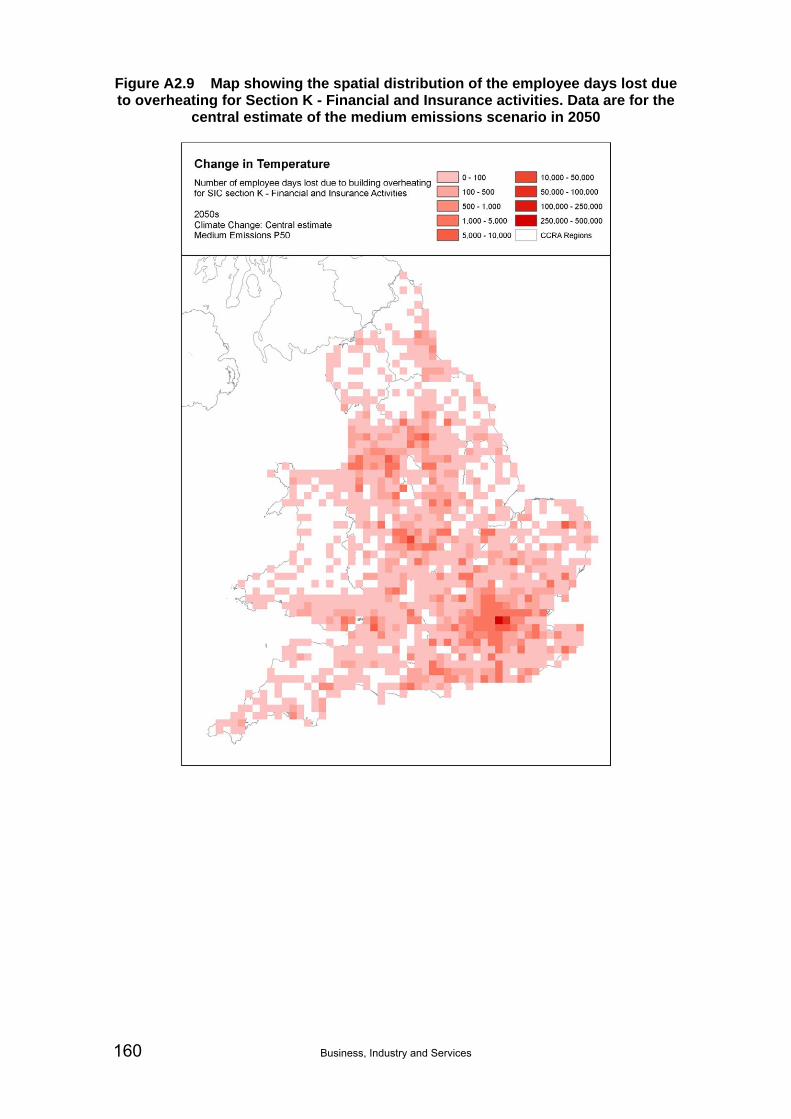
160 Business, Industry and Services
Figure A2.9 Map showing the spatial distribution of the employee days lost due to overheating for Section K - Financial and Insurance activities. Data are for the
central estimate of the medium emissions scenario in 2050

Business, Industry and Services 161
Figure A2.10 Regional variation of the lost productivity due to overheating for Section K - Financial and Insurance activities and for the various climate
scenarios

162 Business, Industry and Services
Table A2.25 Staff days lost and indicative cost using thresholds of 26C and 28C
2020s 2050s 2080s Medium Medium Medium Low Medium High Low Medium High
Tmax >26C Baseline p10 p50 p90 p10 p50 p90 p10 p50 p90 Staff days lost (x1000)
5120 5690 7770 10750 7430 14170 35680 7780 24290 101330
% of working time 0.10% 0.11% 0.16% 0.21% 0.15% 0.28% 0.71% 0.16% 0.49% 2.02%
Cost (£m) 770 850 1170 1610 1120 2130 5350 1170 3640 15200 % of turnover 0.02% 0.02% 0.03% 0.04% 0.03% 0.06% 0.14% 0.03% 0.10% 0.41%
Tmax >28C Staff days lost (x1000)
3050 3480 4890 6970 4650 9490 26270 4920 17010 86610
% of working time 0.06% 0.07% 0.10% 0.14% 0.09% 0.19% 0.52% 0.10% 0.34% 1.73%
Cost (£m) 460 520 730 1050 700 1420 3940 740 2550 12990 % of turnover 0.01% 0.01% 0.01% 0.02% 0.01% 0.03% 0.08% 0.01% 0.05% 0.25%

163
Table A2.26 Indicative lost staff time due to overheating (days), sub-divided by Sections of the Standard Industry Classification (SIC)
Lost staff time (thousands) 2020s 2050s 2080s Observed Medium Medium Medium Low Medium High Low Medium High
SIC Section Baseline p10 p50 p90 p10 p50 p90 p10 p50 p90
A Agriculture, Forestry and Fishing 20 23 31 44 30 59 153 31 102 450
B Mining and Quarrying 4 6 9 12 8 16 42 9 28 122
C Manufacturing 397 442 608 849 581 1124 2889 609 1958 8555
D Electricity, Gas, Steam and Air conditioning supply 20 23 31 43 30 58 149 31 101 441
E Water supply, Waste management and Remediation activities 30 34 46 64 44 85 217 46 147 629
F Construction 211 236 323 449 309 594 1510 323 1025 4348
G Wholesale and Retail trade; … 817 911 1245 1729 1192 2284 5789 1247 3931 16573
H Transportation and Storage 262 291 396 545 379 716 1782 396 1218 4981
I Accommodation and Food services 293 327 446 617 426 813 2046 446 1392 5787
J Information and Communication 212 236 320 439 306 577 1420 321 972 3859
K Financial and Insurance activities 259 289 392 536 375 701 1719 393 1180 4676
L Real Estate activities 73 80 109 150 104 197 491 109 336 1372
M Professional, Scientific and Technical activities 373 413 559 768 536 1008 2488 560 1703 6815
N Administrative and Support Service activities 442 491 666 916 638 1204 2987 667 2044 8310
O Public Administration and Defence; … 320 355 485 672 464 885 2231 485 1520 6384
P Education 559 621 849 1178 813 1556 3939 850 2676 11268
Q Human Health and Social Work activities 689 766 1050 1460 1004 1928 4901 1051 3328 14152
R Arts, Entertainment and Recreation 135 149 203 280 194 369 926 203 631 2613
Total all activities 5116 5690 7767 10751 7431 14174 35678 7777 24292 101332

164
Table A2.27 Indicative lost staff time due to overheating (days), sub-divided by Divisions of the Standard Industry Classification (SIC)
Lost staff time (thousands) 2020s 2050s 2080s
Observed Medium Medium Medium Low Medium High Low Medium High SIC Division Baseline p10 p50 p90 p10 p50 p90 p10 p50 p90
10 Manufacture of food products 60 66 90 125 86 165 417 90 284 1223 11 Manufacture of beverages 6 7 9 13 9 17 41 9 28 117 12 Manufacture of tobacco products 0 0 1 1 1 1 3 1 2 9 13 Manufacture of textiles 7 8 11 16 11 20 52 11 35 155 14 Manufacture of wearing apparel 5 5 7 9 6 12 29 7 20 83 15 Manufacture of leather and related products 1 2 2 3 2 4 10 2 7 29 16 Manufacture of wood and of products of wood and cork, … 8 10 13 18 12 24 62 13 42 183 17 Manufacture of paper and paper products 9 10 14 20 14 26 69 14 47 206 18 Printing and reproduction of recorded media 22 25 34 47 32 61 154 34 105 439 19 Manufacture of coke and refined petroleum products 2 2 2 3 2 5 12 2 8 36 20 Manufacture of chemicals and chemical products 17 18 26 36 25 47 122 25 83 367 21 Manufacture of basic pharmaceutical products … 7 8 11 16 11 21 55 11 37 160 22 Manufacture of rubber and plastic products 25 29 39 55 38 72 186 39 126 553 23 Manufacture of other non-metallic mineral products 14 15 21 29 20 39 99 21 67 295 24 Manufacture of basic metals 11 13 18 25 17 33 85 18 58 267 25 Manufacture of fabricated metal products, … 44 50 69 97 66 128 328 69 223 978 26 Manufacture of computer, electronic and optical products 22 24 34 47 32 63 165 34 111 484 27 Manufacture of electrical equipment 15 17 24 33 23 44 116 24 78 344 28 Manufacture of machinery and equipment n.e.c. 34 38 52 73 50 97 250 52 169 737 29 Manufacture of motor vehicles, trailers and semi-trailers 24 27 37 52 35 68 175 37 119 526 30 Manufacture of other transport equipment 19 21 29 42 28 56 149 29 99 459 31 Manufacture of furniture 12 13 18 25 17 33 85 18 58 252 32 Other manufacturing 12 13 18 26 18 34 89 19 60 263 33 Repair and installation of machinery and equipment 19 21 29 40 28 54 136 29 93 392 36 Water collection, treatment and supply 5 5 7 10 7 14 36 7 24 107 37 Sewerage 4 4 6 8 6 11 28 6 19 80 38 Waste collection, treatment and disposal activities; … 21 24 32 45 31 60 152 32 103 435 39 Remediation activities and other waste management services 0 0 1 1 0 1 2 1 2 7 47 Retail trade, except of motor vehicles and motorcycles 525 586 802 1114 768 1472 3731 803 2534 10692

Business, Industry and Services 165
Appendix 3 Economic impacts
Table A3.1 Change in total value of industrial abstractions that may be prevented if catchments switch from being sustainable to unsustainable in
England and Wales (from local catchments and assuming no socio-economic change) (£m/annum, no uplift or discounting and compared to a 2008 risk
baseline)
Low Emissions Medium Emissions High Emissions
p10 (wet)
p50 (mid)
p90 (dry)
p10 (wet)
p50 (mid)
p90 (dry)
p10 (wet)
p50 (mid)
p90 (dry)
2020s 0.91* 1.89 2.53 0.91* 1.96 2.59 0.78* 1.94 2.56
2050s 1.28 2.57 3.19 2.01 2.79 3.34 2.19 2.96 3.46
2080s 2.11 2.90 3.45 2.51 3.26 3.75 2.89 3.52 4.00
* Indicate economic savings under “wet” climate scenarios
Table A3.2 Change in total value of industrial abstractions that may be prevented if catchments switch from being sustainable to unsustainable in England and Wales (from downstream catchments and assuming no socio-
economic change) (£m/annum, no uplift or discounting and compared to a 2008 risk baseline)
Low Emissions Medium Emissions High Emissions
p10 (wet)
p50 (mid)
p90 (dry)
p10 (wet)
p50 (mid)
p90 (dry)
p10 (wet)
p50 (mid)
p90 (dry)
2020s -0.4 0.8 1.4 -0.4 0.9 1.5 -0.3 0.9 1.4
2050s 0.6 1.5 1.9 0.9 1.6 2.0 1.1 1.7 2.0
2080s 1.0 1.7 2.0 1.4 1.9 2.2 1.7 2.1 2.4
Table A3.3 Marginal increase in Non-Residential Properties in England & Wales at significant risk of fluvial and tidal flooding due to climate change
(assuming no socio-economic change) (£million/year, no uplift or discounting and compared to a 2008 risk baseline)
2020s 2050s 2080s
Med Med Med Low Low Med High High Low Low Med High High
p10 p50 p90 P10 p50 p50 p50 p90 p10 p50 p50 p50 p90
Climate multiplier 1.17 1.75 2.46 1.32 2.1 2.41 2.67 3.61 1.71 2.7 2.98 3.43 4.79
Baseline (£m) 560 655 980 1378 7391176 1350 1495 2022 9581512 1669 1921 2682
Climate attributable (£m) 95 420 818 179 616 790 935 1462 398 952 1109 1361 2122(Source: Derived from CCRA Floods Sector Report)

166 Business, Industry and Services
Table A3.4 Total (absolute) regional tourism expenditure in the UK attributable to climate change and socio-economic change (population and numbers of
international tourists) for the 2020s (£billion/year, no uplift or discounting and compared to a 2005 risk baseline).
LowMedium
lowMedium
high HighNorth East 0.08 0.05 0.06 0.13North West 0.46 0.29 0.34 0.75Yorkshire and the Humber 0.27 0.17 0.20 0.45East Midlands 0.19 0.12 0.14 0.31West Midlands 0.11 0.05 0.06 0.18Eastern England 0.20 0.12 0.14 0.34London -0.47 -0.49 -0.64 -0.58South East England 0.26 0.12 0.13 0.45South West England 0.62 0.36 0.43 1.03Wales 0.33 0.20 0.24 0.53Scotland 0.35 0.19 0.22 0.60Northern Ireland 0.03 0.02 0.02 0.04
UK total 2.43 1.18 1.33 4.22
Region2020s
Table A3.5 Total (absolute) regional tourism expenditure in the UK attributable to climate change and socio-economic change (population and numbers of
international tourists) for the 2050s (£billion/year, no uplift or discounting and compared to a 2005 risk baseline).
LowMedium
lowMedium
high HighNorth East 0.27 0.20 0.23 0.31North West 1.51 1.13 1.33 1.74Yorkshire and the Humber 0.90 0.67 0.78 1.01East Midlands 0.60 0.45 0.51 0.63West Midlands 0.44 0.34 0.33 0.45Eastern England 0.69 0.52 0.56 0.67London 0.22 0.16 -0.56 0.07South East England 1.08 0.82 0.77 0.99South West England 1.98 1.52 1.64 1.90Wales 1.02 0.77 0.89 1.09Scotland 1.59 1.18 1.33 2.11Northern Ireland 0.08 0.06 0.07 0.09
UK total 10.38 7.83 7.89 11.08
Region2050s

Business, Industry and Services 167
Table A3.6 Total (absolute) regional tourism expenditure in the UK attributable to climate change and socio-economic change (population and numbers of
international tourists) for the 2080s (£billion/year, no uplift or discounting and compared to a 2005 risk baseline).
LowMedium
lowMedium
high HighNorth East 0.34 0.29 0.35 0.72North West 1.83 1.57 1.85 3.77Yorkshire and the Humber 1.08 0.92 1.06 2.22East Midlands 0.68 0.58 0.59 1.37West Midlands 0.62 0.47 0.49 1.19Eastern England 0.81 0.66 0.60 1.58London 1.95 0.82 0.95 2.86South East England 1.45 1.08 0.93 2.63South West England 2.20 1.83 1.60 4.38Wales 1.15 1.00 1.05 2.39Scotland 2.63 1.99 3.03 5.61Northern Ireland 0.10 0.08 0.09 0.21
UK total 14.83 11.28 12.62 28.93
Region2080s

168 Business, Industry and Services

Business, Industry and Services 169
Appendix 4 Social Vulnerability Checklist
Having reviewed the Social Vulnerability Checklist for the impacts themed as ‘Water Availability’, ‘Legal’ and ‘Corporate’ (financial performance, reputation, governance, risk management’, no social vulnerability factors have been identified.
All corporate impacts identified relate to corporate performance, governance, reputation, risk management, etc and are thus high level and institutional. For this reason no impacts on social vulnerable groups have been identified. Similarly, all legal impacts relate to litigation against corporate structures so impacts on social groups are highly unlikely. Water availability impacts relate to profitability of the industry or its ability to maintain production so no social impacts have been identified, with the except of international or food security (see relevant social vulnerability checklist below).
The impact upon wider society of changes to risk in the Business Industry and Services sector is mediated by social vulnerability. Certain groups of people or organisations are less able to withstand adverse impacts from one or a number of stressors to which they are exposed. Equally, the estimation of the consequences of climate change is determined by the ability of the sector and others to adapt (the “adaptive capacity”).
Social vulnerability defines the extent to which a system is susceptible to, or unable to cope with, adverse effects of climate change including climate variability and extremes. In this case, it is a measure of the impact change in the Business Industry and Services sector may have on wider society, communities and individuals.
To address this issue, a social vulnerability check list was used to explore and highlight any potential vulnerable populations related to the Business, Industry and Services study impacts and consequences. The completed checklists for a range of themes identified across the sub-sectors are presented below, with key observations summarised below:
Within the Business, Industry and Services sector, low income workers may be disproportionately impacted by some of the areas of risk. More specifically, those working outdoors would be affected most directly by changes to operational patterns as a result of climate change. Potentially, this is one group that could be impacted with negative health and welfare implications. Geographically isolated people may be hit hard if transport disruption means commuting to work becomes more difficult. Indeed, those with a weak social support network may find it harder to cope with disruption to employment, if businesses are affected by long term climate change.
Disruption within particular sub-sectors could expose the vulnerability of certain groups. For example, food and beverage price fluctuations as a result of weather disruption in the UK or abroad could push more people into poverty. Elsewhere, elderly people are particularly vulnerable to rises in energy prices, which are exposed to climatic variation. For example, a potential increase in necessary investment in the utility distribution assets (e.g. electricity power lines) could lead to a rise in energy costs for the consumer.
In a global market, the link between impact and consequence is not straightforward, as there may be alternative supply routes available to meet shortage of any one crop. However, as seen through the wheat crop failures in Russia in 2010, a significant failure of crops in one country can have global consequences on price. In addition, consequences of climate change need not necessarily be negative for those currently vulnerable. For

170 Business, Industry and Services
example, a rise in winter temperatures may reduce energy demand and cost. Business opportunities arising from a changing climate might also help to create new jobs in socially deprived regions.

171
Sector Business (Extractives, Oil and Gas, Chemical, Food and Beverages)
Cluster/Theme Assets (fixed and workforce)
Category of social vulnerability factor
Questions to ask Comment (general answer)
Evidence (opinion, reports, research)
Extent (specifics including data where available)
Place Which locations are affected by these impacts?
Is it spread evenly across regions or not?
Most impacts identified in this theme relate to flooding (river, rain or coastal) or heat, either of which could occur anywhere within the UK. Heat related impacts are more likely to be significant in southern and eastern UK (based on UKCP09 projections).
Foresight coastal flood and defence project identified coastal areas at risk (see http://www.foresight.gov.uk/OurWork/ CompletedProjects/Flood/index.asp).
Much of the work done in this sector is within is held in house and client confidential so opinions are based on the professional experience of the sector champion and sector analyst and Entec project management team.
National impact, see UKCP09
Social deprivation How will people with poor health (physical or mental) be affected by these impacts?
Limited impact on people of poor health as impacts relate to a workforce assumed to be active (as working outdoors or in mainly active roles) or to fixed assets.
n/a n/a
How will people with fewer financial resources be affected?
Low income workers may be negatively impacted as many of the risk areas identified in relation to workers arise from outdoor working in typically low income jobs. This makes this demographic the group mot likely to be impacted,
Much of the work done in this sector is within is held in house and client confidential so opinions are based on the professional experience of the sector champion and sector analyst and Entec project management team.
UKCP09 for projected impact severity

172
Sector Business (Extractives, Oil and Gas, Chemical, Food and Beverages)
Cluster/Theme Assets (fixed and workforce)
Category of social vulnerability factor
Questions to ask Comment (general answer)
Evidence (opinion, reports, research)
Extent (specifics including data where available)
with negative health and welfare implications.
How will people living or working in poor quality homes or workplaces be affected?
Only identified impact is the potential link between low income and likelihood of poor quality homes. Impact then as above.
n/a
How will people who have limited access to public and private transport be affected?
N/A
Disempowerment How will people with lack of awareness of the risks be affected?
Risks are being identified at a business level so should have limited impact on individuals through lack of awareness.
n/a
How will people without social networks be affected?
N/A
How will people with little access to systems and support services (e.g. health care) be affected?
N/A
Other Are any other social vulnerability issues relevant?
No
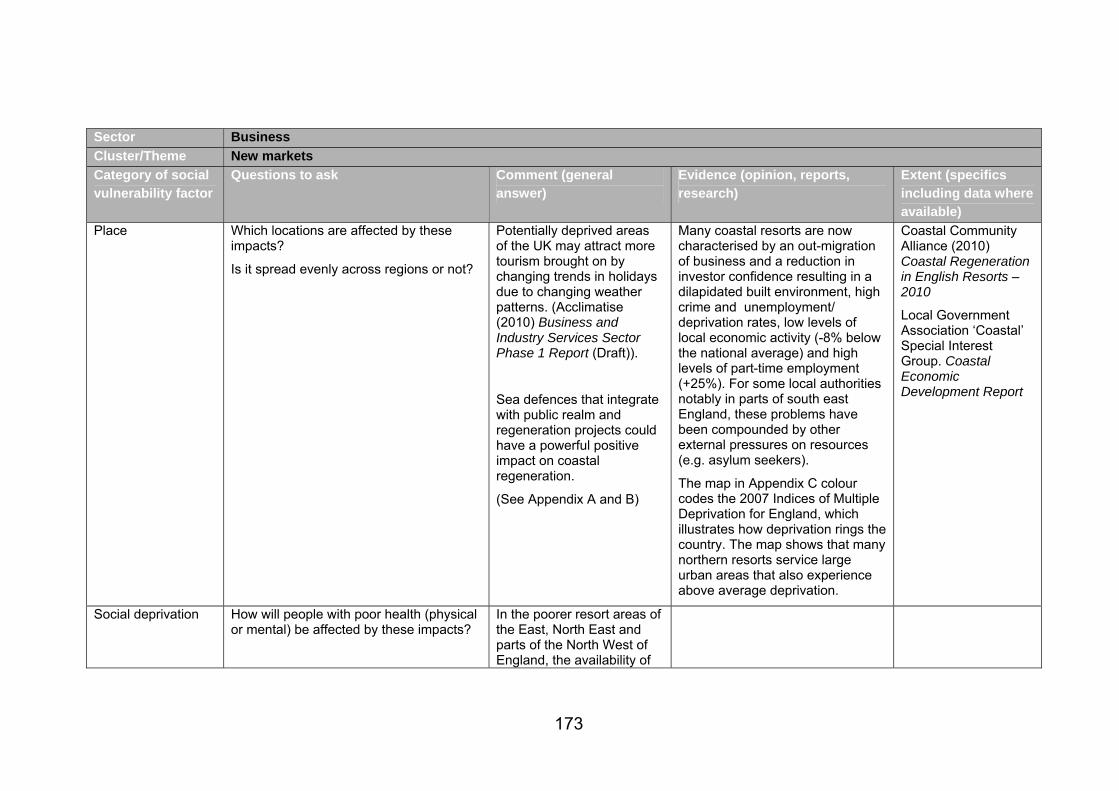
173
Sector Business
Cluster/Theme New markets
Category of social vulnerability factor
Questions to ask Comment (general answer)
Evidence (opinion, reports, research)
Extent (specifics including data where available)
Place Which locations are affected by these impacts?
Is it spread evenly across regions or not?
Potentially deprived areas of the UK may attract more tourism brought on by changing trends in holidays due to changing weather patterns. (Acclimatise (2010) Business and Industry Services Sector Phase 1 Report (Draft)).
Sea defences that integrate with public realm and regeneration projects could have a powerful positive impact on coastal regeneration.
(See Appendix A and B)
Many coastal resorts are now characterised by an out-migration of business and a reduction in investor confidence resulting in a dilapidated built environment, high crime and unemployment/ deprivation rates, low levels of local economic activity (-8% below the national average) and high levels of part-time employment (+25%). For some local authorities notably in parts of south east England, these problems have been compounded by other external pressures on resources (e.g. asylum seekers).
The map in Appendix C colour codes the 2007 Indices of Multiple Deprivation for England, which illustrates how deprivation rings the country. The map shows that many northern resorts service large urban areas that also experience above average deprivation.
Coastal Community Alliance (2010) Coastal Regeneration in English Resorts – 2010
Local Government Association ‘Coastal’ Special Interest Group. Coastal Economic Development Report
Social deprivation How will people with poor health (physical or mental) be affected by these impacts?
In the poorer resort areas of the East, North East and parts of the North West of England, the availability of

174
Sector Business
Cluster/Theme New markets
Category of social vulnerability factor
Questions to ask Comment (general answer)
Evidence (opinion, reports, research)
Extent (specifics including data where available)
cheap retirement homes and caravans attracts retirees who often have health issues.
The in-migration of older people to coastal resorts can place significant additional demands on public services, particularly health and social care.
The influx of tourism may lead to overstretched public health services as it gets diverted to cater for tourist related injuries.
How will people with fewer financial resources be affected?
Low income workers and the unemployed may be positively affected as the local economy brings in more tourism.
The dominant position of the low-wage tourism industry in most resorts maintains a lower standard of living for many coastal residents and non-dynamic economies that are unattractive to other business sectors.
CLG (2007) Government Response to the Communities and Local Government Committee Report on Coastal Towns
Coastal Community Alliance (2010) Coastal Regeneration in English Resorts – 2010.

175
Sector Business
Cluster/Theme New markets
Category of social vulnerability factor
Questions to ask Comment (general answer)
Evidence (opinion, reports, research)
Extent (specifics including data where available)
How will people living or working in poor quality homes or workplaces be affected?
It is expected that quality of life would increase due to rise in income from tourism. This is the team’s judgement.
How will people who have limited access to public and private transport be affected?
N/A
Disempowerment How will people with lack of awareness of the risks be affected?
Those with lack of awareness may miss out on the opportunity to generate income from changing holiday trends.
How will people without social networks be affected?
N/A
How will people with little access to systems and support services (e.g. health care) be affected?
N/A
Other Are any other social vulnerability issues relevant?
No

176
Sector Business
Cluster/Theme Coastal erosion / Sea level rise
Place Which locations are affected by these impacts?
Is it spread evenly across regions or not?
Coastal businesses and communities (See Appendix A and B).
There are around 3.5 million people living in or near the 113 seaside resorts (population >1,000) spread around the 6,250 miles of English coastline. The resorts are administered by 49 district councils, 14 county councils and 23 unitary authorities. Source: Coastal Community Alliance (2010) Coastal Regeneration in English Resorts – 2010.
Social deprivation How will people with poor health (physical or mental) be affected by these impacts?
In the poorer resort areas of the East, North East and parts of the North West of England, the availability of cheap retirement homes and caravans attracts retirees who often have health issues.
The in-migration of older people to coastal resorts can place significant additional demands on public services, particularly health and social care.
Coastal Community Alliance (2010) Coastal Regeneration in English Resorts – 2010.

177
Sector Business
Cluster/Theme Coastal erosion / Sea level rise
This may all be exacerbated by climate change where provision of coastal health and public services may already be overstretched.
How will people with fewer financial resources be affected?
SMEs with limited revenue or reliant on income from inbound tourism to coastal communities may struggle with investing in capital and operational and meeting higher insurance premiums.
Low paid workers working for SMEs or in remote communities reliant on tourism may face loss of employment as SMEs are unable to invest in capital and operational expenditure to stay in business.
In 2007, the Communities and Local Government Select Committee launched an inquiry into coastal towns which concluded that many coastal towns share common factors including physical isolation, significant levels of deprivation and transience, and low-waged, low-skilled, seasonally dependent economies. As older – and in some cases vulnerable – people move in, young people tend to leave. There is a lack of affordable, suitable housing, with large former hotels and guest houses often converted for multiple occupancy. All these problems are exacerbated by the declining and seasonal nature of the coastal economy.
The dominant position of the low-wage tourism industry in most resorts maintains a lower standard of living for many coastal residents and undynamic economies that are unattractive to other business sectors.
CLG (2007) Government Response to the Communities and Local Government Committee Report on Coastal Towns
Coastal Community Alliance (2010) Coastal Regeneration in English Resorts - 2010

178
Sector Business
Cluster/Theme Coastal erosion / Sea level rise
How will people living or working in poor quality homes or workplaces be affected?
SMEs and low income workers working in coastal businesses or reliant on income from inbound tourism will be affected by loss of income due to business interruption brought about by sea level rise.
Resort housing is often characterised by a dual economy of high house prices and low-quality private rental sectors. Coastal houses in multiple occupation (HMOs) provide cheap, short-term accommodation that contributes to the transience in many coastal towns.
How will people who have limited access to public and private transport be affected?
N/A
Disempowerment How will people with lack of awareness of the risks be affected?
Businesses and people with lack of awareness will not plan to protect against coastal erosion and sea level rise.
Overall, given the current domination of the mitigation agenda with respect to reducing greenhouse gas emissions in the tourism industry and their continued almost singular focus on this issue, the key barrier to effective decision-making has to be the lack of awareness and knowledge of the potential business risks and adaptation responses to climate change. This lack of awareness prevails with the exception of organisations that have already experienced some fixed asset risk, such as the obvious issues of flooding or coastal erosion, or those more progressive companies and associations, such as the “Tourism 2023” vision group under Forum for the Future, that are taking a

179
Sector Business
Cluster/Theme Coastal erosion / Sea level rise
potentially longer-term view of risk and opportunity. (Acclimatise (2010) Business and Industry Services Sector Phase 1 Report (Draft)).
How will people without social networks be affected?
Loss of coastal assets may affect migrant workers without social networks available to support periods of unemployment.
Coastal resorts experience a higher than national average level of transience populations: inflows and outflows of individuals and families attracted by seasonal employment, cheap rental accommodation and/or the quality of resort life.
How will people with little access to systems and support services (e.g. health care) be affected?
Resorts suffer from the rural problems of poor communications, isolation, poor access to services and jobs, lack of opportunity, recruitment issues, and access to affordable housing. This could be exacerbated due to climate change.
Coastal Community Alliance (2010) Coastal Regeneration in English Resorts - 2010
Other Are any other social vulnerability issues relevant?
Team judgement is that loss of assets could potentially affect service industries that support tourism, with knock-on effects such as loss of earnings/ employment for vulnerable work groups in service industry (e.g. cleaners).

180
Sector Business (Extractives, Oil and Gas, Chemical, Food and Beverages)
Cluster/Theme Food security
Category of social vulnerability factor
Questions to ask Comment (general answer)
Evidence (opinion, reports, research)
Extent (specifics including data where available)
Place Which locations are affected by these impacts?
Is it spread evenly across regions or not?
Impacts are UK or international in origin but having a potentially UK wide impact via change in food prices (primarily).
Opinions are based on the professional experience of the sector champion and sector analyst and Entec project management team.
Unaware of published research or evidence in the public domain.
National and international impacts, see UKCP09 and IPCC 4AR
Social deprivation How will people with poor health (physical or mental) be affected by these impacts?
Any volatility of food prices may impact those in poor health as it may lead to deterioration in diet.
As above. n/a
How will people with fewer financial resources be affected?
Any volatility of food prices may impact those with low financial resource and could then lead to deterioration in diet.
As above. n/a
How will people living or working in poor quality homes or workplaces be affected?
Only identified impact is the potential link between low income and likelihood of poor quality homes. Impact then as above.
n/a
How will people who have limited access to public and private transport be affected?
N/A

181
Sector Business (Extractives, Oil and Gas, Chemical, Food and Beverages)
Cluster/Theme Food security
Category of social vulnerability factor
Questions to ask Comment (general answer)
Evidence (opinion, reports, research)
Extent (specifics including data where available)
Disempowerment How will people with lack of awareness of the risks be affected?
N/A – reaction in public is responsive. Awareness is linked to better nutrition as opposed to understand there may be a bread shortage if wheat crops fail regularly.
As above
How will people without social networks be affected?
Isolation may make an individual more vulnerable to volatility if food prices but this is uncertain.
As above
How will people with little access to systems and support services (e.g. health care) be affected?
Unless there is a cost of food within these systems (i.e. paid meal on wheels’) there will be no impacts.
As above
Other Are any other social vulnerability issues relevant?
No

182 Business, Industry and Services
NOTES ON USING THE SOCIAL VULNERABILITY CHECKLIST
1.1 When defining/scoring the magnitude of consequences, the impact on vulnerable groups needs to be considered as part of the assessment of magnitude of social consequences. This checklist can be used as a means of capturing the answers to the key questions regarding social vulnerability.
1.2 The cluster/theme refers to the broad categories of impacts/consequences identified for the sector. For the water sector these were water availability; water quality and ecology; water company assets; and water use and recreation. It would be impractical to complete an assessment using the above table for every impact (or rationalised group of impacts). However, a Y/N check box is provided in the ‘selection_of_tier_2_impacts_template’ to indicate whether the assessment has identified vulnerable groups as being particularly affected by each impact/rationalised group of impacts. It is important to capture this, so that suitable risk metrics are identified.
1.3 In filling in the checklist, information can be drawn from the sector scoping reports, current research and expert opinion. In the evidence column, it will be important to note a) if there is evidence and b) what sort it is i.e. expert, published research, modelled etc., and the same measures that are applied to the impact evidence (e.g. pedigree) would be useful to apply here.
1.4 The extent column is where information on how many people might be affected could be indicated. Initially, this will help with identifying suitable risk metrics. Later on, when the selection of Tier 2 impacts is being revisited as part of the DA/Regional assessments, these data might be available from the sector-based Tier 2 assessment based on baseline socio-economic data, the use of Government projections (for the near term) and scenarios (for the longer term).
1.5 The final row will capture any other social vulnerabilities not explicitly included in the checklist.
1.6 The information from this assessment is designed to feed into the selection of Tier 2 impacts, but it could also be updated during other stages of the project. Further thought needs to be put into this yet.