climate change policy and the adoption of methane
TRANSCRIPT

Climate Change Policy and the Adoption of Methane Digesters on Livestock Operations
Nigel KeyStacy Sneeringer
EconomicResearchService
EconomicResearchReportNumber 111
February 2011
United States Department of Agriculture
The U.S. Department of Agriculture (USDA) prohibits discrimination in all its programs and activities on the basis of race, color, national origin, age, disability, and, where applicable, sex, marital status, familial status, parental status, religion, sexual orientation, genetic information, political beliefs, reprisal, or because all or a part of an individual's income is derived from any public assistance program. (Not all prohibited bases apply to all programs.) Persons with disabilities who require alternative means for communication of program information (Braille, large print, audiotape, etc.) should contact USDA's TARGET Center at (202) 720-2600 (voice and TDD).
To file a complaint of discrimination write to USDA, Director, Office of Civil Rights, 1400 Independence Avenue, S.W., Washington, D.C. 20250-9410 or call (800) 795-3272 (voice) or (202) 720-6382 (TDD). USDA is an equal opportunity provider and employer.
Recommended citation format for this publication: Key, Nigel and Stacy Sneeringer. Climate Change Policy and the Adoption of Methane Digesters on Livestock Operations, ERR-111, U.S. Department of Agriculture, Economic Research Service, February 2011.
Cover photo: AgStar.
ww
ww
w.wwer
sr .usda.govoo
Visit Our Website To Learn More!
For more information See the global climate change briefing room:
www.ers.usda.gov/Briefing/globalclimate
United StatesDepartmentof Agriculture
www.ers.usda.gov
A Report from the Economic Research Service
Abstract
Methane digesters—biogas recovery systems that use methane from manure to generate electricity—have not been widely adopted in the United States because costs have exceeded benefi ts to operators. Burning methane in a digester reduces greenhouse gas emissions from manure management. A policy or program that pays producers for these emission reductions—through a carbon offset market or directly with payments—could increase the number of livestock producers who would profi t from adopting a methane digester. We developed an economic model that illustrates how dairy and hog operation size, location, and manure management methods, along with electricity and carbon prices, could infl uence methane digester profi ts. The model shows that a relatively moderate increase in the price of carbon could induce signifi cantly more dairy and hog operations, particularly large ones, to adopt a methane digester, thereby substantially lowering emis-sions of greenhouse gases.
Keywords: methane, methane digesters, manure, livestock, climate change, greenhouse gases, carbon offset
Acknowledgments
The authors would like to thank Brent Gloy, Department of Agricultural Economics, Purdue University; Jeffrey Hyde, Department of Agricultural Economics and Rural Sociology, Pennsylvania State University; John Horowitz, USDA, Economic Research Service; Richard Hegg and Luis Tupas, USDA, National Institute of Food and Agriculture; and Robert Johansson and Jan Lewandrowski, USDA, Offi ce of the Chief Economist, for their helpful reviews and comments. Thanks also go to our editor, Priscilla Smith, and our designer, Wynnice Pointer-Napper.
Nigel Key, [email protected]
Stacy Sneeringer, [email protected]
Climate Change Policy and the Adoption of Methane Digesters on Livestock Operations
Economic Research Report Number 111
February 2011

iiClimate Change Policy and the Adoption of Methane Digesters on Livestock Operations / ERR-111
Economic Research Service/USDA
Contents
Summary. . . . . . . . . . . . . . . . . . . . . . . . . . . . . . . . . . . . . . . . . . . . . . . . . . . iii
Introduction . . . . . . . . . . . . . . . . . . . . . . . . . . . . . . . . . . . . . . . . . . . . . . . . . 1
Dairy, Hog Operations Produce Most Manure Methane . . . . . . . . . . . . . 3
Climate Change Policies Could Spur Digester Adoption . . . . . . . . . . . . . 4
Boosting Benefi ts Over Costs Would Encourage Methane Digester Adoption . . . . . . . . . . . . . . . . . . . . . . . . . . . . . . . . . . . . . . . . . . . 6 Electricity—Prices, Onfarm Use, and Sales of Surplus— Is a Key to Digester Profi tability . . . . . . . . . . . . . . . . . . . . . . . . . . . . . 7 Carbon Price Could Play Major Role in Digester Adoption Decision . . . 9 Existing Types of Manure Storage and Handling Favor Southern Farms for Offset-Program Qualifi cation . . . . . . . . . . . . . . . . . . . . . . . 10 Digesters’ Other Benefi ts Include Odor Reduction, Less Surface-Water Contamination . . . . . . . . . . . . . . . . . . . . . . . . . . . . . . . 13
Scale of Livestock Operations Affects Benefi ts From Carbon Offsets . 14 Digester Adoption Spreads to More States as Carbon Price Rises . . . . . 17 Options for Promoting Adoption of Biogas Technologies by Smaller Scale Operations . . . . . . . . . . . . . . . . . . . . . . . . . . . . . . . . . . 20
More Carbon Offsets Are Supplied at Higher Price. . . . . . . . . . . . . . . . 22
Conclusions . . . . . . . . . . . . . . . . . . . . . . . . . . . . . . . . . . . . . . . . . . . . . . . . . 26
References . . . . . . . . . . . . . . . . . . . . . . . . . . . . . . . . . . . . . . . . . . . . . . . . . . 27
Appendix . . . . . . . . . . . . . . . . . . . . . . . . . . . . . . . . . . . . . . . . . . . . . . . . . . . 32 The Net Present Value of a Methane Digester Project . . . . . . . . . . . . . . 33 Case Studies and Parameter Values . . . . . . . . . . . . . . . . . . . . . . . . . . . . 35 ARMS Data Description . . . . . . . . . . . . . . . . . . . . . . . . . . . . . . . . . . . . . 39

iiiClimate Change Policy and the Adoption of Methane Digesters on Livestock Operations / ERR-111
Economic Research Service/USDA
Summary
What Is the Issue?
Methane digester systems capture methane from lagoon or pit manure storage facilities and use it as a fuel to generate electricity or heat. In addition to providing a renewable source of energy, digesters can reduce greenhouse gas emissions, odors from manure, and potential contamination of surface water. Methane digesters have not been widely adopted in the United States mainly because the costs of constructing and maintaining these systems have exceeded the value of the benefi ts provided to the operator. Policies to reduce greenhouse gas emissions could create new opportunities for livestock producers to earn revenue from burning methane from manure, making such biogas recovery facilities profi table for many livestock producers. However, there is likely to be wide variation in the scale, location, and characteristics of livestock operations that would benefi t, so these policies could have longrun structural implications for the U.S. livestock sector. In this report we estimate the number and type of hog and dairy operations that would fi nd it profi table to adopt a digester at any given carbon price. We also estimate the relation-ship between the price of carbon (CO2) and the amount of emissions reduced by digesters on these operations.
What Are the Major Findings?
The extent to which livestock operations can reduce greenhouse gas emis-sions from manure management depends in part on the number of livestock operations that adopt methane digesters, which in turn depends on digester profi tability from energy savings, energy sales, and/or sales of emission reductions in a carbon offset market. An offset market allows livestock producers who reduce methane emissions to sell these reductions or “carbon offsets” to other greenhouse gas emitters who might face emissions caps.
Factors that infl uence digester profi tability and that determine the characteris-tics and locations of the livestock operations that could benefi t from the intro-duction of a carbon offset market include:
• operation size—costs of constructing and operating a digester decline on a per-head basis, making digesters more profi table on larger operations
• the selling price of surplus electricity—a higher price makes digesters more valuable for operations that can generate more electricity than they use onfarm
• farm electricity expenditures, which depend on electricity prices and onfarm use—higher expenditures make digester-generated electricity more valuable, especially if the operation cannot sell electricity or if the selling price of electricity is below the retail price
• participation in cost-share and other incentive programs—this can defray the cost of building digesters
• farm’s initial level of methane emissions—this determines the maximum quantity of carbon emissions reductions that can be sold

ivClimate Change Policy and the Adoption of Methane Digesters on Livestock Operations / ERR-111
Economic Research Service/USDA
• carbon price—a higher carbon price makes digesters more profi table for operations that can sell carbon offsets.
Larger operations would be more likely to adopt a digester, and likely would earn substantially higher profi ts on average than smaller operations. Hence, introduction of a carbon market in a region could enhance existing economies of scale in production and result in further concentration of production on the largest operations. However, smaller livestock operations may be able to achieve a more effi cient digester scale by supplementing manure with food waste products or by sharing a digester with other small operations. In addi-tion, if the adoption of methane digesters by smaller operations is a policy goal, several tools exist—such as cost-share subsidies or tax incentives—that could be used to encourage their adoption by small farms.
Additional revenues from the sale of carbon emissions reductions (offsets) could substantially increase the number of operations that would adopt a biogas recovery system. Findings in this study indicate that a carbon price of $13 per metric ton of carbon dioxide equivalent emissions (an initial price estimated under one scenario for a nationwide cap-and-trade program for greenhouse gases) would:
• induce dairy and hog operations to supply offsets equivalent to about 22 million tons of carbon dioxide annually, amounting to about 62 percent of the current greenhouse gas emissions from manure management in these industries, or about 5 percent of total greenhouse gas emissions from the U.S. agricultural sector
• allow dairy and hog operators as a group to earn up to $1.8 billion in additional profi ts over 15 years from installing methane digesters.
Currently, the price of electricity and onfarm electricity expenditures are key determinants of digester profi tability. However, when carbon prices are above $4 per metric ton of CO2 equivalent emissions, carbon offset sales comprise a larger source of digester revenue than electricity generation. At a price of $13 per metric ton of CO2 equivalent emissions, revenues from emission reduction sales (offsets) contribute 66 percent of gross digester revenues for all dairy and hog operations, electricity sales contribute 8 percent, and cost savings from avoided energy expenses contribute the remaining 26 percent.
At higher carbon prices, the distribution of profi ts from digesters refl ects the location of large-scale operations and the prevalence of lagoons. Among States with the greatest number of dairies, the study fi nds that California, New York, Wisconsin, and Texas each have at least 100 such operations that would fi nd it profi table to adopt a digester at a carbon price of $13 per metric ton of CO2 equivalent emissions. At the same price, North Carolina, Illinois, Indiana, Missouri and Oklahoma each have at least 100 hog farm operators who would fi nd a methane digester profi table.
How Was the Study Conducted?
We used a model of digester profi tability to estimate how farm size, manure management methods, electricity prices, and carbon prices affect producers’ decisions to adopt biogas recovery systems. Hog and dairy producers are assumed to adopt a digester if the present value of the discounted stream

vClimate Change Policy and the Adoption of Methane Digesters on Livestock Operations / ERR-111
Economic Research Service/USDA
of profi ts (the net present value) is positive. Profi ts derive from electricity generation and carbon emission reductions sales less the digester construction and maintenance costs. Using case study information, we parameterized the model. Electricity price data are drawn from the U.S. Department of Energy, and methane emissions are estimated using State-level Intergovernmental Panel on Climate Change emission coeffi cients.
By computing the present value of digester profi ts for every farm in nation-ally representative samples of dairy and hog operations (USDA’s Agricultural Resource Management Survey or ARMS), we used the model to provide an estimate of the number, size, and location of farms that would fi nd it profi t-able to adopt a digester at any given carbon price. ARMS is conducted by USDA’s National Agricultural Statistics Service (NASS) in conjunction with the Economic Research Service. By predicting which operations would earn profi ts from digester adoption and then summing the reduction in tons of carbon dioxide equivalent emissions, it is possible to estimate the relationship between the price of carbon and the amount of emissions reduced by methane digesters on dairy and hog operations. We used the model to estimate how the present value of farm revenues changes with the carbon price and to simulate the effect of surplus electricity prices and Government cost-share policies on the potential supply of carbon emissions reductions.
1Climate Change Policy and the Adoption of Methane Digesters on Livestock Operations / ERR-111
Economic Research Service/USDA
Introduction
Methane digesters, also known as “anaerobic digesters,” “biodigesters,” or “biogas recovery systems,” can be used to capture and burn methane from lagoon or pit manure-storage facilities. With lagoons (ponds surrounded by earthen berms), covers are installed to capture the methane. With pits (concrete or metal tanks located above or below ground), manure can be more easily heated to maximize methane production. Manure is collected and transported to the digester, where the water, nutrients, and heat are adjusted to optimize methane output. Digesters capture the biogas, treat it, and send it to a boiler or electricity generator.
Methane digesters can provide numerous benefi ts to livestock producers and the environment. Digesters can supply a renewable source of electricity that can be used on the farm or sold to the electricity distribution grid. Digesters can reduce greenhouse gas emissions, odors from manure, and the potential for surface water contamination. They can also be used to recycle manure solids for animal bedding material. Despite their benefi ts, digesters have not been widely adopted, mainly because the costs of constructing and main-taining these systems have exceeded the benefi ts accruing to operators. Currently, there are 157 methane digesters operating in the United States, of which 126 are on dairies and 24 are on hog operations (U.S. EPA, 2010a).
Digesters have received more attention lately because of their ability to reduce greenhouse gas emissions from livestock manure. Lagoon and pit manure handling systems that are common on dairy and hog operations emit large amounts of methane. Methane is a potent greenhouse gas (GHG). Burning 1 ton of methane is equivalent to eliminating about 24 tons of carbon dioxide (IPCC, 2007, table 2.14).1 There are a number of policies that could provide fi nancial incentives for farmers to use a digester to reduce methane emissions, and the likely impacts on the environment and farm structure vary depending on the policy approach. One approach for controlling GHG emis-sions that requires relatively little direct Government fi nancial support is to establish a market for GHG emissions reductions, or “carbon offsets.”
An offset market allows livestock producers who reduce methane emissions to sell these reductions to other greenhouse gas emitters who face emissions caps or who voluntarily wish to offset their own emissions. Currently, only a few U.S. livestock operators sell offsets in regional or voluntary carbon markets. This is partly because the carbon prices in these markets have been low. Future efforts to reduce greenhouse gas emissions could result in substantially higher carbon prices. Prospects for a national carbon offset market within a cap-and-trade framework are uncertain. However, 10 Eastern States currently have a regional offset market (Regional Greenhouse Gas Initiative) and 7 other States are developing a regional cap-and-trade system (Western Climate Initiative).
Farmers who adopt methane digesters could profi t from higher carbon prices. However, there is likely to be wide variation in the scale, location, and char-acteristics of the farm operations that would benefi t from having methane digesters. The main benefi ciaries would be producers whose farm operations emit substantial quantities of methane, particularly dairy and hog operations
1A single ton of released methane has the same global warming poten-tial as 25 tons of carbon dioxide (over 100 years). Burning a ton of methane reduces its warming potential to the equivalent of 1 ton of carbon dioxide—a reduction equivalent to eliminating 24 tons of carbon dioxide. The global warming potential of 25 is based on the latest Intergovernmental Panel on Climate Change (IPCC) Fourth As-sessment Report (2007). Some other studies and the U.S. Environmental Protection Agency’s U.S. Greenhouse Gas Inventory Report use a global warming potential of 21 based on the earlier IPCC Second Assessment Report (1996). While the older value from the Second Assessment Report has been retained in the U.S. inventory calculations so that results are compa-rable across years (U.S. EPA, 2010b, pp. 7-8), we use the most recent IPCC value in this analysis.

2Climate Change Policy and the Adoption of Methane Digesters on Livestock Operations / ERR-111
Economic Research Service/USDA
with lagoon or pit manure storage facilities. Among these, larger scale opera-tions likely would profi t more from higher carbon prices because constructing and operating larger digesters is generally more cost-effective. As a result, valuing emission reductions could have signifi cant effects on the long-term structure of the livestock industry. Smaller operations may be shut out of the profi ts of an expanded carbon offset market unless ways are found to promote the adoption of digesters on small-scale operations.
In addition to these structural implications, understanding the extent to which the agricultural sector, and livestock in particular, participates in offset markets is important because of the effect this will have on “capped” indus-trial sectors and on agricultural producers. The supply of offsets will help determine the price of carbon emission permits and hence the costs that the “capped” industries face in meeting their emissions permit requirements. For livestock producers, the offset revenues could provide an additional source of income that could compensate them for higher feed or energy costs resulting from climate legislation. In this report, we explore how the carbon price could infl uence the supply of carbon offsets from the livestock sector. We also estimate the level and geographical distribution of income from carbon offset sales at different carbon prices.
3Climate Change Policy and the Adoption of Methane Digesters on Livestock Operations / ERR-111
Economic Research Service/USDA
Dairy, Hog Operations Produce Most Manure Methane
Livestock generate large amounts of manure that must be stored, spread on fi elds, or moved off-farm. Manure mixed with water is often stored in lagoons, ponds, tanks, or pits, creating anaerobic (i.e., without oxygen) condi-tions. The decomposition of livestock or poultry manure without oxygen produces a biogas containing about 60 percent methane.2 When manure is handled as a solid or deposited on fi elds, it tends to decompose aerobi-cally (i.e., with oxygen) and produces much less methane. The quantity of methane released also depends on climate (temperature and rainfall) and the conditions under which manure is managed (oxygen level, water content, pH (acidic or basic qualities) level, and nutrient availability).
In 2008, the U.S. agricultural sector was responsible for 6.1 percent of total U.S. greenhouse gas emissions (U.S. EPA, 2010b, p 2-12).3 Methane emis-sions from manure management were responsible for about 10.5 percent of these agricultural emissions.4 Dairy cattle and swine producers, who often use anaerobic manure management systems, were responsible for 43.1 percent and 43.6 percent of methane emissions from manure management, respec-tively (U.S. EPA, 2010b, table 6-6).5 Beef cattle, sheep, poultry and horses were collectively the source of only 13.3 percent of total manure methane, mainly because manure from these animals is usually handled in aerobic conditions.6 Geographic shifts and increasing scale of production have led to a greater share of dairy cattle and swine being raised in facilities using anaer-obic storage facilities. This, in turn, has resulted in a substantial increase in methane emissions from manure handling—emissions increased 54 percent between 1990 and 2008 (U.S. EPA, 2010b, table 6-2). By trapping and burning methane, digesters have the potential to substantially reduce green-house gas emissions from manure management.7
2The remaining gas consists primarily of carbon dioxide, plus small amounts of other gases, including hydrogen sul-fi de, ammonia, and nitrous oxide.
3This is the total for the “Agricul-ture” sector, as defi ned by the United Nations Framework Convention on Cli-mate Change (UNFCCC). This total does not include emissions from inputs to agricultural production that are attributed to other sectors, including fertilizer production, transportation, and electricity generation.
4Livestock also emit methane from enteric fermentation produced during digestion. In 2008, over three times as much methane was released from enteric fermentation as from manure manage-ment (U.S. EPA, 2010, table 2-8).
5Manure management in the dairy and hog industries accounts for 0.6 percent of total U.S. greenhouse gas emissions.
6Poultry (layers and broilers) opera-tions generally have lower associated methane emissions than swine or dairies because poultry manure is often handled aerobically. However, some poultry operations (particularly lay-ers) store manure in pits or anaerobic lagoons, which can result in substantial methane emissions (NRC, 2003).
7Burning digester biogas can create and destroy other greenhouse gases in addition to methane and carbon diox-ide. Among these other gases, nitrous oxide (with a global warming potential 298 times that of carbon dioxide) may be the most important. Nitrous oxide is emitted from manure handling facili-ties and is also emitted when biogas is burned. The net effect of burning biogas on net greenhouse gas emissions from gases other than methane and carbon dioxide is not well established in the scientifi c literature.
4Climate Change Policy and the Adoption of Methane Digesters on Livestock Operations / ERR-111
Economic Research Service/USDA
Climate Change Policies Could Spur Digester Adoption
There are several possible policy approaches to mitigate greenhouse gases, and each could have different implications for livestock producers and their decisions to adopt methane digesters. One approach is to place controls on individual emitters by regulating the production technologies that can be used. Livestock producers, as emitters of greenhouse gases, might be required to adopt specifi c technologies that would reduce emissions, such as lagoon covers that collect and burn methane. Even if livestock producers were not subject to such “technology standards,” it is possible that utility compa-nies would be, resulting in higher energy costs being passed along to farmers. Such a rise in energy costs would make digester-generated electricity more valuable to farmers, who would save more by generating their own electricity.
Another approach is to encourage adoption of mitigation technologies through subsidies or other incentives. In the case of digesters, incentives could take the form of grants, cost shares, incentive payments, and State or Federal tax credits or exemptions. As discussed later in this paper, there are several existing programs providing incentives for livestock producers to adopt methane digesters. Many existing incentive programs are designed to promote renewable energy, in addition to lowering GHG emissions.8
A third policy approach is to tax greenhouse gas emissions directly or to tax them indirectly by taxing commodities based on their “carbon content.”9 Emissions from livestock operations or livestock products such as dairy products and meat could, in theory, face such a carbon tax. Even if livestock producers or products were not taxed, electricity and petroleum-based fuels could be taxed, which would raise energy costs for livestock producers. Again, this would make digester-generated electricity more valuable, and consequently would encourage digester adoption.
A fourth approach is to pay farmers for emissions reductions. Farmers could be compensated with Government payments or carbon offset sales. In an offset market, farmers sell emissions reductions to individuals or fi rms who wish to “offset” their own emissions. To be eligible as a carbon offset, emis-sions reductions generally must meet several criteria, including:
1. additional to “business as usual”—the reductions would not have occurred without the offset sales
2. accurate—the reductions must be verifi able by a third party
3. permanent—the emissions reductions from the offset project are not reversible.
Emissions reductions resulting from the burning of manure methane can satisfy all of these requirements. Offsets are measured in tons of carbon dioxide equivalent emissions (reductions in other greenhouse gases such as methane are converted to an equivalent quantity of carbon dioxide based on their global warming potential).
8Policies that increase the selling price of electricity would increase incentives to adopt a digester, but could result in unintended consequences for GHG emissions. For example, these policies could provide an incentive to convert from an aerobic to an anaero-bic digester or to heat a digester so as to increase methane emissions and therefore electricity output. This could potentially increase GHG emissions as more methane is created and burned.
9A carbon content tax would be levied at a rate proportional to the quantity of carbon-equivalent GHGs emitted during the production process.

5Climate Change Policy and the Adoption of Methane Digesters on Livestock Operations / ERR-111
Economic Research Service/USDA
Carbon offsets can be exchanged in compliance or voluntary markets. Compliance markets usually operate in conjunction with a cap-and-trade regime that places a legal limit on the quantity of greenhouse gases that can be emitted by regulated fi rms in a particular time period. Under such a system, regulated fi rms must obtain permits to emit greenhouse gases. To meet their emissions targets, regulated fi rms can reduce their own emissions or purchase permits from other “capped” fi rms. Alternatively, when regula-tions permit, fi rms could pay nonregulated emitters—such as livestock opera-tions—to reduce emissions (i.e., the fi rms could purchase offsets).
Compliance markets have been established at the international, national, and regional levels. Regimes that govern international compliance markets include the Kyoto Protocol and the European Union’s Emissions Trading Scheme. In the United States, 10 eastern States recently implemented the Regional Greenhouse Gas Initiative (RGGI), the fi rst domestic mandatory market-based effort to reduce greenhouse gas emissions. Under the RGGI, the capped sector (power generation) can purchase emission offsets from other sectors, such as agriculture, that reduce or sequester greenhouse gas emissions. Projects that reduce methane emissions from manure management are eligible for offset allowances. In 2009, the U.S. House of Representatives approved climate change legislation (H.R. 2454) that, if signed into law, would have established a national cap-and-trade system and provided an opportunity for farmers to sell offsets from reducing their manure methane emissions.
Voluntary offset markets function outside of compliance markets and allow companies and individuals to voluntarily purchase carbon offsets. For example, individuals might seek to offset their travel-related emissions or “green” fi rms might seek to compensate for emissions related to their production. In the United States, the Chicago Climate Exchange (CCX) is a voluntary, but legally binding, carbon trading regime. In this privately admin-istered cap-and-trade system, methane emissions reductions from livestock operations can qualify as offset projects.
Depending on the price of carbon, the additional income from offset sales could substantially increase the number of livestock producers who would fi nd it profi table to install methane digesters.

6Climate Change Policy and the Adoption of Methane Digesters on Livestock Operations / ERR-111
Economic Research Service/USDA
Boosting Benefi ts Over Costs Would Encourage Methane Digester Adoption
The decision to adopt a digester depends on the price of electricity, onfarm electricity expenditures, the ability to sell electricity not used on the farm, the manure management method employed, the size of the operation, the startup and ongoing costs of the technology, and the value of other benefi ts such as odor reduction, reduced risk of water and air pollution, and the sale of separated digester solids. Government policies, such as digester cost-share programs or policies that create a demand for electricity from renewable sources, can affect the economic feasibility of methane digesters. The price of carbon in a carbon offset market could play a role in a digester adoption decision.
We developed a farm-level investment model to estimate how many of these multiple factors infl uence methane digester profi ts and adoption, and what the supply of carbon offsets would be from the livestock sector. In the model, profi ts from a digester are equal to the returns from electricity generation and the sales of carbon offsets less the costs associated with constructing and maintaining the digester. Hog and dairy producers are assumed to adopt a digester and sell carbon offsets if doing so has a positive net present value (NPV). The NPV is the sum of all cash fl ows (e.g., revenues from electricity and carbon offsets minus capital and variable costs) over the life of the project (assumed to be 15 years), where the cash fl ow in each year is discounted to its present value.
The model is parameterized using cost and production information derived from several recent case studies of digesters installed on dairy and hog operations. Other livestock sectors were not considered because of a lack of data and the relatively limited contribution of other sectors to total manure methane emissions (U.S. EPA, 2010b). Electricity price data are drawn from the U.S. Department of Energy, and methane emissions are estimated using State-level emission coeffi cients based on Intergovernmental Panel on Climate Change (IPCC) methods.
For a livestock operation of a given size, type and location, the model provides an estimate of the NPV of the digester. By estimating NPV for every farm in nationally representative samples of dairy (2005) and hog operations (2004) (using USDA’s Agricultural Resource Management Survey (ARMS)), the model predicts which farms would adopt a digester at any given carbon offset price. ARMS is conducted by USDA’s National Agricultural Statistics Service in conjunction with the Economic Research Service. By summing the reduction in tons of carbon dioxide equivalent emissions for farms that would adopt a digester (i.e., farms on which a digester has a positive NPV), we can estimate the relationship between the price of carbon and the total level of emissions reduced by methane digesters on dairy and hog operations. The ARMS survey weights allow us to extrapolate these estimates to the national level. The model also is used to estimate how farm revenues change with the carbon offset price and to simulate the effect of surplus electricity prices and Government cost-share policies on the potential supply of carbon offsets. More detailed information about the model specifi cation, case studies, data, and parameters is given in the appendix (p. 32).

7Climate Change Policy and the Adoption of Methane Digesters on Livestock Operations / ERR-111
Economic Research Service/USDA
Electricity—Prices, Onfarm Use, and Sales of Surplus—Is a Key to Digester Profi tability
The price of electricity is a key factor determining methane digester profi t-ability because the price determines the cost savings from farm-generated elec-tricity and the revenues that can be earned from the sale of surplus electricity. Electricity prices vary substantially across the country (table 1). For example, because of different retail electricity prices, the electricity generated in 1 year by a 1,000-head dairy with a pit-based digester would be worth approxi-mately $56,300 (retail) in Wisconsin compared with $77,500 in California. The amounts were calculated using 2009 electricity prices for the industrial sector—$0.0921 per kilowatt hour for California and $0.067 per kilowatt hour for Wisconsin (U.S. DOE, 2010). If farms are able to sell surplus electricity to the grid, then the higher electricity prices provide operators with a greater incentive to adopt biogas collectors.
If operations are unable to sell surplus electricity back to the grid, then the benefi ts from electricity generation are limited to the avoided onfarm energy costs associated with heating or cooling, drying grain, pumping water, lighting, and operating dairy or other machinery. Onfarm energy expen-ditures per head also vary widely across regions because of differences in climate and production technologies (see table 1). Data from the 2005 ARMS dairy survey indicate that a 1,000-head dairy in Wisconsin typically spends about $125,700 per year on energy (electricity, natural gas, and propane; amount updated to 2009 dollars), which exceeds what it could generate onfarm ($56,300). In contrast, a 1,000-head California dairy typically spends about $53,600 on energy (2009 dollars), so it would use less than the energy it could generate ($77,500). Consequently, without the ability to sell surplus electricity, farms in California would receive only a fraction of their gener-ated electricity’s potential value. In this example, the farm in Wisconsin would have a greater incentive to adopt a biogas recovery system than the farm in California, despite having lower electricity prices.
Table 1
Electricity use and price, by region and commodity
Dairy Hogs
Average electricity use
per farm (kWh)
Average electricity use
per head (kWh)
Average electricity price
($/kWh)
Average electricity
use per farm (kWh)
Average electricity use
per head (kWh)
Average electricity price
($/kWh)
United States 128,918 1,048 0.069 67,122 158 0.058
West 288,702 893 0.058 7,007 105 0.058
Midwest 101,175 1,102 0.064 64,493 152 0.058
South 159,349 791 0.065 148,651 260 0.055
Northeast 106,418 1,080 0.085 32,264 77 0.072
kWh = kilowatt hour, unit of energy equal to the work done by a power of 1,000 watts operating for 1 hour.
Note: For dairies, a "head" refers to a dairy cow or heifer; for hog operations, a "head" refers to 250 pounds of live weight.
Regions are defi ned according to U.S. Census of Population and Housing; see www.census.gov/geo/www/us_regdiv.pdf/.
Source: USDA, Agricultural Resource Management Survey, NASS and ERS; for hogs, 2004, and for dairy, 2005.
8Climate Change Policy and the Adoption of Methane Digesters on Livestock Operations / ERR-111
Economic Research Service/USDA
One potential problem with using electricity from biogas facilities is that the onfarm quantity generated may not match onfarm electricity requirements. The quantity generated may fl uctuate over the day, month, or year depending on temperature, infl ows of manure, machine malfunctions, etc. Similarly, onfarm electricity use fl uctuates over time. “Net metering” laws mitigate this problem to a large extent by allowing small-scale generators to obtain the full retail value for the electricity they generate. Under net metering laws, when surplus electricity is produced onfarm, the electricity meter spins backwards, effectively “saving” the electricity until it is needed. Over the billing period, the operation is only billed for its net electricity usage. Recently there has been a rapid adoption of net metering laws, and these laws are currently on the books in more than 40 States (DSIRE, 2010).
Operations that generate more electricity than they consume over a billing period may be able to sell their surplus electricity to the utility at a negoti-ated price. The price received for this electricity (the selling price) may be different from the price at which they buy electricity (the retail price). The ability to sell surplus electricity and the selling price vary regionally. Recent laws and trends suggest that an increasing number of livestock operations may be able to sell electricity at retail or higher prices. Since manure-derived electricity is from a renewable source, the negotiated price for surplus elec-tricity could enjoy a substantial premium over the wholesale price (the price that utilities pay for electricity from large-scale generators). About 30 States require utilities to purchase a share of their power from renewable sources, including biogas systems (U.S. DOE, 2009).
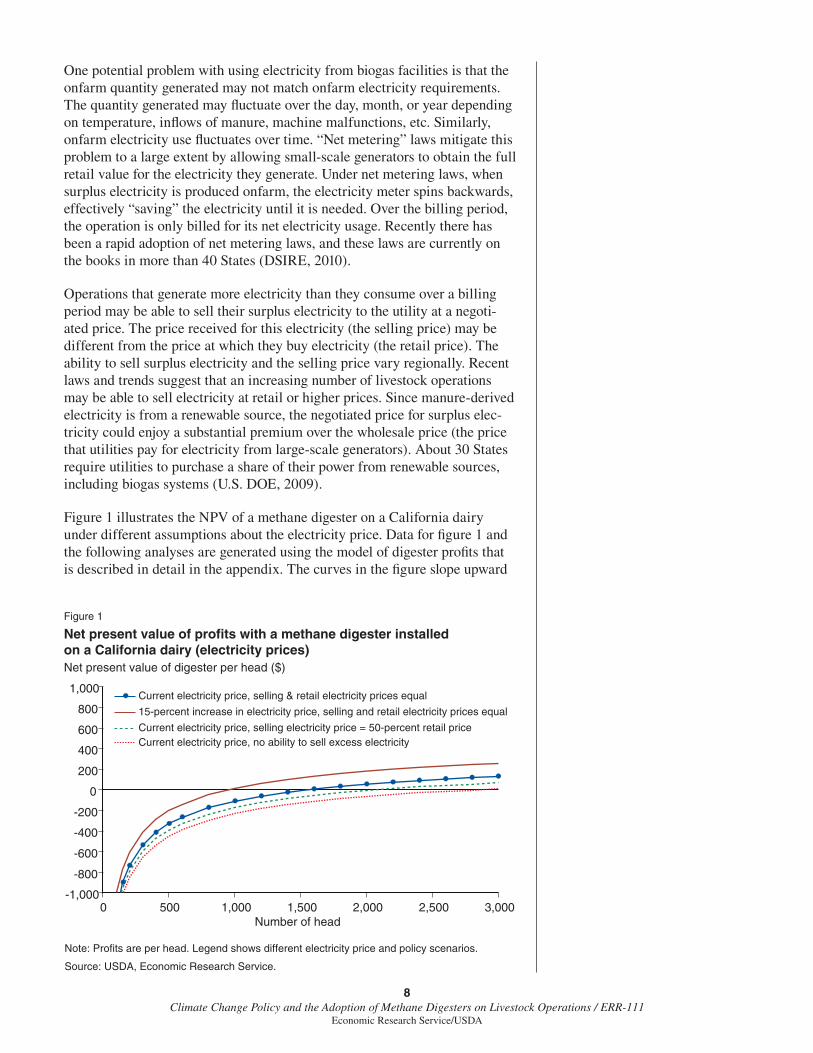
Figure 1 illustrates the NPV of a methane digester on a California dairy under different assumptions about the electricity price. Data for fi gure 1 and the following analyses are generated using the model of digester profi ts that is described in detail in the appendix. The curves in the fi gure slope upward
Figure 1
Net present value of profits with a methane digester installed on a California dairy (electricity prices)Net present value of digester per head ($)
Note: Profits are per head. Legend shows different electricity price and policy scenarios.
Source: USDA, Economic Research Service.
Number of head
-1,000
-800
-600
-400
-200
0
200
400
600
800
1,000
0 500 1,000 1,500 2,000 2,500 3,000
Current electricity price, selling & retail electricity prices equal
15-percent increase in electricity price, selling and retail electricity prices equal
Current electricity price, selling electricity price = 50-percent retail priceCurrent electricity price, no ability to sell excess electricity

9Climate Change Policy and the Adoption of Methane Digesters on Livestock Operations / ERR-111
Economic Research Service/USDA
showing that the returns per head from operating a digester increase with the size of the operation. We discuss the reasons for and implications of the increasing returns to scale in the next section. Operators for whom a digester has a positive NPV could be expected to install a digester, while those for whom the project has a negative NPV would not.
For all the scenarios shown in the fi gure, it is assumed that operations can obtain the full retail value for their electricity up to the amount of electricity they use onfarm. In other words, we are effectively assuming that operations operate under “net metering” laws. The blue line shows the case where the selling price of electricity equals the retail price. In this case, farms having more than about 1,561 head would earn positive profi ts from adopting a methane digester. The brown line shows how the NPV changes if electricity prices increase by 15 percent, perhaps because of climate change policy. In this case, the electricity costs saved and the potential revenue from electricity sales would both increase, making digester technology more profi table at all farm sizes. At the higher electricity price, the size at which farms would earn profi ts from adopting a digester would fall to about 944 head.
Figure 1 also shows that the price of surplus electricity can have a substan-tial effect on digester profi ts and adoption. Data from the 2005 ARMS dairy survey indicate that California dairies on average consume 86 percent of the electricity that they could generate from digesters. The additional 14 percent of the electricity generated could be sold off-farm, but if the price were only 50 percent of retail (green line), this reduces the economic feasi-bility of digesters for smaller operations. In this scenario, no California dairies below about 2,058 head would fi nd it profi table to adopt a digester. Profi ts would be even lower if dairies had no ability to sell surplus elec-tricity to the grid (effectively setting the selling price to zero). In this scenario (red line), no California dairies below 2,816 head would fi nd existing digester technology profi table.
Carbon Price Could Play Major Role in Digester Adoption Decision
The sales of carbon offsets provide a potential second source of revenues from methane digesters. Under a cap-and-trade system, the amount of revenue generated from offsets will depend on the market price of carbon and the amount of methane generated, which is a function of farm size, manure management method, and climate, among other things.
Figure 2 illustrates the present value of the additional profi ts that could be earned by installing a biogas recovery system on a California dairy with a pit manure storage facility at three different carbon prices. In this scenario we assume equal retail and selling electricity prices. The blue line illus-trates the NPV when there is no market for offsets—i.e., when the carbon price is zero. In this case, the NPV is negative for all California dairies with pit-based manure management and fewer than 1,561 head, so we would not expect any farms in this size range to adopt the technology unless there were other signifi cant co-benefi ts or policies to subsidize costs.10 In contrast, if the carbon price were $13 per metric ton of carbon dioxide equivalent emissions (brown line), operations with an inventory greater than about 544 head would
10In fact, in 2010 there were 15 oper-ating digesters on dairies in California, of which 3 are pit-based (U.S. EPA, 2010). Many of these operations likely qualifi ed for cost subsidies or enjoyed other co-benefi ts that were not included in the investment model.

10Climate Change Policy and the Adoption of Methane Digesters on Livestock Operations / ERR-111
Economic Research Service/USDA
fi nd it profi table to adopt a biogas system.11 If the carbon price were to double to $26 per metric ton, then the break-even size falls even lower, to less than 265 head.
The fi gure illustrates the sensitivity of the decision to adopt a biogas recovery system to the carbon price. At the same time, there is a great deal of uncer-tainty about the future price of carbon. In the major international compliance markets, carbon offset prices have ranged between $15 and $30 per ton of carbon dioxide equivalent emissions in the last decade. In voluntary markets, prices have generally been somewhat lower: ranging between $5 and $15 per ton. In the United States, offset prices have been much lower. The average price for carbon allowances in the RGGI has ranged between $1 and $3 per ton since its inception in 2008.12 The CCX carbon price has ranged between $1 and $7 per ton since 2004, but has been trading under $1 per ton since 2009.13 There is a great deal of uncertainty as to the eventual carbon price under a national cap-and-trade system. The EPA forecasted in 2009 that, in the near term, if the House bill (H.R. 2454) were to be enacted it would have resulted in a price of $13 per ton of carbon dioxide equivalent emissions (U.S. EPA, 2009). However, the carbon price could fall short of or exceed this level over the medium or long term.
Existing Types of Manure Storage and Handling Favor Southern Farms for Offset-Program Qualifi cation
The revenues that a livestock operation could earn in an offset market depend on the type of manure storage and handling facility that an operation has been using. Offset programs usually require that only emission reductions that are additional to current laws, regulations, or practices qualify to be sold as offsets (U.S. EPA, 2008). A key requirement in most offset programs is documentation of baseline emissions and certifi cation that offsets have led
11The price $13/ tCO2e was used by the EPA in its core scenario analysis of H.R. 2454 (U.S. EPA, 2009).
12See Regional Greenhouse Gas Ini-tiative, Market Monitor Reports, http://www.rggi.org/market/market_monitor /.
13See Chicago Climate Exchange, CXX Carbon Financial Instrument Contracts Daily Report, http://www.chicagocli-matex.com/market/data/summary.jsf /.
Figure 2
Net present value of profits with a methane digester installed on a California dairy (carbon prices)Net present value of digester per head ($)
Note: Profits are per head. Legend shows different carbon price scenarios.
Source: USDA, Economic Research Service.
Number of head
-1,000
-800
-600
-400
-200
0
200
400
600
800
1,000
0 500 1,000 1,500 2,000 2,500 3,000
Carbon price = $0/ton
Carbon price = $13/ton
Carbon price = $26/ton

11Climate Change Policy and the Adoption of Methane Digesters on Livestock Operations / ERR-111
Economic Research Service/USDA
to “additional” emissions reductions. Consequently, only operations that had been using an anaerobic manure storage facility before the creation of an offset market would likely qualify for an offset program.14 This limits the pool of potential offset market participants to swine and dairy operations with manure ponds, lagoons, or slurry pit systems. Operations with slab or shed manure systems or with no manure storage facilities likely would not generate suffi cient methane to satisfy the “additionality” requirements for offset certifi cation.15 We estimate that up to 42 percent of dairies and 54 percent of hog operations have manure management systems that could qualify for an offset program, with Southern States having a higher preva-lence of qualifying farms (table 2). However, a much larger share of produc-tion occurs on qualifying farms, especially for hog operations. We estimate that 60 percent of dairy production and 92 percent of swine production occurs on farms with either pit or lagoon systems.
The type of manure storage facility used determines the baseline methane emitted and, consequently, the quantity of offsets that could be generated and the profi ts that could be earned from a methane digester. Lagoon systems generally emit higher rates of methane per head than pit systems, and opera-tions in warmer climates emit more than those in cooler climates. About 8 percent of dairies and 14 percent of hog operations have only a lagoon, compared with 31 percent and 38 percent, respectively, with only a pit (about 2 percent of operations have both) (see table 2). While pits are more preva-lent, larger operations tend to use lagoons more often so that almost a quarter of all dairy cows and more than third of hogs are raised on operations using only lagoons.
Different types of manure storage facilities also have a range of associated digester construction and operating costs. In general, earthen lagoon digester systems are less costly than complete-mix or plug-fl ow pit systems, which are constructed from concrete or steel. However, lagoon digesters can be
14Construction of an anaerobic digester on an operation currently producing little methane from its manure handling practice may not result in a net reduction in greenhouse gas emissions. In fact, construction of an anaerobic digester would likely increase emissions on the operation, though the subsequent burning of the methane to generate electricity could offset this increase.
15We assume in the model that the initial level of methane emissions determines the “baseline” level of emissions. Emission reductions below the baseline can be sold as offsets. If the number of head on an opera-tion changed over time then program rules would need to establish how the baseline emission levels would change, if at all. This study does not consider scenarios where the number of head of livestock on farms changes over time.
Table 2
Percentage of operations with different types of manure management systems, by region and commodity
Total number of
farmsPercentage
of farms
Percent of farms with… Percentage of
production
Percent of production with…
Lagoon PitLagoon and pit Lagoon Pit
Lagoon and pit
Dairy
United States 52,237 100.0 8.1 30.9 2.6 100.0 24.7 29.4 5.7
West 6,095 11.7 26.5 18.4 11.6 33.3 36.5 12.2 8.0
Midwest 28,438 54.4 4.3 34.4 1.5 36.4 13.7 45.3 4.8
South 4,034 7.7 22.5 25.9 4.6 9.2 40.5 17.3 8.8
Northeast 13,670 26.2 3.7 30.5 0.2 21.1 18.0 34.4 2.2
Hogs
United States 40,940 100.0 14.3 37.5 2.3 100.0 35.2 51.9 4.5
West 5,586 13.6 1.0 0.0 1.2 0.6 5.1 0.0 11.8
Midwest 28,539 69.7 9.9 50.3 2.8 71.9 17.7 69.4 5.8
South 5,571 13.6 53.1 4.4 1.3 25.5 87.7 0.9 0.9
Northeast 1,245 3.0 2.1 59.1 1.7 2.0 6.6 84.6 3.1
Note: Regions are defi ned according to U.S. Census of Population and Housing; see www.census.gov/geo/www/us_regdiv.pdf/.
Source: USDA, Agricultural Resource Management Survey, NASS and ERS; for hogs, 2004, and for dairy, 2005.

12Climate Change Policy and the Adoption of Methane Digesters on Livestock Operations / ERR-111
Economic Research Service/USDA
less productive in Northern States because of low ambient temperatures in the winter months. In cooler climates, pit systems can be heated to promote anaerobic digestion and methane production. However, emissions reductions can only qualify as carbon offsets if they are below the baseline level and the baseline emissions would not include the additional methane generated from heating the digester.
Figure 3 illustrates how the profi ts from a biogas recovery system can vary substantially across regions and across manure management systems. The fi gure compares the NPV per head for dairy operations in the two biggest dairy States, Wisconsin and California, when the carbon offset price is $13 (per ton of carbon dioxide equivalent emissions). For both States, opera-tions with lagoons are more profi table than operations with pit systems, mainly because lagoons have much higher initial emissions and conse-quently higher offset revenues. Lagoons also have lower construction and operating costs. For operations using the same type of manure storage facility, biogas systems are always more profi table in California compared with Wisconsin. This differential is partly explained by California’s warmer climate (which increases methane production) and partly by the higher elec-tricity prices in California.
While pit-based systems are generally more profi table without a carbon market, lagoon-based digester systems become relatively more profi table as the carbon price increases. Figure 4 compares the NPV per head of California pit- versus lagoon-based digester systems with carbon prices of $0 and $13 per ton. Without an offset market (price equal to $0), the pit-based system is more profi table, while at $13 the lagoon-based system has a higher NPV. This is due to the higher baseline methane emissions of lagoons, enabling more revenue from carbon offsets.
Figure 3
Net present value of profits for a methane digester installed on California or Wisconsin dairies (lagoons or pits)Net present value of digester per head ($)
Note: Profits are per head. Legend shows different manure management systems and States.
Source: USDA, Economic Research Service.
Number of head
-1,000
-800
-600
-400
-200
0
200
400
600
800
1,000
0 500 1,000 1,500 2,000 2,500 3,000
California, pit, carbon price = $13/tonCalifornia, lagoon, carbon price = $13/tonWisconsin, pit, carbon price = $13/tonWisconsin, lagoon, carbon price = $13/ton

13Climate Change Policy and the Adoption of Methane Digesters on Livestock Operations / ERR-111
Economic Research Service/USDA
Digesters’ Other Benefi ts Include Odor Reduction, Less Surface-Water Contamination
Biogas recovery systems can offer other benefi ts to livestock producers in addition to electricity generation and marketable emission reductions. Lagoon covers and well-managed anaerobic digestion can substantially reduce odors from manure storage (Welsh et al., 1977; Pain et al., 1990; Wilkie et al., 1995). Digesters can also be designed to reduce the potential for surface-water contamination from pathogens that can be hazardous to animal and human health (Demuynck et al., 1985). By excluding rainwater, a lagoon cover can substantially increase a lagoon’s storage capacity and thereby reduce the size or number of lagoons required per operation.16 An anaerobic digester also can be designed to accept food waste from local food processors or manure from other (local) farms, which can provide additional “fuel” for the digester and a potential source of revenue from “tipping fees” charged to the waste depositors (Bishop and Shumway, 2009).17 Farms that use a solids separator can use the collected solids onfarm for bedding material or sell them as a soil amendment, which can provide a signifi cant source of income (Leuer et al., 2008).
16See “Covers for Long-term Dairy Manure Storages, Part 2: Estimating your Farm’s Annual Cost and Benefi t.” at: http://www.ansci.cornell.edu/pdfs/pdFactSheetSC2PDv.pdf/.
17In the case study analyzed by Bish-op and Shumway (2009), accepting food waste was found to be profi table for the digester owner, while transpor-tation costs made accepting manure from local farms unprofi table.
Figure 4
Net present value of profits for a methane digester installed on California dairies (lagoons or pits; carbon prices = $0 or $13 per ton)Net present value of digester per head ($)
Note: Profits are per head. Legend shows different manure management systems and carbon prices.
Source: USDA, Economic Research Service.
Number of head
-1,000
-800
-600
-400
-200
0
200
400
600
800
1,000
0 500 1,000 1,500 2,000 2,500 3,000
California pit carbon price = $13/tonCalifornia, lagoon, carbon price = $13/tonCalifornia, pit, carbon price = $0/tonCalifornia, lagoon, carbon price = $0/ton
14Climate Change Policy and the Adoption of Methane Digesters on Livestock Operations / ERR-111
Economic Research Service/USDA
Scale of Livestock Operations Affects Benefi ts From Carbon Offsets
There is wide variation in the characteristics of producers who likely would benefi t from the introduction of a carbon offset market. The model of digester profi ts illustrates which producers might benefi t from a higher carbon price.
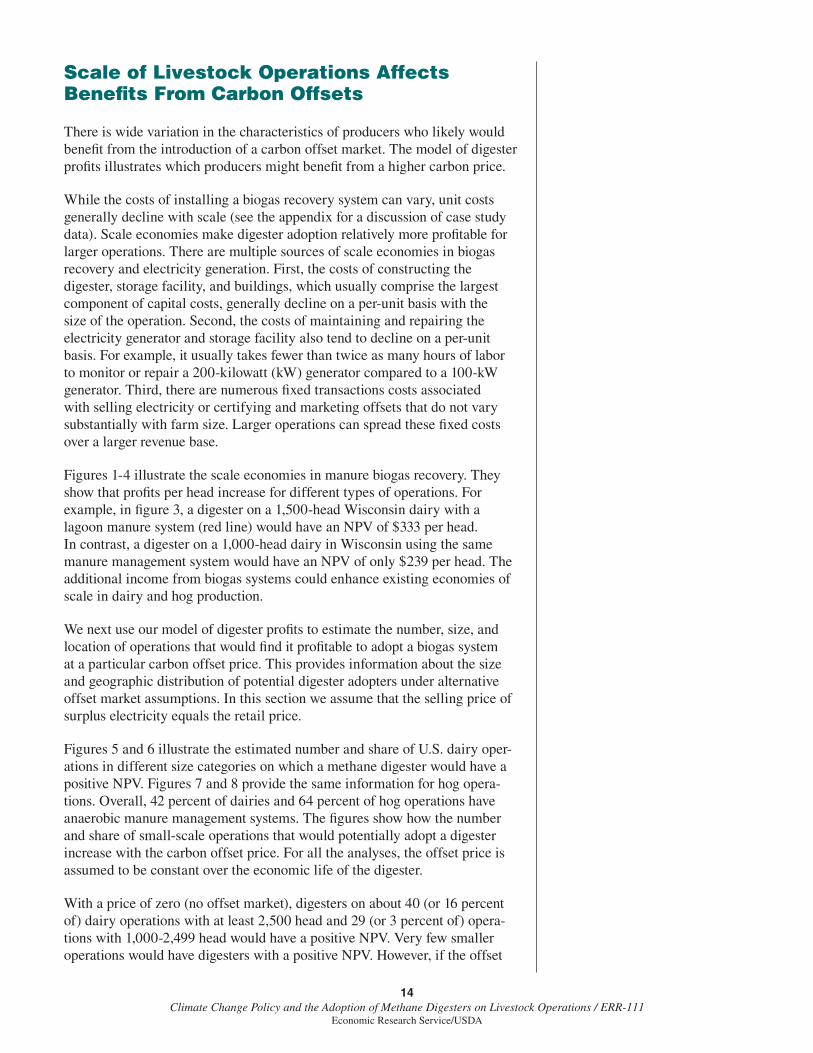
While the costs of installing a biogas recovery system can vary, unit costs generally decline with scale (see the appendix for a discussion of case study data). Scale economies make digester adoption relatively more profi table for larger operations. There are multiple sources of scale economies in biogas recovery and electricity generation. First, the costs of constructing the digester, storage facility, and buildings, which usually comprise the largest component of capital costs, generally decline on a per-unit basis with the size of the operation. Second, the costs of maintaining and repairing the electricity generator and storage facility also tend to decline on a per-unit basis. For example, it usually takes fewer than twice as many hours of labor to monitor or repair a 200-kilowatt (kW) generator compared to a 100-kW generator. Third, there are numerous fi xed transactions costs associated with selling electricity or certifying and marketing offsets that do not vary substantially with farm size. Larger operations can spread these fi xed costs over a larger revenue base.
Figures 1-4 illustrate the scale economies in manure biogas recovery. They show that profi ts per head increase for different types of operations. For example, in fi gure 3, a digester on a 1,500-head Wisconsin dairy with a lagoon manure system (red line) would have an NPV of $333 per head. In contrast, a digester on a 1,000-head dairy in Wisconsin using the same manure management system would have an NPV of only $239 per head. The additional income from biogas systems could enhance existing economies of scale in dairy and hog production.
We next use our model of digester profi ts to estimate the number, size, and location of operations that would fi nd it profi table to adopt a biogas system at a particular carbon offset price. This provides information about the size and geographic distribution of potential digester adopters under alternative offset market assumptions. In this section we assume that the selling price of surplus electricity equals the retail price.
Figures 5 and 6 illustrate the estimated number and share of U.S. dairy oper-ations in different size categories on which a methane digester would have a positive NPV. Figures 7 and 8 provide the same information for hog opera-tions. Overall, 42 percent of dairies and 64 percent of hog operations have anaerobic manure management systems. The fi gures show how the number and share of small-scale operations that would potentially adopt a digester increase with the carbon offset price. For all the analyses, the offset price is assumed to be constant over the economic life of the digester.
With a price of zero (no offset market), digesters on about 40 (or 16 percent of) dairy operations with at least 2,500 head and 29 (or 3 percent of) opera-tions with 1,000-2,499 head would have a positive NPV. Very few smaller operations would have digesters with a positive NPV. However, if the offset

15Climate Change Policy and the Adoption of Methane Digesters on Livestock Operations / ERR-111
Economic Research Service/USDA
Figure 5
U.S. dairy operations on which a methane digester has a positive net present value (three carbon prices)Number of dairies adopting
Notes: Numbers at higher prices are additive to those for lower prices; for example, at a price of $13/ton, an additional 491 operations of 1,000-2,499 head are predicted to adopt, for a total of 520 operations of this size. At a carbon price of $13/ton, no operation smaller than 250 head is predicted to adopt. At a carbon price of $0, no operation with fewer than 500 head and 2 operations of 500-999 head are predicted to adopt.
Source: USDA, Economic Research Service.
Operation size (number of head)
<250 250 - 499 500 - 999 1,000 - 2,499 2,500+0
200
400
600
800
1,000
1,200
1,400
Price = $0/ton
Price = $13/ton
Price = $26/ton
Figure 6
U.S. dairy operations that would profit from methane digestersPercentage of dairies in size range
Notes: Numbers at higher prices are additive to those for lower prices; for example, at a price of $13/ton, an additional 54 percent of operations with 1,000-2,499 head are predicted to adopt,for a total of 57 percent of operations of this size. At a carbon price of $13/ton, no operation smaller than 250 head is predicted to adopt. At a carbon price of $0, no operation with fewer than 500 head and 0.1 percent of operations with 500-999 head are predicted to adopt.
Source: USDA, Economic Research Service.
Operation size (number of head)
<250 250 - 499 500 - 999 1,000 - 2,499 2,500+0
20
40
60
80
100
Price = $0/tonPrice = $13/tonPrice = $26/ton
No adoption at these prices among potential adoptersNot potential adopters
16Climate Change Policy and the Adoption of Methane Digesters on Livestock Operations / ERR-111
Economic Research Service/USDA
price were $13, then digesters on nearly half of operations with more than 500 head and about 15 percent of operations with between 250-499 head would have a positive NPV. If the price were to increase to $26, then the number of digesters with a positive NPV would increase for all farm size
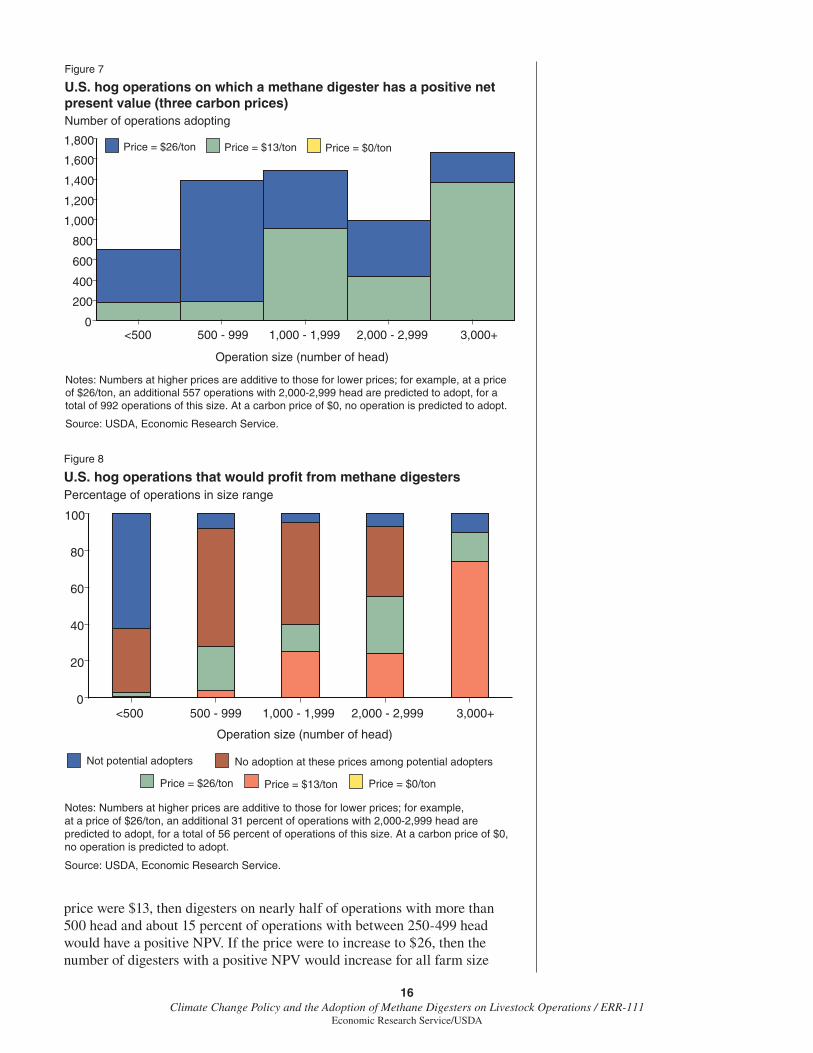
Figure 7
U.S. hog operations on which a methane digester has a positive netpresent value (three carbon prices)Number of operations adopting
Notes: Numbers at higher prices are additive to those for lower prices; for example, at a price of $26/ton, an additional 557 operations with 2,000-2,999 head are predicted to adopt, for a total of 992 operations of this size. At a carbon price of $0, no operation is predicted to adopt.
Source: USDA, Economic Research Service.
Operation size (number of head)
Price = $0/tonPrice = $13/tonPrice = $26/ton
<500 500 - 999 1,000 - 1,999 2,000 - 2,999 3,000+0
200
400
600
800
1,000
1,200
1,400
1,600
1,800
Figure 8
U.S. hog operations that would profit from methane digestersPercentage of operations in size range
Notes: Numbers at higher prices are additive to those for lower prices; for example, at a price of $26/ton, an additional 31 percent of operations with 2,000-2,999 head are predicted to adopt, for a total of 56 percent of operations of this size. At a carbon price of $0, no operation is predicted to adopt.
Source: USDA, Economic Research Service.
Operation size (number of head)
0
20
40
60
80
100
Price = $0/tonPrice = $13/tonPrice = $26/ton
No adoption at these prices among potential adoptersNot potential adopters
<500 500 - 999 1,000 - 1,999 2,000 - 2,999 3,000+
17Climate Change Policy and the Adoption of Methane Digesters on Livestock Operations / ERR-111
Economic Research Service/USDA
categories except the largest (the number of profi table digesters on large farms does not increase because all large farms having either a pit or lagoon manure system already earned profi ts at the lower price). If carbon offsets could be sold for $26 per ton, then about 1,295 or 3 percent of operations in the smallest size category (< 250 head) would experience positive profi ts.
For hog operations, the positive relationship between farm size and digester profi tability is illustrated in fi gures 7 and 8. With an offset price of $13 per ton, 74 percent of the operations with more than 3,000 head fi nd a digester profi table compared to only 24 percent of operations with 2,000-2,900 head, 25 percent of those with 1000-1,999 head, 4 percent of those with between 500 and 999, and 2 percent of operations with less than 500 head. The pattern is similar at the higher carbon price of $26.
Without a carbon offset market, no hog operations are estimated to earn posi-tive profi ts from a digester compared to 71 dairies. This is consistent with the fact that there are currently a much greater number of dairies than hog opera-tions with biogas systems in the United States (U.S. EPA, 2010a). However, at a higher carbon price ($13 per ton), over 7.5 percent of all hog operations would fi nd a digester profi table, compared to 3.5 percent of dairies. This higher rate is partly explained by the fact that a greater share of hog opera-tions have lagoons, which have higher initial methane emissions and are eligible for more offset sales (see table 2).
A substantial share of operations (especially in the smallest size category) lack an anaerobic manure management facility (fi gs. 6 and 8). While these operations could construct a digester, it may not be cost effective to do so. Farms that replace an aerobic manure management system (e.g., depositing manure on fi elds) with a pit or lagoon system would likely not qualify to sell offsets because the resulting emission reductions would not be “additional.”
Digester Adoption Spreads to More States as Carbon Price Rises
Figures 9 and 10 illustrate the location of dairy and hog operations, respec-tively, on which digesters are predicted to have a positive NPV when carbon offsets are priced at $13 and $26 per metric ton. The data used to construct the fi gures are drawn from a 2004 survey of hog producers and a 2005 survey of dairy producers conducted as part of the USDA’s Agricultural Resource Management Survey (ARMS). These surveys were conducted in the States accounting for most dairy and hog production.
Figure 9 shows that with an offset price of $13 per ton, there would be over 500 dairies in California, and between 100-500 dairies in New York, Wisconsin, and Texas that would fi nd it profi table to adopt a digester. At a price of $26 per ton, most dairy States see an increase in the number of potential digester adopters. At the higher price, Wisconsin joins California as having over 500 operations that would fi nd it profi table to adopt a digester.
Figure 10 illustrates the geographic distribution of hog operations on which digesters have a positive NPV. At $13 per ton, North Carolina has the largest number of potential adopters. At $26 per ton, Iowa, Illinois, Missouri, and Oklahoma join North Carolina in having at least 500 potential
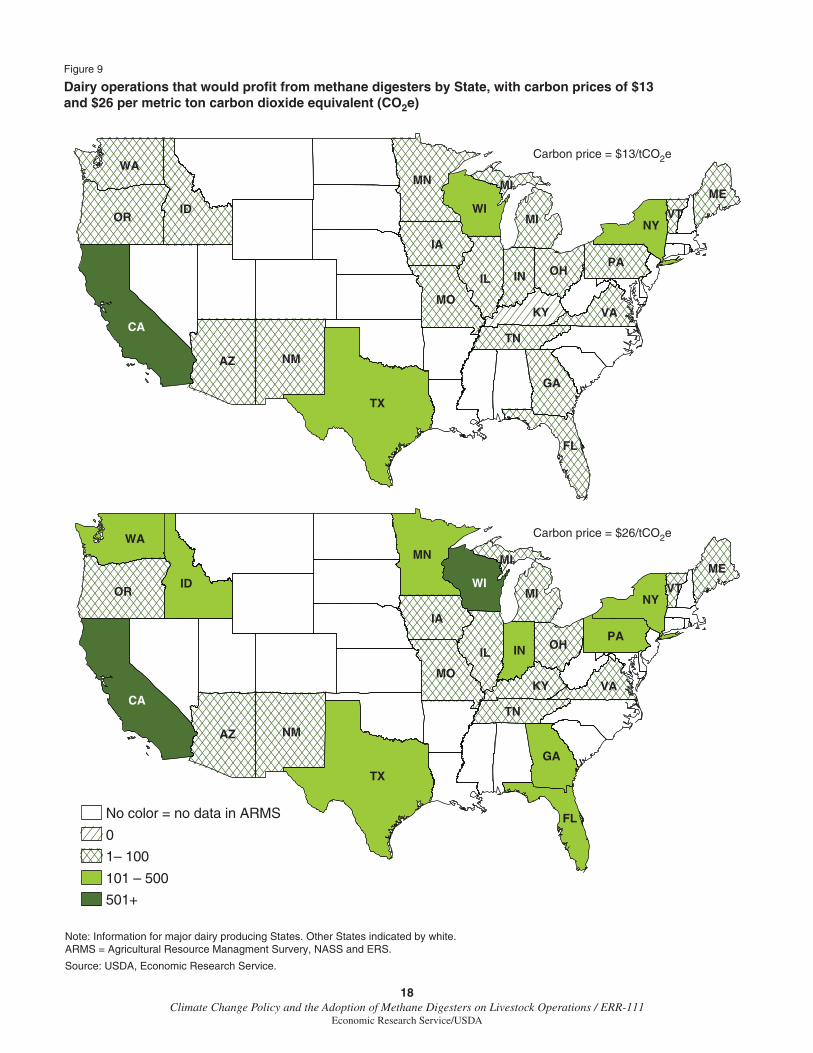
18Climate Change Policy and the Adoption of Methane Digesters on Livestock Operations / ERR-111
Economic Research Service/USDA
TX
CA
ID
AZ NM
OR
IL
MN
IA
WI
MO
FL
MI
IN
GA
NY
PA
TN
VAKY
OH
MEMI
VT
No color = no data in ARMS
0
1– 100
101 – 500
501+
Figure 9
Dairy operations that would profit from methane digesters by State, with carbon prices of $13 and $26 per metric ton carbon dioxide equivalent (CO2e)
WA
TX
CA
ID
AZ NM
OR
IL
MN
IA
WI
WA
MO
FL
MI
IN
GA
NY
PA
TN
VAKY
OH
MEMI
VT
Carbon price = $13/tCO2e
Carbon price = $26/tCO2e
Note: Information for major dairy producing States. Other States indicated by white.ARMS = Agricultural Resource Managment Survery, NASS and ERS.
Source: USDA, Economic Research Service.

19Climate Change Policy and the Adoption of Methane Digesters on Livestock Operations / ERR-111
Economic Research Service/USDA
No color = no data in ARMS
0
1– 100
101 – 500
501+
Figure 10
Hog operations that would profit from methane digesters by State, with carbon prices of $13 and $26 per metric ton carbon dioxide equivalent (CO2e)
Carbon price = $13/tCO2e
Carbon price = $26/tCO2e
Note: Information for major dairy producing States. Other States indicated by white.ARMS = Agricultural Resource Managment Survery, NASS and ERS.
Source: USDA, Economic Research Service.
CO
SD WIMI
GA
PA
AR
KY
MN
KS
NE
IN
VA
OHIL
IA
OK
MO
NC
CO
SD WIMI
GA
PA
AR
KY
MI
KS
MN
NE
IN
VA
OHIL
IA
OK
MO
NC

20Climate Change Policy and the Adoption of Methane Digesters on Livestock Operations / ERR-111
Economic Research Service/USDA
adopters. There is a somewhat greater share of potential adopters located in Southern States because lagoons are more common in that region. However, the number of potential adopters (shown in fi g. 10) does not refl ect this geographic pattern because a large portion of hog production is concentrated in the Midwest.
Options for Promoting Adoption of Biogas Technologies by Smaller Scale Operations
Because of economies of scale, larger producers are likely to benefi t most from climate change legislation or other policies that make biogas recovery systems more profi table. The model results suggest that additional profi ts from biogas systems would tend to enhance existing economies of scale in dairy produc-tion (MacDonald et al., 2007) and hog production (Key and McBride, 2008), which could promote further concentration in production over time. In addi-tion, banks may be willing to lend more money to operations with additional digester revenue, which would provide these operations with a greater capacity to expand production over time. However, there are several avenues by which private actions and public sector investments and policies could promote the adoption of biogas systems by smaller scale operations.
Figures 1-6 illustrate how higher profi ts from biogas recovery (resulting from higher carbon or electricity prices) decrease the size threshold above which it is profi table to adopt the technology. Policies that raise returns will tend to encourage participation by smaller scale operations. Such policies include grants (e.g., USDA Rural Energy for America Program grants), incentive payments (e.g., the U.S. Department of Energy Renewable Energy Production Incentive), tax credits (e.g., the Renewable Electricity Production Tax Credit), accelerated depreciation (Accelerated Cost Recovery System, which allows qualifying renewable energy systems to be rapidly depreciated for tax purposes), property and sales tax exemptions (usually at the State level), and other regulations such as net metering laws and “green” pricing that raise the effective price of electricity. Policies that raise the profi tability of biogas recovery systems can be targeted toward smaller scale operations.
Obtaining fi nancing for the large capital investment associated with most biogas systems can be a signifi cant barrier, particularly for smaller scale oper-ations (Gloy and Dressler, 2010). Digesters have little resale value, making their collateral value low. This problem could be addressed by loan guarantee programs such as USDA’s Rural Energy for America Program. The uncer-tainty surrounding digester systems’ benefi ts and costs is another barrier to fi nancing and adoption. Investors who are uncertain about the returns to a project are likely to delay investment or require substantial compensation for the uncertainty (Stokes et al., 2010). Future climate change legislation could increase energy prices and raise carbon offset prices far above current prices in regional carbon trading schemes. However, there is a great deal of uncer-tainty about the extent and timing of these price increases. Stable and long-term Government policies and programs can help reduce price uncertainty and encourage investment, for example, by providing long-term contracts for carbon offsets and/or electricity.
With high carbon offset prices, it may be possible to design a profi table lower cost biogas system that fl ares methane rather than using the gas to
21Climate Change Policy and the Adoption of Methane Digesters on Livestock Operations / ERR-111
Economic Research Service/USDA
generate electricity. This approach removes electricity generation from the biogas system, which eliminates the costs of the generator, electrical connec-tions, and maintenance.18 Such an approach might be economically viable for smaller scale operations that would fi nd it unprofi table to construct and maintain an electricity generator. This option has the greatest potential in the South, where lagoon covers can be installed relatively inexpensively and offer additional benefi ts to producers such as odor control and rain exclusion.
Centralized digesters used by several livestock producers could allow smaller scale operations to benefi t from economies of scale in construction and maintenance. In addition to cost effi ciencies, centralized systems could offer benefi ts in terms of greater marketing leverage in negotiating the sale of elec-tricity, better access to fi nancing, tax credits or grants, and benefi ts derived from having a manager who could develop specialized skill in digester main-tenance and operations (U.S. EPA, 2002). The main disadvantage of central-ized digesters is the additional costs of transporting manure to the centralized facility from the individual farms (Ghafoori and Flynn, 2006). Depending on how the manure is used, there could be additional costs of transporting the digested manure back from the centralized facility to farmland where it can be spread.
Smaller scale livestock operations may be able to achieve a more effi cient scale by supplementing manure with food waste products from crop and meat processing facilities, breweries, bakeries, restaurants, etc. (MDA, 2005). When mixed with manure, food waste can provide an effi cient feedstock for biogas production and livestock operators can charge “tipping fees” for receiving the waste. However, there is substantial variation in the availability and suitability of food waste for digestion, which may limit the economic and practical feasibility of co-digestion. In addition, there could be additional regulatory requirements associated with handling solid waste, including food waste that could substantially increase costs.19
In the hog sector, a large share of fi nished hog output is produced under production contracts (Key and McBride, 2007). Currently, most produc-tion contracts assign growers the responsibility for manure management. However, if digesters become profi table, it is plausible that contractors would seek to share some of the value derived from manure, either directly through a contract or indirectly by reducing the fees they pay farmers to raise hogs. Contractors could potentially facilitate digester adoption on individual opera-tions by helping their contract growers to obtain fi nancing and by providing technical assistance. It is also possible that contractors might establish centralized digesters and require growers to dispose of their manure at a specifi c facility.
18Costs associated with electricity generation comprise a substantial share of the total cost of biogas systems. For example, Bishop and Shumway (2009, p. 399) report in their case study of a 1,500-head digester that the cost of the generator was about 31 percent of the total capital costs.
19Methane from food waste may not be included in the livestock opera-tion’s baseline GHG emissions levels. So it is not clear whether burning methane generated from food waste would qualify for carbon offsets—this would depend on offset market rules and whether the initial GHG emissions from food waste decomposition could be included in the baseline.

22Climate Change Policy and the Adoption of Methane Digesters on Livestock Operations / ERR-111
Economic Research Service/USDA
More Carbon Offsets Are Supplied at Higher Price
As the carbon price rises, so does the potential revenue that can be earned from offset sales. A higher carbon price would likely be associated with an increase in the price of electricity, as most current electricity is generated using “carbon intensive” energy sources. A higher electricity price increases the value of the electricity generated with the methane digester. Hence, a higher carbon price will increase the NPV of digesters and there will be more potential adopters (as was shown in fi gs. 5 and 7). If we assume that digesters are installed if they have a positive NPV, then we can estimate how an increase in the price of carbon offsets will cause the total greenhouse gas emissions from manure management to drop. By summing the reduc-tions in tons of carbon dioxide equivalent methane emissions from the farms that adopt digesters, we can generate a curve representing the relationship between the price of carbon and the potential quantity of carbon offsets that could be provided.
Figure 11 illustrates this price relationship for dairies, hog operations, and both livestock types combined. The fi gure shows that without a carbon market (when the price is zero), no hog operations fi nd it profi table to adopt a digester, so there is essentially no reduction in emissions. In contrast, some dairies fi nd that electricity generation alone would make adoption profi table, so some emissions are reduced when the price is zero. As the carbon offset price increases, more and more operations adopt digesters and reduce their emissions. Between about $2 and $13 per ton of carbon dioxide equivalent emissions (tCO2e), the supply of emissions reductions from hog operations increases rapidly. Above a price of about $13/tCO2e the supply increases at a slower rate. Eventually, at a price of about $70 per ton, all the curves approach vertical and the total potential reduction of methane is reached. While dairies supply a larger share of total emission reductions when prices
Figure 11
Total reductions in manure methane emissions from dairy, hogs, and both sectors together at different carbon offset pricesCarbon price ($/tCO2e)
tCO2e = ton of carbon dioxide equivalent.
Source: USDA, Economic Research Service.
CO2e (millions of tons annually)
0
10
20
30
40
50
60
70
0 5 10 15 20 25 30 35 40
HogsDairyTogether

23Climate Change Policy and the Adoption of Methane Digesters on Livestock Operations / ERR-111
Economic Research Service/USDA
are below about $6, above that price more of the emission reductions are supplied by hog operations.
In our study, we fi nd that the supply of offsets from the dairy sector (brown line, fi g. 11) is similar, but somewhat less responsive to the price than was estimated by Gloy (2010). For example, at a price of $15/tCO2e, Gloy esti-mates dairies would supply 11.6 tCO2e, compared with our estimate of 10.5 tCO2e. At a price of $30/tCO2e, Gloy estimates a supply of 16.8 tCO2e, compared with 12.9 tCO2e for our study, and at $50/tCO2e, Gloy estimates dairies would supply 19.2 tCO2e, compared with our estimate of 14.2 tCO2e. There are several differences between our model and that used by Gloy that could explain these discrepancies.
Figure 12 shows the relationship between the carbon offset price and methane reductions as a percentage of the total possible reductions from dairies, hog operations, and both operation types combined. At a carbon price of $13, greenhouse gas emissions are reduced by 9.8 and 12.4 million tons (carbon dioxide equivalent) for the dairy and swine industries, respectively. This amounts to reductions of 61 percent and 62 percent of manure-generated methane in these industries (or about 62 percent overall). A doubling of the carbon price to $26 would cause the manure-based methane emissions from dairy and swine together to be reduced by 78 percent.
Higher carbon prices cause the NPV and the present value of electricity cost savings, electricity sales, and offset sales to increase (fi g. 13). At an offset price of $13, the dairy and swine industries together could collect a present value of $3.1 billion in offset fees, save $1.2 billion in electricity costs, and earn $361 million in electricity sales (over the 15-year lifespan of the digesters). The present value of total costs are estimated to be nearly $3 billion, yielding an NPV of $1.8 billion at this carbon price over the 15-year lifespan of the digester. As the offset price rises, offset sales contribute an increasingly larger share to digester gross revenues. At a carbon offset price
Figure 12
Percentage reductions in manure methane emissions for dairy, hogs, and both sectors together at different carbon offset pricesCarbon price ($/tCO2e)
tCO2e = ton of carbon dioxide equivalent.
Source: USDA, Economic Research Service.
Percentage (annually)
HogsDairyTogether
0
10
20
30
40
50
60
70
0 10 20 30 40 50 60 70 80 90 100
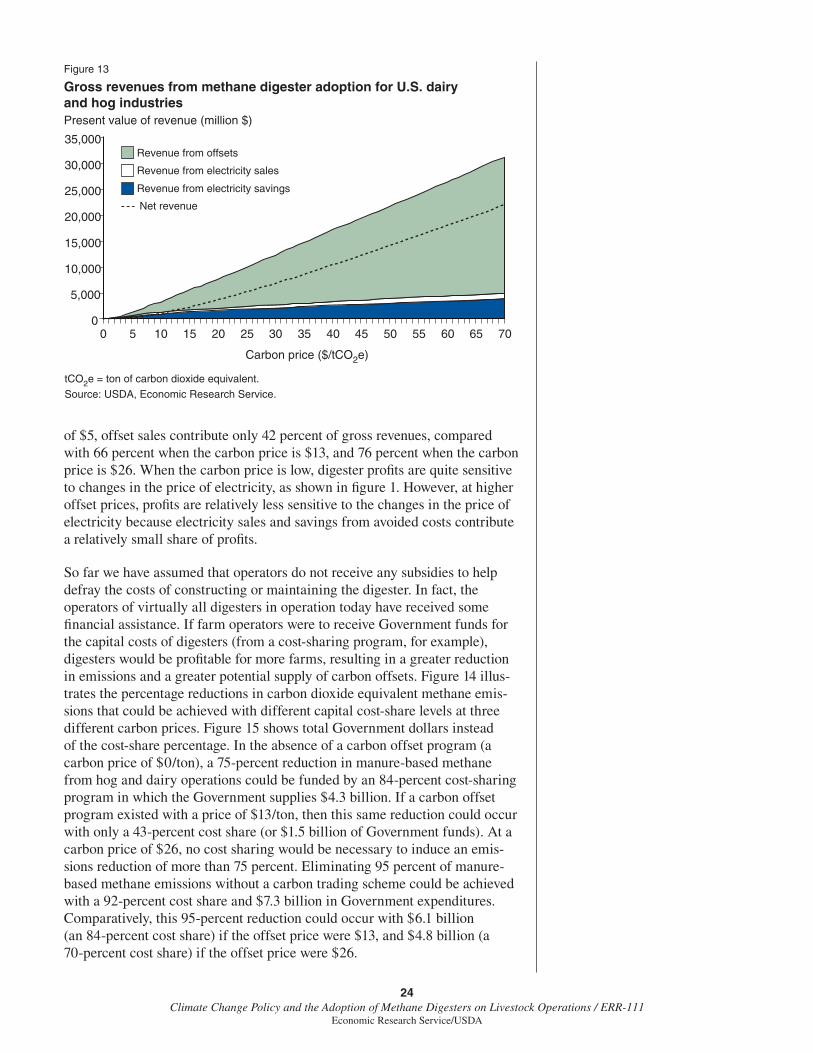
24Climate Change Policy and the Adoption of Methane Digesters on Livestock Operations / ERR-111
Economic Research Service/USDA
of $5, offset sales contribute only 42 percent of gross revenues, compared with 66 percent when the carbon price is $13, and 76 percent when the carbon price is $26. When the carbon price is low, digester profi ts are quite sensitive to changes in the price of electricity, as shown in fi gure 1. However, at higher offset prices, profi ts are relatively less sensitive to the changes in the price of electricity because electricity sales and savings from avoided costs contribute a relatively small share of profi ts.
So far we have assumed that operators do not receive any subsidies to help defray the costs of constructing or maintaining the digester. In fact, the operators of virtually all digesters in operation today have received some fi nancial assistance. If farm operators were to receive Government funds for the capital costs of digesters (from a cost-sharing program, for example), digesters would be profi table for more farms, resulting in a greater reduction in emissions and a greater potential supply of carbon offsets. Figure 14 illus-trates the percentage reductions in carbon dioxide equivalent methane emis-sions that could be achieved with different capital cost-share levels at three different carbon prices. Figure 15 shows total Government dollars instead of the cost-share percentage. In the absence of a carbon offset program (a carbon price of $0/ton), a 75-percent reduction in manure-based methane from hog and dairy operations could be funded by an 84-percent cost-sharing program in which the Government supplies $4.3 billion. If a carbon offset program existed with a price of $13/ton, then this same reduction could occur with only a 43-percent cost share (or $1.5 billion of Government funds). At a carbon price of $26, no cost sharing would be necessary to induce an emis-sions reduction of more than 75 percent. Eliminating 95 percent of manure-based methane emissions without a carbon trading scheme could be achieved with a 92-percent cost share and $7.3 billion in Government expenditures. Comparatively, this 95-percent reduction could occur with $6.1 billion (an 84-percent cost share) if the offset price were $13, and $4.8 billion (a 70-percent cost share) if the offset price were $26.
Figure 13
Gross revenues from methane digester adoption for U.S. dairy and hog industriesPresent value of revenue (million $)
tCO2e = ton of carbon dioxide equivalent.
Source: USDA, Economic Research Service.
Carbon price ($/tCO2e)
0 5 10 15 20 25 30 35 40 45 50 55 60 65 700
5,000
10,000
15,000
20,000
25,000
30,000
35,000
Revenue from electricity savings
Revenue from electricity sales
Revenue from offsets
Net revenue
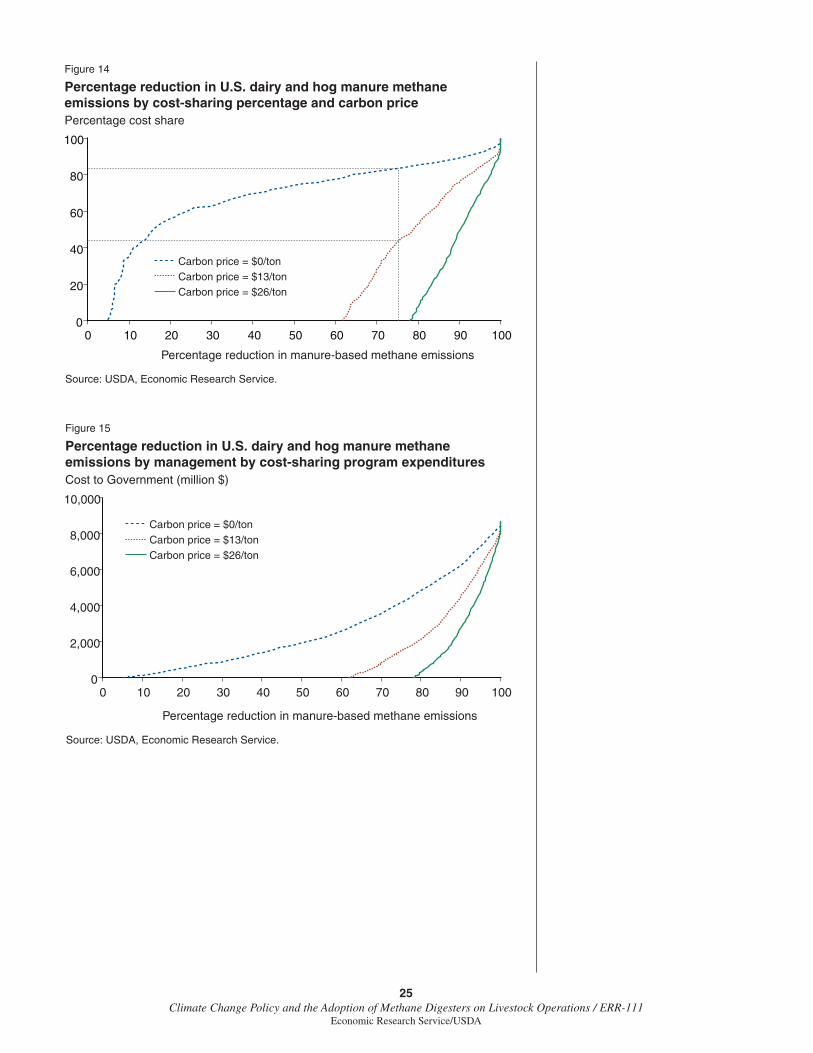
25Climate Change Policy and the Adoption of Methane Digesters on Livestock Operations / ERR-111
Economic Research Service/USDA
Figure 14
Percentage reduction in U.S. dairy and hog manure methane emissions by cost-sharing percentage and carbon pricePercentage cost share
Source: USDA, Economic Research Service.
Percentage reduction in manure-based methane emissions
Carbon price = $0/tonCarbon price = $13/tonCarbon price = $26/ton
0
20
40
60
80
100
0 10 20 30 40 50 60 70 80 90 100
Figure 15
Percentage reduction in U.S. dairy and hog manure methane emissions by management by cost-sharing program expendituresCost to Government (million $)
Source: USDA, Economic Research Service.
Percentage reduction in manure-based methane emissions
Carbon price = $0/tonCarbon price = $13/tonCarbon price = $26/ton
0
2,000
4,000
6,000
8,000
10,000
0 10 20 30 40 50 60 70 80 90 100
26Climate Change Policy and the Adoption of Methane Digesters on Livestock Operations / ERR-111
Economic Research Service/USDA
Conclusions
A policy or program that allows producers to be paid for reductions in carbon emissions, such as a carbon offset market or a direct subsidy for emissions reductions, could provide a competitive advantage to U.S. livestock producers who adopt a methane digester. Dairy and hog producers are likely to benefi t most from such a policy or program. Among dairy and hog producers, those with high current emissions, particularly those with manure lagoons located in warmer climates, could benefi t most from offset sales or emissions reduc-tion subsidies.
Our fi ndings indicate that revenues from the sale of carbon emissions reduc-tions (or offsets) could have a substantial effect on the number of operations that would adopt a methane digester (biogas recovery system). We estimate that a carbon price of $13 per ton would induce dairy and hog operations to supply offsets equivalent to about 22 million tons of carbon dioxide per year. This amounts to about 62 percent of the potential offsets from manure management in these industries, or about 5 percent of total greenhouse gas emissions from U.S. agriculture.
We also found that larger operations would be more likely to participate in a carbon offset market, and likely would earn substantially higher profi ts per head than smaller scale operations. Among operations with a suitable manure storage facility, only 15 percent of diaries with 250-499 head, compared with 56 percent of operations with more than 2,500 head, could earn positive returns from a digester if the carbon price were $13 per ton. For hog opera-tions, only 4 percent of those with 500-999 head would fi nd it profi table to adopt a digester at that price, compared with 53 percent of operation with more than 3,000 head. Hence, introduction of a carbon offset market could enhance existing economies of scale in production and result in a further concentration of production in the livestock industry among large operations.
There is scope to enhance the adoption of methane digesters on small-scale operations by promoting the provision of long-term contracts for electricity, the construction of centralized digesters (collectively or by a contractor), or the construction of large-scale digesters that take advantage of off-farm food waste. Policies that increase digester profi ts by increasing the demand for renewable energy, facilitating the ability of livestock operations to sell elec-tricity, or investing in research to lower construction and maintenance costs would encourage greater participation by small-scale operations. Subsidies and tax policies that lower the costs of constructing a digester also could be targeted at smaller operations.
27Climate Change Policy and the Adoption of Methane Digesters on Livestock Operations / ERR-111
Economic Research Service/USDA
References
Aillery, M., et al. 2005. Managing Manure to Improve Air and Water Quality, ERR-9, USDA, Economic Research Service.
Bishop, C. and C.R. Shumway (2009) “The Economics of Dairy Anaerobic Digestion with Coproduct Marketing.” Review of Agricultural Economics. 31(3): 394-410.
Chicago Climate Exchange. 2009. Chicago Climate Exchange Offset Project Protocol: Agricultural Methane Collection and Combustion, Accessed at: http://www.chicagoclimatex.com/docs/offsets/CCX_Agricultural_Methane_Final.pdf/.
Crenshaw, J. 2009. What’s a digester cost these days? AgSTAR National Conference, February 24-25, 2009. Accessed at: http://www.epa.gov/agstar/pdf/conf09/crenshaw_digester_cost.pdf/.
Dairy Power Production Program, 2006. Methane Digester System Program Evaluation Report, prepared for California Energy Commission Public Interest Energy Research Program. Accessed at: http://communities.nrri.org/c/document_library/get_fi le?p_l_id=59712&folderId=59944&name=DLFE-2429.pdf/.
Database of State Incentives for Renewable Energy (DSIRE). 2010. Rules, Regulations, and Policies for Renewable Energy, Accessed at: http://www.dsireusa.org/summarytables/rrpre.cfm/.
Demuynck, M., Nyns, E-J., and H. Naveau. 1985. “A review of the effects of anaerobic digestion on odour and on disease survival,” Composting of Agricultural and Other Wastes, J.K.R. Gasser (ed.). Elsevier Applied Science, London, UK, pp. 257-269.
Denley, Jonathan, and Cary W. Herndon. 2008. Financial Analysis of Implementing an Anaerobic Digester and Free Stall Barn System on a Mississippi Dairy Farm, paper presented at the Southern Agricultural Economics Association Meeting, Dallas, TX, February 2-5, 2008.
Ernst, Matthew, et al. 1999. The Viability of Methane Production by Anaerobic Digestion on Iowa Swine Farms, Staff Paper No. 328, Iowa State University, Department of Economics.
Environmental Working Group. 2009. Loopholes in Climate Bill “Offset” Provisions Let Major Polluters off the Hook, Washington, DC. Accessed at: http://www.ewg.org/opinion/cap-and-trade-legislation/.
Fulhage, C., Pfost, D., and D. Schuster. 2002. Fertilizer Nutrients in Livestock and Poultry Manure, Environmental Quality MU Guide, EQ 351. University of Missouri/Columbia, Outreach and Extension. Accessed at: http://extension.missouri.edu/explorepdf/envqual/eq0351.pdf/.
28Climate Change Policy and the Adoption of Methane Digesters on Livestock Operations / ERR-111
Economic Research Service/USDA
Ghafoori, E., and P. Flynn. 2006. Optimizing the Size of Anaerobic Digesters, paper presented at the Canadian Society for Bioengineering (SCBE/SCGAB) Annual Conference, Edmonton, Alberta, Canada. July 16-19, 2006.
Gloy, B.A. 2010. Carbon Dioxide Offsets from Anaerobic Digestion of Dairy Waste, working paper WP 2010-05. Cornell University, Department of Applied Economics and Management, Ithaca, NY.
Gloy, B.A., and J.B. Dressler. 2010. “Financial Barriers to the Adoption of Anaerobic Digestion on U.S. Livestock Operations,” Agricultural Finance Review, 70:2(2010):157-168.
Hamilton, K., et al. 2010. State of the Voluntary Carbon Markets 2010, report by Ecosystem Marketplace and Bloomberg New Energy Finance, June 14, 2010.
Huffstutter, P. 2010. “A stink in Central California over converting cow manure to electricity,” Los Angeles Times, March 1, 2010. Accessed at: http://arti-cles.latimes.com/2010/mar/01/business/la-fi -cow-power1-2010mar01/.
Intergovernmental Panel on Climate Change. 2007. Chapter 2 “Changes in Atmospheric Constituents and in Radiative Forcing, Climate Change 2007: The Physical Science Basis, contribution of Working Group I to the Fourth Assessment Report of the Intergovernmental Panel on Climate Change [S. Solomon et al. (eds.)]. Cambridge University Press, Cambridge, UK. Accessed at: http://www.ipcc.ch/pdf/assessment-report/ar4/wg1/ar4-wg1-chapter2.pdf/.
Keske, Catherine M. 2009. Economic Feasibility Study of Colorado Anaerobic Digester Projects, prepared for the Colorado Governor’s Energy Offi ce. Accessed at: http://ile.colostate.edu/documents/GEO8-28-9_AD_Economic_Feasibility_by_Keske.pdf/.
Key, N., and W. McBride. 2007. The Changing Economics of U.S. Hog Production, ERR-52, USDA, Economic Research Service.
Kramer, J. 2004. Agricultural Biogas Casebook–2004 Update. Resource Strategies, Inc., Madison, WI. Accessed at: http://www.michigan.gov/documents/CIS_EO_Agricultural_Biogas_Casebook_2004_Update_102421_7.pdf/.
Lazarus, W., and M. Rudstrom. 2007. “The Economics of Anaerobic Digester Operation on a Minnesota Diary Farm,” Review of Agricultural Economics 29(2): 349-364.
Leuer, E., Hyde J., and T. Richard. 2008. “Investing in Methane Digesters on Pennsylvania Dairy Farms: Implication of Scale Economies and Environmental Programs,” Agricultural and Resource Economics Review 37(2): 188-203.

29Climate Change Policy and the Adoption of Methane Digesters on Livestock Operations / ERR-111
Economic Research Service/USDA
Leuer, E., Hyde J., and T. Richard.2008. “Investing in Methane Digesters on Pennsylvania Dairy Farms: Implication of Scale Economies and Environmental Programs,” Agricultural and Resource Economics Review 37(2): 188-203.
Lusk, P. 1998. Methane Recover from Animal Manure: The Current Opportunities Casebook. National Renewable Energy Laboratory, Golden, CO. Prepared by U.S. Department of Energy.
Lusk, P. 1998. Methane Recovery from Animal Manures: The Current Opportunities Casebook, ECG-8-17098-01, U.S. Department of Energy, Offi ce of Energy Effi ciency & Renewable Energy, National Renewable Energy Laboratory, Golden, CO.
MacDonald, J.M., et al. 2007. Profi ts, Costs, and the Changing Structure of Dairy Farming, ERR-47, USDA, Economic Research Service.
Martin, J.H. 2006. Comparison of the Performance of Tow Plug-Glow Digesters for Dairy Cattle Manure, paper presented at the 2006 AgSTAR National Conference, April 24-26, Madison, WI.
Martin, John H. 2003. An Assessment of the Performance of the Colorado Pork, LLC, Anaerobic Digestion and Biogas Utilization System, paper submitted to Karl Roos, AgSTAR Program, U.S. Environmental Protection Agency, Washington, DC. EPA Contract No. 68-W7-0068 Task Order 5009.
Mehta, A. 2002. The Economics and Feasibility of Electricity Generation Using Manure Digesters on Small to Mid-Size Dairy Farms, University of Wisconsin/Madison, Department of Agricultural and Applied Economics, Energy Analysis and Policy Program.
Michigan Department of Agriculture, 2008. Michigan’s Agriculture Industry 2008 Ag-Innovation Grants. Accessed at: http://www.michigan.gov/docu-ments/mda/aginnfi n_268412_7.pdf/.
Minnesota Department of Agriculture. 2005. Opportunities, Constraints, and Research Needs for Co-digestion of Alternative Waste Streams with Livestock Manure in Minnesota. Agricultural Resources Management and Development Division, November 23, 2005. Accessed at: http://www.mnproject.org/pdf/CombinedWasteStreamsReport.pdf/.
Moser, Mark A. No year. A Dozen Successful Swine Waste Digester, RCM Digesters, Inc. Berkeley, CA. Accessed at: http://www.rcmdigesters.com/images/PDF/ADozenSuccessfulSwineWasteDigesters.pdf/.
Moser, Mark A., et al. 2007. Keep the Neighbors Happy—Reducing Odor While Making Biogas, U.S. Environmental Protection Agency, AgSTAR Program. Accessed at: http://www.epa.gov/agstar/resources/proj_sums.html/.

30Climate Change Policy and the Adoption of Methane Digesters on Livestock Operations / ERR-111
Economic Research Service/USDA
National Research Council. 2003. Air Emissions from Animal Feeding Operations: Current Knowledge, Future Needs. National Research Council of the National Academies. Accessed at: http://www.epa.gov/ttn/chief/ap42/ch09/related/nrcanimalfeed_dec2002.pdf/.
Nebraska Natural Resources Committee. 2007. Committee Meeting Transcript LB579 LB581, prepared by the clerk of the legislature, transcriber’s offi ce. Accessed at: http://www.legislature.ne.gov/FloorDocs/100/PDF/Transcripts/Natural/2007-02-01.pdf/.
Pain, B.F., et al. 1990. “Odour and ammonia emissions following the spreading of anaerobically digested pig slurry on grassland,” Biological Wastes (34):259-267.
Pennsylvania State Department of Agricultural and Biological Engineering. No year. Pine Hurst Acres Case Study. Accessed at: http://www.biogas.psu.edu/casestudies/pinehurst.pdf/.
Point Carbon. 2010. 8.2Gt CO2e traded in 2009—up 68% on previous year, press release. Oslo, Norway. Accessed at: http://www.endseurope.com/docs/100106a.pdf /.
Scruton, Daniel L., Stanley A. Weeks, and Robert S. Achilles. 2004. Net Metering’s Effect on On-Farm Electrical Generation (ASAE-044136), paper presented at the 2004 Renewable and Distributed Power Generation: Wind Solar and Other Sources Conference, Ottawa, Canada. August 3, 2004.
Stokes, J., R. Rajagoplan, and S. Stefanou. 2008. “Investment in a Methane Digester: An Application of Capital Budgeting and Real Options,” Review of Agricultural Economics 30(4) 664-676.
U.S. Department of Agriculture. 2009. A Preliminary Analysis of the Effects of HR 2454 on U.S. Agriculture, Offi ce of the Chief Economist. Accessed at: http://www.usda.gov/oce/newsroom/archives/releases/2009fi les/HR2454.pdf/.
U.S. Department of Energy. 2000. Carbon Dioxide Emissions from the Generation of Electric Power in the United States. Available at: http://www.eia.doe.gov/electricity/page/co2_report/co2emiss.pdf/.
U.S. Department of Energy. 2009. States with Renewable Portfolio Standards. Accessed at: http://apps1.eere.energy.gov/states/maps/renew-able_portfolio_states.cfm#chart/.
U.S. Department of Energy, U.S. Energy Information Administration, Offi ce of Coal, Nuclear, and Alternate Fuels. 2010. Electric Power Monthly, June 2010. DOE/IEA-0226. Table 5.6.B. Accessed at: http://www.eia.doe.gov/cneaf/electricity/epm/matrix96_2000.html/.
U.S. Environmental Protection Agency. 2002. Managing Manure with Biogas Recovery Systems: Improved Performance at Competitive Costs. AgSTAR Program. EPA-430-F-02-004. Available at: nepis.epa.gov/Exe/ZyPURL.cgi?Dockey=2000ZL4E.txt/.

31Climate Change Policy and the Adoption of Methane Digesters on Livestock Operations / ERR-111
Economic Research Service/USDA
U.S. Environmental Protection Agency. 2006. Market Opportunities for Biogas Recovery Systems: A Guide to Identifying Candidates for On-Farm and Centralized Systems. AgSTAR Program. EPA-430-8-06-004. Available at: nepis.epa.gov/Exe/ZyPURL.cgi?Dockey=P1008VEI.txt/.
U.S. Environmental Protection Agency. 2008. Climate Leaders Greenhouse Gas Inventory Protocol Offset Project Methodology for Project Type: Managing Manure with Biogas Recovery Systems, Version 1.3. Available at: www.epa.gov/climateleaders/.../draft_reforestation_offset_protocol.pdf/.
U.S. Environmental Protection Agency. 2009. EPA Analysis of the American Clean Energy and Security Act of 2009 H.R. 2454 in the 111th Congress. June 23, 2009. Available at: http://www.epa.gov/climatechange/economics/pdfs/HR2454_Analysis.pdf/.
U.S. Environmental Protection Agency. 2010a. Number of Operating Digesters (April 2010), AgSTAR Program Accomplishments. Accessed at: http://www.epa.gov/agstar/accomplish.html#wi/.
U.S. Environmental Protection Agency. 2010b. Inventory of U.S. Greenhouse Gas Emissions and Sinks: 1990-2008. EPA 430-R-10-006. April 15, 2010.
Welsh, F., et al. “The effect of anaerobic digestion upon swine manure odors,” Canadian Agricultural Engineering 1977 19(2): 122–126.
Wilkie, A.C., Riedesel, K.J. and Cubinski, K.R. 1995. “Anaerobic digestion for odor control,” Nuisance Concerns in Animal Manure Management: Odors and Flies, H.H. Van Horn (ed). University of Florida, Florida Cooperative Extension Service, Gainesville, FL, pp. 56-62.
Wright, Peter E., and Stephen P. Perschke. 1998. Anaerobic Digestion and Wetland Treatment Case Study: Comparing Two Manure Odor Control Systems for Dairy Farms, Paper No. 984105, presented at the American Society of Agricultural and Biological Engineers Annual International Meeting, Orlando, FL, March 8-10, 1998.
32Climate Change Policy and the Adoption of Methane Digesters on Livestock Operations / ERR-111
Economic Research Service/USDA
Appendix
For this study, we use a model of methane digester profi ts that depends on farm size and location, electricity and carbon prices, and parameters that characterize the costs and generation capacity of the methane digester. The model is used to estimate digester profi ts for every farm in two nationally representative surveys of dairy and hog producers.
Recent studies that have modeled the economic benefi ts and costs of methane digesters include Lazarus and Rudstrom (2007); Leuer et al. (2008); Stokes et al. (2008); and Bishop and Shumway (2009). These studies focus on particular regions, markets, or types of farms, and do not attempt to estimate nationwide digester adoption rates or profi ts. An exception is Gloy (2010), who develops a general model of digester profi tability for dairies in order to estimate the potential supply of carbon offsets from the sector. The modeling approach used in this study is similar to Gloy, but we extend his analysis in several ways by estimating methane digester parameters using case study data, incorporating the hog sector in the analysis, allowing electricity prices to be a function of the carbon offset price, and allowing for transaction costs associated with carbon offset market participation.
We use a discounted cash fl ow or net present value (NPV) approach to assess the profi tability of a digester project. The NPV is the sum of all future cash fl ows (e.g., revenues from electricity or carbon offsets minus capital and vari-able costs) discounted to its present value. The NPV approach used in this analysis is deterministic in the sense that real prices are assumed to be known and constant by the operator throughout the economic life of the digester. In fact, many of the benefi ts and costs associated with a digester are uncertain and variable. For example, both retail prices and selling prices of electricity are likely to fl uctuate depending on global economic conditions and policy changes that are diffi cult to predict. Similarly, carbon offset prices have varied dramati-cally over time, and estimating future carbon prices is diffi cult. There is uncer-tainty about variable costs, which could fl uctuate from year to year depending on system reliability and unexpected weather or mechanical failures, as well as uncertainty about methane and electrical output from a digester.
If we knew how much prices and other model parameters are likely to vary, then it would be possible to estimate the probability distribution of the NPV, which would provide a more accurate representation of a digester project’s value (Leuer et al., 2008). A further extension could also take into account the irreversible nature of a digester investment. Stokes et al. (2008) use a real option framework to estimate the value to a producer of the option to delay investment in a digester. The authors fi nd that producers would require signif-icant fi nancial compensation, perhaps in the form of assured grant funding or greater electricity prices in order to immediately adopt the technology, rather than delay investment even if the NPV is positive.
By not accounting for the stochastic nature of a digester’s benefi ts and costs nor the option value of delaying investment in this study, we tend to over-estimate the value of the digester system and the predicted adoption rates. However, as noted in the text, we also do not account for some possible benefi ts from a digester such as from “tipping fees” or bedding sales, which

33Climate Change Policy and the Adoption of Methane Digesters on Livestock Operations / ERR-111
Economic Research Service/USDA
causes us to underestimate the value of the project. In addition, we do not account for “nonmarket” benefi ts from a digester such as odor control or reduced water or air pollution, which also cause us to underestimate the private and social benefi ts of the project.
The Net Present Value of a Methane Digester Project
An operator who is considering investing in a methane digester has two related decisions: whether to construct a digester that will produce elec-tricity and whether to sell carbon offsets. An operator with a digester will sell offsets if the expected discounted stream of revenues from offset sales exceeds the expected discounted costs of doing so. In other words, the net present value of participating in a carbon offset market NPVM is positive. The decision to invest in a digester depends on the net present value of electricity NPVD and of carbon offset sales NPVM. Hence, there are three possible outcomes:
(1)0 and 0: no investment
0 and 0: construct digester; do not sell offsets
0 and 0: construct digester; sell offsets
D D M
D M
D M M
NPV NPV NPV
NPV NPV
NPV NPV NPV
£ + £
> £
+ > >
Another possibility is to construct a digester without an electricity generator and to fl are the methane and sell offsets. This scenario is not considered in this study.
The NPV of the digester enterprise for operation i, located in State s, using manure management facility type f is:
(2)0 ( )/(1+ )tT
D isf ifttNPV R C d ,=é ù= -ê úë ûå
where T represents the lifespan of the digester, t indexes time, d is the discount rate, Risf is the value of generated electricity (used onfarm and/or sold), and Cift is the cost of constructing and maintaining the digester.
The value of electricity generated by the digester Risf is assumed to be certain and constant over the life of the digester. The value depends on whether the quantity generated onfarm G
ifE is less than or greater than the quantity used onfarm U
iE :
(3)( )
if
if
ER G G Us if if i
isf ER U EW G U G Us i s if i if i
P E E ER
P E P E E E E
ìï ⋅ £ïï=íï ⋅ + ⋅ - >ïïî
.
If the quantity generated is less than or equal to what is used onfarm, then the generated electricity is valued at the buying (retail) price ER
SP . If more elec-tricity is generated than is used onfarm, then this surplus electricity ( )G U
if iE E- is valued at the selling (wholesale) price EWSP .

34Climate Change Policy and the Adoption of Methane Digesters on Livestock Operations / ERR-111
Economic Research Service/USDA
Since the power generation sector is likely to be affected by climate change legislation, we allow the retail and wholesale electricity prices to depend on the carbon intensity of the State energy sources and the price of carbon. Specifi cally, the retail price of electricity is a function of the observed current retail price E
SP plus an increase that is proportional to the average carbon dioxide equivalent emissions rate from power plants s (in pounds per kilo-watt hour (kW/h)) times the carbon price PM:
(4) φ 0 00045ER E Ms s sP P . ,P= + ⋅ ⋅
where we multiply by 0.00045 to convert pounds to metric tons.
The selling price of farm-generated electricity will likely also increase with the carbon price. For simplicity, the selling price of electricity is assumed to be proportional to the retail price:
(5) θEW ERs sP P ,= ⋅
where is a parameter that can be varied for policy simulations.
Electricity generation depends on the type of manure storage facility in place and the quantity of manure produced. Generation does not depend on the methane emission factor because emission rates can be increased beyond baseline levels by heating the digester (in pit systems) and by controlling nutrients and liquid/solids ratios. Since the quantity of manure produced is a linear function of the number of head, the quantity of electricity generated can be expressed simply as:
(6) Gif f iE e .N= ⋅
The costs of the biogas system are certain, but vary over the lifespan of the digester. In the initial year (t = 0), costs include capital construction costs Kif plus maintenance and operating costs Vif .
20 In subsequent years (1 t T), costs of the biogas digester only include operating costs:
(7)λ if 0
if1
if ifift
if
K V tC
V t T.
ì + =ïïï=íï £ £ïïî
Capital costs include costs of the constructing and designing the pump, pit, heating, building, solids separator, effl uent holder, generator, power lines, and so forth. A share of capital costs is born by a Government cost-share program. The capital costs increase with the scale of the operation at a decreasing rate that depends on parameters af and bf. The cost of this invest-ment is:
(8) fbif f iK a (N )= ⋅
Annual variable costs Vif include costs of maintenance and repairs. Following past studies, we assume that variable costs are proportional to the quantity
20In this study, we did not explic-itly consider costs associated with obtaining air quality permits or costs associated with installing equipment to comply with air quality standards. Recent news accounts suggest that in some regions or States (such as Cali-fornia) these costs could be substantial (Huffstutter, 2010).

35Climate Change Policy and the Adoption of Methane Digesters on Livestock Operations / ERR-111
Economic Research Service/USDA
of electricity generated (which depends on farm size and type of manure handling facility):
(9) Gif if f iV v E v N .e= ⋅ = ⋅ ⋅
The NPV of participating in a carbon offset market is given:
(10) 0[( ) (1 ) ]M tTM isf ttNPV P M Z / d ,== ⋅ - +å
where PM is the price of carbon offsets ($/tCO2e), Misf is the quantity of methane that could be sold in the offset market, and Zt are transaction costs associated with selling carbon offsets.
The quantity of methane produced and burned that would qualify for offset sales is:
(11) 24 365 0 001isf i sfM N m . ,= ⋅ ⋅ ⋅ ⋅
where Ni is the number of head and msf is the methane emission factor (kilogram/methane (kg/CH4 per head per day)), which is multiplied by 24 (tCO2e/t CH4)21, 365 (days per year), and 0.001 (tons per kg) in order to express in tons of carbon dioxide equivalents (tCO2e).
Transaction costs associated with selling carbon offsets are certain but vary over the life of the digester. These costs include the initial one-time fi xed start-up cost for entering the offset market (ZE) plus ongoing annual costs of monitoring and verifi cation (ZV):
(12) if 0 if 1
E V
VtZ Z tZ .Z t T
ìï + =ï=íï £ £ïî
Case Studies and Parameter Values
The model parameters, units, and data sources used are shown in table A1. Electricity generation and cost parameters are estimated using information from case studies drawn from three compilations (Lusk, 1998; Kramer, 2004; DPPP, 2006) and from individual articles and reports (Wright and Pershke, 1998; Martin, 2003; Lazarus and Rudstrom, 2007; NNRC, 2007; Michigan Department of Agriculture, 2008; Bishop and Shumway, 2009; Keske, 2009; Moser, undated; Pennsylvania State University, undated). Data from the case studies were used to estimate the parameters if the studies met the following conditions:
1) The case farm was producing heat and/or electricity with its digester technology at the time of the study. This excluded digesters that were constructed solely for odor control or that were nonoperational or had not produced electricity at the time of the case study.
21Methane has 25 times the global warming capacity of carbon dioxide over 100 years (IPCC, 2007). Burning methane emits 1 ton of CO2, so burn-ing 1 ton of methane is equivalent to eliminating 24 tons of carbon dioxide.
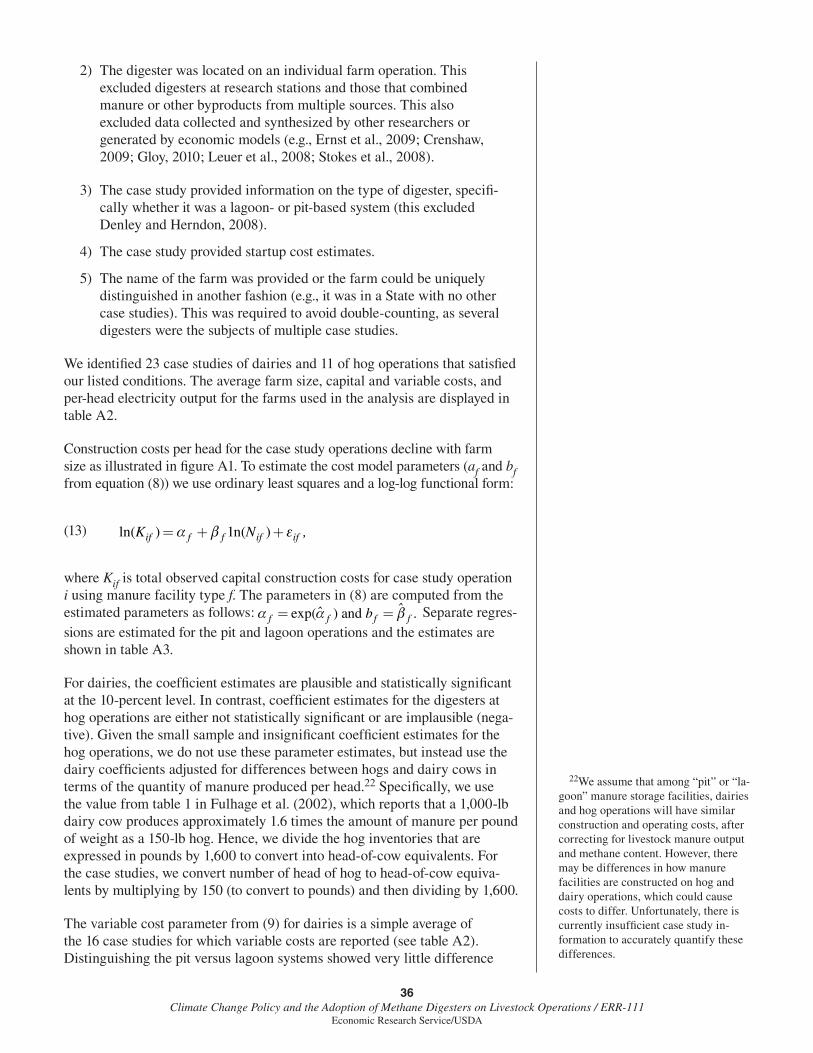
36Climate Change Policy and the Adoption of Methane Digesters on Livestock Operations / ERR-111
Economic Research Service/USDA
2) The digester was located on an individual farm operation. This excluded digesters at research stations and those that combined manure or other byproducts from multiple sources. This also excluded data collected and synthesized by other researchers or generated by economic models (e.g., Ernst et al., 2009; Crenshaw, 2009; Gloy, 2010; Leuer et al., 2008; Stokes et al., 2008).
3) The case study provided information on the type of digester, specifi -cally whether it was a lagoon- or pit-based system (this excluded Denley and Herndon, 2008).
4) The case study provided startup cost estimates.
5) The name of the farm was provided or the farm could be uniquely distinguished in another fashion (e.g., it was in a State with no other case studies). This was required to avoid double-counting, as several digesters were the subjects of multiple case studies.
We identifi ed 23 case studies of dairies and 11 of hog operations that satisfi ed our listed conditions. The average farm size, capital and variable costs, and per-head electricity output for the farms used in the analysis are displayed in table A2.
Construction costs per head for the case study operations decline with farm size as illustrated in fi gure A1. To estimate the cost model parameters (af and bf from equation (8)) we use ordinary least squares and a log-log functional form:
(13) α β εln( ) 1n( )if f f if ifK N ,= + +
where Kif is total observed capital construction costs for case study operation i using manure facility type f. The parameters in (8) are computed from the estimated parameters as follows: α α βexp( ) and f f f f
ˆˆ b .= = Separate regres-sions are estimated for the pit and lagoon operations and the estimates are shown in table A3.
For dairies, the coeffi cient estimates are plausible and statistically signifi cant at the 10-percent level. In contrast, coeffi cient estimates for the digesters at hog operations are either not statistically signifi cant or are implausible (nega-tive). Given the small sample and insignifi cant coeffi cient estimates for the hog operations, we do not use these parameter estimates, but instead use the dairy coeffi cients adjusted for differences between hogs and dairy cows in terms of the quantity of manure produced per head.22 Specifi cally, we use the value from table 1 in Fulhage et al. (2002), which reports that a 1,000-lb dairy cow produces approximately 1.6 times the amount of manure per pound of weight as a 150-lb hog. Hence, we divide the hog inventories that are expressed in pounds by 1,600 to convert into head-of-cow equivalents. For the case studies, we convert number of head of hog to head-of-cow equiva-lents by multiplying by 150 (to convert to pounds) and then dividing by 1,600.
The variable cost parameter from (9) for dairies is a simple average of the 16 case studies for which variable costs are reported (see table A2). Distinguishing the pit versus lagoon systems showed very little difference
22We assume that among “pit” or “la-goon” manure storage facilities, dairies and hog operations will have similar construction and operating costs, after correcting for livestock manure output and methane content. However, there may be differences in how manure facilities are constructed on hog and dairy operations, which could cause costs to differ. Unfortunately, there is currently insuffi cient case study in-formation to accurately quantify these differences.

37Climate Change Policy and the Adoption of Methane Digesters on Livestock Operations / ERR-111
Economic Research Service/USDA
Table A1
Model parameters, values, description, and sources
Variable Value Units Description Source
Estimated parameters
ef = pit (dairy) 841 kWh/cowElectricity produced per dairy cow at an operation utilizing a pit-based digester
Averages based on case studies
ef = lagoon (dairy) 450 kWh/cowElectricity produced per dairy cow at an operation utilizing a lagoon-based digester
ef = pit (swine) 41 kWh/hogElectricity produced per hog at an op-eration utilizing a pit-based digester
ef = lagoon (swine) 37 kWh/hogElectricity produced per hog at an op-eration utilizing a lagoon-based digester
v (dairy) 0.033 $/kWh Variable cost for dairies
v (swine) 0.014 $/kWh Variable costs for hog operations
af = pit 11,708 No unitCapital investment cost parameter for pit-based digesters
Regression estimates based on case studies
bf = pit 0.582 No unit
af = lagoon 7,864 No unitCapital investment cost parameter for lagoon-based digesters
bf = lagoon 0.618 No unit
ESP Varies by State $/kWh
State retail electricity price for indus-trial sector
U.S. DOE, 2010, table 5.6.B
msf
Varies by State and manure management method
kg CH4 per head per day
State methane emission factors by manure management method
Chicago Climate Exchange, 2009, tables 3-4
s Varies by State lbs/kWh Carbon emissions factor US DOE, 2000, table 4
Assumed parameters
d 0.05 rate Discount rate
t 15 years Economic life of a digester
TE 10,000 $ Initial offset market transaction costs
TV 3,000 $ Annual offset market transaction costs
1Selling price as a fraction of retail price of electricity
PM Varies by policy $/t CO2e Price per ton of CO2e
Varies by policyPercentage of capital costs covered by cost-share program
kWh = kilowatt hour, unit of energy equal to the work done by a power of 1,000 watts operating for 1 hour.
tCO2e = per ton of carbon dioxide equivalent.
Source: USDA, Economic Research Service.

38Climate Change Policy and the Adoption of Methane Digesters on Livestock Operations / ERR-111
Economic Research Service/USDA
between the two types, so the same parameter is assigned to both types of systems. Variable costs for hog operations are estimated in the same way using data from four case studies.
For dairies, the electricity generation parameter ef is estimated as the average value from the 19 case studies that report this information (see table A2). Pit systems generate substantially more electricity per head than lagoon systems. This is mainly because pit systems are heated in the cooler months to opti-mize methane production, and therefore electricity output. For hogs, we use
Table A2
Averages from case studies
Livestock typeManure
managementCow
equivalentsCapital
costs ($)
Capital costs per cow
equivalent ($)
Variable costs
($/kWh)
Electricity (kWh/year/cow
equivalent)
Dairy Pit 1,195 $750,039 $828 $0.033 841(977) (502,240) (592) (0.018) (382)
Number of case studies 19 19 19 16 15Dairy Lagoon 3,916 $1,317,760 $438 $0.033 450
(2,541) (977,011) (264) (0.018) (136)Number of case studies 4 4 4 16 4Hog Pit 1,340 $709,255 $719 $0.014 437
(570) (281,157) (713) (0.005) (251)Number of case studies 8 8 8 3 3Hog Lagoon 1,648 $264,876 $300 $0.014 391
(1,503) (129,366) (237) (0.005) (287)Number of case studies 3 3 3 3 3Notes: Standard deviations shown in parentheses. The number of case studies varies according to the number of studies providing information on the specifi c variable. Variable costs for dairies and hog operations are estimated without dividing between pit and lagoon. All dollar values are in 2009 dollars. Number of head of hog is converted to cow equivalents in the following manner: We assume a 1,000-lb. dairy cow produces approxi-mately 1.6 times the amount of manure per pound of weight as a 150-lb. hog (Fulhage, Pfost, and Schuster (2002), table 1). Hence, we divide the hog inventories that are expressed in pounds by 1,600 to convert into head-of-cow equivalents.kWh = kilowatt hour, unit of energy equal to the work done by a power of 1,000 watts operating for 1 hour.
Source: USDA, Economic Research Service.
Figure A1
Capital per head by number of head, dairy and hog operationsCapital costs per head
Note: Head are in terms of cow equivalents.
Source: USDA, Economic Research Service.
Number of head
0
500
1,000
1,500
2,000
2,500
3,000
0 1,000 2,000 3,000 4,000 5,000 6,000 7,000
Dairy pit
Dairy lagoon
Hog pit
Hog lagoon

39Climate Change Policy and the Adoption of Methane Digesters on Livestock Operations / ERR-111
Economic Research Service/USDA
six case studies to compute the average kilowatt hours per head per year generated by digester systems at pit and lagoon systems. We report these on a per-hog basis in table A1 and on a per-cow-equivalent basis in table A2.
The methane emission factors msf are based on IPCC tier 2 standards (Chicago Climate Exchange, 2009, tables 3-4). The carbon emissions factors s for elec-tricity use by region are from the U.S. Department of Energy’s Carbon Dioxide Emissions from the Generation of Electric Power (U.S. DOE, 2000). We assign the same carbon emissions factor to each State within the region.
The model is used to predict digester profi ts for each farm in the 2005 Dairy and the 2004 Hogs Production Practices and Costs and Returns Reports, which are part of the Agricultural Resource and Management Survey (ARMS). ARMS is a restricted-use dataset conducted by USDA’s National Agricultural Statistics Service in conjunction with the Economic Research Service. ARMS contains information on the number and type of animals, type of manure management systems, and costs of electricity consumed.
ARMS Data Description
Farm level data are drawn from the 2005 Dairy and the 2004 Hogs Production Practices and Costs and Returns Reports, part of ARMS. Farms must have sold $1,000 minimum of agricultural products in the prior year in order to qualify for the sample.
Manure Management. ARMS allows farmers to record up to four types of manure storage facilities. For dairies, we classify the following systems as lagoons: “Single stage lagoon (for anaerobic or aerobic digestion)” and “Two stage lagoon (for anaerobic or aerobic digestion in 1st stage, storage in 2nd stage).” We characterize the following as pit-based manure manage-ment: “Manure pit (open),” “Manure pit (closed).” The other types of manure storage systems that we do not characterize as either pit or lagoon are “Stacking slab or other open storage of manure,” “Slurry or manure tank (open),” and “Slurry or manure tank (covered).”
For hogs, we classify the following systems as lagoons: “Single stage lagoon” and “Two stage lagoon.” We characterize the following as pit-based manure management: “Manure pit under building,” “Other manure pits (not under
Table A3
Regression estimates: Capital costs as a function of farm sizeDependent variable: ln(capital)
Dairies Hog operationsPit Lagoon Pit Lagoon
Constant 9.368*** 8.970** 13.88*** 9.844*(0.974) (1.644) (2.137) (1.480)
ln(head) 0.582*** 0.618* -0.0670 0.367(0.143) (0.206) (0.301) (0.211)
N 19 4 8 3R-squared 0.495 0.818 0.008 0.752Note: Head for hog operations are in cow equivalents, adjusted for weight and manure produc-tion. Standard errors shown in parentheses. ***, **, and * refer to signifi cance at the 1, 5, and 10 levels, respectively.
Source: USDA, Economic Research Service.

40Climate Change Policy and the Adoption of Methane Digesters on Livestock Operations / ERR-111
Economic Research Service/USDA
building).” The other types of manure storage systems that we do not charac-terize as either pit or lagoon are “Holding pond (for storage, not anaerobic or aerobic digestion),” “Slurry or manure tank—Open,” and “Slurry or manure tank—Closed.”
Some farms have both manure and pit systems. In these cases, we discern the percentage of manure held in each type of system, and then use these percent-ages to weight estimates dependant on the type of manure management (elec-tricity produced, methane produced, and capital costs).
Number of Head. For dairies, ARMS provides the number of head in three categories: Milk cows, dry cows, and breeding bulls. We exclude breeding bulls and fi nd the average number of milk and dry cows over the course of the year.
For hogs, ARMS provides the number of head of various sizes at the begin-ning and the end of the year. We use these to calculate the total number of pounds of hogs at the operation. We fi nd the average of the beginning and ending number of hogs in each category, and then assign the pounds to each category as shown in table A4. By summing the pounds in each category, we compute the total number of pounds in hogs at the operation. A head is defi ned as 150 pounds for the computations; however, it is defi ned as 250 pounds in the fi gure.
Electricity Use. ARMS records the total amount spent on electricity. We instead need the amount of electricity used. We therefore use the State electricity price from another source (see below) to calculate electricity used in kWh.
State Methane Emissions Factors. The Chicago Climate Exchange provides methane emissions factors by livestock and manure management system for the following categories: (1) Dairy cow, (2) Swine 59 pounds and under, (3) Swine 60 to 199 pounds, (4) Swine 120 to 179 pounds, (5) Swine 180 pounds and above, and (6) Breeding swine. Because ARMS reports the number of hogs in the same swine categories, we use these to calculate specifi c emis-sions by hog type. However, there are only two possible methane emissions factors for dairies: “dairy cow” and “dairy heifer.” Since ARMS data do not distinguish between dairy cows and dairy heifers (just between milk cows and dry cows), we only use the emission factor for “dairy cows.”
Table A4
Agricultural Resource Management Survey hog categories and weights
Category Assigned weight
PoundsA sows, gilts, and young gilts bred and to be bred 330
B boars and young males for breeding 330
C cull breeding stock including sows, gilts, and boars 330
D other hogs under 60 pounds 30
E other hogs 60–199 pounds 89.5
F other hogs 120–179 pounds 149.5
G other hogs 180 pounds and over 215Source: USDA, Agricultural Resource Management Survey, National Agricultural Statistics Service and Economic Research Service.