climate change mitigation through market-based instruments ... · responsibility from emission...
TRANSCRIPT
Munich Personal RePEc Archive
Climate Change Mitigation Through
Market-based instruments in Large Asian
Emitters
Nopiah, Ririn and Widodo, Tri
Master and Doctoral Program, Economics Deparment, FEB, Gadjah
Mada University
4 January 2019
Online at https://mpra.ub.uni-muenchen.de/91230/
MPRA Paper No. 91230, posted 07 Jan 2019 18:21 UTC
1
Climate Change Mitigation Through Market-based instruments inLarge Asian Emitters
by
Ririn Nopiah
Tri Widodo

2
Climate Change Mitigation Through Market-based instruments inLarge Asian Emitters
Ririn NopiahUniversitas Gadjah Mada
ABSTRACT
Climate change is responsibility of the economic system like households, firms, andgovernments that produces Greenhouse Gases (GHG). This paper aims to analyzeeffectiveness and efficiency of climate change mitigation policies for Japan, China andIndia that are large Asian emitters through market-based instruments. GTAP-E model isused to analyze the impact of carbon tax policy using their global commitments toreduce carbon emissions. The result shows that carbon tax is best alternative choice forJapan, China, and India to reduce CO2 emissions as a climate change mitigation. Thecarbon tax provides that in a GDP increase of 0,44% in Japan. But in China and Indiafind that reducing CO2 emission causes GDP is decline around 0,82% for China and1,98 for India. Thus, all regions can get emission target by cost-effectively and eachwelfare loss can be compensated by carbon tax revenues. However, carbon tax is notone way fits to climate change mitigation.
Keywords : Carbon Tax, Fuel Tax, Mitigation, Climate ChangeJEC Code : Q5, Q52, Q54
1. Introduction
Since pre-industry, concentrations of anthropogenic greenhouse gases (GHGs) is
rising and causing the global climate change continuously (Dissanayake et al, 2018).
Pachauri et al (2014) stated that the main drivers of anthropogenic GHG emissions are
enhancement economic and population growth that causes change in lifestyle,
increasing energy use and land using patterns and then climate policy by government.
When mitigation of climate change fails, it will have long-term impacts on the survival
of living creatures (human and ecosystem) (Dissanayake, et al, 2018). Stern et al (2006)
argue that although such living change impact is spread over countries, poor countries
with little contribution to emission will be also significantly impacted.

3
GHG emission and CO2 concentration is predicted to increase by 525 parts per
million (ppm) and 650 ppm in 2050 according to the Global Business as Usual (Bau)
scenario (Burniaux et al 2008). Dissanayake et al (2018) believes that to reduce the
impacts of global climate change, policy-makers should arrange strategies to reduce the
emission by climate change mitigation. In 2015, United States Framework Convention
on Climate Change (UNFCCC) agreed on the global agreement to withstand the
increase of global average temperature below 2ºC (UNFCCC, 2015). In UNFCCC
(2015), it is also reportedly that most countries have given contributions in forms of
elaborative description of post-2020 climate change mitigation contribution in the
Intended Nationally Determined Contribution (INDC).
Concept of carbon tax efficiency becomes one of the strategies to evaluate
effectiveness of carbon taxes by considering CO2 reduction and Gross Domestic Bruto
(GDP) (Huijan et al, 2017). In “The Greening of the Whole Tax System”, tax is
designed to reduce environmental impact and generate economic incentives to
emphasize environmental burdens for sustainable social life (Committee for the
Promotion of Greening the Whole Tax System, 2012). Blanco et al (2014) confirm that
a significant “trade-off” trend has occurred between increasing carbon dioxide emission
and income. Policy to reduce emission through carbon taxes cause a drop in GDP, so
that the carbon tax stipulated should be well managed (Calderon et al, 2016; Vera and
Sauma, 2015; Alton, 2014; Blanco et al, 2014); Kim, 2014). The policy does not only
relate to how much the state consumes the total energy used, but also considers
solutions of Market-based Instruments (MBIs) (Duan et al, 2014; Stren, 2008). In
addition to carbon taxes, GHG reduction can also be implemented through fuel taxes as
one of the MBI solutions (Datta, 2011).
4
Based on the above solution, Gerlagh and Kuik (2014) conclude that to reduce
carbon emission and GHG, each country should develop potential innovation and
diffusion through supports of technology knowledge initiative specifically made to
contribute on carbon emission reduction. The tax collection is used to support the
development of renewable energy technology and subsidize environmental protection
projects on emission reduction (Lin and Li, 2011). Stren (2008) conveys three
fundamental criteria to reveal emission mitigation policy design, i.e. (1) effectiveness as
emission reduction by the required scale, (2) efficiency as a policy made by considering
cost and effects of minimum GDP loses, and (3) equality as a policy established as a
responsibility from emission producing countries by considering the impacts on the
vulnerability of poor or rich countries due to climate change.
Previous empirical studies analyzed the implementation of carbon taxes in the
smallest emitting countries in South Asia. Sri Lanka reduced emission by 7% from the
2010 level and suffered from declined real GDP by 0.2%. Meanwhile, solution of
emission reduction in Pakistan by 5% in 2011 impacted on GDP (Dissayake et al, 2018).
Huijan et al, (2017), in their research on impacts of carbon taxes and financial loses in
China explain that the amount of CO2 produced by industries in China has declined
from 12.2 billion tons to be 10.4 billion tons under the BaU scenario by Tax 20 in 2030.
Nevertheless, the carbon taxes will challenge economic development in several areas in
Chine (Huijan et al, 2017).
Zhou et al (2011) confirmed the research findings of Huijan et al (2017) on impacts
of carbon tax policy on CO2 mitigation and economic growth in China by indicating
that carbon tax rate led to CO2 emission reduction by 4.52%, 8.59%, and 12.26%, and
5
decreased GDP by 0.11%, 0.25%, and 0.39% in 2020. Another study in Japan revealed
that carbon taxes were the best solution to reduce emission, climate change, and energy
policy efficiency (Kawakatsu et al, 2017). A study in India, South Asia proposed that
carbon price induced a high macroeconomic cost and GDP loses by 20% in 2013
(Mathy and Guivarch, 2010). Mathy and Guivarch (2010) also added that effective
climate policy laid on the implementation of domestic policy in sub-optimization of
electricity sector in India, hence decreasing macroenocmic cost due to international
mitigation policies (Mathy and Guivarch, 2010). Contrastively, Datta (2010) proved that
carbon taxes gave positive impacts on the decrease of CO2 and fuel taxes in India
would progressively decrease emission such as carbon taxes with reduced demand of
transportation fuel.
Referring to the above empirical studies, this research aims to analyze both
efficiency and effectiveness of climate change mitigation policies for Asian economy in
Japan, China, and India by using MBI through carbon taxes. China experienced
increased GHG emission and had exceeded the emission of the United States and
become the largest carbon emitter in 2007 (Yu et al, 2015; Dong, 2015). Wesseh and
Lin (2018) stated that carbon taxes were unable to adequately mitigate climate change
in China, as the energy structure was still dominated by coals, concentrating the
implementation of tax on the decrease of electricity generation only. In fact, China had
contributed a considerably high growth level estimated to reach a half of global
emission projection between 2010 and 2040 (Carson et al, 2014). On the other side,
Japan was the first country in East Asia introducing carbon tax in October 2012 and
categorized as one of the largest carbon emitter countries in the world (Kawakatsu et al,
2017).

6
Source: National Greenhouse Gas Inventory Report of Japan, 2014Figure 1.1
Trends in CO2 emissions per unit GDP in Japan
Carbon dioxide (CO2) emissions per unit of GDP in 2012 were 2.46 tons. It had
decreased by 7.1% since 1990 but increased by 2.1% in the previous year. Additionally,
Japan had implemented current tax rate by JPY 779 for crude oil/oil products, JPY 400
for gases, JPY 301 for coal, and there were additional tax rate by JPY 289 for climate
change mitigation (Environment and Economy Division Ministry of the Environment,
2017). Ministry of Environment, Forest, and Climate Change Government of India
(2015) reported that India had stipulated various policies and strategies to improve
climate change mitigation attempts that required international financial supports.

7
Souruce: Databox, 2017Figure 1.2
List of the highest CO2 emitter countries in 2016
Figure 1.2 illustrates that the highest CO2 emission was contributed by China,
reaching 28.21% of the total world emissions. India and Japan occupied the top-5
position as CO2 emitters representing Asia and resulted in 6.24% and 3.67% of the total
world emissions, respectively. It encouraged the researcher to analyze three largest
emitting countries in Asia. The findings have implications similar to other studies’.
Therefore, this research considered both effectiveness and efficiency of policies
implemented to realize the goal of climate change mitigation in the selected countries.
This paper elaborates several parts in this following order. Section two (2)
describes relevant literatures regarding MBI-based climate change mitigation and
decreased GHG. Section three (3) describes methodology and data analysis model using
the environmental version of Global Trade Analysis Framework (GTAP-E). Then, the
findings are presented in section five (4), followed by conclusions in section five (5).

8
2. Literature Review
Climate change is responsibility of the economic system components (households,
firms, and governments) that produce Greenhouse Gases or GHG (Dissanayake et al,
2018). Dissanayake et al (2018) added that global climate change is also cost for current
and future generations. Nevertheless, most people do not directly bear the costs of
Greenhouse Gases (GHG) produced when make production and consumption patterns
decisions (Dissanayake et al, 2018). Pigou (1920) stated that tax is a instruments by
government that can reduces these negative externalities due to Greenhouse Gases
(GHG) and Market-based Instruments (MBI) concept is derived from Pigouvan tax
concept. According to Baranzini et al (2000), there is an market-based instruments
(MBI) divided into two mechanisms, namely the emissions trading scheme (ETS) and
carbon tax. An emissions trading scheme (ETS) is a scheme that stipulates limit the
amount of GHG emissions permitted, while carbon tax is a price-based instruments on
emissions. This has affected on the price of emissions-intensive goods highly in the
market and profits to be decreases (Baranzini et al, 2000).
Positive impact of two schemes is increasing on price of goods encouraging
economics agents to take conservative and investment steps. In addition, diversion of
fuel consumption or energy saving products, changes on economic production and
consumption pattern (Baranzini et al, 2000). This is supported by Stiglitz’s (2016) study
that found the equivalent price of carbon taxes with social costs emissions can prevent
climate change due to global warming significantly. Another empirical evidence
showed that carbon tax is an alternative policy in Greenhouse Gases (GHG) mitigation
and negative impacts can be minimized through design of the these tax (Freebairn,
9
2016). Goulder and Mathai (2000) added that carbon tax policy in a country must be
planned by appropriately for induce an optimal reduction emissions.
In addition, fuel tax also get an alternative to reduction emission environment
(Dissanayake et al, 2018). Study by Sterner (2012) detected that fuel tax in Europe and
Japan had a significant affect in fuel demand and CO2 emissions. The results of Sterner
(2007) also showed the same thing, namely fuel tax being the most effective climate
change instruments. These is indicated by a large decrease of carbon emissions in
hypothetical transportation demand at OECD. Fuel tax terrace resources allocation and
economic well-being and then reduces negative externalities from emissions (Parry et al,
2007; Spiller et al, 2014; and Li et al, 2014).
Study by Kim (2014) proved that carbon tax in Vietnam has good role in
developing renewable energy sources, despite there is negative impact from carbon tax
scenario by analyzing GTAP-E model. Another literature by Datta (2010) stated that
fuel tax in India will be progressive like carbon tax, which come down emissions
through duel tax demand of transportation. Agostini and Jimenez (2015) discovered that
fuel tax in Chili have a progressive impact in income distribution. Study from
Dissanayeka (2018) that use GTAP-E Analysis model on climate change mitigation in
Srilanka detected that tax carbon reduce emissions by 7% from 2010 level and weaken
real of GDP 0,2%, while Pakistan’s emissions reduced 5% in level of 2011 without
affected in GDP.
Huijan et al (2017) examined the impact of carbon taxes on abatement carbon
emissions and economic losses in China by CGE model. Result showed that Shanxi,
Mongolia, Dalam, Hebei, and Anhui provinces get priority of carbon tax policy in China
at price is no more than 50 USD/ton. The concept of carbon tax policy can evaluate the
10
tax effectiveness by considering abatement CO2 emissions and GDP’s losses (Huijan et
al, 2017; and Dong et al, 2015). Another study that supporting carbon tax has a positive
impact to climate change mitigation and reducing CO2 emissions (Gerlagh & Kuik,
2014; Bohringer et al, 2012; Dissanayake et al, 2018; Huijan et al, 2017; Dong, 2013;
Yi, 2011; Lin & Wesseh, 2016b; Zhou et al,2011; Lin, 2011). Although some literature
said carbon tax is effective for climate change mitigation, research from Kawakatsu et al
(2017); Wesseh & Lin (2018) considered carbon tax is not effective enough for climate
change mitigation and abatement carbon emissions. According Borner et al (2015);
Lehman (2012); Twomey (2012); dan Dissanayeka (2018) carbon tax and fuel tax get
an efficient draft of combination carbon emissions control.
3. Metodology
This research uses secondary data from GTAP-E version 9 with database in 2011.
In this GTAP-E model apply policy shock to analyze the impact of climate change
mitigation based on market-based instrument (MBI) in the largest Asian emissions.
These study refers research conducted by Dissanayake et al (2018).
3.1 The GTAP-Model
The general equilibrium approach was selected to captures the relationship between
energy use and economic and environmental effects (Dissanayake et al, 2018). GTAP
consists of global database, a standard general equilibrium framework, and software for
manipulating the data and then implementing the standard model (Nijkamp et al, 2005).
The global trade analysis project (GTAP) is a global network of researchers and policy
makers who carry out quantitative analysis of international policy issues (Walmsley et
al, 2012). These global database combines bilateral trade data, tranportation, and
protection which illustrates correlation regions by each region’s input-output database
11
and also inter-sectoral linkages (Nijkamp et al, 2005). The standard GTAP is a
comparative-static, multisectors, and multiregional of CGE model that assumes have
perfect competition and constant scales (Dissanayake et al, 2018). Furthermore, the
GTAP-E model is an extension of standard GTAP model that refers to environmental
energy for analyze GHG issues and related policy scenarios.
The use of GTAP-E model was developed by Burniaux and Truong (2002) and
McDougall and Golub (2007) of the GTAP-E version 9 by 2011 database. In study
Kremes et al (2002), climate change policy were analyzed by comparing CGE models
with a set of different characteristics in several aspects related this strategic research
issues of climate change. GTAP-E model serves explicit-composite energy capital
inputs into production structure (Nijkamp et al, 2005). On household regional side,
GTAP-E model formulates carbon tax function to consume commodities that emit
carbon gas such as petroleum and gasoline. In producers, production function is
characterized by Constant Elasticity of Substitution (CES). CES function representing
substitution elasticity for all production inputs is constants (Nijkamp et al, 2005).
The firms maximize profits with CES production function through combine
supporting main and input factors (Dissanayake et al, 2018). Firms pays rent to
households (HH) as honorarium of production factors (land, labor, capital, and natural
resources). Then, firms sell their product to another firms as intermediate inputs,
household sectors, government, and global markets (Dissanayake et al, 2018).

12
Source : Berniaux and Truong, 2002Figure 3.1
The GTAP-E Model : Capital Energy Composite Structure
In GTAP-E (Berniaux and Truong, 2002), CES divided into capital and energy as
inputs. Figure 3.1 representing multilevel structure of electrical energy that consists of
coal input and non coal input. Then, non coal input consist gases input, oil, and oil
petroleum products from Armington assumption. GTAP-E version has excess to
measuring CO2 emissions using bottom-up approach. Then, emissions can be assumed
proportional to energy consumption of the firms, households, government, and domestic
and import product. The carbon tax rate is a variable that sets nominal and rill rates and
also generate changes in prices and energy quantities or another commodities, thereby
converting consumption and production patterns to minimize negative impacts of
emissions (Dissanayake et al, 2018).

13
3.2 Database and Shock
This research uses GTAP-E version 9 database in 2011 (the latest reference
database). The data is applied CO2 emissions data from 140 regions into 15 aggregate
sectors and 57 commodities into 9 aggregate commodity sectors of GTAP-E.
Table 3.1Regional and sectoral aggregation
No. Aggregated Regions No. Aggregated Sectors
1. China 1. Coal
2. Japan 2. Oil
3. India 3. Gas
4. East Asia 4. Oil Products
5. Southeast Asia 5. Electricity
6. Rest of the World 6. Forestry
7. Agriculture
8. Energy intensive industries
9. Other industries and services
Source : Author’s aggregation using GTAP-E database Version 9, 2018
In this study, the GHG mitigation target scenario in carbon was analyzed separately
based on INDC from three regions namely China, Japan, and India which contributed
the largest Asian emissions. China has abatement carbon dioxide emissions target per
unit of GDP in 2030 by 40 until 45 percent (Dong, 2013; Yi, 2011; Lin dan Wesseh,
2016b; Zhou et al, 2011). Japan is considering to reduce GHG emissions around 26
percent in 2030 as its contribution to the global summit meeting about climate change in
Paris, while India has abatement emissions target of 33 percent in 2030 (Mu et al, 2017).
From table 3.2, in order to simplify the analysis that emission reduction targets in Japan,
China, and India are set as constraints in the reference scenario.

14
Table 3.2National reduction targets in three regions in INDC
Regions China Japan IndiaBase Year 2005 2013 2005
Target Year 2030 2030 2030
Commitments 40-45% 26% 33%
Source : Intended Nationally Determined Contributions (INDC), 2015
4. Results
4.1 Emission Abatement under mitigation taxes
This section discusses the simulation result of carbon tax in Japan, China, and India
separately. Giving carbon tax to each regions shows that the tax has positive impact to
abatement CO2 emissions. Figure 4.1 provide the results of total CO2 emissions (%
change) after carbon tax has imposed. The largest change in reducing CO2 emissions is
charged by coal as much 17,04% for Japan, 63,53% for China, and 46, 28% for India.
Even though oil products contribute smallest decreasing in CO2 emission, but overall
commodities sectors have a powerful instruments effect on reduction emissions in over
three regions.
Source : GTAP-E simulation result, 2018Figure 4.1
Impact on CO2 Emissions (% change)
15
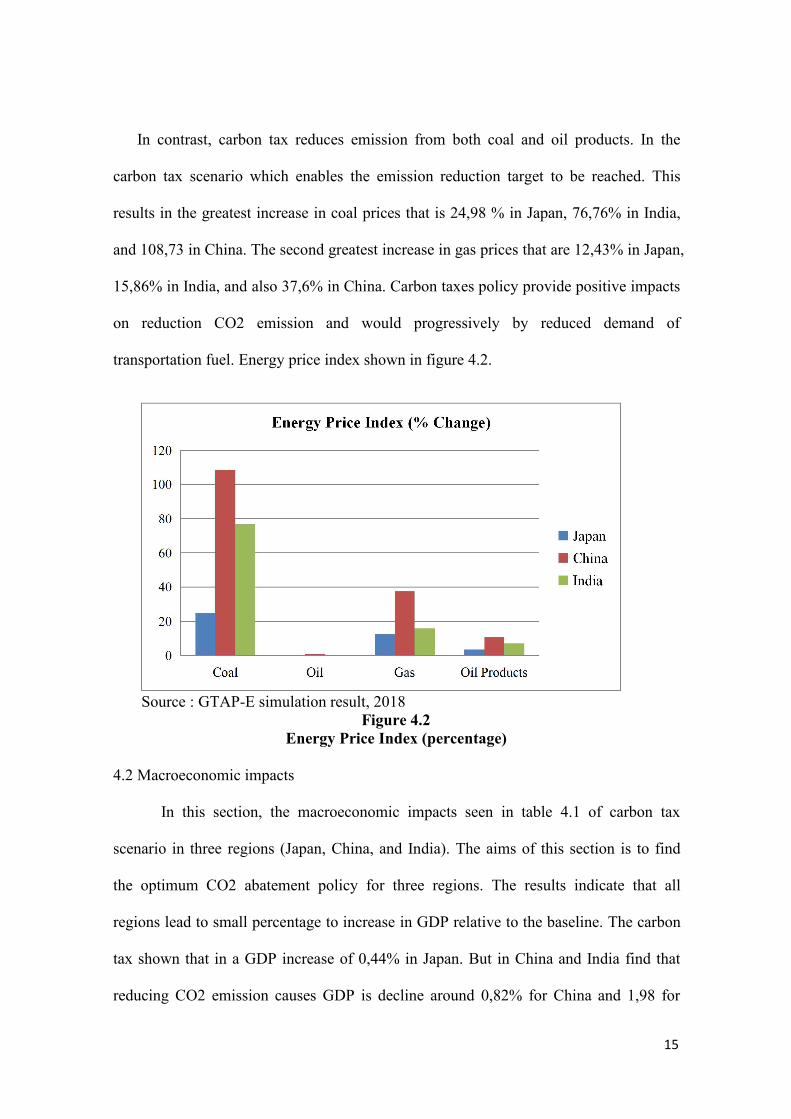
In contrast, carbon tax reduces emission from both coal and oil products. In the
carbon tax scenario which enables the emission reduction target to be reached. This
results in the greatest increase in coal prices that is 24,98 % in Japan, 76,76% in India,
and 108,73 in China. The second greatest increase in gas prices that are 12,43% in Japan,
15,86% in India, and also 37,6% in China. Carbon taxes policy provide positive impacts
on reduction CO2 emission and would progressively by reduced demand of
transportation fuel. Energy price index shown in figure 4.2.
Source : GTAP-E simulation result, 2018Figure 4.2
Energy Price Index (percentage)
4.2 Macroeconomic impacts
In this section, the macroeconomic impacts seen in table 4.1 of carbon tax
scenario in three regions (Japan, China, and India). The aims of this section is to find
the optimum CO2 abatement policy for three regions. The results indicate that all
regions lead to small percentage to increase in GDP relative to the baseline. The carbon
tax shown that in a GDP increase of 0,44% in Japan. But in China and India find that
reducing CO2 emission causes GDP is decline around 0,82% for China and 1,98 for

16
India. This result are consistent with Zhou et al (2011) research said that the impacts of
carbon tax policy on CO2 mitigation and economic growth in China can reduce CO2
emissions but also decreased in GDP growth. A study from Mathy and Guivarch (2010)
in India also found that carbon price induced a high macroeconomic cost and GDP loses
by 20% in 2013 (Mathy and Guivarch, 2010).
Table 4.1Macroeconomics impacts
Carbon TaxJapan China India
GDP (% Change) 0,44 -0,82 -1,98
investment -0,49 -6,7 -2,67
export 0,05 -1,27 -0,48
Import -0,14 0,11 -0,02
Trade balance (US$ Million) 5990,62 194657,1 16186,37
Allocative efficiency effects -6141,86 -71795 -9550,1
Term of trade effects 0,21 -1,43 -0,48
Output Change Effect -2234,6 -5,22 395,68
Source : GTAP-E simulation result, 2018
This taxation especially on energy commodities is a cost to producers and affect
their profits. So that, firms pass this burden to consumers through increased prices of
goods. The initial effect of the taxes is a reduction emission of energy consumption by
households and firms. So that, trade balance moving to increase. Like in Japan,
reduction of CO2 emission improves export and decreases import around 0,14% and
then trade balance will be go up automatically around 5990,62 US$ Million because of
export ratio is larger than import.

17
4.3 Sectoral impacts and employment effects
In regard to the tax policy scenario, table 4.2 shows that the changes in sectoral
output are determined by emissions intensity. Its means that the industries with higher
emissions intensity are the sector who have decline of output and rise of prices.
Table 4.2Sectoral impacts of carbon tax policy
Output (% Change) Prices (%Change) Contribution to trade balance(USS million)
Japan India China Japan India China Japan India ChinaAgriculture -0,2 -0,22 -0,55 0,42 -0,82 -2,28 -80,8 646,37 5986,64Forestry 0,06 0,41 -0,98 0,14 -1,83 -2,9 2,97 121,83 766,75Coal -6,6 -73,1 -43,24 -0,38 -38,64 -3,75 2477,85 -3345 -9762,5Oil -0,36 0,3 -0,65 -0,16 -0,49 -1,44 2518,43 4063,88 15233,4Gas 0,72 -19,41 -97,51 1,89 -2,83 18,37 3644,69 -330,08 -3849,96
Oil Products -1,9 -2,72 -5,07 0,84 0,74 0,98 926,63 180,25 550,17Electricity -3,82 -9,6 -26,26 6,11 14,75 47,08 -0,2 -110,77 -1267,57Energyintensiveindustries
-0,68 -4,08 -2,49 1,11 2,37 1,97 -2118,15 -7043,89 -21415,2
other industriesand services -0,18 -0,26 -0,95 0,39 -0,7 -1,29 -1380,79 22003,78 208415,3
Source : GTAP-E simulation results, 2018
Carbon tax usually is associated eith the least output deterioration and the minimum
price in oil, oil products, gas, electricity, energy intensive industries, and other
industries and services. Forestry sector hand experience positive output changes due to
movement of inputs away from the energy-intensive sectors into these sectors. The oil
products sector contribute the most improvements in trade balance in all carbon tax
policy regions. For example, Japan trade balances in oil sectors reach 2518,43 US$
million, and India reach 15233,4 US$ million, and also China has largest trade balance
in Asian around 4063,88 US$ million in oil products. This is due to of the larger
contraction in imports of these products and response to the levied taxes.

18
Table 4.3 shows that the majority of sectors experience employment losses in the
counter factual scenario. For most of the industries, the losses in the skilled labor
category exceed that of unskilled labor. The sectors that are highly exposed to the tax
show larger job losses. In sectors such as oil, oil products, energy-intensive industries,
and other industries and services, the loss is minimum with the carbon tax. With the
electricity sector, as it is price inelastic, although there may be a decrease in demand,
the overall GDP value of this sector will rise as the increase in price of electricity
outweighs the contraction in its demand. In addition, more labour is substituted for the
expensive carbon intensive inputs, leading to employment creation in the electricity
sector.
Table 4.3Labor market effects (percentage change)
Skilled UnskilledJapan India China Japan India China
Agriculture -0,16 -0,19 -0,56 -0,17 -0,08 -0,62Forestry 0,03 0,24 -1,11 0,02 0,32 -1,15Coal -11,76 -98,23 -49,24 -11,81 -98,2 -49,65Oil -0,72 0,49 -0,3 -0,73 0,65 -0,39Gas 0,72 -19,89 -97,49 0,72 -19,8 -97,49Oil Products -1,15 -0,37 -0,08 -1,18 0,12 -0,36Electricity 5,74 16,02 38,31 5,72 16,59 37,92Energy intensiveindustries
1,04 1,97 6,59 1,02 2,43 6,31
other industries andservices
-0,07 -0,4 -0,52 -0,09 0,15 -0,82
Source : GTAP-E simulation results, 2018
5. Conclusion
This study analyzed the emissions abatement potential, macroeconomics, sectoral,
and labor effects from reducing climate change in three regions which a largest Asian
emitter that is Japan, China, and India. Furthermore, this paper determined by GTAP-E

19
model with carbon tax mitigation target scenario from these regions. Japan has
reduction emissions target around 26%, India has 33% target of reduction emissions and
then China is around 40-45% reduction emission target from BaU levels.
This study conclude that carbon tax is best alternative choice for Japan, China, and
India to reduce CO2 emissions as a climate change mitigation. The carbon tax shown
that in a GDP increase of 0,44% in Japan. But in China and India find that reducing
CO2 emission causes GDP is decline around 0,82% for China and 1,98 for India. This
result are consistent with Zhou et al (2011) research said that the impacts of carbon tax
policy on CO2 mitigation and economic growth in China can reduce CO2 emissions but
also decreased in GDP growth. A study from Mathy and Guivarch (2010) in India also
found that carbon price induced a high macroeconomic cost and GDP loses by 20% in
2013 (Mathy and Guivarch, 2010).
For all regions which are high income, the analysis confirms that carbon tax is the
best implemented in the most cost-effective way, with considering net GDP. In the
sectoral impact, carbon tax has a positive impact such as Japan trade balances in oil
sectors reach 2518,43 US$ million, and India reach 15233,4 US$ million, and also
China has largest trade balance in Asian around 4063,88 US$ million in oil products.
This is due to of the larger contraction in imports of these products and response to the
levied taxes.
As with any study, this study has limitations which are worth considering for future
research, that is emission reduction targets and tax rates are based on BAU projections.
However, the actual trend of emissions can be higher or lower than the BAU projections
depending on factors such as other mitigation strategies, climate change adoption, and
the volatility of future fossil fuel prices.

20
References
Agostini, C.A., Jimenez, J., (2015). The distributional incidence of the gasoline tax inChile. Journal of Energy Policy . Vol.85, p.243–252.
Alton, T., Arndt, C., Davies, R., Hartley, F., Makrelov, K., Thurlow, J., Ubogu, D.,(2014). Introducing carbon taxes in South Africa. Appl. Journal of Energy. Vol.116, p.344–354.
Blanco G, Gerlagh R, Suh S, Barrett J, de Coninck HC, Morejon CFD, Mathur R,Nakicenovic N, et al (2014). Chapter 5 - Drivers, trends and mitigation. In:Climate Change 2014: Mitigation of Climate Change. IPCC Working Group IIIContribution to AR5. Cambridge University Press.
Baranzini, A., Goldemberg, J., Speck, S., (2000). A future for carbon taxes. Ecol. Econ.Vol.32,p.395–412.
Burniaux, J.M., Chateau, J., Duval, R., Jamet, S., (2008). The Economics of ClimateChange Mitigation : Policies and Options fot the Future (No.658). OECDPublishing.
Burniaux, J.M., Truong, T.P., (2002). GTAP-e: an Energy-environmental Version theGTAP Model. GTAP Technical Paper No. 18, Center for Global Trade Analysis.Department of Agricultural Economics, Purdue University.
Borner,€ J., Marinho, E., Wunder, S., (2015). Mixing carrots and sticks to conserveforests in the Brazilian Amazon: a spatial probabilistic modeling approach.PLoSOne 10 (2), e0116846.
Calderon, S., Alvarez, A.C., Loboguerrero, A.M., Arango, S., Calvin, K., Kober, T.,Daenzer, K., Fisher-Vanden, K., (2016). Achieving CO2 reductions in Colombia:effects of carbon taxes and abatement targets. Journal of Energy Econ. Vol. 56,p.575–586.
Carson, R.T., Jacobsen, M.R., Liu, A.A., (2014). Comparing the Cost of a Carbon Taxin China and the United States. Available at. Last assessed
Committee for the Promotion of Greening the Whole Tax System., (2012). Promotionof Greening the Whole Tax System. Compilation of Preceding Discussions on theMinistry of the Environment: Tokyo.
Datta, A., (2010). The incidence of fuel taxation in India. Journal of Energy Econ. Vol.32, p.26–33.
21
Dissayake, Sumali.,Mahadevan, Renuka., Asafu-Adjaye, John., (2018). How Efficientare market-based instruments in mitigating climate change in small emiter SouthAsian economies?. Journal of Economic Modelling, vol xxx, p.1-12.
Dong H, Dai H, Dong L, Fujita T, Geng Y, Klimont Z, et al,(2015). Pursuing airpollutant co-benefits of CO2 mitigation in China: a provincial leveled analysis.Journal of Appl Energy. Vol.144, p.165–74.
Duan H., Zhu L., Fan Y., (2014). Optimal carbon taxes in carbon-constrained China: alogistic-induced energy economic hybrid model. Journal of Energy. Vol. 69,p.345–356.
Freebairn, J., (2016). A comparison of policy instruments to reduce greenhouse gasemissions. Econ. Pap.: Journal of Application Economy. Vol. 35, p.204–215.
Gerlagh, Reyer., Kuik, Onno., (2014). Spill or leak? Carbon Leakage with Internationaltechnology spillovers : A CGE analysis. Journal of Energy Economics. Vol 45,p.381-388.
Huijan, Dong., Dai, H., Geng, Y., Fjita, T., Liu, Zhe., Xie, Yang., Wu, Rui., Fujii,Minoru., Masui, T., Tang, Liang.,(2017). Exploring impact of carbon tax onChina’s CO 2 reductions and provincial disparities. Journal of Renewable andSustainable Energy Reviews. Vol. 77,p.596-603.
Kawakatsu, Takeshi., Lee, Soochoel., Rudolph, Sven.,(2017). The Japanese carbon taxand the challenges to low-carbon policy cooperation in east asia. DiscussionPaper No. E-17-009. Graduate School of Economics : Kyoto University.
Kim, S., (2014). A general equilibrium model for energy policy evaluation usingGTAP-e for Vietnam. Journal of Economics. Vol. 2, p.347–355.
Lehmann, P., (2012). Justifying a policy mix for pollution control: a review ofeconomic literature. Journal of Economics Survey. Vol.26 (1), p.71–97.
Lin B., Li X., (2011). The effect of carbon tax on per capita CO2 emissions. Journal ofEnergy Policy. Vol.39,p.5137–46.
Mathy, Sandrine., Givarch, Celine.,(2010). Climate Policies in a Second-Best World- ACase Study on India. Journal of Energy Policy. Vol.38,p. 1519-1528.
McDougall, R., Golub, A., (2007). GTAP-e: a Revised Energy-environmental Versionof the GTAP Model. GTAP Research Memorandum, 15, Center for Global TradeAnalysis.
22
Mu, Yaqian., Wang, Can., Cai, Wenjia.,(2017). Using Sectoral Approach asComplement to the INDC Framework : an Analysis Based on the CGE Model.Journal of Energy Procedia. Vol.105, p.3433-3439.
Nijkamp, Peter., Wang, Shunli., Kremes, Hans., (2005). Modelling the impacts ofInternational Climate Change Policies in a CGE Context : The Use of the GTAP-E model. Journal of Economic Modelling. Vol.22, p.955-974
Pachauri, R.K., Allen, M.R., Barros, V., Broome, J., Cramer, W., Christ, R., Church, J.,Clarke, L., Dahe, Q., Dasgupta, P., (2014). Climate Change 2014: SynthesisReport. Contribution of Working Groups I, II and III to the Fifth AssessmentReport of the Intergovernmental Panel on Climate Change. IPCC.
Parry, I.W., Walls, M., Harrington, W., (2007). Automobile externalities and policies.Journal of Economy Literature. Vol.45, p.373–399.Journal of Economics Policy.Vol.6, p.302–342.
Pigou, A.C., (1920). The Economics of Welfare.McMillan and Co., London.
Stern, Nicholas., (2008). Key Elements of a Global Deal on Climate Change. LondonSchool of Economics and Political Science : London, United Kingdom.
Sterner, T., (2012). Distributional effects of taxing transport fuel. Jornal of EnergyPolicy. Vol.41, p.75–83.
Spiller, E., Stephens, H., Timmins, C., Smith, A., (2014). The effect of gasoline taxesand public transit investments on driving patterns. Environ. Journal of Resour.Econ. Vol.59, p.633–657.
Stiglitz, J., (2016). An agenda for sustainable and inclusive growth for emergingmarkets. Journal of Policy Model. Vol.38, p. 693–710.
Twomey, P., (2012). Rationales for additional climate policy instruments under acarbon price. Econ. Lab. Relat. Rev. Vol.23 (1), p.7–30.
UNFCCC, C.F., (2015). Adoption of the Paris Agreement. Proposal by the President(Draft Decision). United Nations Office: Geneva.
Vera, S., Sauma, E., (2015). Does a carbon tax make sense in countries with still a highpotential for energy efficiency? Comparison between the reducing-emissionseffects of carbon tax and energy efficiency measures in the Chilean case. Journalof Energy. Vol. 88, p. 478–488.
Walmsley, Terrie L., Aguiar, Angel H., Narayanan, Badri., (2012). Introduction to theGlobal Trade Analysis Project and the GTAP Data Base. GTAP Working PaperNo. 67 : Center for Global Trade Analysis, Purdue University

23
Wesseh, Presley K Jr., Lin, Boqiang.,(2018). Optimal carbon taxes for China andimplications for power generation, welfare, and the environment. Journal ofenergy policy. Vol 118, p.1-8.
Yu S, Zhang J, Zheng S, Sun H.,(2015). Provincial carbon intensity abatement potentialestimation in China: a PSO–GA-optimized multi-factor environmental learningcurve method. Journal of Energy Policy. Vol.77, p.46–55.
_______,.(2017). Greening of Whole Tax System and Carbon Tax in Japan.Environment and Economy Division Ministry of the Environment: January
_______,.(2017). These are the 10 Biggest CO2 Contribution Countries 2016. Accessedby https://databoks.katadata.co.id/datapublish/2017/06/12/inilah-10-negara-penyumbang-co2-terbesar-2016 on December 13th, 2018, at the time of 05.30 pm.
_______., (2015). India’s Intended Nationally Determined Contribution (INDC) :Working Towards Climate Justice. Access byhttps://www4.unfccc.int/sites/submissions/INDC/Published%20Documents/India/1/INDIA%20INDC%20TO%20UNFCCC.pdf on December 19th, 2018, at the time10.17 pm.
_______.,(2015). Submission of Japan’s Intended Nationally Determined Contribution(INDC).https://www4.unfccc.int/sites/submissions/INDC/Published%20Documents/Japan/1/20150717_Japan's%20INDC.pdf on December 19th, 2018, at the time10.12 pm.