climate change may alter human physical activity patterns
TRANSCRIPT
Climate change may alterhuman physical activity patterns
The Harvard community has made thisarticle openly available. Please share howthis access benefits you. Your story matters
Citation Obradovich, Nick, and James H. Fowler. 2017. “Climate Change MayAlter Human Physical Activity Patterns.” Nature Human Behaviour 1(5) (April 24): 0097. doi:10.1038/s41562-017-0097.
Published Version doi:10.1038/s41562-017-0097
Citable link http://nrs.harvard.edu/urn-3:HUL.InstRepos:36874928
Terms of Use This article was downloaded from Harvard University’s DASHrepository, and is made available under the terms and conditionsapplicable to Other Posted Material, as set forth at http://nrs.harvard.edu/urn-3:HUL.InstRepos:dash.current.terms-of-use#LAA
Climate change may alter human physical activity patterns
Nick Obradovich1,23 James H. Fowler4
Regular physical activity undergirds healthy human functioning1–3. Might
climate change -- by modifying the environmental determinants of human
physical activity -- alter exercise rates in the future4? Here we conduct an
empirical investigation of the relationship between meteorological
conditions, physical activity, and future climate change. Using data on
reported participation in recreational physical activity from over 1.9 million
United States survey respondents between 2002 and 2012, coupled with daily
meteorological data, we show that both cold and acutely hot temperatures as
well as precipitation days reduce physical activity. We combine our historical
estimates with output from 21 climate models and project the possible
physical activity impacts of future climatic changes by 2050 and 2099. Our
projection indicates that warming over the course of this century may
increase net recreational physical activity in the United States. Activity may
1 Corresponding author.
2 Belfer Center for Science and International Affairs, Kennedy School of Government, Harvard University.
3 Media Lab, Massachusetts Institute of Technology.
4 Departments of Political Science and Medicine, University of California San Diego.
increase most during the winter in northern states and decline most during
the summer in southern states.
At a physiological level, too little exercise can produce costly health outcomes like
obesity1, cardiovascular disease3 and diabetes2, and insufficient physical activity is a
leading cause of death in the United States5. Sedentary lifestyles are also associated
with psychological concerns such as impaired cognitive performance6 and a greater
risk of clinical depression and anxiety7. Human well-being clearly suffers from
insufficient physical activity. Yet even in spite of its substantial benefits, people in
many countries participate in below-recommended levels of physical activity8 and
are becoming increasingly sedentary9.
Further, external factors like urban and workplace design10, social relations11, and
environmental characteristics shape behaviors regarding when, where, and the
extent to which humans are physically active. Of the environmental factors affecting
physical activity rates, temperature plays a crucial role12. When it is too cold or too
hot, adults perform less physical activity, resulting in more sedentary lifestyles. In
large part, this reduction is due to the nature of adult physical activity: the vast
majority of exercise-related physical activity occurs outdoors13. When it is too cold
or to hot to go outdoors -- for a walk, a jog, or to garden -- many simply forgo
physical activity entirely.
These facts combine to suggest that weather and climate may be significant
determinants of behavioral patterns that underlie costly public health crises. Here
we report on the effect of meteorological conditions on participation in recreational
physical activity of over 1.9 million United States residents between 2002 and 2012.
Using these data, we examine four questions. First, what weather conditions are
most conducive to individual participation in physical activities? Second, do the
effects of temperature on physical activity vary by demographic factors like weight
and age? Third, how might climate change alter the distribution of physical activity
throughout the months of the year in the future? Finally, how might the future
impacts of climatic changes on physical activity vary geographically?
To investigate whether outside weather conditions alter the propensity to engage in
physical activity, we constructed a dataset of individuals' reported monthly
participation in recreational physical activity linked with monthly historical
meteorological data. Our individual response data come from the Center for Disease
Control and Prevention's Behavioral Risk Factor Surveillance Survey (BRFSS)
pooled over the period 2002-2012. Randomly selected respondents answered the
below question:
Physical Activity "During the past month, other than your regular job, did you
participate in any physical activities or exercises such as running, calisthenics, golf,
gardening, or walking for exercise?"
This question includes the most common leisure time physical activities engaged in
by adult residents of the United States13. Questions from the BRFSS have been
assessed for validity14 and reliability15 and are largely consistent with other health-
related activity measures including on dimensions of physical activity16. Further,

this specific question is employed in widely cited public health studies relating to
physical activity17,18.
We combine individual responses to this question -- marked by interview day and
geolocated to the city level -- with station-level daily temperature and precipitation
data from the National Centers for Environmental Information's Global Historical
Climatology Network - Daily (GHCN-D)19 as well as humidity and cloud cover data
from the National Centers for Environmental Prediction (NCEP) Reanalysis II
project20 (see ). Of note, our analysis is robust to the use of gridded daily weather
data from the PRISM Climate Group instead (see SI: PRISM Data)21. Our theoretical
relationship of interest is the effect of meteorological conditions on the probability
of being physically active. We empirically model this relationship as:
𝑌𝑌𝑖𝑖𝑖𝑖𝑖𝑖𝑖𝑖 = 𝑓𝑓�𝑡𝑡𝑡𝑡𝑡𝑡𝑝𝑝𝑖𝑖𝑖𝑖𝑖𝑖� + 𝑍𝑍𝑍𝑍 + 𝛾𝛾𝑖𝑖 + 𝜈𝜈𝑖𝑖𝑖𝑖 + 𝜖𝜖𝑖𝑖𝑖𝑖𝑖𝑖𝑖𝑖(1)
In this pooled cross-sectional linear probability model fitted via least squares, 𝑖𝑖
indexes individuals, 𝑗𝑗 indexes cities, 𝑠𝑠 indexes seasons, and 𝑡𝑡 indexes calendar days.
Our dependent variable 𝑌𝑌𝑖𝑖𝑖𝑖𝑖𝑖𝑖𝑖 is binary and represents whether respondents were
physically active over the thirty days prior to their interview day. Our main
independent variable, 𝑡𝑡𝑡𝑡𝑡𝑡𝑝𝑝𝑖𝑖𝑖𝑖𝑖𝑖, represents the thirty-day average of daily maximum
temperatures over the same thirty day window as respondents' reported physical
activity. Our relationship of interest is represented by 𝑓𝑓�𝑡𝑡𝑡𝑡𝑡𝑡𝑝𝑝𝑖𝑖𝑖𝑖𝑖𝑖�, which provides
separate indicator variables for each 1℃ monthly average maximum temperature
bin, allowing for flexible estimation of a non-linear relationship between
temperature and physical activity (of note, our results are robust to using one, two,
and five ℃ bins, see: SI: Varying Bin Sizes)22,23. We omit the 28℃-29℃ indicator
variable, and thus interpret our estimates as the change in probability of being
physically active associated with a particular temperature range relative to the 28℃-
29℃ baseline.
Further, the 𝑍𝑍𝑍𝑍 term in Equation 1 represents an additional set of meteorological
variables that include number of precipitation days over the thirty-day window,
average temperature range, average cloud cover, and average relative humidity. We
include these other meteorological variables as their exclusion might bias our
estimates of the effect of included meteorological variables (although the magnitude
of the estimates of 𝑓𝑓�𝑡𝑡𝑡𝑡𝑡𝑡𝑝𝑝𝑖𝑖𝑖𝑖𝑖𝑖� are mostly unaffected by the exclusion of these
variables, see: SI: Main Effect)24,25.
Unobserved characteristics may influence participation in physical activity. For
example, people may exercise more in cities with better infrastructure or on days
when they are more likely to have leisure time. To be sure that geographic and
temporal factors like these do not interfere with our estimates, we include 𝛾𝛾𝑖𝑖 , and
𝜈𝜈𝑖𝑖𝑖𝑖 in Equation 1. These terms represent calendar date and city-by-season indicator
variables that account for unobserved characteristics constant across cities and days
as well as seasonal factors that might vary differentially by city26. Of note, our
results are robust to varying the specification of these controls (see SI: Time and
Location Controls). Our empirical identifying assumption, consistent with the
literature25,27–29, is that meteorological variables are as good as random after
conditioning on these fixed effects. The estimated model coefficients can thus be

interpreted as the effect of meteorological conditions on reports of participation in
recreational physical activity24,30,31.
Because our estimation procedure uses exogenous city-level variation in
temperature to predict individual-level outcomes, we account for within-city and
within-day correlation32 by employing heteroskedasticity robust standard errors
clustered on both city and day33,34. Finally, we omit non-climatic control variables
from Equation 1 because of their potential to generate bias -- a phenomenon known
as a `bad control'25,31 -- in our parameter of interest (nonetheless, results are robust
to the inclusion of common demographic covariates; see SI: Demographic Controls).
Figure 1 panel (a), which presents the estimates of 𝑓𝑓�𝑡𝑡𝑡𝑡𝑡𝑡𝑝𝑝𝑖𝑖𝑖𝑖𝑖𝑖� from Equation 1,
indicates the probability of participation in physical activity increases up to 28℃-
29℃ and decreases past 36℃, though effects at higher temperatures are estimated
with greater error. Average maximum temperatures around 0℃ produce a reduction
of approximately seven percentage points in the probability of being physically
active as compared to the 28℃-29℃ baseline (coefficient: -7.249, p: , n:1,941,429)).
Average maximum temperatures above 40℃ reduce the probability of physical
activity, though the effect is only about one-half as large as the effect of freezing
temperatures and is only significant at the p=0.10 level (coefficient: -2.815, p: 0.079,
n:1,941,429).
Putting scale to the magnitude of our estimated relationship, a +2℃ shift from an
average monthly temperature of 26℃-27℃ to an average of 28℃-29℃, if extrapolated

across the current population of the United States, would produce over six million
additional person-months of physical activity annually.
However, temperature alone may not fully capture the effect of heat stress on
participation in physical activity35–38. Heat stress indices, composites between
temperature and relative humidity, might indicate that participation in physical
activity declines in instances of both high temperature and high humidity39. In order
to investigate whether heat stress metrics provide substantively different results
than temperature alone, we examine the results of estimating:
𝑌𝑌𝑖𝑖𝑖𝑖𝑖𝑖𝑖𝑖 = 𝑓𝑓�ℎ𝑡𝑡𝑒𝑒𝑡𝑡. 𝑖𝑖𝑖𝑖𝑖𝑖𝑡𝑡𝑥𝑥𝑖𝑖𝑖𝑖𝑖𝑖� + 𝑍𝑍𝑍𝑍 + 𝛾𝛾𝑖𝑖 + 𝜈𝜈𝑖𝑖𝑖𝑖 + 𝜖𝜖𝑖𝑖𝑖𝑖𝑖𝑖𝑖𝑖(2)
Where we employ the same set of control variables as in Equation 1, but substitute
the National Weather Service (NWS) Heat Index37,40,41 -- our measure of heat stress -
- for maximum temperature and humidity (of note, the NWS Heat Index mirrors
temperature values over the lower portion of its distribution). The results of
estimating this equation, presented in Figure 1 panel (b), closely mirror the results
of colder maximum temperatures in panel (a) of Figure 1, and we observe no
significant decline in physical activity participation at high levels of combined heat
and humidity (see SI: Heat Index for the tables associated with this regression).
These results, coupled with the insignificance of the marginal effects of relative
humidity (panel (d) of Figure 1) indicate that the effect we observe is primarily
driven by ambient temperatures (for results using alternative heat stress indices37,
see SI: Alternative Heat Stress Indices). Further, we observe a small, mostly linear
effect of added precipitation days on physical activity participation (panel (c) of

Figure 1), with greater than 20 days with measurable precipitation in a month
producing a reduction of approximately one percentage point in the probability of
participation in physical activity (coefficient: -1.144, p: 0.009, n:1,941,429). We
observe no significant relationship between average cloud cover and participation
in physical activity.
The above estimates represent an average effect of temperatures on physical
activity over the course of a full year across all respondents in our sample. However,
because individuals vary in their sensitivity to heat and cold42, we might expect to
observe heterogeneous responses to changes in temperature. For example,
individuals with higher Body Mass Index (BMI) may experience greater physical
stress associated with hot temperatures. Further, older individuals, due to less
robust thermoregulation ability43, may similarly experience more acute reductions
in physical activity due to extreme heat. This leads us to our second question: do the
effects of temperature on physical activity vary along important demographic
factors like weight and age?
In order to examine whether heavier respondents are more sensitive to
temperature, we stratify our sample by BMI and estimate Equation 1 for each sub-
sample28. Figure 2, panel (a), shows that the negative effect of temperatures greater
than 40℃ on the probability of physical activity is greatest for obese (BMI>=30)
respondents (coefficient: -6.567, p: 0.002, n:466,754). This is over seven times the
effect observed among normal weight (BMI<25) adults (coefficient: -0.866, p: 0.549,
n:711,662) (see SI: Weight Regressions).
We repeated this procedure to examine whether older respondents are more
sensitive to temperature. Figure 2, panel (b), shows that the negative effect of
temperatures greater than 40℃ on the probability of physical activity is greatest for
those 65 years of age or older (coefficient: -7.026, p: , n:517,700). This is over four
times the effect observed among those under 40 years of age (coefficient: -1.574, p:
0.569, n:456,383). Thus, our results suggest that the physical activity rates of both
obese and elderly individuals may be most susceptible to higher ambient
temperatures.
Our historical data indicate that past temperatures have altered historical physical
activity patterns in meaningful ways. Further, climate change is likely to produce
positive shifts in monthly temperature distributions in the future44 (see Figure 3,
panel (b)). As can be seen in panel (a) of Figure 3, most historical temperatures fall
below 28℃-29℃, the temperature range associated w ith peak physical activity in our
sample. Positive shifts in temperatures below 28℃-29℃ might increase physical
activity while shifts that amplify the incidence of markedly hot temperatures may
reduce physical activity. Combining these insights leads us to our third question:
how might climate change alter the distribution of physical activity in the United
States throughout the months of the year in the future?
To examine this question, we calculate projected average monthly maximum
temperatures for 2050 and 2099 from NASA Earth Exchange's (NEX) bias-corrected,
statistically downscaled daily maximum temperature projections45 drawn from 21
of the CMIP-5 ensemble models46 run on the RCP8.5 high emissions or 'business as
usual' scenario47. We couple these predicted temperatures with our historical
estimate of the relationship between average maximum temperatures and
participation in physical activity -- employing a spline regression model that closely
matches the results from Equation 1 -- to calculate a forecast of possible physical
activity alterations due to climate change for each month of the year for each city
across each downscaled climate model (see SI: Forecast Details).
We define our monthly forecast of the predicted change in physical activity due to
climate change by 2050 (𝛥𝛥𝑌𝑌𝑚𝑚2050) as:
𝛥𝛥𝑌𝑌𝑚𝑚2050 = 𝑓𝑓�𝑡𝑡𝑡𝑡𝑡𝑡𝑝𝑝𝑘𝑘𝑖𝑖𝑚𝑚𝑖𝑖2050� − 𝑓𝑓�𝑡𝑡𝑡𝑡𝑡𝑡𝑝𝑝𝑘𝑘𝑖𝑖𝑚𝑚𝑖𝑖,2010�(3)
and for the effect from 2010 to 2099 (𝛥𝛥𝑌𝑌𝑚𝑚2099) as:
𝛥𝛥𝑌𝑌𝑚𝑚2099 = 𝑓𝑓�𝑡𝑡𝑡𝑡𝑡𝑡𝑝𝑝𝑘𝑘𝑖𝑖𝑚𝑚𝑖𝑖2099� − 𝑓𝑓�𝑡𝑡𝑡𝑡𝑡𝑡𝑝𝑝𝑘𝑘𝑖𝑖𝑚𝑚𝑖𝑖,2010�(4)
Where 𝑡𝑡 indexes the month of year, 𝑘𝑘 indexes the 21 specific climate models, 𝑗𝑗
indexes the city, and 𝑡𝑡 indexes the day of year. Further, 𝑡𝑡𝑡𝑡𝑡𝑡𝑝𝑝𝑘𝑘𝑖𝑖𝑚𝑚𝑖𝑖 is our measure of
thirty-day average maximum temperatures, as calculated in Equation 1 and 𝑓𝑓( )
represents the fitted spline function from our main forecast model (see SI: Forecast
Models). Importantly, this estimation procedure allows us to incorporate
uncertainty regarding the underlying climatic forecasts into our physical activity
predictions27. It also allows us to account for estimation uncertainty in our model of
physical activity.
Figure 3 panels (c) and (d) plot our monthly forecast results for 2050 and 2099,
respectively. The bar for each month represents an average prediction across each

of the 21 climate models, across each of the cities in our analysis, and across the
days in that month. The error lines on these bars represent the full range of these
monthly estimates across the 21 downscaled climate models and incorporate the
95% confidence interval of the estimated historical relationship between
temperature and physical activity. As can be seen in these figures, the likely
temperature changes produced by climate change may most increase physical
activity in traditionally cooler months of the year. In the months of June, July, and
August, climate change by 2099 may reduce physical activity on net. Taking a yearly
sum of our monthly average predictions across the United States, we project that
climate change may cause approximately 40 additional physically active person-
months per 1,000 individuals on net by 2050 and approximately 70 additional
person-months per 1,000 individuals on net by 2099.
Additionally, temperature alterations associated with climate change -- and thus the
potential impacts of climate change on physical activity -- are likely to vary spatially
across the United States. To investigate the geographic distribution of potential
modifications in physical activity due to climate change, we take the ensemble
average of the 21 NEX downscaled climate models for each of 2010, 2050, and 2099.
We then take the monthly average of maximum temperatures for each
approximately 25km x 25km grid cell in the continental U.S. in each year. For the
2050 forecast, we assign to each grid cell the predicted net monthly difference in
physical activity between 2010 and 2050. For the 2099 forecast we assign to each
grid cell the predicted net monthly difference in physical activity between 2010 and
2099. Figure 4 shows that most areas of the United States may see net increases in
physical activity as a result of climate change this century, while southernmost areas
may experience some net decreases in physical activity (see SI: Grid Cell Forecast).
Finally, smoothing geographic forecasts across the full year (as in Figure 4) masks
the temporal heterogeneity associated with our physical activity forecasts. Figure 5
plots the geographic forecasts for each month in the years 2050 and 2099
respectively. Future winter months, especially in northern areas of the US may see
the greatest increases in physical activity rates, while future summer months,
particularly in southern areas of the US may see net decreases in physical activity
rates.
Historical data demonstrates a robust link between temperature and human
physical activity. The effects of cold historical temperatures on reduced
participation in physical activity are highly statistically significant and substantively
large in magnitude. Moreover, in both our city-level and geographic forecasts, we
predict that much of the United States will experience increased physical activity
due to future climatic changes. These increases occur primarily during cooler
months of the year, with summer months -- especially in southern areas of the US --
likely seeing potential declines in future physical activity.
There are several considerations important to the interpretation of these results.
First, while we have data on millions of individuals' reported monthly participation
in physical activity, optimal data would also contain measurements of each
individual's participation in daily physical activity and the intensity of such activity.
Second, because respondents are geolocated to the city-level, measurement error
may exist between the temperatures observed at weather stations and the
temperatures respondents actually experienced, possibly attenuating the magnitude
of our estimates48. Third, our analysis is conducted on a randomly sampled, pooled
cross section of respondents. An ideal source of data would track the same
individuals over time to enable controlling for individual-specific characteristics.
Fourth, our data are restricted to observations from one country with a temperate
climate. It is critical to repeat this analysis where possible in countries with warmer
average climates49 and lower prevalence of air conditioning50, as they may see net
reductions in physical activity due to climate change. Fifth, in this analysis we focus
on recreational physical activities. However, because occupational physical activity
may be less discretionary, the effects of climate change on occupational physical
activity deserve further scrutiny38,51. Sixth, because the hottest historical regions in
our data also tend to have lower humidity, our analysis may understate the
potential for amplified future levels of heat stress to reduce physical activity. Future
studies should investigate this question. Finally, it is possible that humans may
adapt technologically and physiologically to warmer climates with behaviors not
seen in the historical data42,52,53.
Ultimately, most of climate change's social impacts are likely to be negative30.
Climate change may reduce economic output24, amplify rates of conflict31, produce
psychological distress54, increase exposure to the social effects of drought55, and
increase heat-related mortality and morbidity56–61, among other ills. However,
climatic changes are unlikely to be uniformly costly to society, and it is important to
investigate both costs and benefits. Here we uncover a possible beneficial impact of
climate change for the United States. If observed temperature-activity relationships
from the recent past persist, further climate change may increase nationwide net
participation in recreational physical activity during many months of the year, in
turn magnifying many of the physiological and psychological benefits of exercise.
However, adaptations to changing temperature distributions or interactions with
potential pernicious effects of climate change30 -- like increased stress and anxiety54
-- may counteract these effects. The more we know about the full range of potential
climate impacts, the better we will be able to prepare for what is likely to be
humanity's greatest challenge in the 21st Century.
Correspondence
Correspondence and requests for materials should be addressed to N.O.
Acknowledgements
We thank the San Diego Supercomputer Center for their assistance. N.O. was
supported during the course of manuscript preparation by the Frontiers of
Innovation Fellowship from the University of California San Diego, the Belfer Center
for Science and International Affairs at the Harvard Kennedy School, and the MIT
Media Lab. The funders had no role in study design, data collection and analysis,
decision to publish, or preparation of the manuscript.

Author contributions
N.O. conceived of the research question, constructed and analyzed the historical
data, conducted the forecast, and compiled the supplementary information. N.O. and
J.H.F. developed figures and drafted the manuscript.
Competing interests
The authors declare they have no competing interests.
Data availability
Replication data can be accessed via Harvard's Dataverse
(doi:10.7910/DVN/SGQEZP).
Code availability
Replication code can be accessed via Harvard's Dataverse
(doi:10.7910/DVN/SGQEZP).
References
1. Hill, J. O. & Peters, J. C. Environmental contributions to the obesity epidemic.
Science 280, 1371–1374 (1998).
2. Sigal, R. J., Kenny, G. P., Wasserman, D. H., Castaneda-Sceppa, C. & White, R. D.
Physical activity/exercise and type 2 diabetes a consensus statement from the
American Diabetes Association. Diabetes Care 29, 1433–1438 (2006).

3. Shiroma, E. J. & Lee, I.-M. Physical activity and cardiovascular health lessons
learned from epidemiological studies across age, gender, and race/ethnicity.
Circulation 122, 743–752 (2010).
4. Stamatakis, E., Nnoaham, K., Foste, C. & Scarboroug, P. The influence of global
heating on discretionary physical activity: An important and overlooked
consequence of climate change. J. Phys. Act. Health 10, 765–768 (2013).
5. Mokdad, A. H., Marks, J. S., Stroup, D. F. & Gerberding, J. L. Actual causes of death in
the United States, 2000. JAMA 291, 1238–1245 (2004).
6. Hillman, C. H., Erickson, K. I. & Kramer, A. F. Be smart, exercise your heart:
Exercise effects on brain and cognition. Nature Reviews Neuroscience 9, 58–65
(2008).
7. Teychenne, M., Ball, K. & Salmon, J. Physical activity and likelihood of depression
in adults: A review. Preventive Medicine 46, 397–411 (2008).
8. Haskell, W. L. et al. Physical activity and public health: Updated recommendation
for adults from the American College of Sports Medicine and the American Heart
Association. Circulation 116, 1081 (2007).
9. Brownson, R. C., Boehmer, T. K. & Luke, D. A. Declining rates of physical activity in
the United States: What are the contributors? Annu. Rev. Public Health 26, 421–443
(2005).

10. Brownson, R. C., Baker, E. A., Housemann, R. A., Brennan, L. K. & Bacak, S. J.
Environmental and policy determinants of physical activity in the United States.
American Journal of Public Health 91, 1995–2003 (2001).
11. Giles-Corti, B. & Donovan, R. J. The relative influence of individual, social and
physical environment determinants of physical activity. Social Science & Medicine
54, 1793–1812 (2002).
12. Tucker, P. & Gilliland, J. The effect of season and weather on physical activity: A
systematic review. Public Health 121, 909–922 (2007).
13. Dannenberg, A. L., Keller, J. B., Wilson, P. W. & Castelli, W. P. Leisure time
physical activity in the Framingham Offspring Study description, seasonal variation,
and risk factor correlates. American Journal of Epidemiology 129, 76–88 (1989).
14. Oswald, A. J. & Wu, S. Objective confirmation of subjective measures of human
well-being: Evidence from the USA. Science 327, 576–579 (2010).
15. Nelson, D. E., Holtzman, D., Bolen, J., Stanwyck, C. A. & Mack, K. A. Reliability and
validity of measures from the Behavioral Risk Factor Surveillance System (BRFSS).
Sozial-und Praventivmedizin 46, S3–42 (2000).
16. Yore, M. M. et al. Reliability and validity of the instrument used in BRFSS to
assess physical activity. Medicine and Science in Sports and Exercise 39, 1267–1274
(2007).

17. Siegel, P. Z., Brackbill, R. M. & Heath, G. W. The epidemiology of walking for
exercise: Implications for promoting activity among sedentary groups. American
Journal of Public Health 85, 706–710 (1995).
18. Evenson, K. R., Herring, A. H. & Huston, S. L. Evaluating change in physical
activity with the building of a multi-use trail. American Journal of Preventive
Medicine 28, 177–185 (2005).
19. Menne, M. J., Durre, I., Vose, R. S., Gleason, B. E. & Houston, T. G. An overview of
the Global Historical Climatology Network-daily database. Journal of Atmospheric
and Oceanic Technology 29, 897–910 (2012).
20. Kanamitsu, M. et al. NCEP–DOE AMIP-II reanalysis (R-2). Bulletin of the American
Meteorological Society 83, (2002).
21. Di Luzio, M., Johnson, G. L., Daly, C., Eischeid, J. K. & Arnold, J. G. Constructing
retrospective gridded daily precipitation and temperature datasets for the
conterminous United States. Journal of Applied Meteorology and Climatology 47,
475–497 (2008).
22. Deschênes, O. & Greenstone, M. Climate change, mortality, and adaptation:
Evidence from annual fluctuations in weather in the US. American Economic Journal:
Applied Economics 3, 152–185 (2011).
23. Graff Zivin, J. S. & Neidell, M. Temperature and the allocation of time:
Implications for climate change. Journal of Labor Economics 32, 1–26 (2014).

24. Burke, M., Hsiang, S. & Miguel, E. Global non-linear effect of temperature on
economic production. Nature 527, 235–235 (2015).
25. Hsiang, S. Climate econometrics. Annual Review of Resource Economics 8, 43–75
(2016).
26. Wooldridge, J. M. Econometric analysis of cross section and panel data. (MIT
press, 2010).
27. Auffhammer, M., Hsiang, S. M., Schlenker, W. & Sobel, A. Using weather data and
climate model output in economic analyses of climate change. Review of
Environmental Economics and Policy ret016 (2013).
28. Dell, M., Jones, B. F. & Olken, B. A. What do we learn from the weather? The new
climate-economy literature. Journal of Economic Literature 52, 740–798 (2014).
29. Obradovich, N. Climate change may speed democratic turnover. Climatic Change
1–13 (2016).
30. Carleton, T. A. & Hsiang, S. M. Social and economic impacts of climate. Science
353, aad9837 (2016).
31. Hsiang, S. M., Burke, M. & Miguel, E. Quantifying the influence of climate on
human conflict. Science 341, 1235367 (2013).
32. Moulton, B. R. An illustration of a pitfall in estimating the effects of aggregate
variables on micro units. The Review of Economics and Statistics 334–338 (1990).

33. Cameron, A. C., Gelbach, J. B. & Miller, D. L. Robust inference with multiway
clustering. Journal of Business & Economic Statistics 29, (2011).
34. Stock, J. H. & Watson, M. W. Heteroskedasticity-robust standard errors for fixed
effects panel data regression. Econometrica 76, 155–174 (2008).
35. Haldane, J. The influence of high air temperatures no. i. Journal of Hygiene 5,
494–513 (1905).
36. Simon, H. B. Hyperthermia. New England Journal of Medicine 329, 483–487
(1993).
37. Buzan, J., Oleson, K. & Huber, M. Implementation and comparison of a suite of
heat stress metrics within the community land model version 4.5. Geoscientific
Model Development 8, 151 (2015).
38. Kjellstrom, T. et al. Heat, human performance, and occupational health: A key
issue for the assessment of global climate change impacts. Annual review of public
health 37, 97–112 (2016).
39. Minard, D., Belding, H. S. & Kingston, J. R. Prevention of heat casualties. Journal of
the American Medical Association 165, 1813–1818 (1957).
40. Steadman, R. G. The assessment of sultriness. part I: A temperature-humidity
index based on human physiology and clothing science. Journal of Applied
Meteorology 18, 861–873 (1979).

41. Rothfusz, L. P. The heat index equation (or, more than you ever wanted to know
about heat index). Fort Worth, Texas: National Oceanic and Atmospheric
Administration, National Weather Service, Office of Meteorology 9023, (1990).
42. Périard, J. D., Travers, G. J., Racinais, S. & Sawka, M. N. Cardiovascular adaptations
supporting human exercise-heat acclimation. Autonomic Neuroscience 196, 52–62
(2016).
43. Van Someren, E. J., Raymann, R. J., Scherder, E. J., Daanen, H. A. & Swaab, D. F.
Circadian and age-related modulation of thermoreception and temperature
regulation: Mechanisms and functional implications. Ageing Research Reviews 1,
721–778 (2002).
44. Seneviratne, S. I., Donat, M. G., Mueller, B. & Alexander, L. V. No pause in the
increase of hot temperature extremes. Nature Climate Change 4, 161–163 (2014).
45. Thrasher, B., Maurer, E. P., McKellar, C. & Duffy, P. Technical note: Bias correcting
climate model simulated daily temperature extremes with quantile mapping.
Hydrology and Earth System Sciences 16, 3309–3314 (2012).
46. Taylor, K. E., Stouffer, R. J. & Meehl, G. A. An overview of CMIP5 and the
experiment design. Bulletin of the American Meteorological Society 93, 485–498
(2012).
47. Riahi, K. et al. RCP 8.5 – a scenario of comparatively high greenhouse gas
emissions. Climatic Change 109, 33–57 (2011).

48. Hausman, J. Mismeasured variables in econometric analysis: Problems from the
right and problems from the left. Journal of Economic Perspectives 57–67 (2001).
49. Gasparrini, A. et al. Changes in susceptibility to heat during the summer: A
multicountry analysis. American journal of epidemiology 183, 1027–1036 (2016).
50. Davis, L. W. & Gertler, P. J. Contribution of air conditioning adoption to future
energy use under global warming. Proceedings of the National Academy of Sciences
112, 5962–5967 (2015).
51. Parsons, K. Occupational health impacts of climate change: Current and future
iSO standards for the assessment of heat stress. Industrial health 51, 86 (2013).
52. Sawka, M. N., Leon, L. R., Montain, S. J. & Sonna, L. A. Integrated physiological
mechanisms of exercise performance, adaptation, and maladaptation to heat stress.
Comprehensive Physiology (2011).
53. Castellani, J. W. & Tipton, M. J. Cold stress effects on exposure tolerance and
exercise performance. Comprehensive Physiology (2016).
54. Doherty, T. J. & Clayton, S. The psychological impacts of global climate change.
American Psychologist 66, 265 (2011).
55. Dai, A. Drought under global warming: A review. Wiley Interdisciplinary Reviews:
Climate Change 2, 45–65 (2011).
56. Basu, R. & Samet, J. M. Relation between elevated ambient temperature and
mortality: A review of the epidemiologic evidence. Epidemiologic reviews 24, 190–
202 (2002).
57. Deschenes, O. Temperature, human health, and adaptation: A review of the
empirical literature. Energy Economics 46, 606–619 (2014).
58. Hajat, S., Armstrong, B. G., Gouveia, N. & Wilkinson, P. Mortality displacement of
heat-related deaths: A comparison of Delhi, Sao Paulo, and London. Epidemiology
16, 613–620 (2005).
59. Gething, P. W. et al. Climate change and the global malaria recession. Nature 465,
342–345 (2010).
60. Guo, Y. et al. Global variation in the effects of ambient temperature on mortality:
A systematic evaluation. Epidemiology (Cambridge, Mass.) 25, 781 (2014).
61. Shi, L., Kloog, I., Zanobetti, A., Liu, P. & Schwartz, J. D. Impacts of temperature and
its variability on mortality in New England. Nature climate change 5, 988–991
(2015).
Figure 1 Recreational physical activity peaks at higher temperatures and heat
index values and declines with higher numbers of precipitation days. Panel (a)
draws from the estimation of the linear probability model in Equation 1 on over 1.9
million respondents' reported monthly participation in physical activities between
2002 and 2012. It plots the predicted probability of physical activity associated with
each maximum temperature bin. Participation in physical activities increases up to
28℃-29℃ (82-84F) and begins to decline past that point, though the effects of hotter
temperatures are estimated with higher uncertainty. Panel (b) plots the marginal
effects of the National Weather Service Heat Index on the probability of physical
activity participation. The effects of colder values of the Heat Index closely mirrors the
effects of colder maximum temperatures. Panel (c) plots the effect of monthly days
with measurable precipitation on physical activity. Added precipitation days linearly
decrease the probability of participation in physical activity, though the marginal
effects are notably smaller than they are for temperature or heat stress. Panel (d)
indicates there is no independent effect of relative humidity on engagement in physical
activities. Points in each panel represent the mean percentage of respondents who
were physically active in the past month for each bin of the respective meteorological
variable. Shaded error bounds represent 95% confidence intervals.
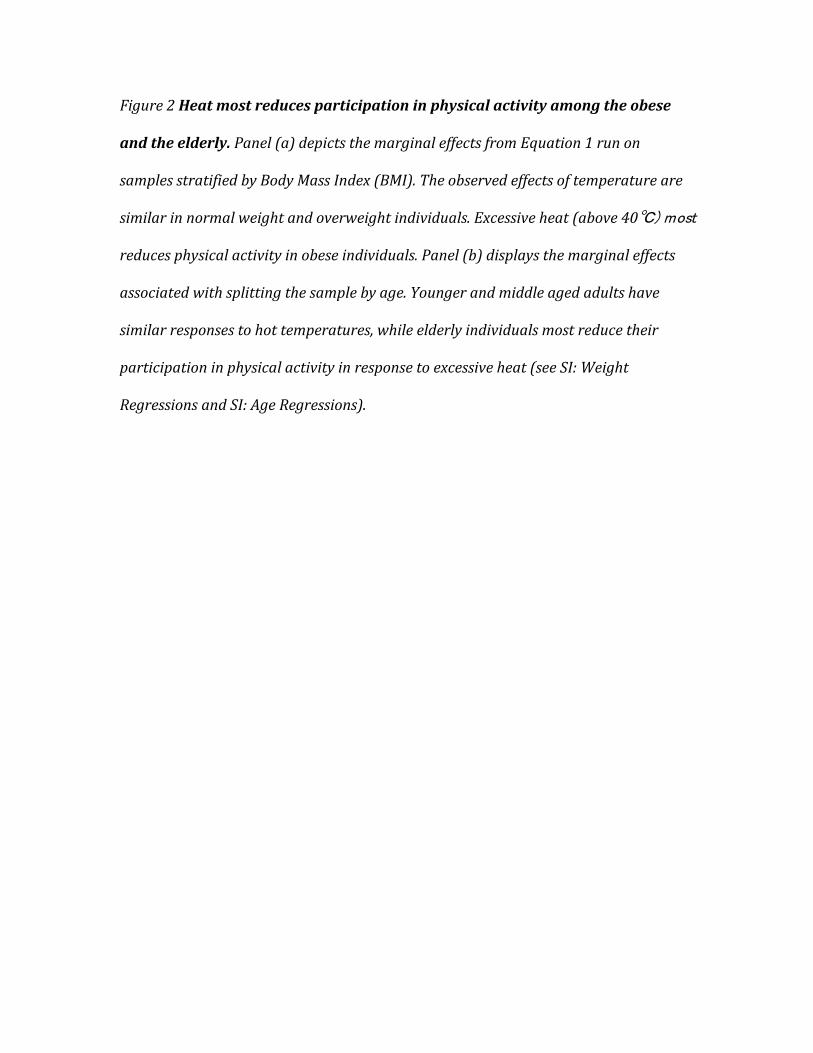
Figure 2 Heat most reduces participation in physical activity among the obese
and the elderly. Panel (a) depicts the marginal effects from Equation 1 run on
samples stratified by Body Mass Index (BMI). The observed effects of temperature are
similar in normal weight and overweight individuals. Excessive heat (above 40℃) most
reduces physical activity in obese individuals. Panel (b) displays the marginal effects
associated with splitting the sample by age. Younger and middle aged adults have
similar responses to hot temperatures, while elderly individuals most reduce their
participation in physical activity in response to excessive heat (see SI: Weight
Regressions and SI: Age Regressions).

Figure 3 Climate change may alter temporal patterns of physical activity. Panel
(a) plots the historical the distribution of 2002-2012 average monthly maximum
temperatures from our sample. Approximately 80% of this distribution falls below
28℃-29℃, the temperature range associated with peak historical physical activity.
Panel (b) presents monthly average maximum temperatures calculated from 21
downscaled CMIP5 climate models for the cities in our sample in 2010, 2050, and 2099.
Maximum temperatures increase by 2050 and 2099 as compared to the baseline of
2010. Bars in panel (c) depict the mean city-level forecast for the impact of climate
change by 2050 on monthly physical activity per 1,000 individuals. Bars in panel (d)
display the same forecast for 2099. In both panels (c) and (d), physical activity is
predicted to increase most in cooler months of the year and decline in summer months.
To incorporate downscaled climate model uncertainty, error bars in panels (c) and (d)
represent the range of monthly predictions across the ensemble of climate models and
incorporate estimation uncertainty from our model of physical activity27.

Figure 4 Climate change may alter physical activity rates spatially throughout
the US This figure presents the 25km x 25km grid cell forecasts of the potential impact
of climate change on annual person-months of physical activity per 1,000 individuals.
In this figure, downscaled climatic model data are averaged across the 21 models in
the ensemble and then coupled with our historical model parameters to produce an
estimated change in physically active person-months in each geographic location for
the periods of 2050 and 2099. Areas of northern United States -- where non-summer
temperatures are currently coldest -- may experience the largest future increase in net
physical activity. The southernmost extremes of the US, cities like Phoenix, Arizona,
may experience net reductions in physical activity in the future.
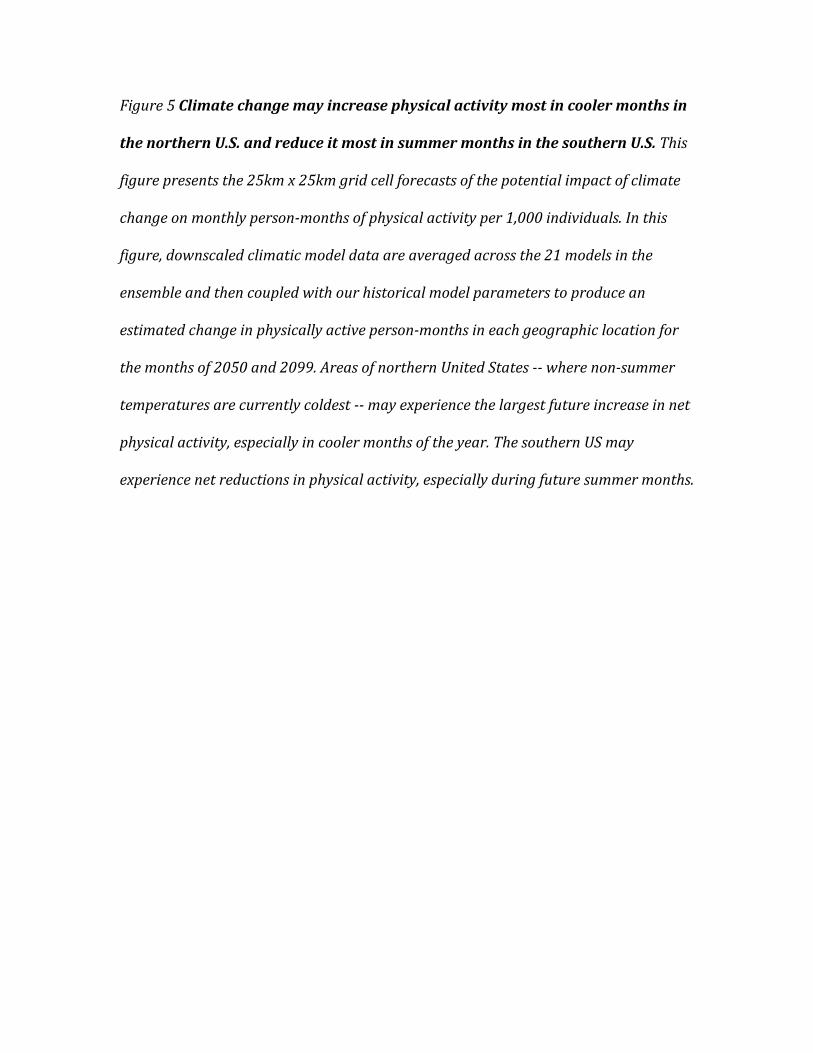
Figure 5 Climate change may increase physical activity most in cooler months in
the northern U.S. and reduce it most in summer months in the southern U.S. This
figure presents the 25km x 25km grid cell forecasts of the potential impact of climate
change on monthly person-months of physical activity per 1,000 individuals. In this
figure, downscaled climatic model data are averaged across the 21 models in the
ensemble and then coupled with our historical model parameters to produce an
estimated change in physically active person-months in each geographic location for
the months of 2050 and 2099. Areas of northern United States -- where non-summer
temperatures are currently coldest -- may experience the largest future increase in net
physical activity, especially in cooler months of the year. The southern US may
experience net reductions in physical activity, especially during future summer months.