climate change impacts on international fisheries and ... · climate change impacts on...
TRANSCRIPT
Climate change impacts on international fisheries and
adaptation strategies
Rögnvaldur Hannesson Norwegian School of Economics &
Business Administration Bergen, Norway
The ocean climate has always been variable • Year to year variations • Recurring events (El Niño) • Regime shifts (decadal oscillations)
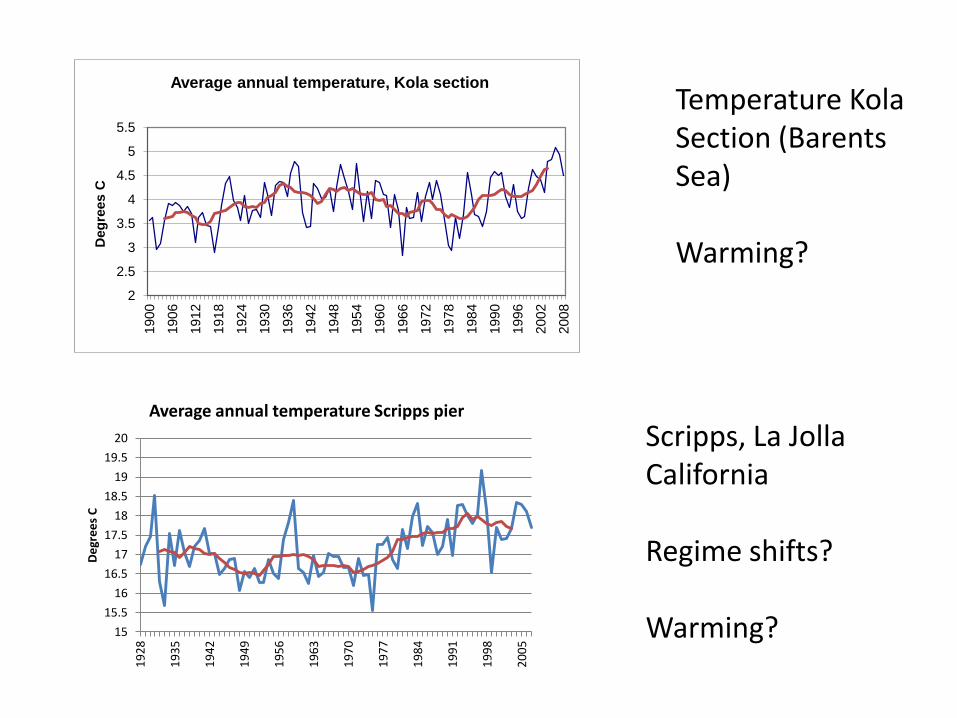
Temperature Kola Section (Barents Sea) Warming?
Scripps, La Jolla California Regime shifts? Warming? 15
15.5
16
16.5
17
17.5
18
18.5
19
19.5
20
19
28
19
35
19
42
19
49
19
56
19
63
19
70
19
77
19
84
19
91
19
98
20
05
De
gre
es
C
Average annual temperature Scripps pier
2
2.5
3
3.5
4
4.5
5
5.5
1900
1906
1912
1918
1924
1930
1936
1942
1948
1954
1960
1966
1972
1978
1984
1990
1996
2002
2008
Deg
rees C
Average annual temperature, Kola section
Changes in ocean climate drive fluctuations in fish stocks
Stock collapses • Probably a conjunction of environmental effects & overexploitation
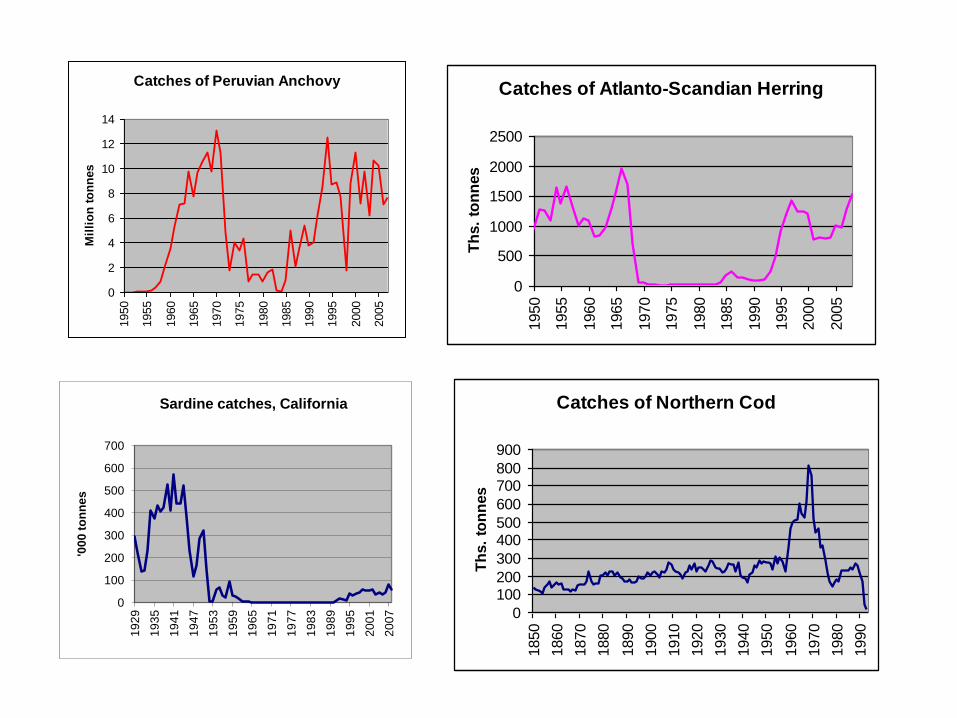
Catches of Peruvian Anchovy
0
2
4
6
8
10
12
141950
1955
1960
1965
1970
1975
1980
1985
1990
1995
2000
2005
Mil
lio
n t
on
nes
0
100
200
300
400
500
600
700
19
29
19
35
19
41
19
47
19
53
19
59
19
65
19
71
19
77
19
83
19
89
19
95
20
01
20
07
'00
0 t
on
ne
s
Sardine catches, California
Catches of Atlanto-Scandian Herring
0
500
1000
1500
2000
2500
1950
1955
1960
1965
1970
1975
1980
1985
1990
1995
2000
2005
Th
s.
ton
nes
Catches of Northern Cod
0
100200
300
400500
600
700800
900
1850
1860
1870
1880
1890
1900
1910
1920
1930
1940
1950
1960
1970
1980
1990
Th
s.
ton
nes
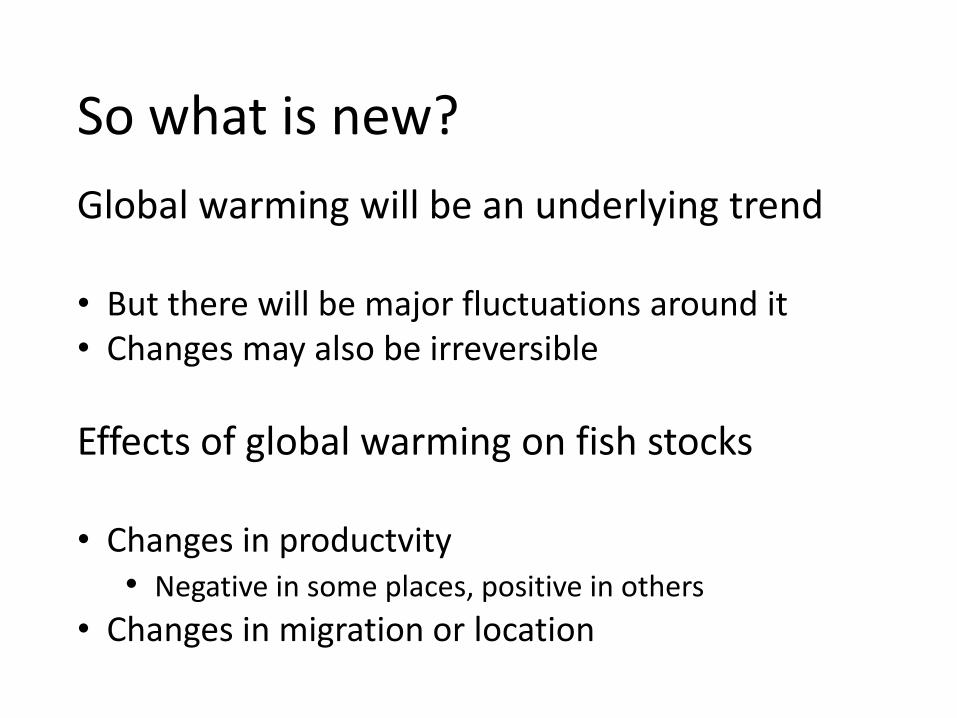
So what is new?
Global warming will be an underlying trend • But there will be major fluctuations around it • Changes may also be irreversible
Effects of global warming on fish stocks • Changes in productvity
• Negative in some places, positive in others
• Changes in migration or location
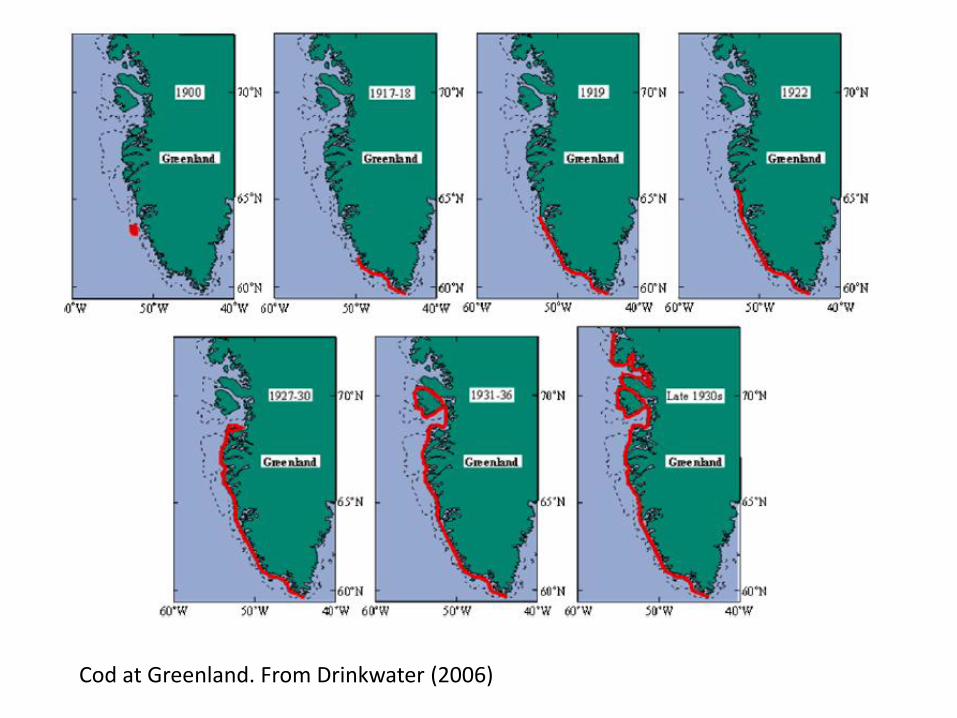
Cod at Greenland. From Drinkwater (2006)
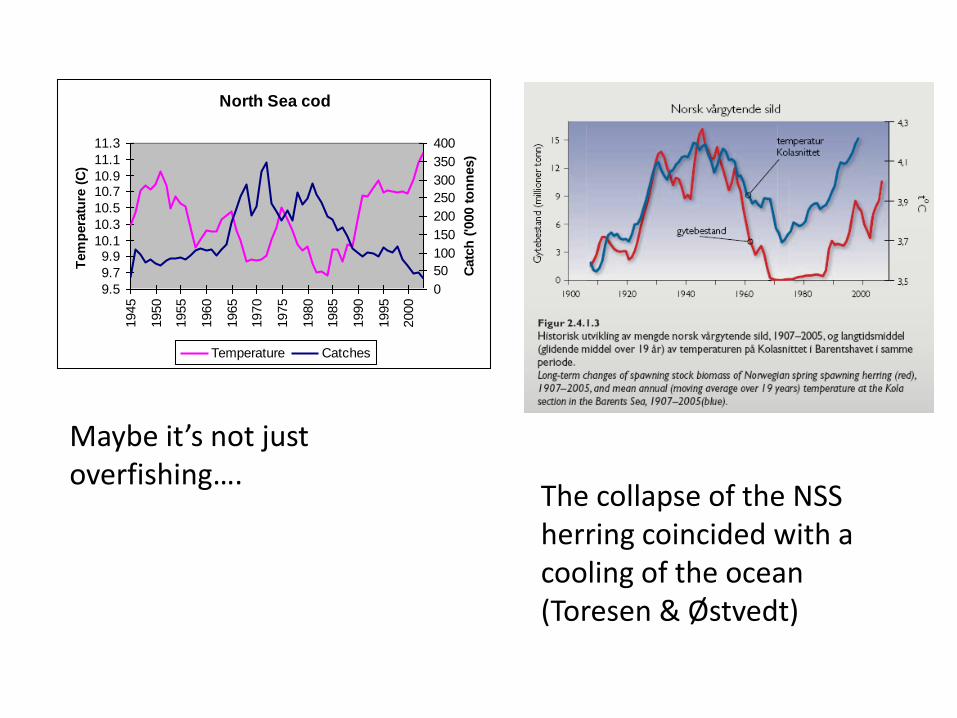
North Sea cod
9.5
9.7
9.910.1
10.3
10.5
10.710.9
11.1
11.31945
1950
1955
1960
1965
1970
1975
1980
1985
1990
1995
2000
Tem
pera
ture
(C
)
0
50
100
150
200
250
300
350
400
Catc
h (
'000 t
on
nes)
Temperature Catches
Maybe it’s not just overfishing….
The collapse of the NSS herring coincided with a cooling of the ocean (Toresen & Østvedt)
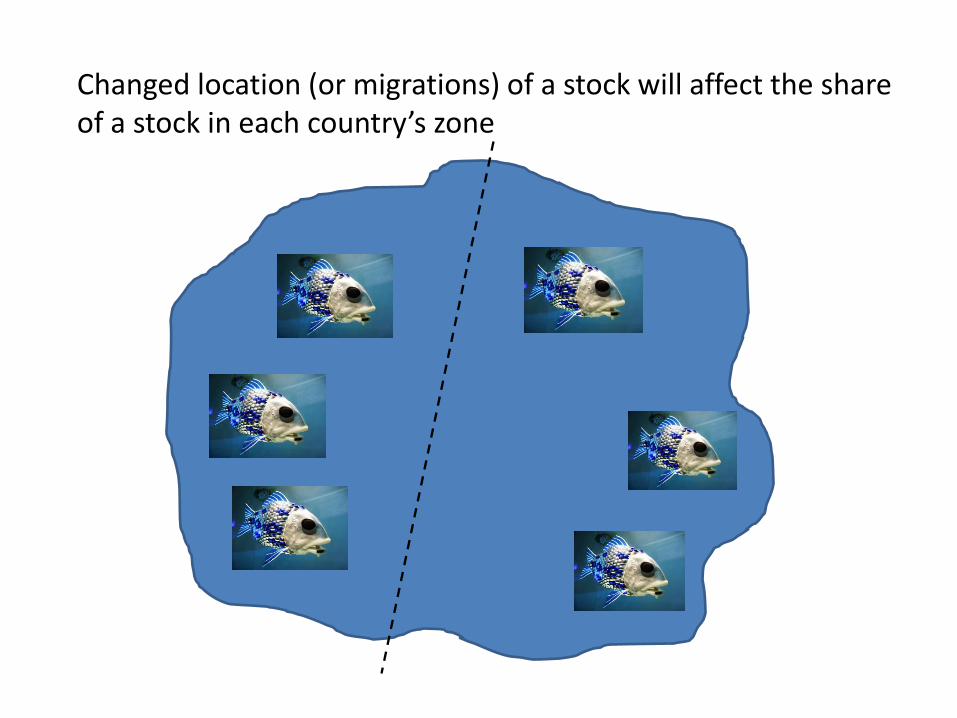
Changed location (or migrations) of a stock will affect the share of a stock in each country’s zone
How will changes in location affect sharing of fish stocks?
1. Sharing and zonal attachment, a simple model
2. Zonal attachment and sharing of North Sea stocks
3. North Sea herring
4. The Atlanto-Scandian herring
5. Northeast-Arctic cod; hypothetical example
6. A model of dramatic change, with a stock moving from Country A to Country B, possibly disastrous consequences
1. Zonal attachment and sharing of stocks • Each country must get a share making it as well off as without an agreement • Countries with a small share of a stock in their zone must be offered a larger share • Why?
• They have a weaker incentive to conserve • Most benefits of conservation go to the country with a large share
0
0.1
0.2
0.3
0.4
0.5
0.6
0.525 0.65 0.775 0.9
Stock share of major player
Minor player: critical profit share
Profit share
Stock share
0
0.1
0.2
0.3
0.4
0.5
0.6
0.5 0.6 0.7 0.8 0.9
Stock share of major player
Minor player: critical profit share
Profit share
Stock share
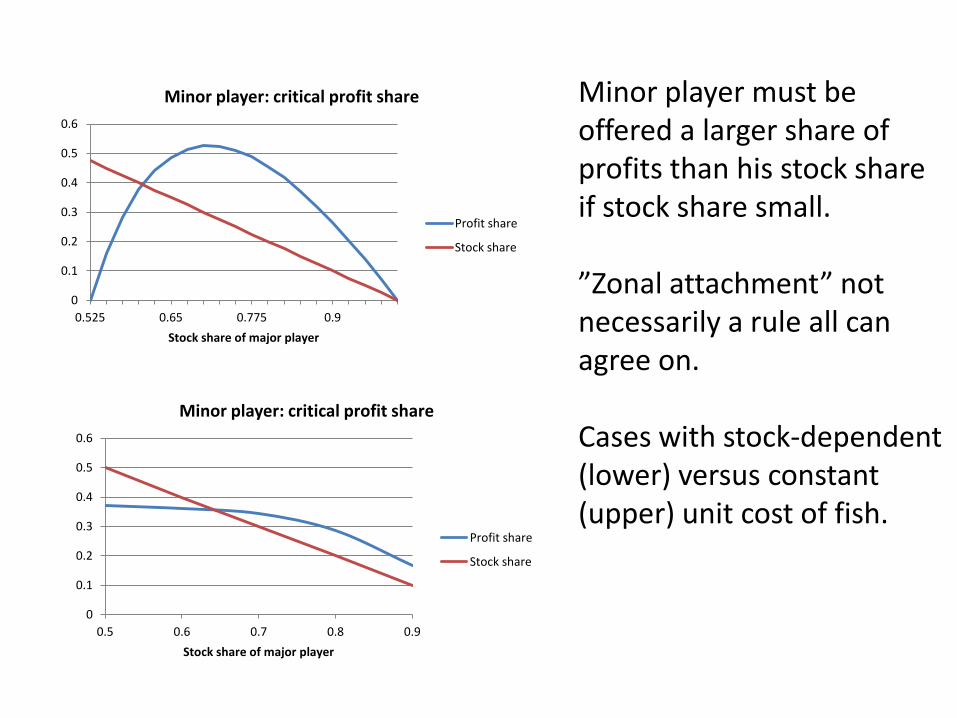
Minor player must be offered a larger share of profits than his stock share if stock share small. ”Zonal attachment” not necessarily a rule all can agree on. Cases with stock-dependent (lower) versus constant (upper) unit cost of fish.
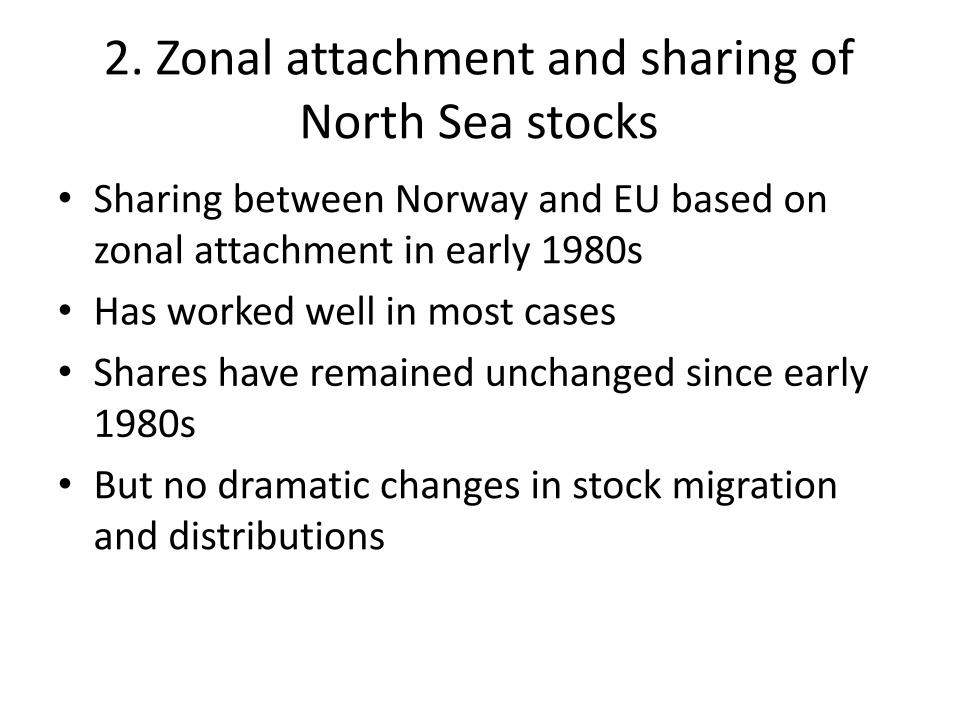
2. Zonal attachment and sharing of North Sea stocks
• Sharing between Norway and EU based on zonal attachment in early 1980s
• Has worked well in most cases
• Shares have remained unchanged since early 1980s
• But no dramatic changes in stock migration and distributions
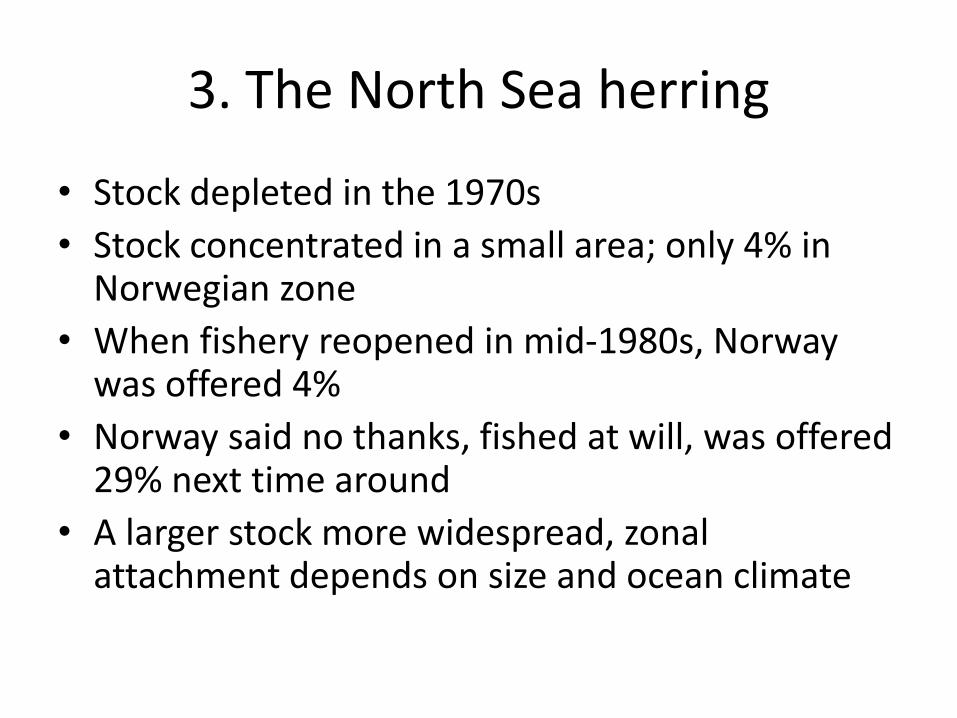
3. The North Sea herring
• Stock depleted in the 1970s
• Stock concentrated in a small area; only 4% in Norwegian zone
• When fishery reopened in mid-1980s, Norway was offered 4%
• Norway said no thanks, fished at will, was offered 29% next time around
• A larger stock more widespread, zonal attachment depends on size and ocean climate
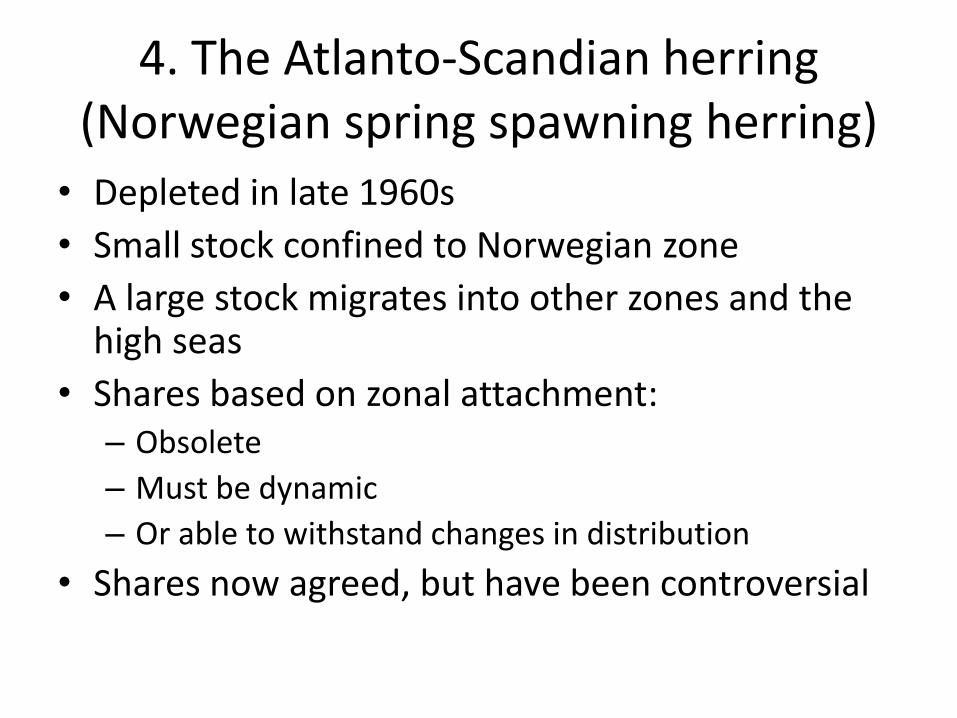
4. The Atlanto-Scandian herring (Norwegian spring spawning herring)
• Depleted in late 1960s
• Small stock confined to Norwegian zone
• A large stock migrates into other zones and the high seas
• Shares based on zonal attachment: – Obsolete
– Must be dynamic
– Or able to withstand changes in distribution
• Shares now agreed, but have been controversial
0
0.05
0.1
0.15
0.2
0.25
0.3
0.35
0.4
0
2000
4000
6000
8000
10000
12000
14000
16000
18000
19
51
19
56
19
61
19
66
19
71
19
76
19
81
19
86
19
91
19
96
20
01
20
06
Shar
e
Sto
ck (
'00
0 t
on
ne
s)
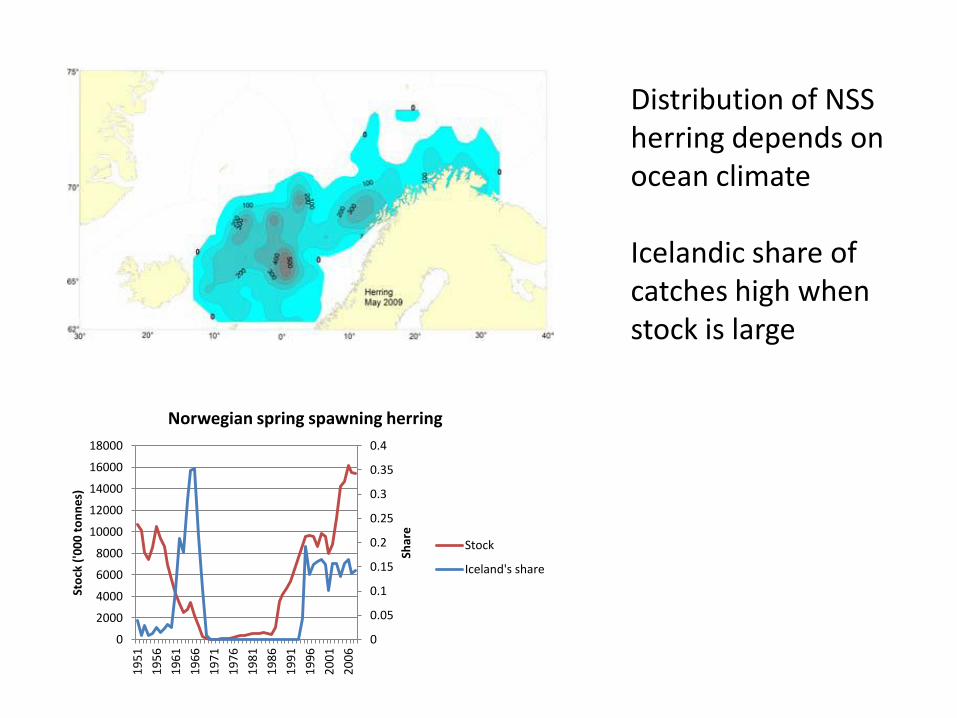
Norwegian spring spawning herring
Stock
Iceland's share
Distribution of NSS herring depends on ocean climate Icelandic share of catches high when stock is large
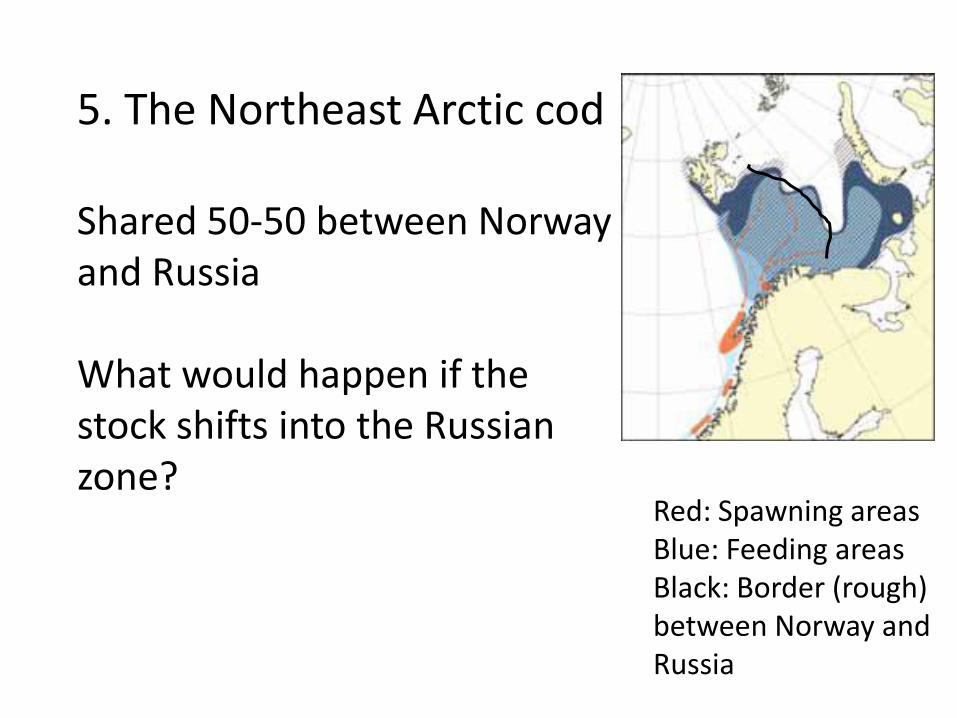
5. The Northeast Arctic cod Shared 50-50 between Norway and Russia What would happen if the stock shifts into the Russian zone?
Red: Spawning areas Blue: Feeding areas Black: Border (rough) between Norway and Russia
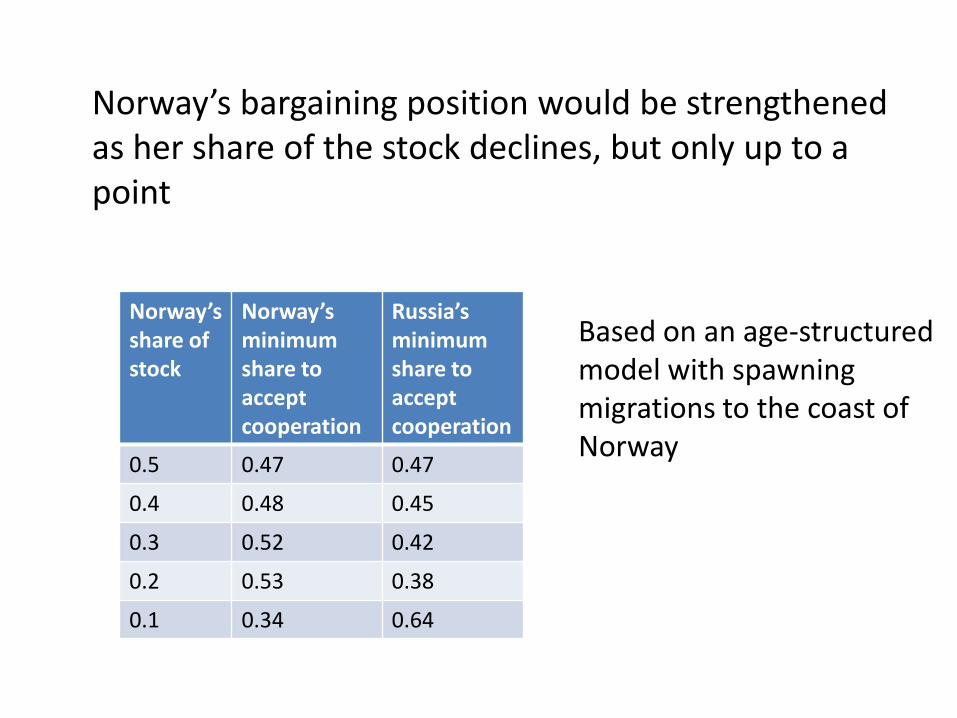
Norway’s share of stock
Norway’s minimum share to accept cooperation
Russia’s minimum share to accept cooperation
0.5 0.47 0.47
0.4 0.48 0.45
0.3 0.52 0.42
0.2 0.53 0.38
0.1 0.34 0.64
Norway’s bargaining position would be strengthened as her share of the stock declines, but only up to a point
Based on an age-structured model with spawning migrations to the coast of Norway
6. A dramatic case: A stock shifts from Country A to Country B • Climate varies but with an underlying trend • Location of stock follows climate • Countries look backwards and predict share of stock in their zone
An intermediate period: • Stock in zone of both countries • Unknown distribution except in hindsight Stock could be threatened • If ”old” country realizes it is losing it permanently • If ”new” country does not realize it is taking it over
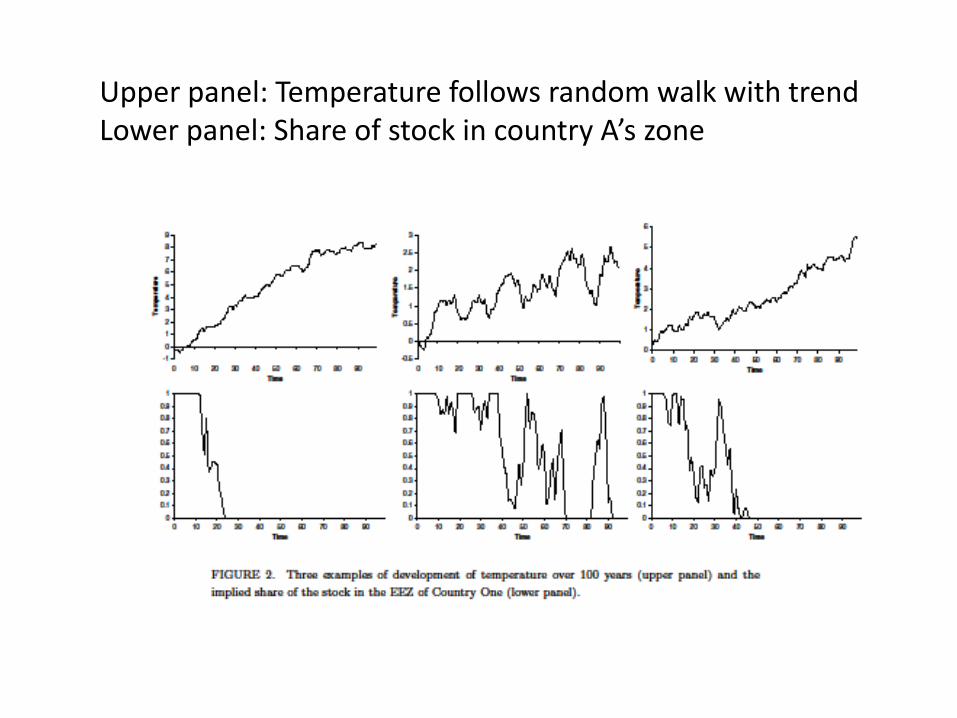
Upper panel: Temperature follows random walk with trend Lower panel: Share of stock in country A’s zone
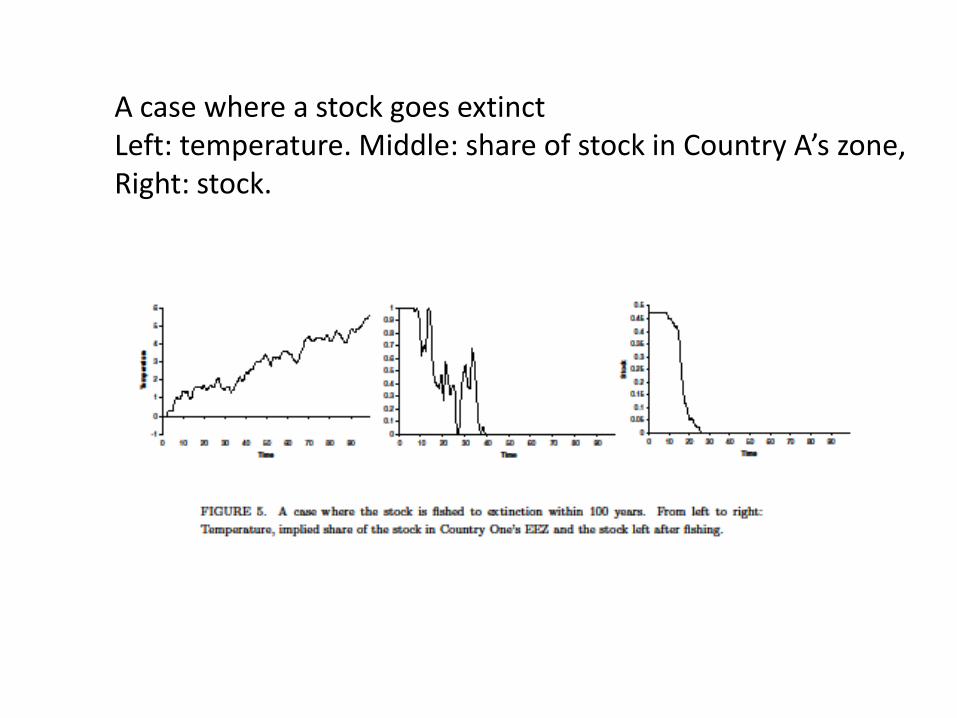
A case where a stock goes extinct Left: temperature. Middle: share of stock in Country A’s zone, Right: stock.
High seas fisheries Similar effects, probably more serious • Reason: the open access to the high seas - Allocation of stocks between countries not accomplished - Enforcement of management decisions weak
High seas fisheries (cont’d) • Straddling stocks - Straddling into high seas weakens conservation incentives for coastal states - Climate change may shift stocks more into the high seas - Aggravates conflicts between coastal states and high seas management
• Highly migratory stocks - We may see more dramatic shifts in migration - Could be a problem where high seas interspersed with EEZs (West Central Pacific)
Conclusions • Climate variability may challenge sharing agreements • Flexibility required
• Side payments • Fishing in each others’ zone at times
• Silver lining • Changes in stock distribution must be
dramatic to make a difference • Resilience of agreements (Norway vs Russia, EU, but not US & Canada over salmon)
Conclusion (cont’d) • Changes in species composition likely • Requires new technologies & markets • Flexibility
• Moving between fisheries • Access to markets
• We’re unlikely to see anything more dramatic than we’ve seen in the past • Our main concern and priority still: Better management!