climate change, disease, and amphibian declines by jason r. rohr university of south florida...
TRANSCRIPT

Climate Change, Disease, and Climate Change, Disease, and Amphibian DeclinesAmphibian Declines
by Jason R. Rohrby Jason R. Rohr
University of South FloridaUniversity of South FloridaDepartment of Biology, SCA 110Department of Biology, SCA 110
4202 E. Fowler Ave.4202 E. Fowler Ave.Tampa, FL 33620Tampa, FL 33620
[email protected]@gmail.com

Climate Change, Amphibian Climate Change, Amphibian Declines, and Declines, and BdBd
Also evidence that Also evidence that BdBd-related -related declines are linked to climate declines are linked to climate change (Pounds et al. 2006, change (Pounds et al. 2006,
Bosch et al. 2006)Bosch et al. 2006)

Outline for TalkOutline for Talk
Does global climate change affect worldwide amphibian declines associated with chytrid fungal infections?

Enigmatic Amphibian DeclinesEnigmatic Amphibian Declines

Genus Genus AtelopusAtelopus

from La Marca et al. 2005. Biotropica
71 of 113 spp. presumed extinct,71 of 113 spp. presumed extinct,many of which were ostensibly many of which were ostensibly
caused by chytridiomycosiscaused by chytridiomycosis

Climate, Bd, and Conservation Planning
• If we understand the climatic factors that accelerate Bd spread, increase host susceptibility, or elevate pathogen virulence, we can identify present and future geographic locations that might have amphibians at risk of Bd-related declines
• Hence, we can better target areas that warrant monitoring and remediation

Tenuous Links Between Climate and Amphibian Declines
• Most of the evidence supporting climate change as a factor in Bd-related amphibian extinctions comes from a positive, but temporally confounded, multi-decade correlation between air temperature and extinctions in the toad genus Atelopus 0.00
0.05
0.10
0.15
0.20
0.25
0.10
0.12
0.14
0.16
0.18
0.20
1970 1980 1990 2000
Year
Log Beer/20
Log Banana/25
Amphibian extinctions
Temp. anomalies/10
Rohr et al. 2008 PNAS

Need to Conduct Detrended Analyses?
• If there is a true relationship between climate and Bd-related extinctions, fluctuations around temporal trends in temperature and extinctions should also positively correlate
• There would many fewer non-causal explanations for this correlation than the multidecadal relationship between declines and temperature

Use the Use the Atelopus Atelopus database to simult-database to simult-aneously test various climate-related aneously test various climate-related hypotheses for amphibian declines, hypotheses for amphibian declines, controlling for multidecadal correlations controlling for multidecadal correlations and the intrinsic spatiotemporal spread and the intrinsic spatiotemporal spread of of BdBd
ObjectivesObjectives

Ultimate Hypothesis: ENSO Ultimate Hypothesis: ENSO Drives Amphibian DeclinesDrives Amphibian Declines

ENSO: El Niño-Southern ENSO: El Niño-Southern OscillationOscillation
• Commonly referred to as simply El Niño is a global coupled ocean-atmosphere phenomenon
– The Pacific ocean signatures, El Niño (warm and wet) and La Niña (cool and dry) are important temperature fluctuations in surface waters of the tropical Eastern Pacific Ocean
– The atmospheric signature, the Southern Oscillation (SO) reflects the monthly or seasonal fluctuations in the air pressure
• Effects of El Niño in South America are direct and stronger than in North America

Proximal Hypotheses for Proximal Hypotheses for Enigmatic/Enigmatic/BdBd-related Declines-related Declines
• Spatiotemporal spread hypothesis: declines are caused by the introduction and spread of Bd, independent of climate (Bell et al. 2004, Lips et al. 2006)
• Climate-based hypotheses:– Chytrid-thermal-optimum hypothesis: Increased cloud cover,
due to warmer oceanic temperatures, leads to temperature convergence on the optimum temperature for growth of Bd (Pounds et al. 2006, Bosch et al. 2006)
– Mean-climate hypothesis: changes in mean temp. and/or moisture conditions affect the distributions of amphibians (Whitfield et al. 2007, Buckley & Jetz 2007)
– Climate-variability hypothesis: temporal variability in temp. cause suboptimal host immunity facilitating declines (Raffel, Rohr, et al. 2006)

Climate-Variability HypothesisClimate-Variability Hypothesis
Ectotherms: Ectotherms: *seasonal changes in body temperature**seasonal changes in body temperature*

Climate Variability Hypothesis
• Hypothesis: unpredictable temperature shifts, which are increasing with GCC, benefit pathogens more than hosts. – faster metabolisms of parasites should allow them
to acclimate more quickly to unpredictable temperature shifts, especially for ectothermic hosts
– parasites have fewer cells and processes to adjust and generally withstand greater temperature extremes than hosts (Portner 2002)
– owing to their shorter generation times, parasites should evolve more quickly than hosts to changes in climate
Climate Variability Hypothesis
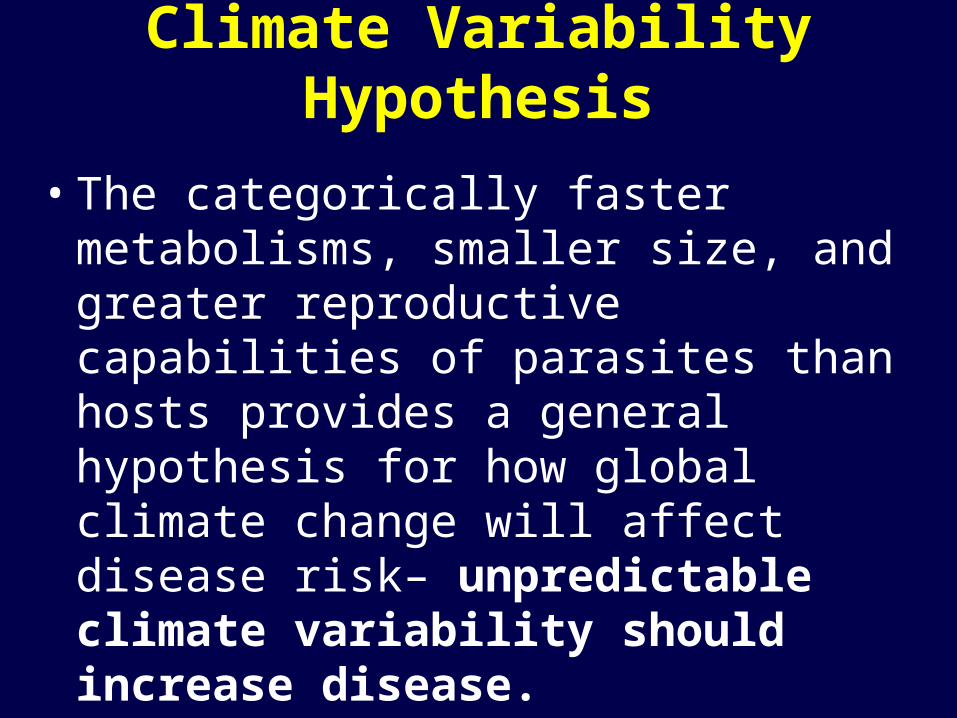
• The categorically faster metabolisms, smaller size, and greater reproductive capabilities of parasites than hosts provides a general hypothesis for how global climate change will affect disease risk– unpredictable climate variability should increase disease.

0
5
10
15
20
25
0 10 20 30
Distance
Diff
eren
ce in
yea
r of
dec
line
Rohr et al. 2008 PNAS
Is there Spatiotemporal Spread of Atelopus Is there Spatiotemporal Spread of Atelopus Extinctions?Extinctions?
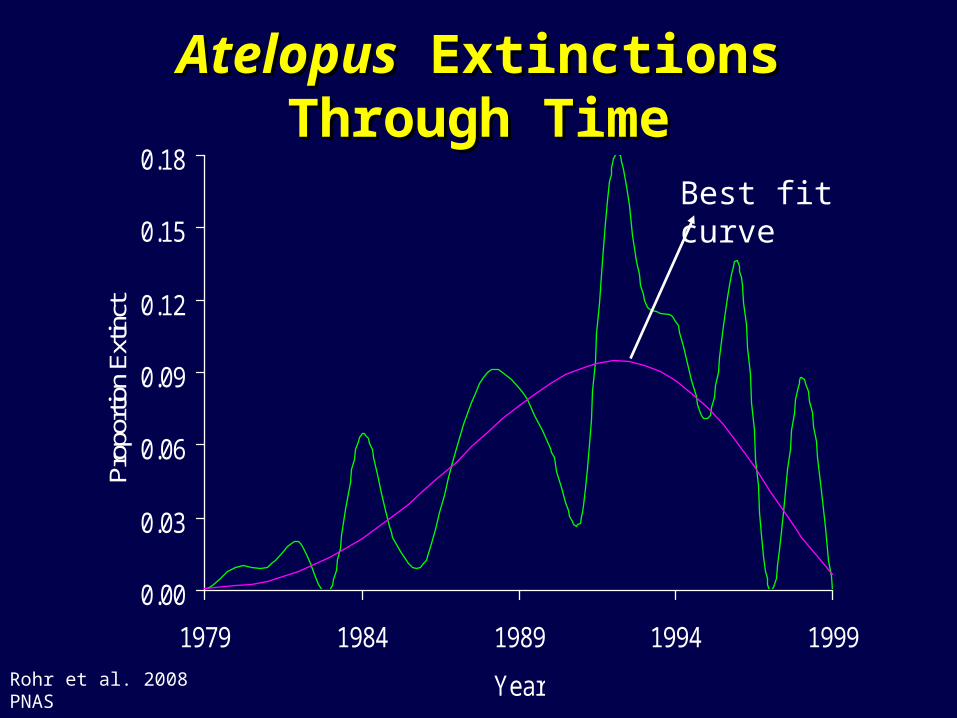
AtelopusAtelopus Extinctions Through Extinctions Through TimeTime
0.00
0.03
0.06
0.09
0.12
0.15
0.18
1979 1984 1989 1994 1999
Year
Prop
ortio
n Ex
tinct
Best fit curve
Rohr et al. 2008 PNAS
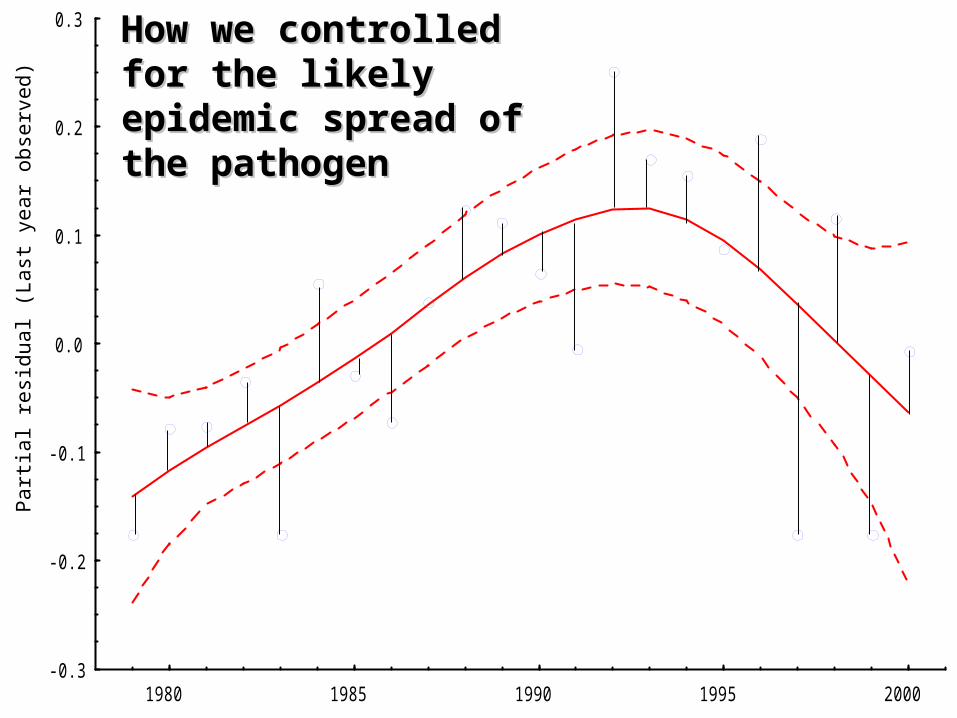
1980 1985 1990 1995 2000-0.3
-0.2
-0.1
0.0
0.1
0.2
0.3P
artia
l res
idua
l (La
st y
ear
obse
rved
)How we controlled for How we controlled for the likely epidemic the likely epidemic spread of the pathogenspread of the pathogen

Ultimate Hypothesis: ENSO Ultimate Hypothesis: ENSO Drives Amphibian DeclinesDrives Amphibian Declines

1980 1985 1990 1995 2000-0.3
-0.2
-0.1
0.0
0.1
0.2
0.3P
artia
l res
idua
l (La
st y
ear
obse
rved
)
La Niña Years?
El Niño Years?

Ultimate Hypothesis: ENSOUltimate Hypothesis: ENSO
Rohr and Raffel 2010 PNAS

Must Control for Intrinsic Dynamics to Detect Extrinsic Factors!
• No significant ENSO signature if we don’t control for probable epidemic spread
• Hence, the availability of susceptible Hence, the availability of susceptible hosts appears the primary factor hosts appears the primary factor influencing epidemic spread followed influencing epidemic spread followed secondarily by climatesecondarily by climate

But What is the Proximate But What is the Proximate Explanation?Explanation?
What is it about El Nino years What is it about El Nino years that is associated with amphibian that is associated with amphibian
extinctions?extinctions?

Proximal Hypotheses for Proximal Hypotheses for Enigmatic/Enigmatic/BdBd-related Declines-related Declines
• Spatiotemporal spread hypothesis: declines are caused by the introduction and spread of Bd, independent of climate (Bell et al. 2004, Lips et al. 2006)
• Climate-based hypotheses:– Chytrid-thermal-optimum hypothesis: Increased cloud cover,
due to warmer oceanic temperatures, leads to temperature convergence on the optimum temperature for growth of Bd (Pounds et al. 2006, Bosch et al. 2006)
– Mean-climate hypothesis: changes in mean temp. and/or moisture conditions affect the distributions of amphibians (Whitfield et al. 2007, Buckley & Jetz 2007)
– Climate-variability hypothesis: temporal variability in temp. cause suboptimal host immunity facilitating declines (Raffel, Rohr, et al. 2006)

Regional PredictorsRegional Predictorstested w/ and w/o a one year lagtested w/ and w/o a one year lag
1. Mean absolute value of monthlydifferences (AVMD) in temp.
2. Cloud cover x temp. (Pounds et al. 2006) 3. Cloud cover (Pounds et al. 2006)4. Temperature-dependent Bd growth
(Pounds et al. 2006)5. Precip. x temp. (Whitfield et al. 2007)6. Diurnal temp. range (DTR)7. Frost freq.8. Precip.9. Temp.10. Temp. max.11. Temp. min.12. Vapor press.13. Wet day freq.

Results of Best Subset Model Results of Best Subset Model SelectionSelection
results are similar using AICresults are similar using AIC
Model Ranking
Adjusted
R2No. of effects Precip.
Wet day freq.
AVMD temp.
Cloud cover
Diurnal temp. range Temp.
Temp. max.
Temp. min.
Vapor Pres.
1 0.685 3 0.253 0.859 0.7642 0.671 3 0.230 0.845 0.7553 0.644 3 0.857 -0.154 0.6924 0.643 3 0.804 0.788 0.2125 0.640 3 0.807 0.738 0.1776 0.640 3 0.807 0.693 0.1617 0.640 3 0.807 0.649 0.1578 0.640 3 0.806 -2.350 2.4539 0.640 2 0.892 0.69910 0.640 3 0.806 1.306 -1.286
t-1t

Can Monthly Temperature Variability Explain Can Monthly Temperature Variability Explain
AtelopusAtelopus Extinctions? Extinctions?
Rohr and Raffel 2010 PNAS

Amphibian extinctions have Amphibian extinctions have often occurred in warmer often occurred in warmer
years, at higher elevations, years, at higher elevations, and during cooler seasons.and during cooler seasons.
Are monthly and daily Are monthly and daily variability in temperature also variability in temperature also
greater at these times and greater at these times and locations?locations?

Do Warmer Years Have Greater Do Warmer Years Have Greater Variability in Temperature?Variability in Temperature?
9.9
10
10.1
10.2
10.3
10.4
10.5
0.00
0.05
0.10
0.15
0.20
0.25
0.30
0.35
-0.50 0.00 0.50 1.00
DT
R (
C)
AV
MD
(C
)
Annual temperature anomalies ( C)
Rohr and Raffel 2010 PNAS

Do High Elevations Have Greater Do High Elevations Have Greater Variability in Temp.?Variability in Temp.?
8
9
10
11
12
13
14
15
0.6
0.7
0.8
0.9
0-199 m (n=1269)
200-1000 m (n=668)
1001-2399 m (n=185)
>2400 m (n=210)
DT
R (°C
)
AV
MD
(°C
)
Elevation categories

Do Cooler Months Have Greater Do Cooler Months Have Greater Variability in Temp.?Variability in Temp.?
12
13
14
15
16
17
18
0.5
0.6
0.7
0.8
23.0 23.4 23.8 24.2 24.6
DT
R >2
40
0 m
(°C)
AV
MD
(°C
)
Monthly temperature (ºC)
Rohr and Raffel 2010 PNAS

Results of Path Analysis
El Niño 3.4
DTR R2=0.633
AVMD anomalies R2=0.567
Lag amphibian extinctions
R2
=0.674
P<0.001
0.675
P=0.002 0.673
P=0.044 -0.466
P<0.001
0.694
P<0.001 0.868
-0.35
-0.15
0.05
0.25
-2 -1 0 1 2 3
DTR
El Niño 3.4
-0.10
-0.05
0.00
0.05
0.10
-2 -1 0 1 2 3
AV
MD
El Niño 3.4
-0.25
-0.15
-0.05
0.05
0.15
-0.35 -0.15 0.05 0.25
Lag
LYO
(d
etre
nd
ed)
DTR
-0.25
-0.15
-0.05
0.05
0.15
-0.10 0.00 0.10
Lag
LYO
(d
etre
nd
ed)
AVMD
Rohr and Raffel 2010 PNAS

We WerenWe Weren’’t Convincedt Convinced

Experimental TestExperimental Test
• Acclimated Cuban tree frogs to 15 or 25 ⁰ C for four weeks
• Challenged with Bd at start of week five
• Quantified survival and pathogen loads
• Acclimated Cuban tree frogs to 15 or 25 ⁰ C for four weeks
• Challenged with Bd at start of week five
• Quantified survival and pathogen loads
15 C⁰
25 C⁰
15 C⁰
25 C⁰


Does Temperature Variability Does Temperature Variability Increase Increase BdBd Loads on Frogs? Loads on Frogs?
Raffel et al. in press Nature Climate Change
Bd-induced mortality:Bd load:
Temperature shifts increased Bd loads and Bd-induced mortality

SummarySummary
• Availability of susceptible hosts appears to be Availability of susceptible hosts appears to be the primary factor influencing the spread of the primary factor influencing the spread of BdBd
• There is a strong ENSO signature to extinctions after controlling for epidemic spread
• Both field patterns of extinctions and manipulative experiments support the climate-variability hypothesis for amphibian extinctions

ConclusionsConclusions
Temperature, temperature Temperature, temperature variability, and Central Pacific El variability, and Central Pacific El
Niño events are increasing in Niño events are increasing in tropical and subtropical regions tropical and subtropical regions because of climate change; thus, because of climate change; thus, global climate change might be global climate change might be
contributing to enigmatic amphibian contributing to enigmatic amphibian declines, by increasing disease riskdeclines, by increasing disease risk

ConclusionsConclusions
Elevated temperature variability might Elevated temperature variability might represent a common, but under-appreciated, represent a common, but under-appreciated,
link between climate change and both link between climate change and both disease and biodiversity losses and might disease and biodiversity losses and might offer a general mechanism for why disease offer a general mechanism for why disease
would increase with GCC.would increase with GCC.

Parte 4: MODELO CLIMÁTICO ECO
FISIOLÓGICO para anfibios

Spea hammondiFisher and Shaffer 1996

Bufo boreasFisher and Shaffer 1996

Rana aurora (Bd induced?)Fisher and Shaffer 1996

Preparación de modelos
• Molde de Látex a partir de un espécimen de colección.
• Obtención de modelos de agar.

Experimento de campo
• 4 condiciones experimentales (factorial).
HÚMEDO - SOMBRA
(2 modelos)
HÚMEDO -SOL
(2 modelos)
SECO - SOMBRA
(2 modelos)
SECO - SOL
(2 modelos)
Día

Experimento de campo• Modelos conectados a data loggers.• Reemplazo de modelos cada 3-4 hr.
SECOSOL
HÚMEDOSOL
SECOSOMBRA
HÚMEDOSOMBRA

09:00:00 17:00:00 01:00:00 09:00:00
Op
erat
ive
Tem
per
atu
re o
f th
e m
od
el (
ºC)
5
10
15
20
25
30
Time
Mo
del
mas
s (g
)
26
28
30
32
34
36
38
40
42
T operativa y Pérdida de agua
sol seco
sombra húmedo
Del Puerto Canyon; 12 march 2012; nublado; Annaxyrus boreas model

Time
09:00:00 11:00:00 13:00:00 15:00:00 17:00:00
Tem
per
atu
re (
ºC)
10
15
20
25
30
35
40
45
Rel
ativ
e W
ate
rlo
ss
0.00
0.02
0.04
0.06
0.08
0.10
0.12
0.14
0.16
0.18
T ambiental y Pérdida de agua
sol seco
sombra seco
sombra húmedo
sol húmedo
Tª sol
Tª sombra
Los Baños Cistern; 5 march 2012; soleado; metamórficos

0.00
0.50
1.00
1.50
2.00
2.50
3.00
3.50
4.00
Dry sun Wet sun Dry shade Wet shade Dry night Wet night
Wat
erlo
ss (
g/hr
)
Treatment
Los Banos Well
Bufo
Small
-0.50
0.00
0.50
1.00
1.50
2.00
2.50
3.00
3.50
4.00
Dry sun Wet sun Dry shade Wet shade Dry night Wet night
Wat
erlo
ss (g
/hr)
Treatment
Del Puerto Canyon
Bufo
Small
Un sitio Extinct Un sitio persistente
Pseudacris sierra

Species Calibrations for CA Frogs
• Spea hammondi
• Anaxyrus boreas***
• Anaxyrus punctatus
Rana sierrae***Rana aurora
Low sensitivity to Bd: Immune to Bd:
• Pseudacris sierra***
• P. cadaverina*
• P. hypochondriaca
Very sensitive to Bd:
Hydric Loss Rates and Extinction, significant assoc:*,**,***

Preest and Pough, Funct Ecol 1989
Bufo americanusdistancia recorrida en 10 minutos de la locomoción forzada

• Víctor H. Luja [email protected]• Octavio Jiménez [email protected]• Eric Curiel [email protected]

Desarrollando un MODELO CLIMÁTICO ECO FISIOLÓGICO para anfibios
• 1. Buscamos un modelo que explique mejor el límite de distribución de las especies. Buscamos encontrar el conjunto de tasas de pérdida de agua (y de temperatura) durante el día vs la noche que explique los límites más secos (el umbral de desecación) debajo del cual la especie no se encuentra mas. Este umbral que mejor ajusta está basado en las ubicaciones de todas las poblaciones a partir de 1970.
• 2. Este umbral hídrico de pérdida de agua es conceptualmente similar al h_r para las horas de restricción de actividad debido al calor.
• 3. Entonces, nosotros probaremos como se comporta este modelo para predecir la distribución actual de las extinciones (por ejemplo cambios en la pérdida hídrica del delta entre 1975–2010, debido al incremento en la intensidad de la sequía).
