climate change and vegetationn phenology - the …swac/docs/mod15/workshop_ppt_handout.pdfphenology...
TRANSCRIPT

7/25/2011
1
Climate Change and
Vegetationn Phenology
Climate Change
• In the Northeastern US
mean annual
temperature increased
0.7°C over 30 years
(0.26° C per decade)
• Expected another 2-
6°C over next century(Ollinger, S.V. “Potenail effects of
climate change and rising CO2 on
ecosystem process in northeastern
U.S. forests)

7/25/2011
2
Why does it matter?
• Impacts on plant
productivity
• Competition between
plant species
• Interaction with other
organisms
• Food production
• Shifts in agricultural
• Pest and disease
control
• Pollen forecasts
• Carbon balance of
terrestrial ecosystems
• Feedback into
atmosphere
• Water, energy
exchange
• Timing of migrations
and breeding
• other ideas?
Phenology is the science that measures the
timing of life cycle events in all organisms
Plants tell a story about climate……
Listening to the story they tell year
after year can tell us about climate
change
Earlier Springs Later Falls
Plants provide an excellent context to
understand changes in the
environment
They are extremely sensitive
to:
• temperature change
• precipitation change
• growing degree days
7/25/2011
3
Phenology: A glimpse of
ecosystem Impacts
Some potential effects:
– Wildlife populations
– Vegetation health
– Species composition and
ranges
– Water availability
– Nutrient cycling and
decomposition
– Carbon storage
Measuring Phenology
Field Observations Satellite Remote Sensing
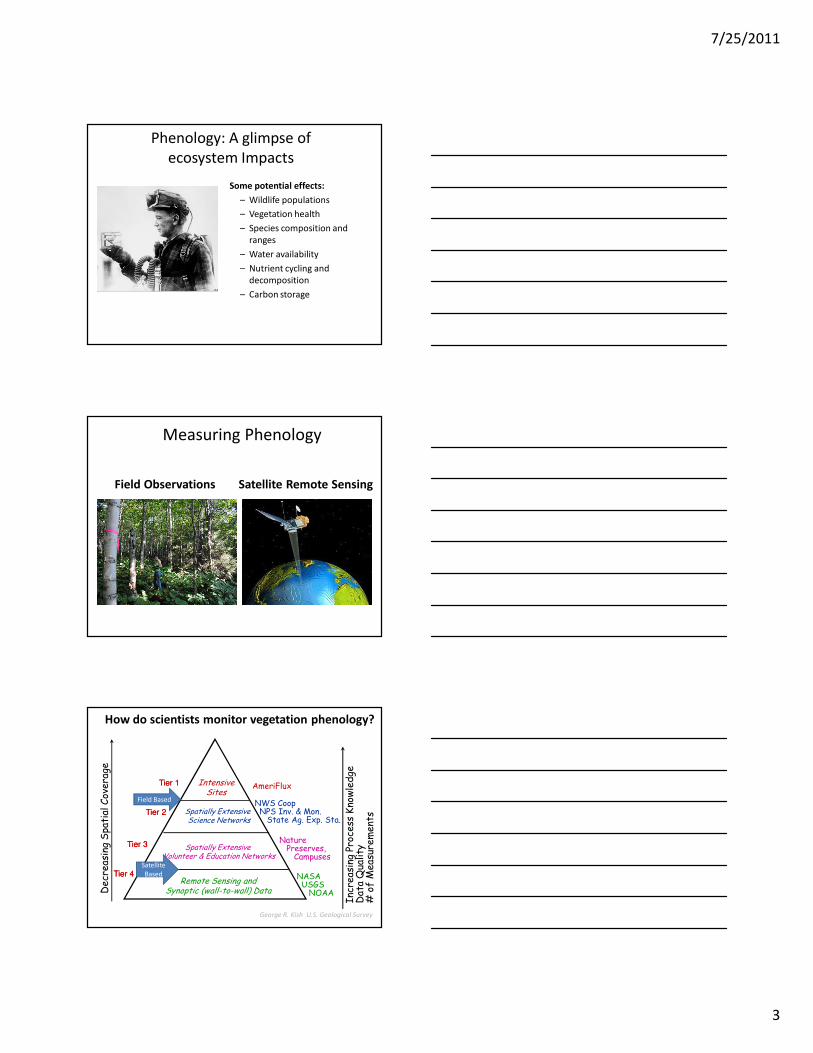
IntensiveSites
Spatially Extensive Science Networks
Remote Sensing andSynoptic (wall-to-wall) DataDecreasing Spatial Coverage
Increasing Process Knowledge
Data Quality
# of Measurements
How do scientists monitor vegetation phenology?
Spatially Extensive Volunteer & Education Networks
AmeriFlux
NWS CoopNPS Inv. & Mon.State Ag. Exp. Sta.
NaturePreserves,Campuses
NASAUSGSNOAA
Tier 1Tier 1
Tier 2Tier 2
Tier 3Tier 3
Tier 4Tier 4
George R. Kish U.S. Geological Survey
Field Based
Satellite
Based
7/25/2011
4
Measuring Phenology on the ground
Field Observations
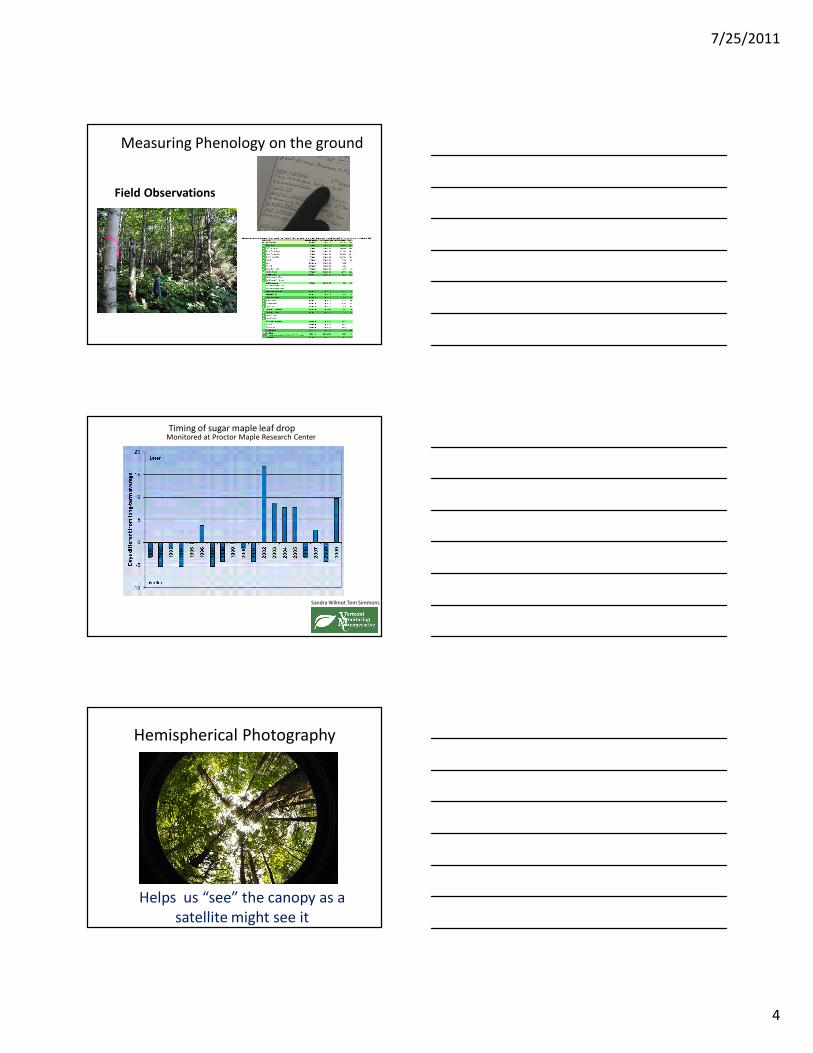
Sandra Wilmot Tom Simmons
Timing of sugar maple leaf dropMonitored at Proctor Maple Research Center
Hemispherical Photography
Helps us “see” the canopy as a
satellite might see it
7/25/2011
5
Hemispherical Imagery• Scientists spend big bucks to purchase the
equipment and software necessary to link
ground measurements with satellite imagery.
• Calculate canopy closure, transparency, leaf
area index, vegetation indices, gap fraction, etc.
Measuring Phenology
Satellite Remote Sensing
Land surface phenologies in 2000 revealed by
three AVHRR biweekly composites.”
From USA National Phenology Network
(USANPN)
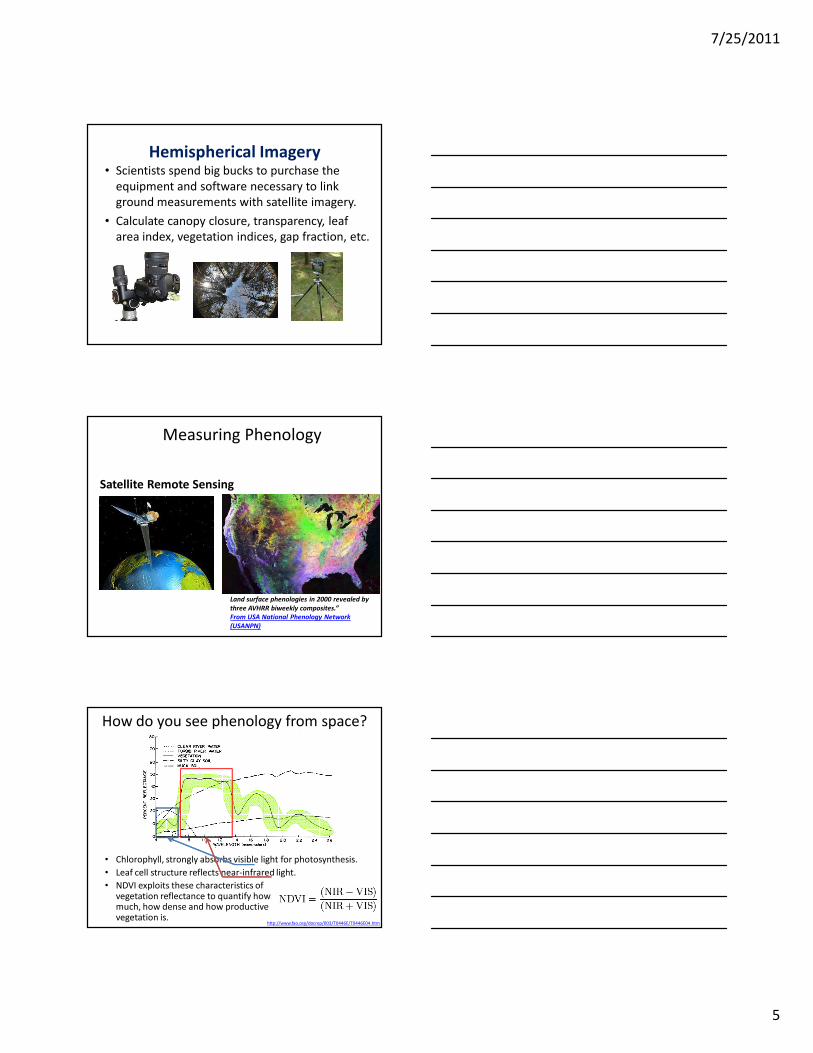
How do you see phenology from space?
http://www.fao.org/docrep/003/T0446E/T0446E04.htm
• Chlorophyll, strongly absorbs visible light for photosynthesis.
• Leaf cell structure reflects near-infrared light.
• NDVI exploits these characteristics of vegetation reflectance to quantify how much, how dense and how productive vegetation is.

7/25/2011
6
Normalized Difference Vegetation Index
NDVI
•Negative values of NDVI correspond to water.
•Values close to zero correspond to barren areas of rock,
sand, or snow.
•low, positive values represent shrub and grassland
•high values indicate temperate and tropical rainforests.
Corn/Soy belt Central Illinois
Kirsten M. de Beurs, Ph.D.
Virginia Tech University
Death Valley
Kirsten M. de Beurs, Ph.D.
Virginia Tech University
What would this What would this
NDVI curve look like?NDVI curve look like?

7/25/2011
7
ForestSouthwest Virginia
Kirsten M. de Beurs, Ph.D.
Virginia Tech University
What would this What would this
NDVI curve look like?NDVI curve look like?
Tundra Northern Alaska
Kirsten M. de Beurs, Ph.D.
Virginia Tech University
What would this What would this
NDVI curve look like?NDVI curve look like?
NDVI for Phenological Dates
• http://www.seiswaves.com/cappelluti/docs/anims/leicester/
comparison of
NDVI values for
different dates
7/25/2011
8
SOS
Start of Season
End of Season
Duration of Season
Maximum NDVI
Time Integrated NDVI
Plotting NDVIUse of NDVI to identify key phenological dates
How do you determine dates?
Use of NDVI
thresholds to
identify key
phenological
dates
http://phenology.cr.usgs.gov/methods_metrics.php
Start of the Season
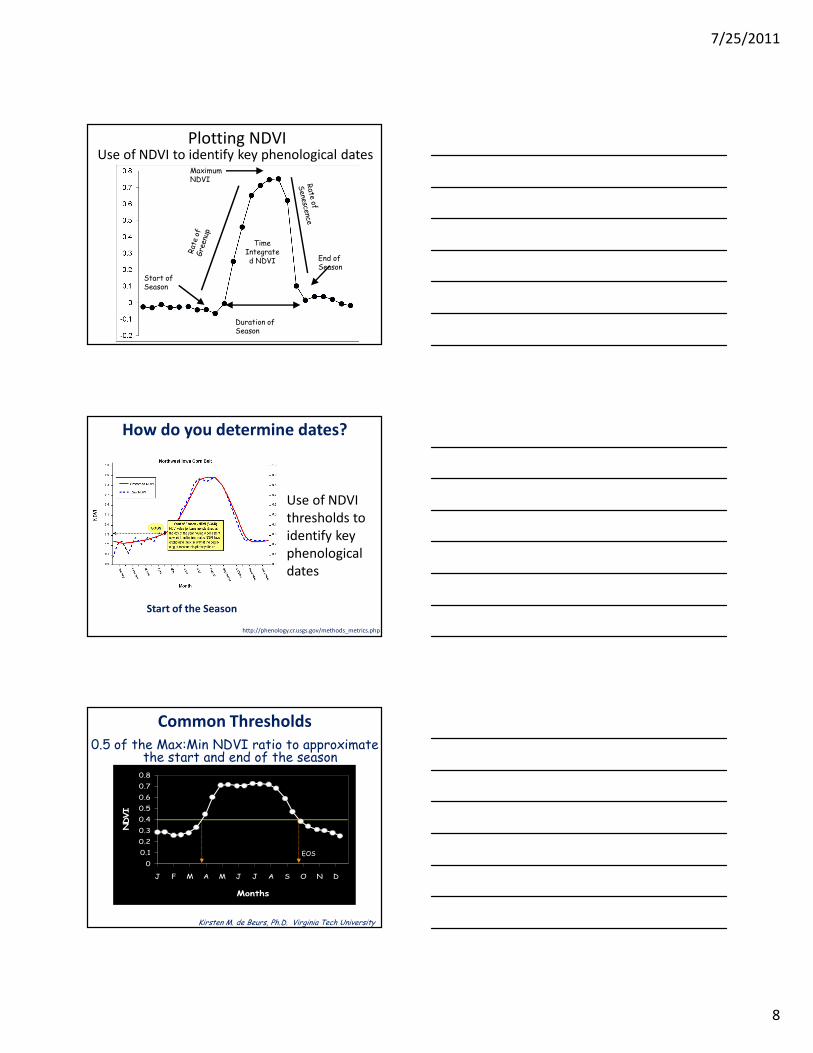
0.5 of the Max:Min NDVI ratio to approximate the start and end of the season
0
0.1
0.2
0.3
0.4
0.5
0.6
0.7
0.8
J F M A M J J A S O N D
Months
NDVI
EOS
Common Thresholds
Kirsten M. de Beurs, Ph.D. Virginia Tech University
7/25/2011
9
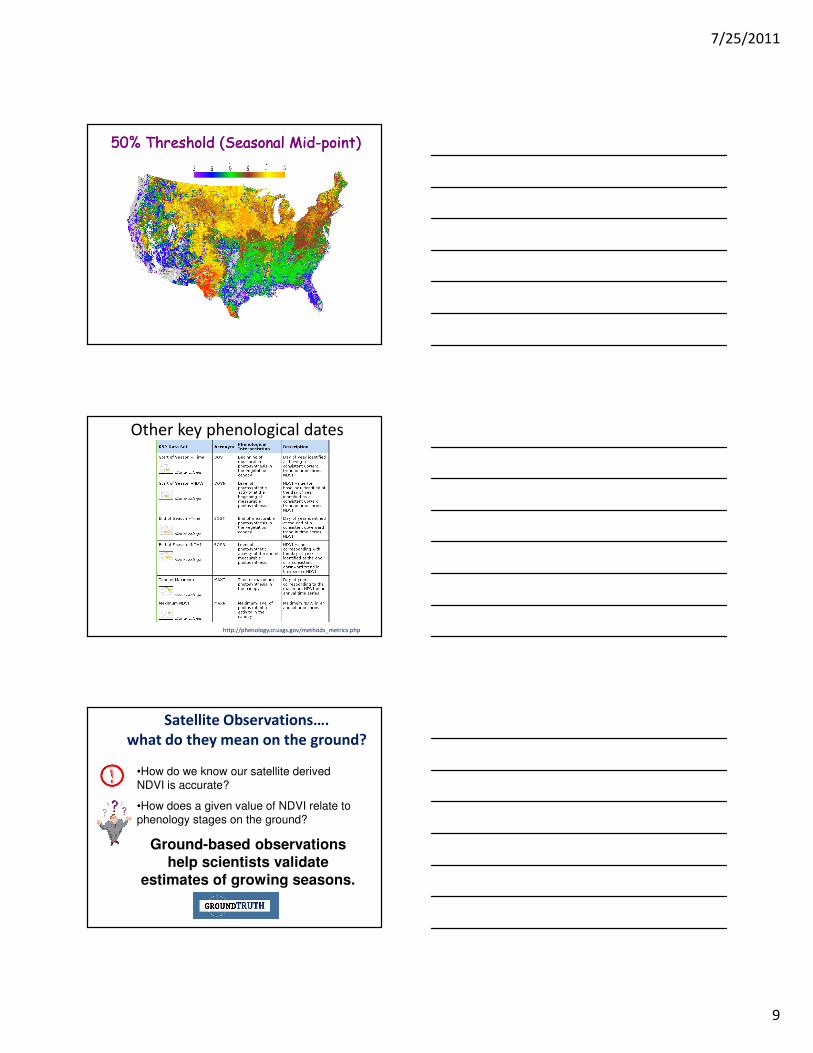
50% Threshold (Seasonal Mid50% Threshold (Seasonal Mid--point)point)
(White et al., mean day = 124, May 4th)
Other key phenological dates
http://phenology.cr.usgs.gov/methods_metrics.php
Satellite Observations….
what do they mean on the ground?
•How do we know our satellite derived NDVI is accurate?
•How does a given value of NDVI relate to phenology stages on the ground?
Ground-based observations
help scientists validate
estimates of growing seasons.

7/25/2011
10
Picture Posthttp://picturepost.unh.edu/
What is a Picturepost
A stable permanent platform
in an ecological important location
where you take
photographs
over time

7/25/2011
11
What you can do with Picturepost
•Contribute photographs to the
scientific network
•Track changes in
your site over time
•Link your findings to satellite
imagery of your area
The Picture Post Process
Select a
Location
Install a
permanent
PicturePost
Take pictures
once a week
Upload
pictures to
the DEW
website
Analyze
Characteristics
of your pictures
Track
changes over
seasons
Track
changes over
years
ID and track
key
phenology
stages
Contribute to
the scientific
Network

7/25/2011
12
What you need
• A permanent plot to visit• Digital Camera
• Camera Mounting Block and post• Compass• Computer (for image upload)
• Downloaded freeware• A group committed to taking
regular photos of their site
The Picture Post Process
Select a
Location
•Choose an easily accessible location
•Include vegetation in each canopy level
•Include a landmark feature for reference
Install a
permanent
PicturePost
The Picture Post Process
7/25/2011
13
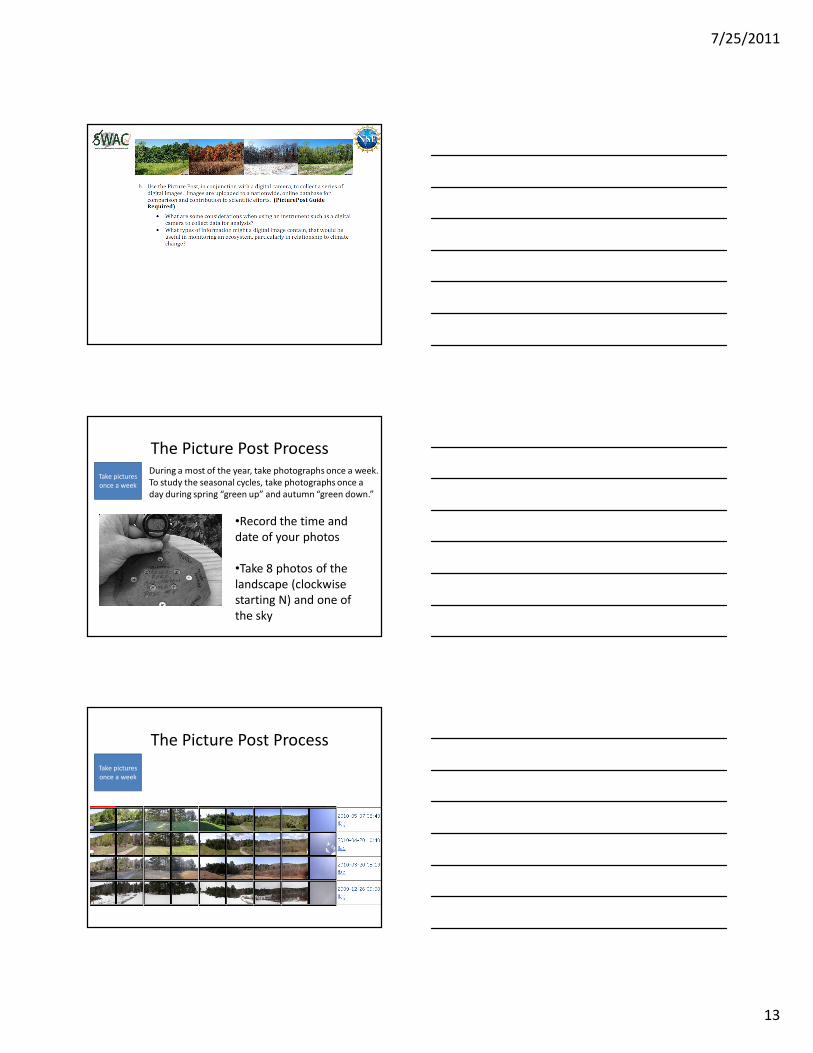
Take pictures
once a week
The Picture Post Process
•Record the time and
date of your photos
•Take 8 photos of the
landscape (clockwise
starting N) and one of
the sky
During a most of the year, take photographs once a week.
To study the seasonal cycles, take photographs once a
day during spring “green up” and autumn “green down.”
Take pictures
once a week
The Picture Post Process

7/25/2011
14
The Picture Post Process1. Register and Log in to the site
2. Create your Picture Post location within the
database
http://picturepost.unh.edu/help_addpost.jsp
Upload
pictures to
the DEW
website
Contribute to
the scientific
Network
The Picture Post ProcessUpload your photos on your “My Page”
http://mvh.sr.unh.edu/mvhtools/uploading_
photos.htm
Upload
pictures to
the DEW
website
Contribute to
the scientific
Network

7/25/2011
15
Download the Panorama Software
http://www.foto-freeware.de/panoramafactory.php
Visualize
changes over
time
Panarama
Factory
Software
Panorama SoftwareUpload your photos into the Panorama Factory
by clicking on the Camera IconVisualize
changes
over time
Panarama
Factory
Software
Panorama Software
1. Drag your newly imported photos
into the correct order
2. Select them all with the CTRL button
3. Click on the Stich Icon
Visualize
changes
over time
Panarama
Factory
Software

7/25/2011
16
Panorama Software
1. Select your new panorama
2. From the File Tab select Save View As
3. Now you can save your panorama as
a jpg. Or .tif for later analysis or
stacking.
Visualize
changes
over time
Panarama
Factory
Software
Animate Your
Images
More Visualization ToolsVisualize
changes
over time
Panarama
Factory
Software
Animate Your Images
Make your own Picture Story
using Windows Movie Maker
or Apple’s QuickTime Pro

7/25/2011
17
Download the ADI Software
http://mvh.sr.unh.edu/software/software.htm
Quantify
Canopy
Characteristics
Analyzing
Digital
Images
Software
Analyzing your imagery
Quantify
Canopy
Characteristics
Analyzing
Digital
Images
Software
Open the Analyzing Digital Imagery Program
Click Open a Picture and browse to your image
Select NONE for the Calibration Method
Analyzing your imagery
Quantify
Canopy
Characteristics
Analyzing
Digital
Images
Software
Select the Rectangle Tool to isolate an area of
vegetation in your image
7/25/2011
18
Analyzing your imagery
Quantify
Canopy
Characteristics
Analyzing
Digital
Images
Software
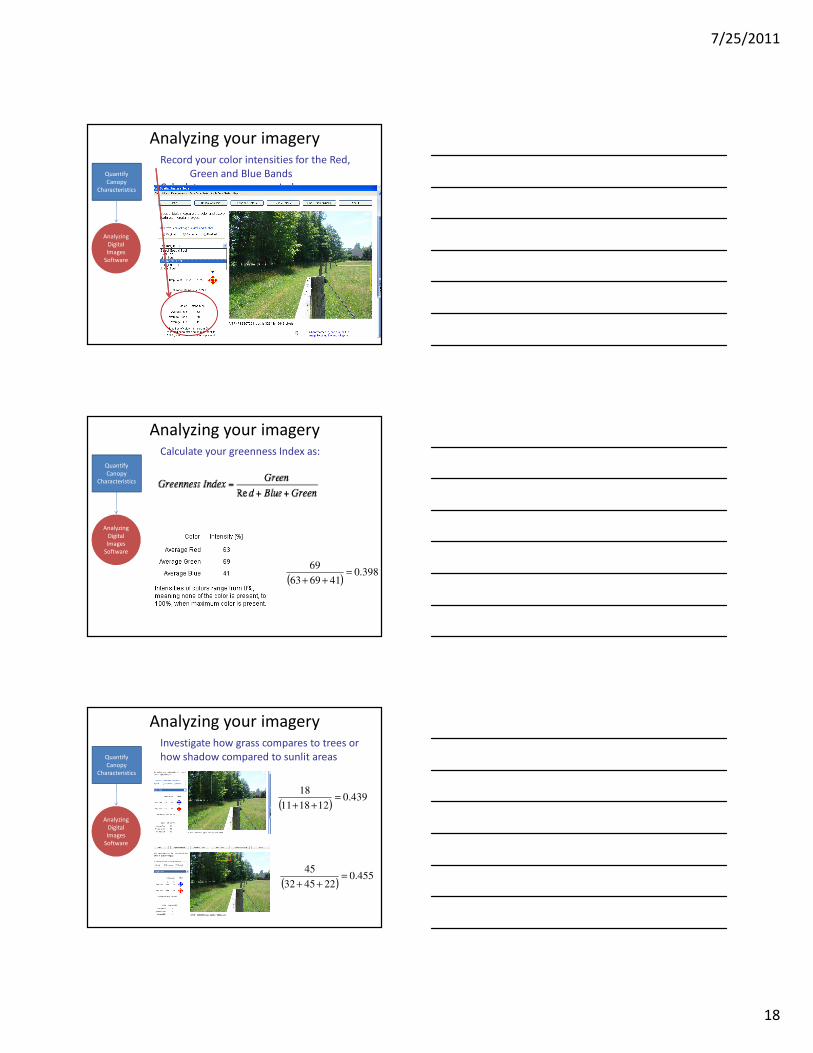
Record your color intensities for the Red,
Green and Blue Bands
Calculate your greenness Index as:
Analyzing your imagery
Quantify
Canopy
Characteristics
Analyzing
Digital
Images
Software
Calculate your greenness Index as:
( )398.0
416963
69=
++
Analyzing your imagery
Quantify
Canopy
Characteristics
Analyzing
Digital
Images
Software
Investigate how grass compares to trees or
how shadow compared to sunlit areas
( )439.0
121811
18=
++
( )455.0
224532
45=
++
7/25/2011
19
Analyzing your imagery
Quantify
Canopy
Characteristics
Analyzing
Digital
Images
Software
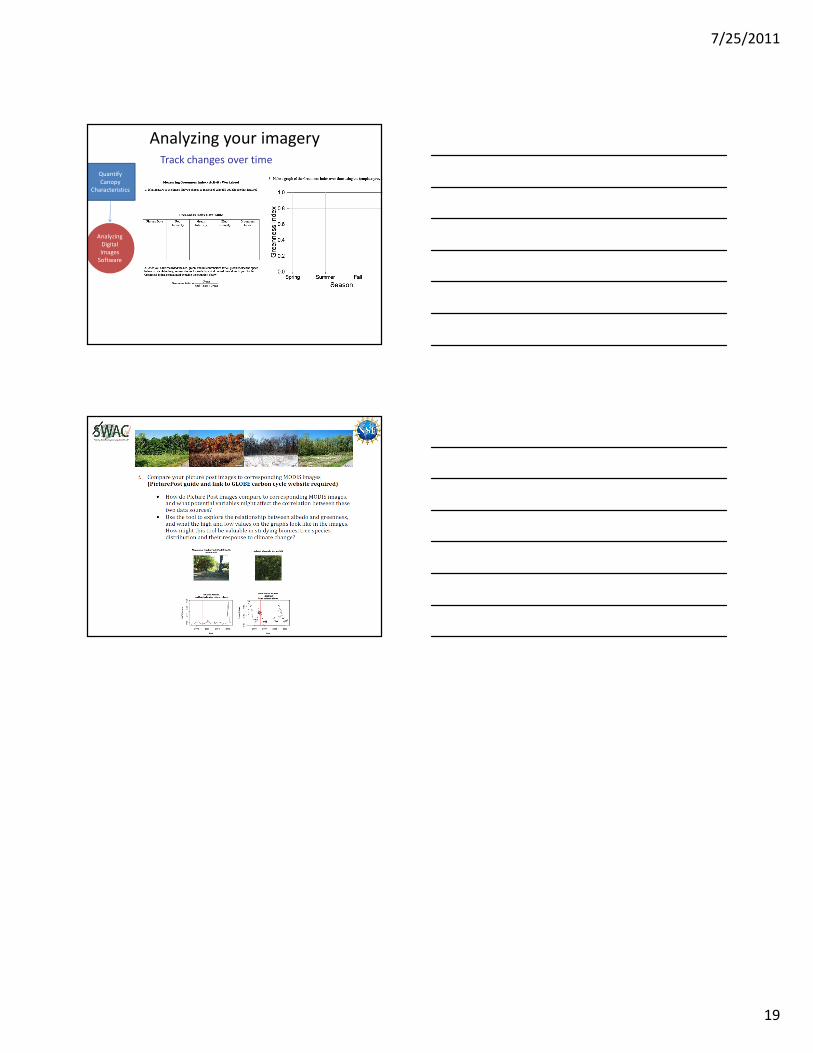
Track changes over time