climate change and health: adaptation impact assessment · climate change and health: adaptation...
TRANSCRIPT

Climate Change and Health:
Adaptation Impact Assessment
15th NIH Scientific Meeting
12-14 June 2012
HARNESSING RESEARCH
FOR BETTER HEALTH
Dr. Muhammad Amir Kamaluddin
Environmental Health Research Centre, IMR
Presentation Outline
• Climate change fundamentals
• Global and local scenarios
• Vulnerability & Adaptation assessment
• Recommendation and Conclusion
INTRODUCTION
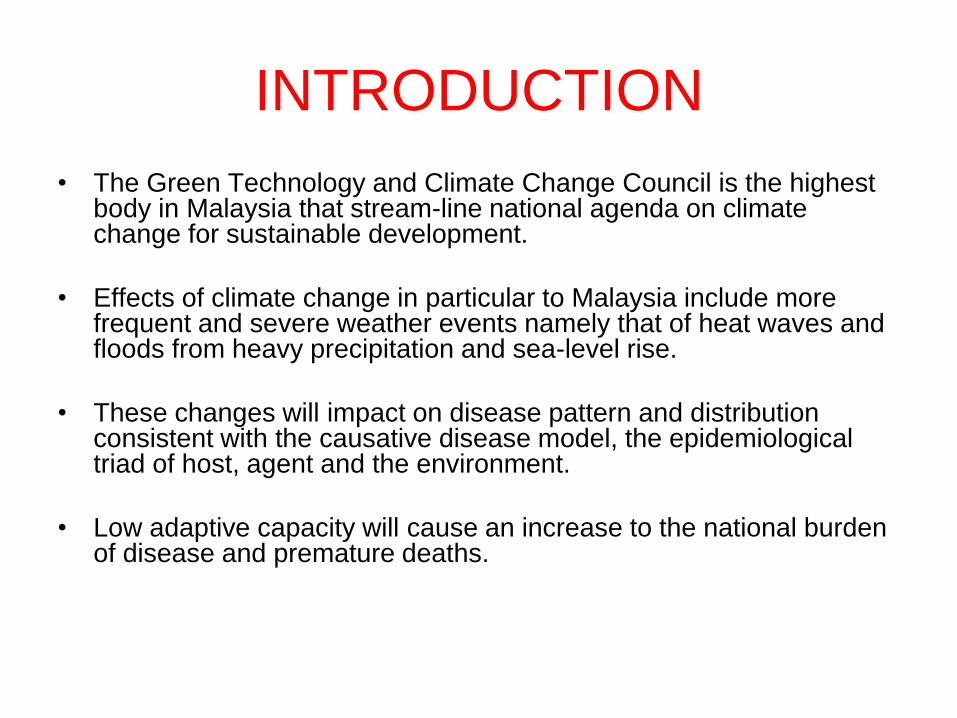
• The Green Technology and Climate Change Council is the highest body in Malaysia that stream-line national agenda on climate change for sustainable development.
• Effects of climate change in particular to Malaysia include more frequent and severe weather events namely that of heat waves and floods from heavy precipitation and sea-level rise.
• These changes will impact on disease pattern and distribution consistent with the causative disease model, the epidemiological triad of host, agent and the environment.
• Low adaptive capacity will cause an increase to the national burden of disease and premature deaths.

Key facts
• Climate change affects the fundamental requirements for health – clean air, safe drinking water, sufficient food and secure shelter.
• The global warming that has occurred since the 1970s was causing over 140 000 excess deaths annually by the year 2004.
• Many of the major killers such as diarrhoeal diseases, malnutrition, malaria and dengue are highly climate-sensitive and are expected to worsen as the climate changes.
• Areas with weak health infrastructure – mostly in developing countries – will be the least able to cope without assistance to prepare and respond.
• Reducing emissions of greenhouse gases through better transport, food and energy-use choices can result in improved health.
WHO Fact sheet N266 2010
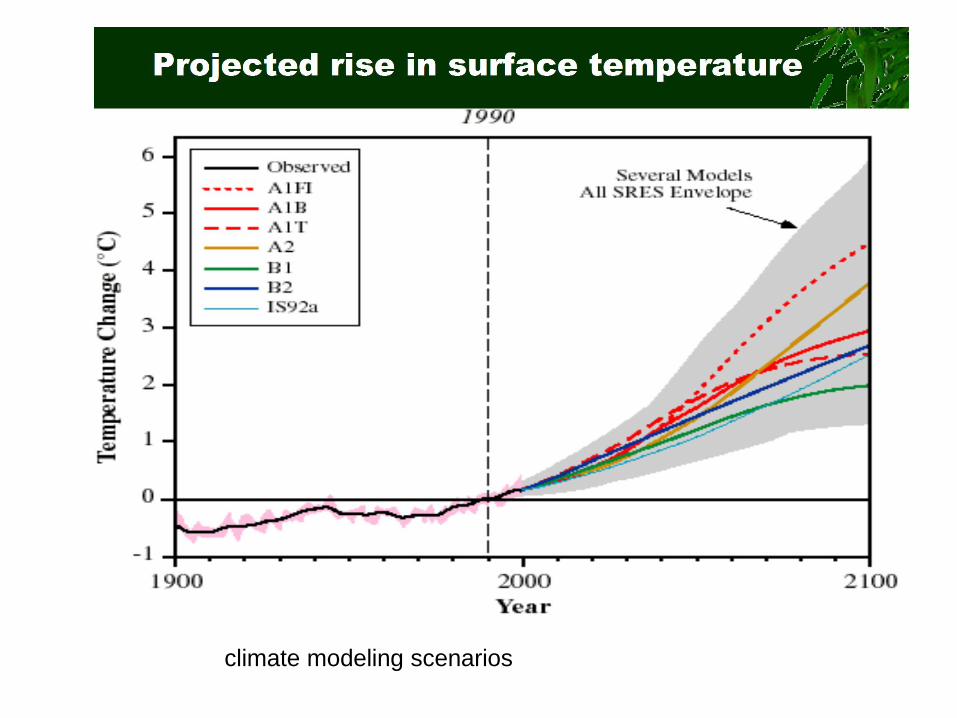
climate modeling scenarios
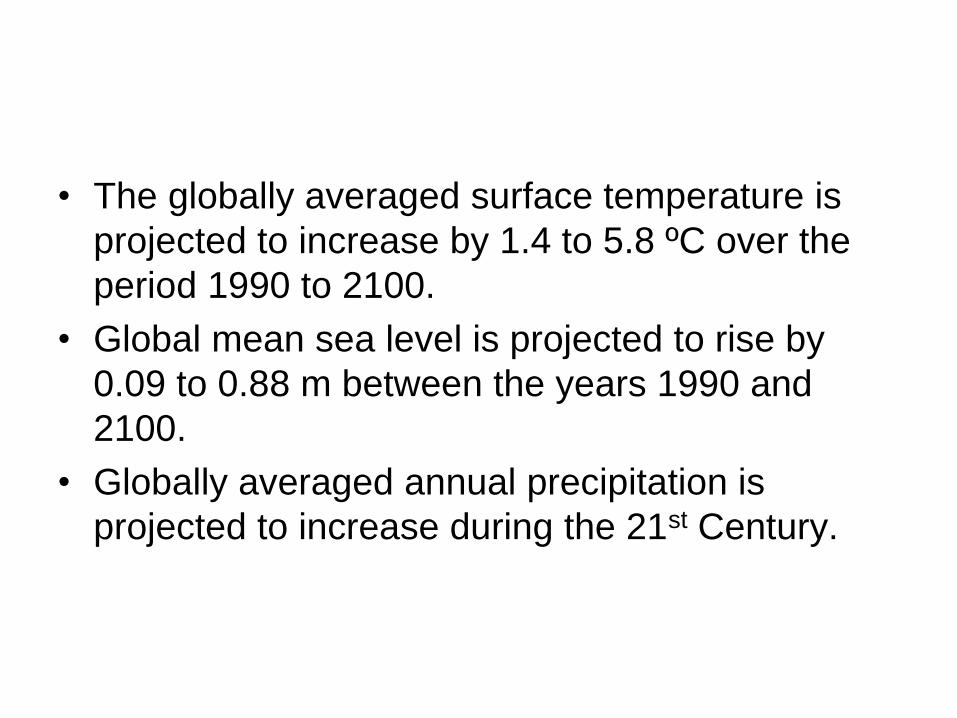
• The globally averaged surface temperature is
projected to increase by 1.4 to 5.8 ºC over the
period 1990 to 2100.
• Global mean sea level is projected to rise by
0.09 to 0.88 m between the years 1990 and
2100.
• Globally averaged annual precipitation is
projected to increase during the 21st Century.

Global Warming and related
Physical Changes
• Sea level rise
– Changes in currents and tidal patterns driven
by warming of oceans
– Salinity intrusion
• Changes in precipitation levels
– Increased rainfall leading to floods
– Increase frequency/intensity of drought
– Heat waves and storms
Definitions
• Adaptation is a process to cope with the
changing environment.
• Vulnerability is a function of potential
impacts (exposure, sensitivity) and
adaptive capacity of a system
• Mitigation is interventions to reduce the
sources or enhance the sinks of
greenhouse gases.

Findings from the IPCC WG II
Fourth Assessment, 2007
IPCC WG II : Impacts, adaptation and vulnerability
– Health impacts
• Increase burden from malnutrition, diarrhoeal,
cardio-respiratory and infectious diseases
• Increased mortality and morbidity from
heatwaves, floods and droughts
• Changed distribution of some disease vectors
• Substantial burden on health services
IPCC Technical Paper on Water
and Climate Change, 2008
• More intense and frequent extreme
weather events
• Increased rates of diarrhoeal diseases
after flood events
• Mental health issues
• Contamination of water with hazardous
substances e.g pesticides (chemicals and
heavy metals)

Climate sensitive diseases
• Climate sensitive diseases have been identified and reported by Malaysia to the UNFCCC in the Second National Communication (2011)
• Risk of resurgence in vector borne diseases incidence namely dengue, chikungunya and malaria.
• Other disease entity relate to food and water borne disease namely cholera and typhoid.
• Floodings have also been associated with higher incidence of zoonotic disease namely leptospirosis.

Climate change and health: pathway from driving forces,
through exposures to potential health impact.
Driving
forces
Population
dynamics
Unsustainable
economic
development
Natural
causes
Adaptive
capacity
Mitigative
capacity
Mitigation
measures
Greenhouse
gases (GHG)
emissions
CLIMATE
CHANGE
Microbial
contamination
pathways
Transmission
dynamics
Agro-
ecosystems,
hydrology
Socioeconomics,
demographics
Regional
weather
changes
Heatwaves
Extreme
weather
Temperature
Precipitation
Health effects
Temperature-related
illness and death
Extreme weather-
related health effects
Air pollution-related
health effects
Water and food-borne
diseases
Vector-borne and
rodent-borne diseases
Effects of food and
water shortages
Mental, nutritional,
infectious and other
health effects
Modulating
influences
Health-specific
adaptation
measures
Research
needs
Evaluation of
adaptation
Source: Climate Change and Human Health – Risks and Reponses. Summary (WHO, 2003)
Biologic response to changes
in climate:
• Warmer environment and mosquitoes – Boost rate of reproduction
– Increase the number of blood meal
– Prolongs their breeding season
– Shorten the maturation period of microbes they carry
• Heavy downpours – Drive rodents from burrows: risk of zoonotic diseases
– Create mosquito breeding sites
– Faster fungal growth in houses
– Flush pathogens and chemicals into waterways

Resources
• Malaysia Second National Communication to the UNFCCC (Jan 2011)
• ASM Study Report 1/2011
• MMD Scientific Report 2009: Climate Change scenarios for Malaysia
• NAHRIM Study 2006: Impact of Climate Change on the hydrologic regime and water resources of peninsular Malaysia
• IPCC Technical Guidelines for Assessing Climate Change Impacts and Adaptations 1994
NAHRIMs Climate Change Study
• A regional hydrologic-atmospheric model
of Peninsular Malaysia called the
‘Regional Hydroclimate Model of
Peninsular Malaysia (RegHCM-PM)’ has
been developed by NAHRIM
• Observed and Simulated Historical Data
(1984 to 1993)
• Simulated Future Data (2025 to 2034 and
2040 to 2050)

NAHRIM 2008: Temperature
• Mean temperature during future period is
higher than during historical period up to
1.4 deg Celsius
• Increase of max. monthly temperature of
up to 2 deg Celsius all over peninsular
Malaysia
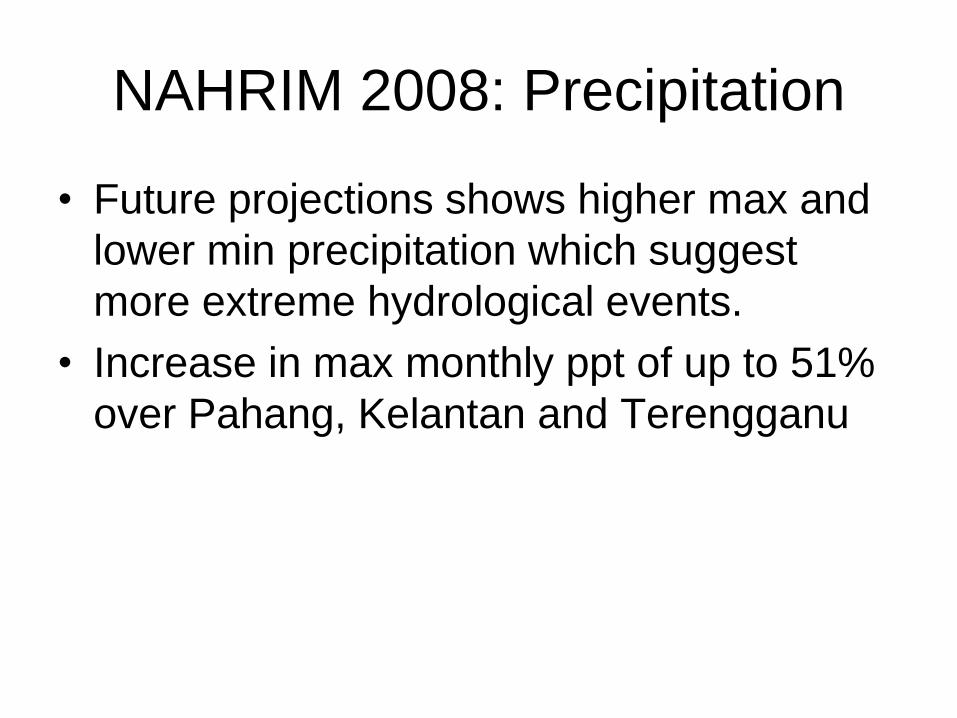
NAHRIM 2008: Precipitation
• Future projections shows higher max and
lower min precipitation which suggest
more extreme hydrological events.
• Increase in max monthly ppt of up to 51%
over Pahang, Kelantan and Terengganu
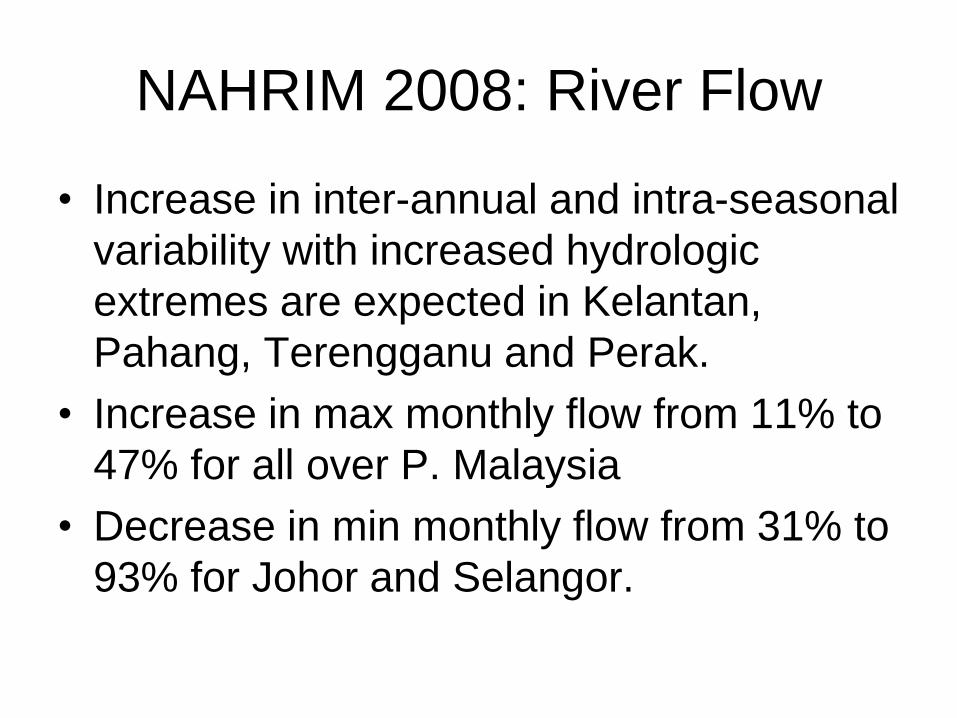
NAHRIM 2008: River Flow
• Increase in inter-annual and intra-seasonal
variability with increased hydrologic
extremes are expected in Kelantan,
Pahang, Terengganu and Perak.
• Increase in max monthly flow from 11% to
47% for all over P. Malaysia
• Decrease in min monthly flow from 31% to
93% for Johor and Selangor.
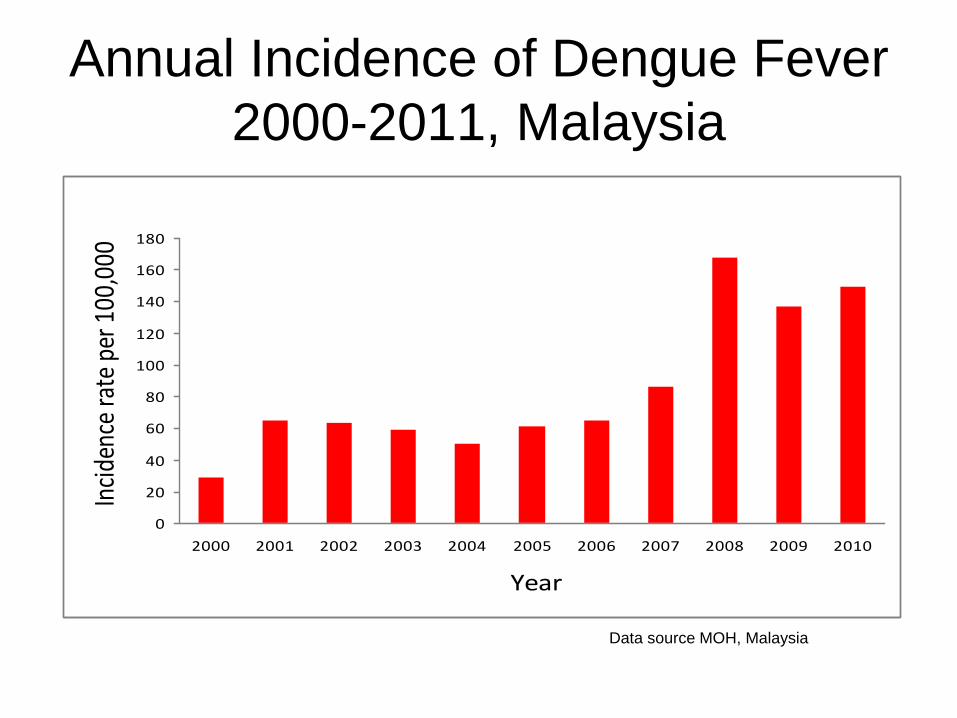
Annual Incidence of Dengue Fever
2000-2011, Malaysia
0
20
40
60
80
100
120
140
160
180
2000 2001 2002 2003 2004 2005 2006 2007 2008 2009 2010
Year
Inci
denc
e ra
te p
er 1
00,0
00
Data source MOH, Malaysia
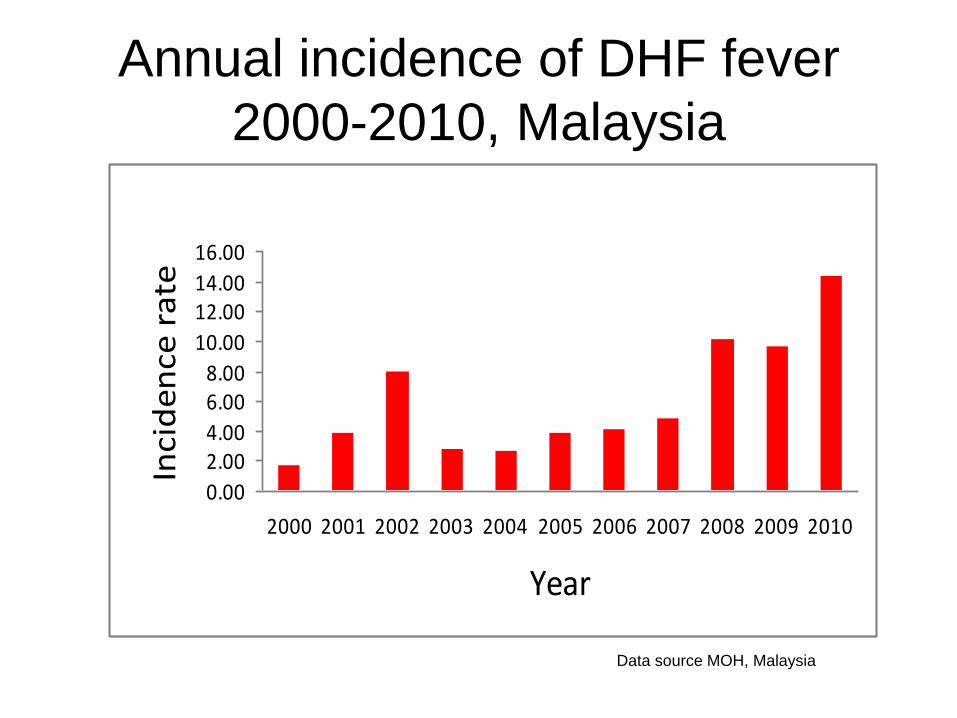
Annual incidence of DHF fever
2000-2010, Malaysia
0.00
2.004.00
6.008.00
10.00
12.0014.00
16.00
2000 2001 2002 2003 2004 2005 2006 2007 2008 2009 2010
Year
Inci
de
nce
ra
te
Data source MOH, Malaysia

Annual Incidence of Malaria in
Malaysia, 2000-2010
0.00
10.00
20.00
30.00
40.00
50.00
60.00
2000 2001 2002 2003 2004 2005 2006 2007 2008 2009 2010
Year
Inci
den
ce r
ate
Data source MOH, Malaysia

Annual Incidence of Cholera in Malaysia,
1980-2010
0
2
4
6
8
10
12
14
16
80 81 82 83 84 85 86 87 88 89 90 91 92 93 94 95 96 97 98 99 00 01 02 03 04 05 06 07 08 09 10
Year
Inci
de
nce
rat
e p
er
10
0,0
00
0
2
4
6
8
10
12
14
16
80 81 82 83 84 85 86 87 88 89 90 91 92 93 94 95 96 97 98 99 00 01 02 03 04 05 06 07 08 09 10
Year
Inci
de
nce
rat
e p
er
10
0,0
00
Data source: MOH, Malaysia
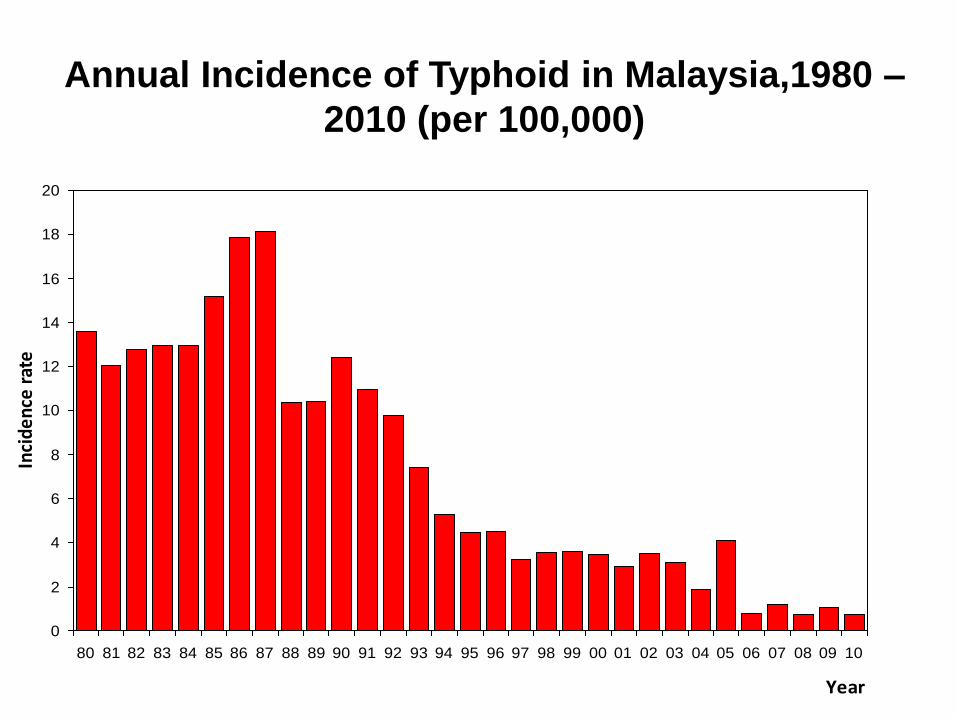
Annual Incidence of Typhoid in Malaysia,1980 –
2010 (per 100,000)
0
2
4
6
8
10
12
14
16
18
20
80 81 82 83 84 85 86 87 88 89 90 91 92 93 94 95 96 97 98 99 00 01 02 03 04 05 06 07 08 09 10
Year
Inci
denc
e ra
te

Annual Incidence of Food Water Borne Diseases in Malaysia, 1998 - 2010
0.00
1.00
2.00
3.00
4.00
5.00
6.00
7.00
Inci
den
ce p
er 1
00,0
00 p
op
Kolera 5.88 2.36 0.56 2.34 1.49 0.54 0.35 1.48 0.89 0.48 0.34 0.98 1.57
Tifoid/paratifoid 3.53 3.57 3.45 2.92 3.48 3.13 1.89 4.10 0.77 1.17 0.72 1.07 0.74
Hepatitis A 1.08 1.40 2.24 1.90 1.20 0.89 0.42 0.17 0.24 0.33 0.13 0.14 0.14
Disentri 0.11 1.89 2.01 1.24 1.19 1.24 1.39 0.54 0.39 0.50 0.33 0.54 0.37
1998 1999 2000 2001 2002 2003 2004 2005 2006 2007 2008 2009 2010
Data source MOH, Malaysia
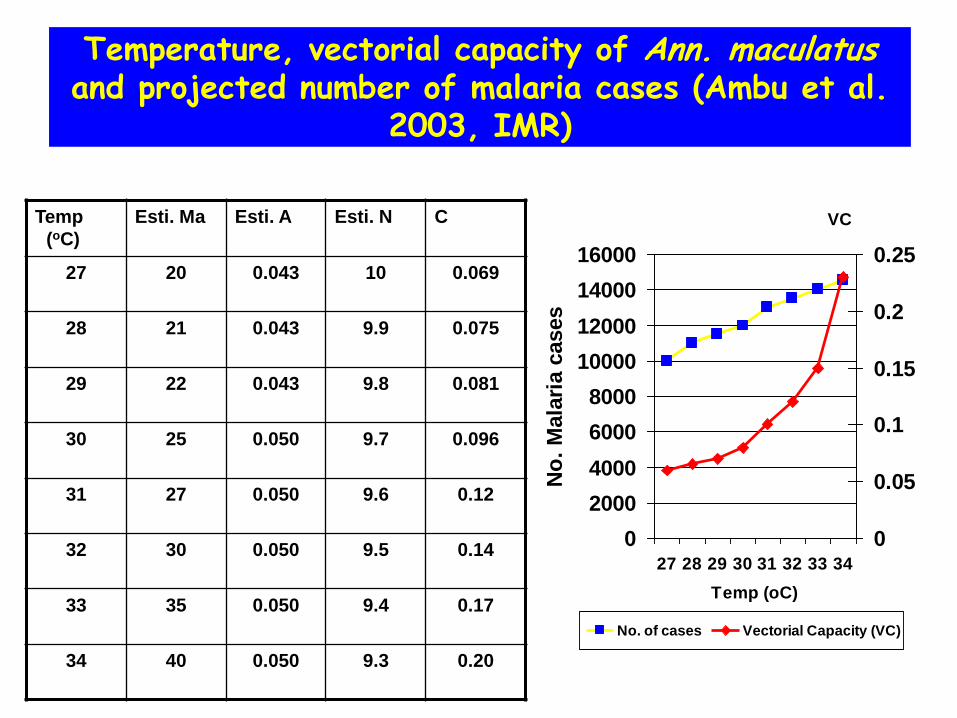
Temperature, vectorial capacity of Ann. maculatus and projected number of malaria cases (Ambu et al.
2003, IMR)
0
2000
4000
6000
8000
10000
12000
14000
16000
27 28 29 30 31 32 33 34
Temp (oC)
No
. M
ala
ria c
ases
0
0.05
0.1
0.15
0.2
0.25
VC
No. of cases Vectorial Capacity (VC)
Temp
(oC)
Esti. Ma Esti. A Esti. N C
27 20 0.043 10 0.069
28 21 0.043 9.9 0.075
29 22 0.043 9.8 0.081
30 25 0.050 9.7 0.096
31 27 0.050 9.6 0.12
32 30 0.050 9.5 0.14
33 35 0.050 9.4 0.17
34 40 0.050 9.3 0.20

• Vectorial capacity modelling projected that
the number of malaria cases may increase
by about 15% to 20% with an increase of
1.5 degree C to 2 degree C in surface
temperature in Peninsular Malaysia.

Effective adaptation: insecticide-
impregnated bed-net
0
5000
10000
15000
20000
25000
1993 1994 1995 1996 1997 1998 1999 2000 2001 2002 2003 2004 2005 2006
No
. o
f c
as
es
& c
um
mu
lati
ve
no
. o
f b
ed
-
ne
t d
istr
ibu
ted
0
1
2
3
4
5
6
7
Ra
infa
ll
cases Bed-net Rainfall
Source: MOH Malaysia

……IPCC AR4
River flooding may increase in duration.
Flash flooding will be more frequent. Short
duration rainfalls may create drainage
congestions specially in urban areas.

Johor Floods
• Worst flood
• 1st wave (19 Dec 2006)
• 2nd wave (12 Jan 2007)
• 19 December 2006 – 19 February 2007
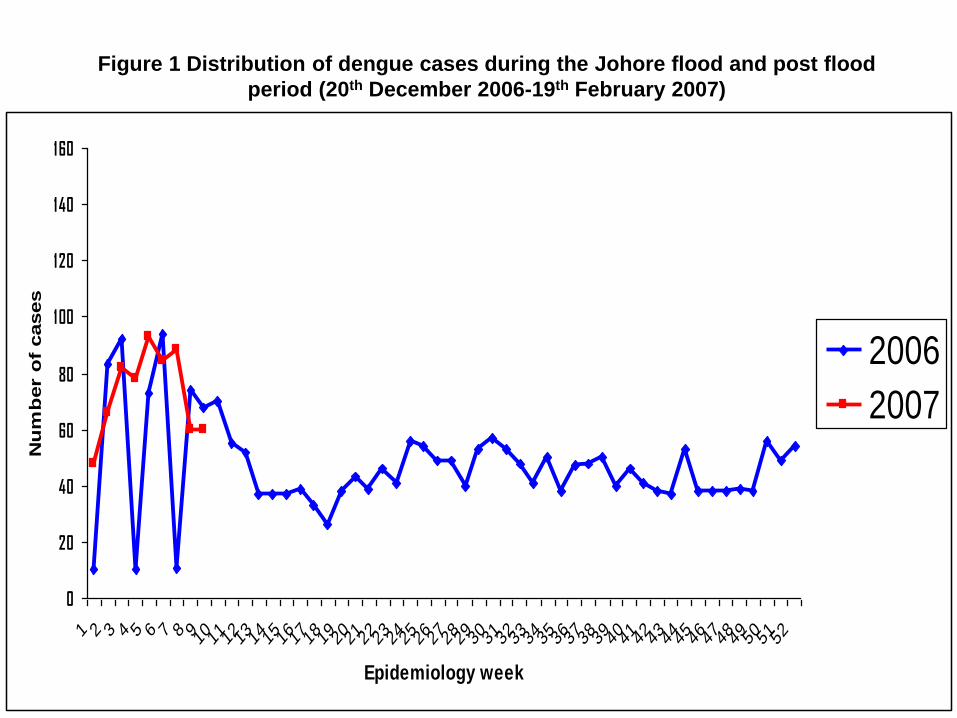
Figure 1 Distribution of dengue cases during the Johore flood and post flood
period (20th December 2006-19th February 2007)
0
20
40
60
80
100
120
140
160
1 2 3 4 5 6 7 8 910111213141516171819202122232425262728293031323334353637383940414243444546474849505152
Epidemiology week
Nu
mb
er o
f cases
2006
2007

Adaptation activities
• Flood Action Plan
• Enhanced public health control
programmes
• Augmented by syndromic and laboratory
surveillance on potentialy fatal infectious
diseases

Strengthening health systems:
Health sector actions as climate change
adaptations
Healthy
development
Environmental
health capacity
building
Integrated vector
management
Health action
in emergencies
Infectious disease
surveillance
Safe drinking
water
Diseases
affected by
climate

Adapting to Current and Projected
Climate-Related Health Burdens
• Continued investment in health infrastructures & human resource – Network of public health
laboratories
– Environmental health programs
• Sanitation
• Water supply
• Food safety
• Continued vigilance on infectious diseases
• Strengthening surveillance system and disaster preparedness and response – Rapid Response Command
Centre
– Malaysian CDC in 9th MP
• Research & development
Number of facilities
1980 1990 2005
Hospitals 93 95 122
Health
Centres
351 497 809
Rural
Health
Clinics
1509 1986 2008

• Key Frameworks developed for vulnerability and adaptation assessment studies;
– Adaptation Policy Framework (Burton et al., 2004) by United Nations Development Programme (UNDP);
– Annotated Guideline for National Adaptation Plans of Action (NAPA) (UNFCC, 2002);
– Assessments of Impacts and Adaptations to Climate Change (AIACC) projects;
– United Kingdom Climate Impacts Programme (UKCIP) Climate Adaptation: Risk, Uncertainty and Decision Making
• Linked with current climate variability and adaptation, future impacts, vulnerability, socio economic condition, sustainable development
• Climate driven ecosystem/habitat changes
could alter the migratory patterns and
routes of terrestrial and aquatic
(freshwater and marine species)
– Migratory birds
– Migratory fish
– Migratory marine mammals and reptiles

In summary
Focus Areas
Dengue
Resurgence in Malaria
Zoonoses
Strengthening existing public health program
Priority for applied research:
Developing vulnerable risk management tool as in an integrated environmental health surveillance system incorporating meteorological factors and disease surveillance, modeling over climate related extreme event taking river flow as an environmental indicator of flooding and risk prediction of climate sensitive disease occurrence and outbreak.