climate change and agriculture in the united states · climate change and agriculture in the united...
TRANSCRIPT
CLIMATE CHANGE AND AGRICULTURE IN THE UNITED STATES
Jerry L. Hatfield USDA-ARS
Resilient Agriculture 2014
This research is part of a regional collaborative project supported by the USDA-NIFA, Award No. 2011-68002-30190: Cropping Systems Coordinated Agricultural Project: Climate Change, Mitigation, and Adaptation in Corn-based Cropping Systems
IMPACTS OF CLIMATE CHANGE ON AGRICULTURAL PRODUCTIVITY CAN BE OFFSET BY: Utilizing improved genetics Reducing soil erosion and increasing infiltration Improved nutrient management Better weather forecasts Changing cropping systems
CLIMATE VS WEATHER
Climate determines where we grow a crop Weather determines how much we produce
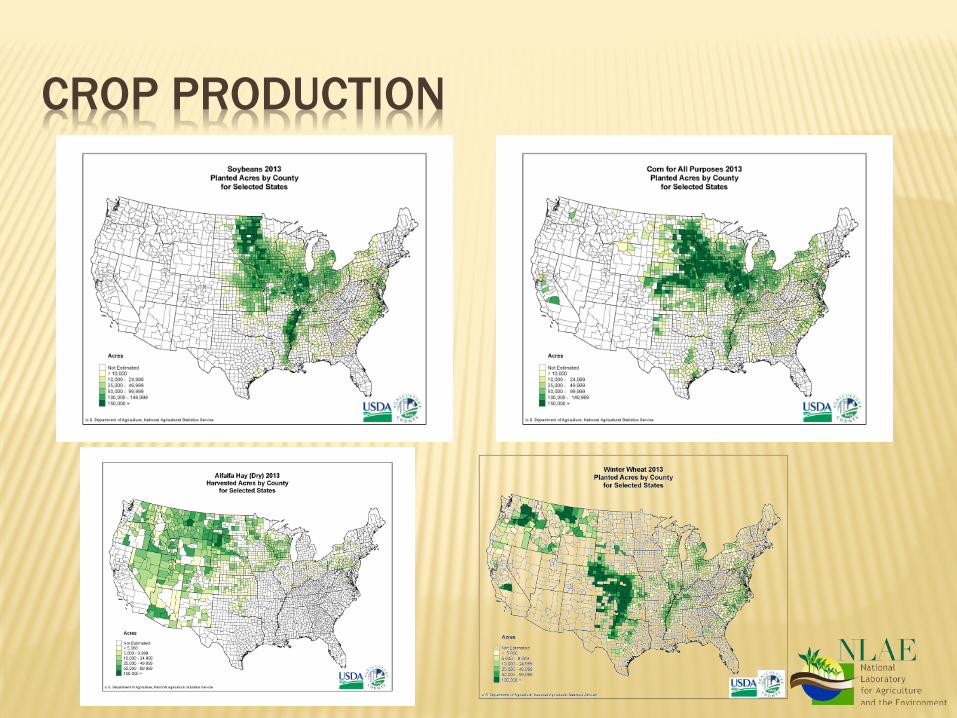
CROP PRODUCTION
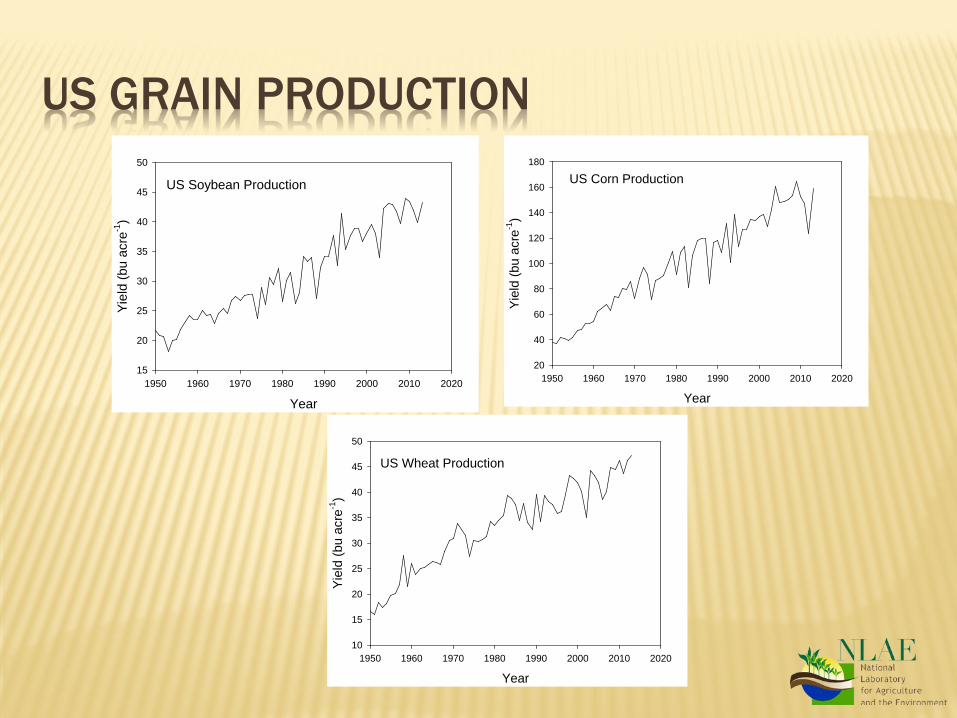
US GRAIN PRODUCTION
US Wheat Production
Year1950 1960 1970 1980 1990 2000 2010 2020
Yiel
d (b
u ac
re-1
)
10
15
20
25
30
35
40
45
50
US Soybean Production
Year1950 1960 1970 1980 1990 2000 2010 2020
Yiel
d (b
u ac
re-1
)
15
20
25
30
35
40
45
50
US Corn Production
Year1950 1960 1970 1980 1990 2000 2010 2020
Yiel
d (b
u ac
re-1
)
20
40
60
80
100
120
140
160
180
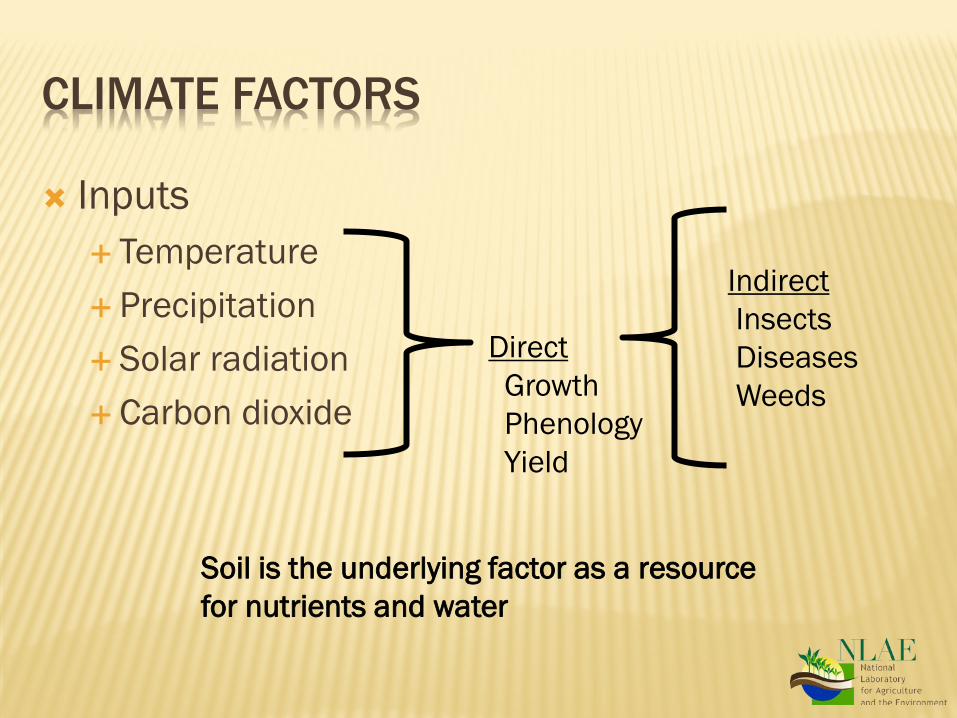
CLIMATE FACTORS
Inputs Temperature Precipitation Solar radiation Carbon dioxide
Direct Growth Phenology Yield
Indirect Insects Diseases Weeds
Soil is the underlying factor as a resource for nutrients and water
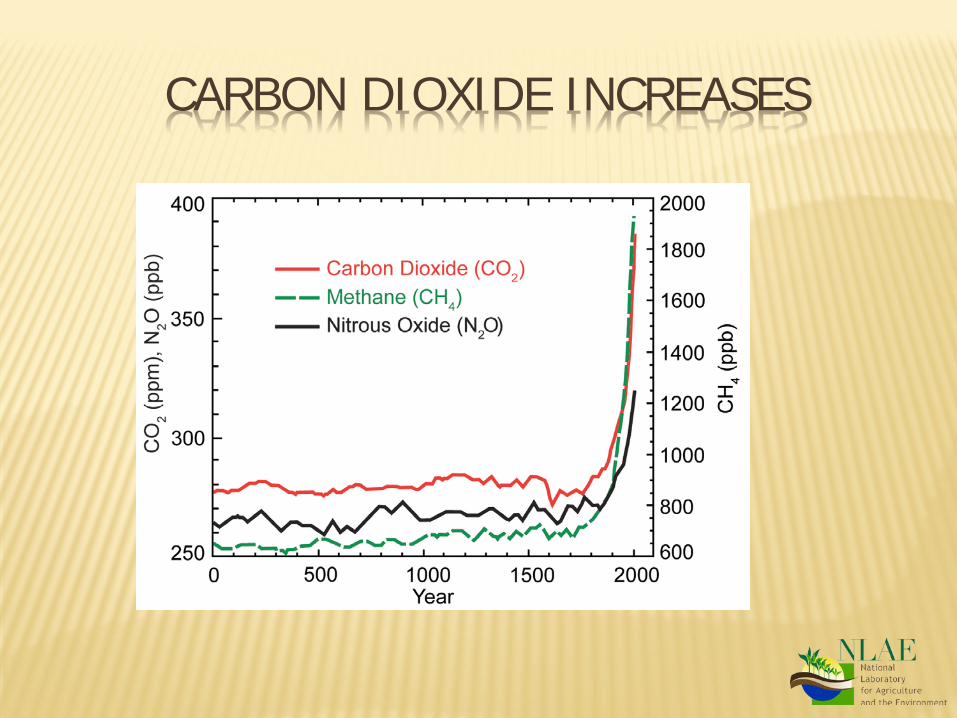
CARBON DIOXIDE INCREASES
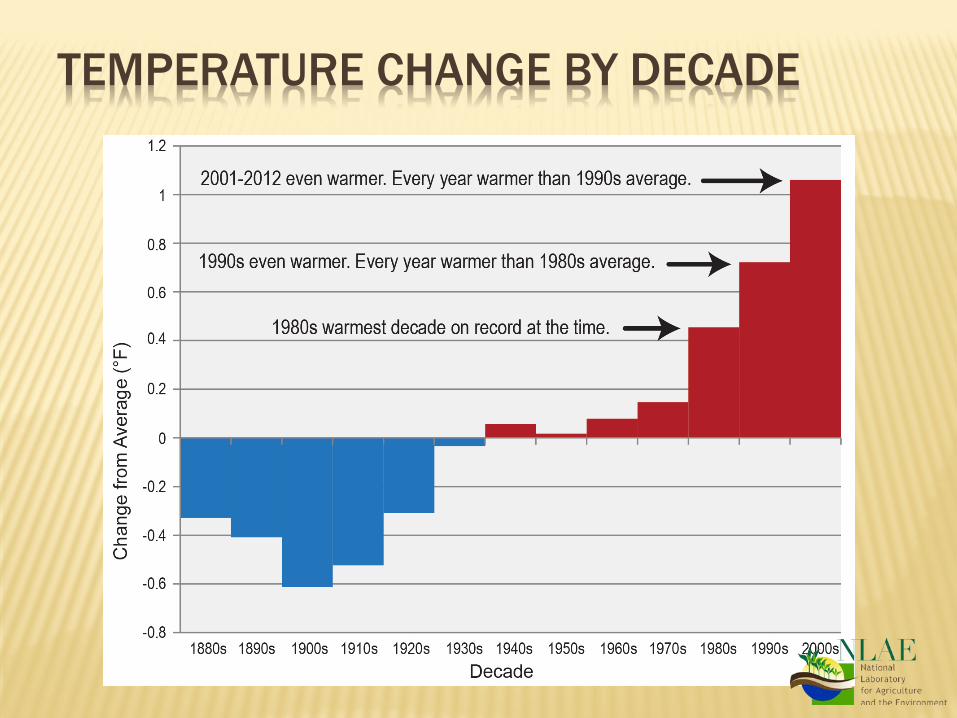
TEMPERATURE CHANGE BY DECADE
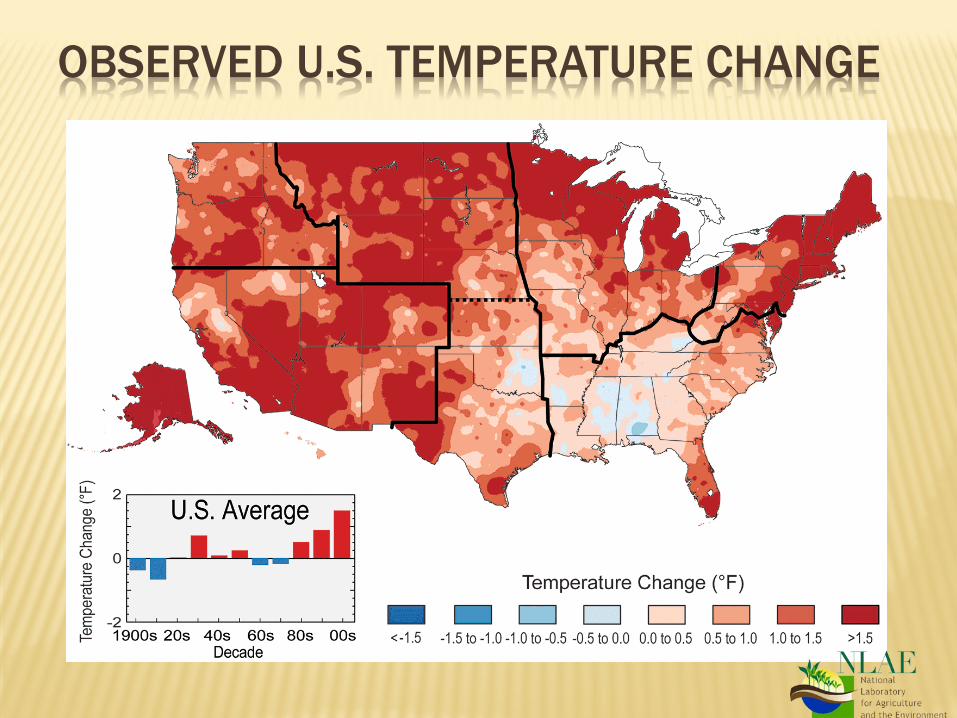
OBSERVED U.S. TEMPERATURE CHANGE
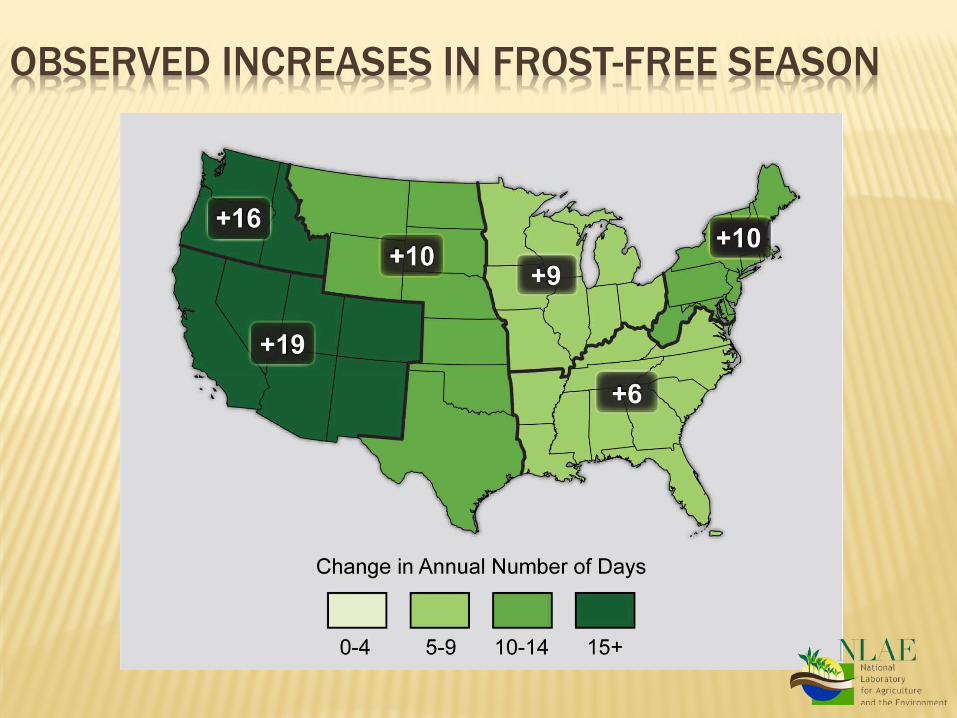
OBSERVED INCREASES IN FROST-FREE SEASON
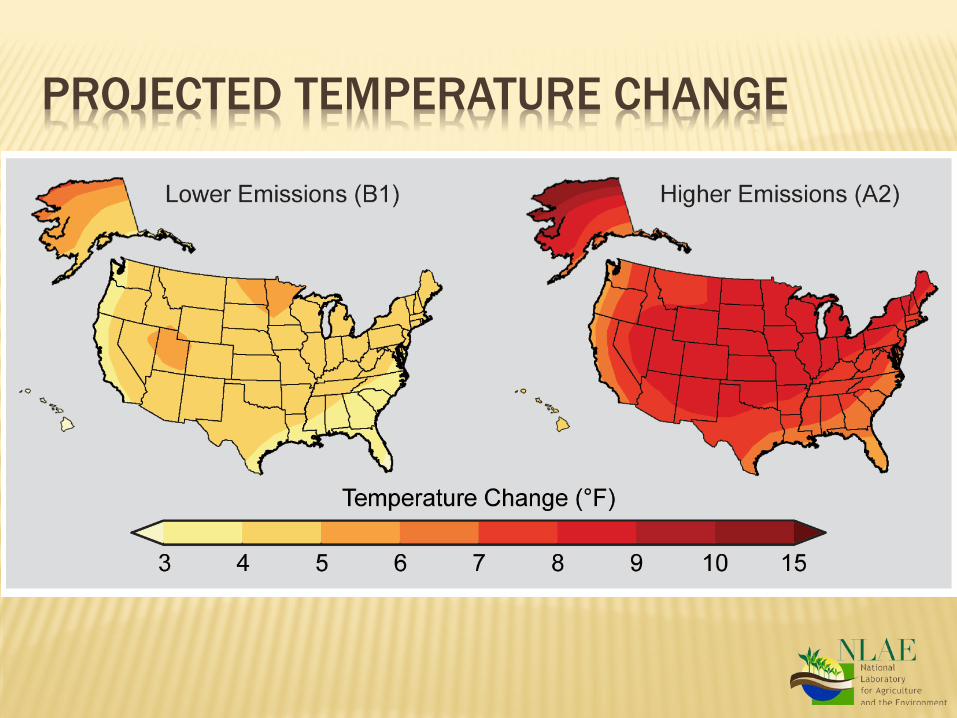
PROJECTED TEMPERATURE CHANGE
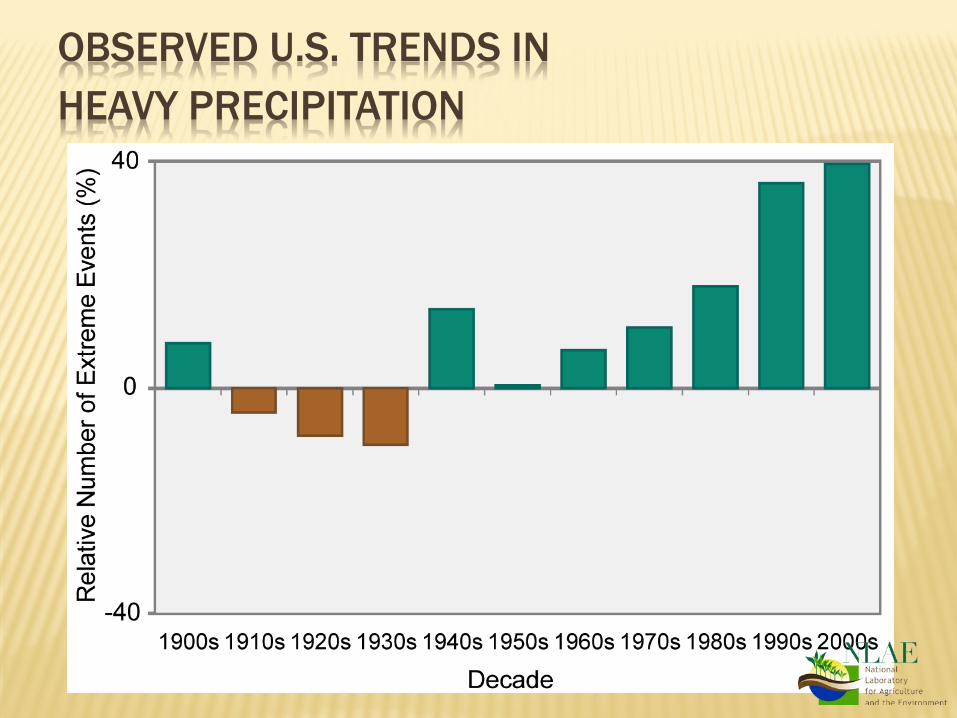
OBSERVED U.S. TRENDS IN HEAVY PRECIPITATION
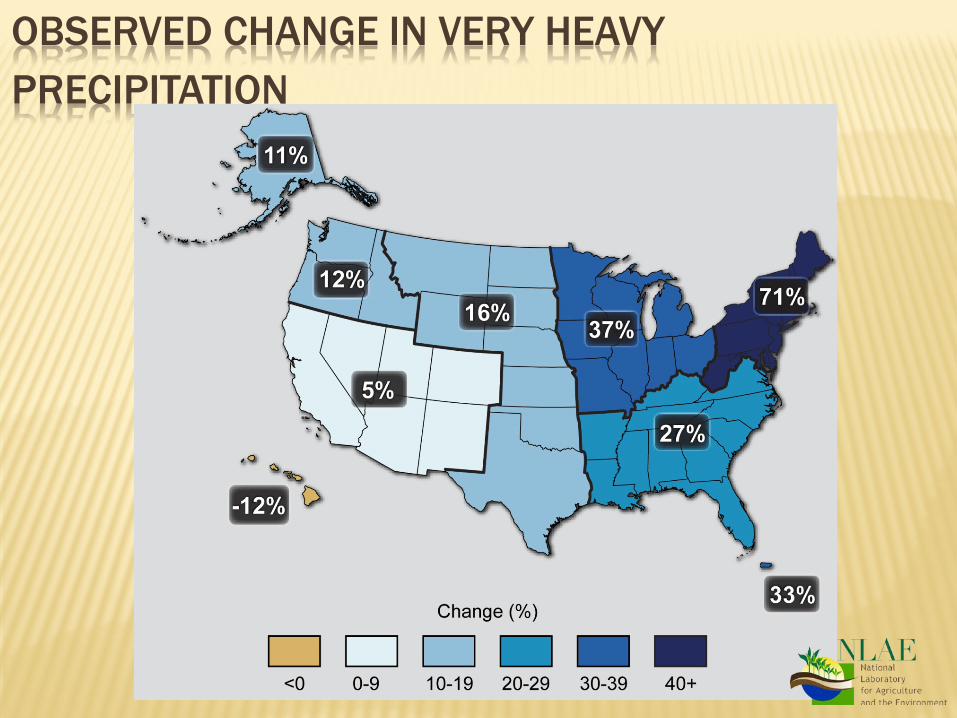
OBSERVED CHANGE IN VERY HEAVY PRECIPITATION
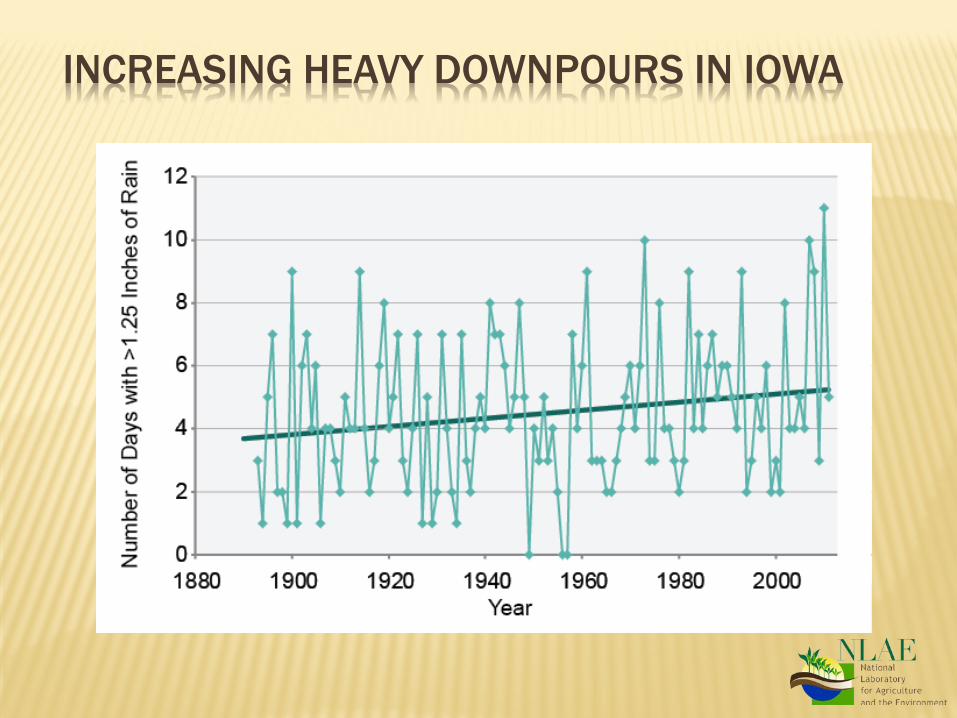
INCREASING HEAVY DOWNPOURS IN IOWA
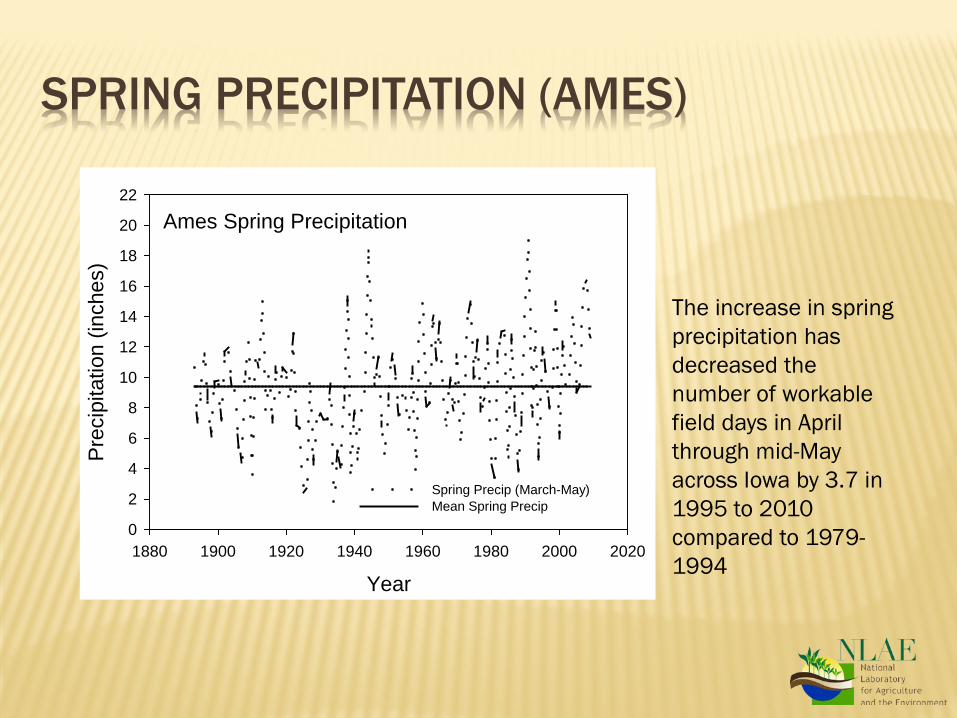
SPRING PRECIPITATION (AMES)
Ames Spring Precipitation
Year1880 1900 1920 1940 1960 1980 2000 2020
Pre
cipi
tatio
n (in
ches
)
0
2
4
6
8
10
12
14
16
18
20
22
Spring Precip (March-May)Mean Spring Precip
The increase in spring precipitation has decreased the number of workable field days in April through mid-May across Iowa by 3.7 in 1995 to 2010 compared to 1979-1994
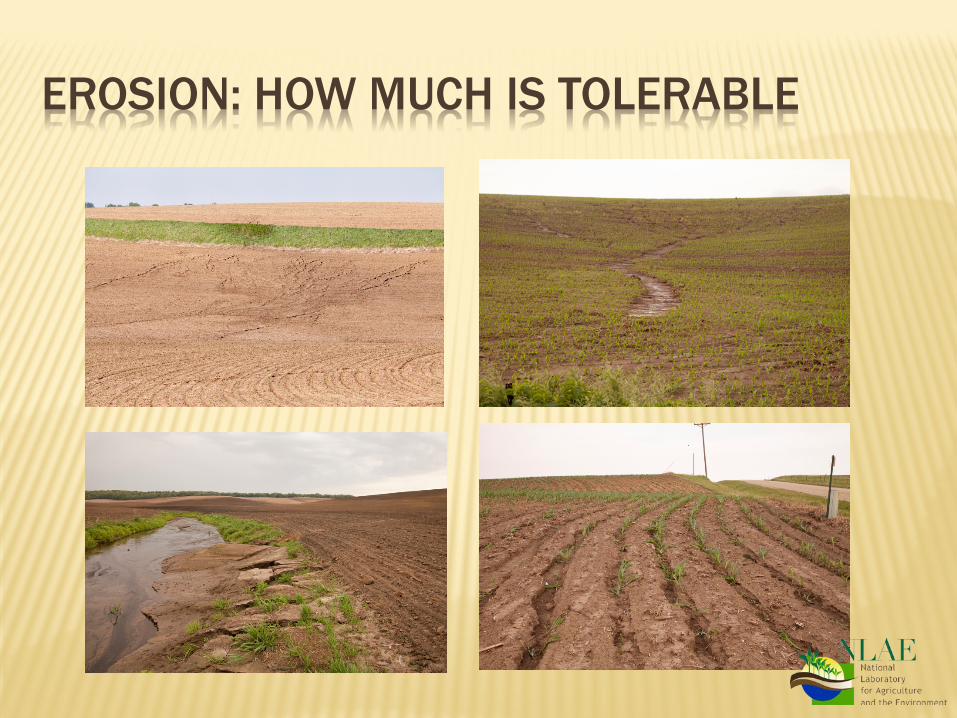
EROSION: HOW MUCH IS TOLERABLE
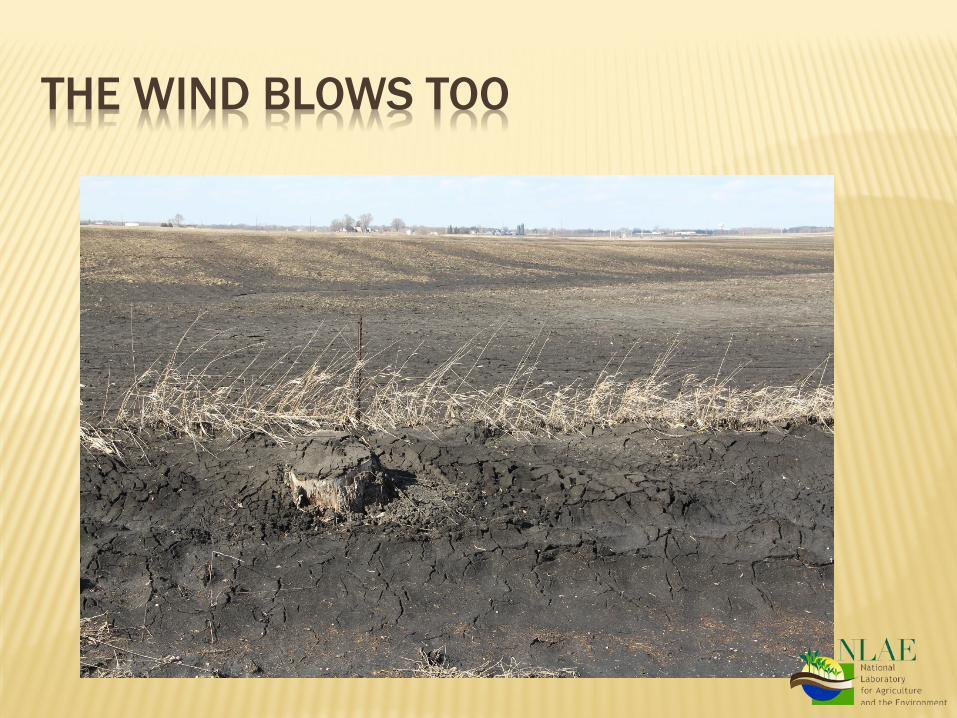
THE WIND BLOWS TOO
Wet Spring Hot Summer
Wet Spring Cool Summer
Dry Spring Cool Summer
Dry Spring Hot Summer
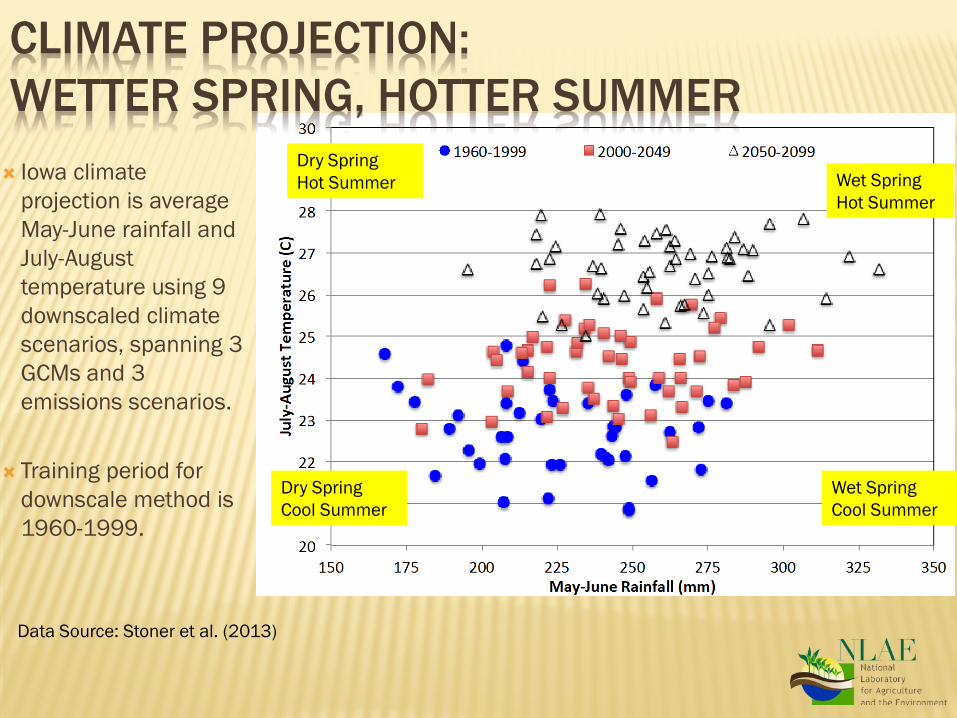
CLIMATE PROJECTION: WETTER SPRING, HOTTER SUMMER Iowa climate
projection is average May-June rainfall and July-August temperature using 9 downscaled climate scenarios, spanning 3 GCMs and 3 emissions scenarios.
Training period for downscale method is 1960-1999.
Data Source: Stoner et al. (2013)
QUESTION
How is agriculture going to cope with the increasing variability in the within season weather and trends toward a warmer climate with shifting seasonality in precipitation?
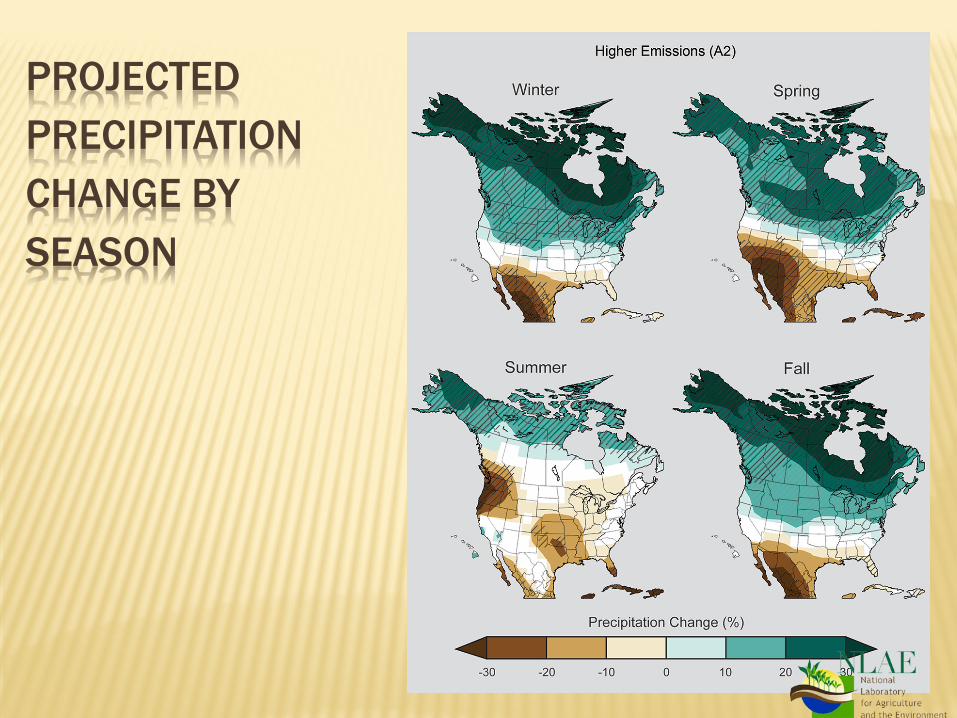
PROJECTED PRECIPITATION CHANGE BY SEASON
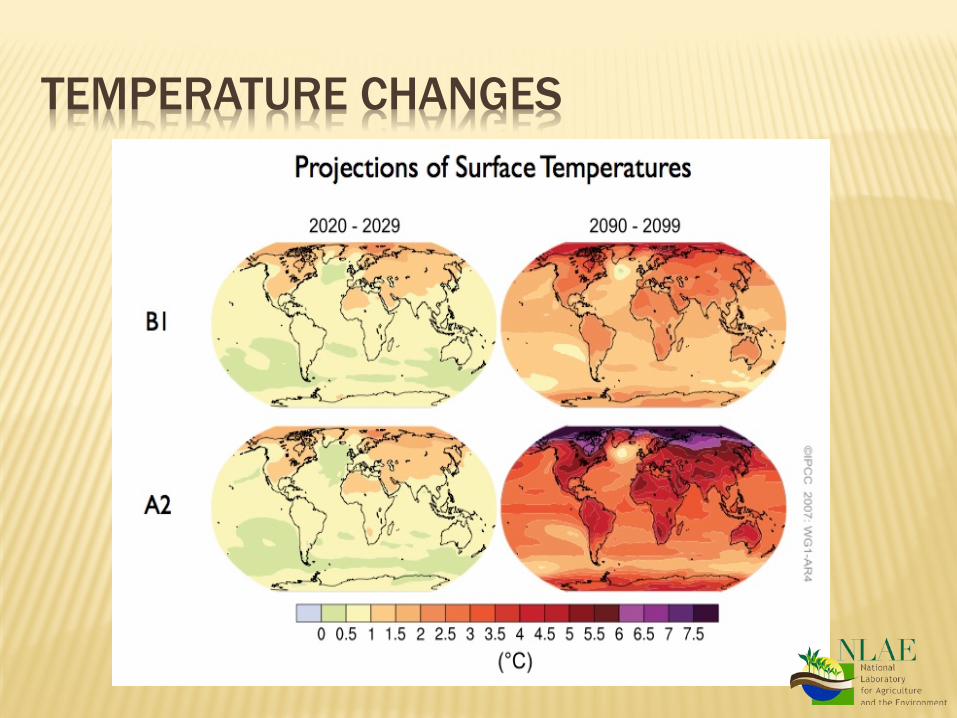
TEMPERATURE CHANGES
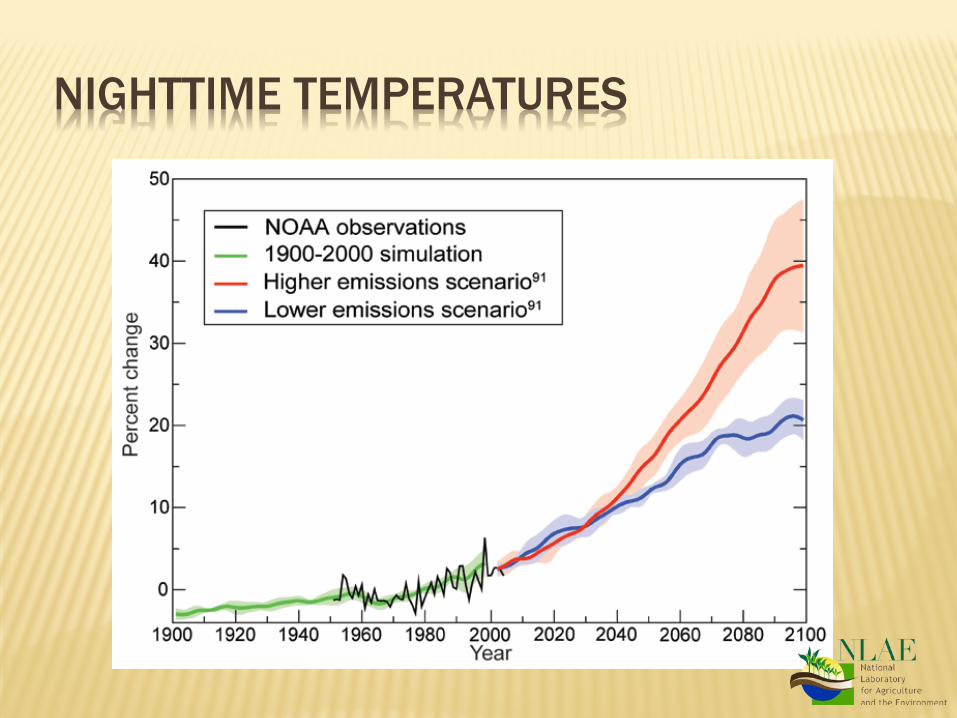
NIGHTTIME TEMPERATURES
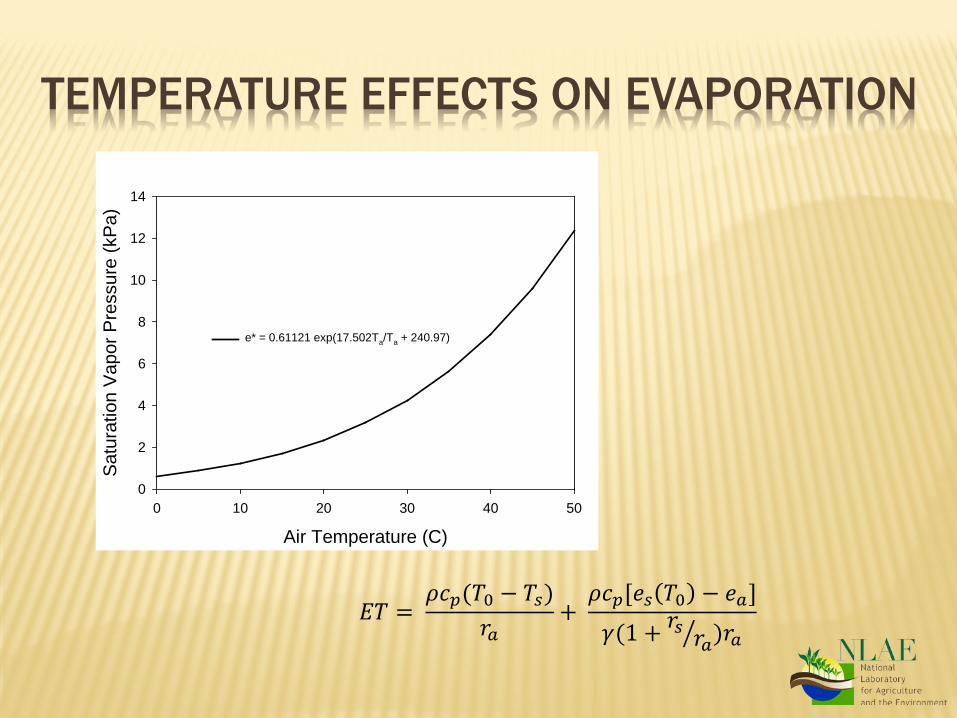
TEMPERATURE EFFECTS ON EVAPORATION
Air Temperature (C)0 10 20 30 40 50
Sat
urat
ion
Vap
or P
ress
ure
(kP
a)
0
2
4
6
8
10
12
14
e* = 0.61121 exp(17.502Ta/Ta + 240.97)
𝐸𝐸𝐸𝐸 = 𝜌𝜌𝑐𝑐𝑝𝑝(𝐸𝐸0 − 𝐸𝐸𝑠𝑠)
𝑟𝑟𝑎𝑎+ 𝜌𝜌𝑐𝑐𝑝𝑝[𝑒𝑒𝑠𝑠 𝐸𝐸0 − 𝑒𝑒𝑎𝑎]𝛾𝛾(1 + 𝑟𝑟𝑠𝑠 𝑟𝑟𝑎𝑎� )𝑟𝑟𝑎𝑎
WHAT DOES ALL OF THIS MEAN TO THE PRODUCER?
Begin to consider all aspects of the crop production system as an integrated set of components
Utilize the following examples as guides
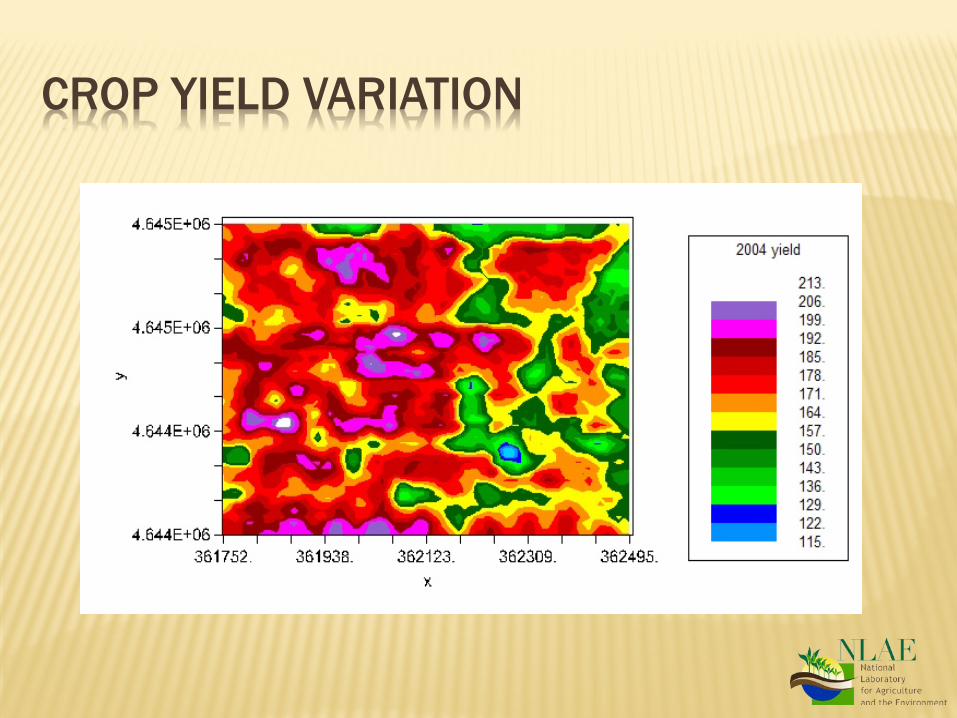
CROP YIELD VARIATION
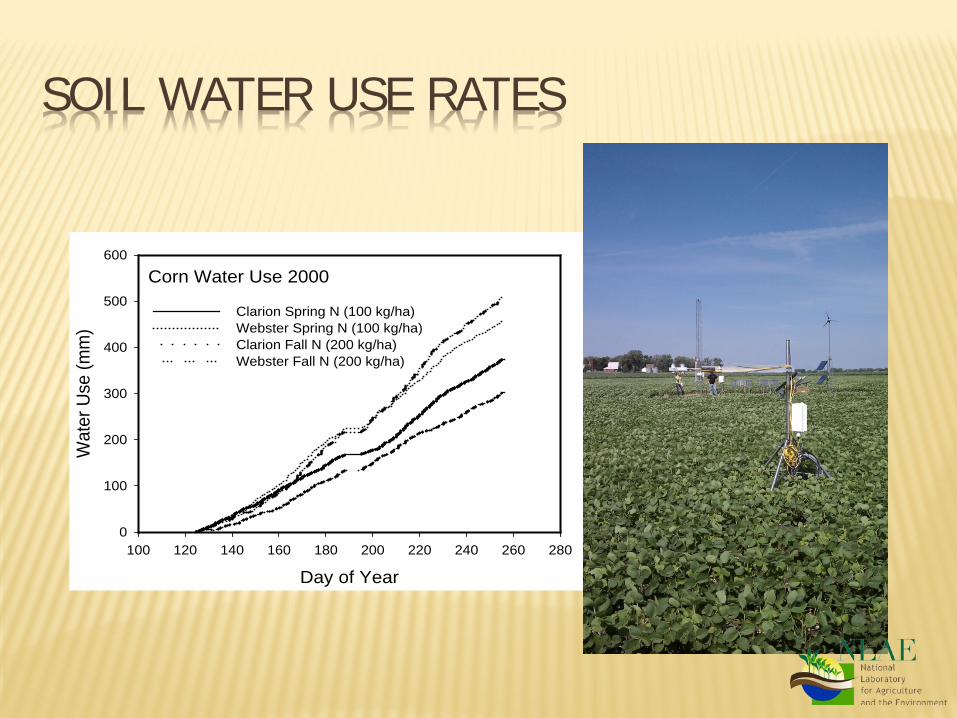
SOIL WATER USE RATES
Corn Water Use 2000
Day of Year100 120 140 160 180 200 220 240 260 280
Wat
er U
se (m
m)
0
100
200
300
400
500
600
Clarion Spring N (100 kg/ha) Webster Spring N (100 kg/ha)Clarion Fall N (200 kg/ha)Webster Fall N (200 kg/ha)
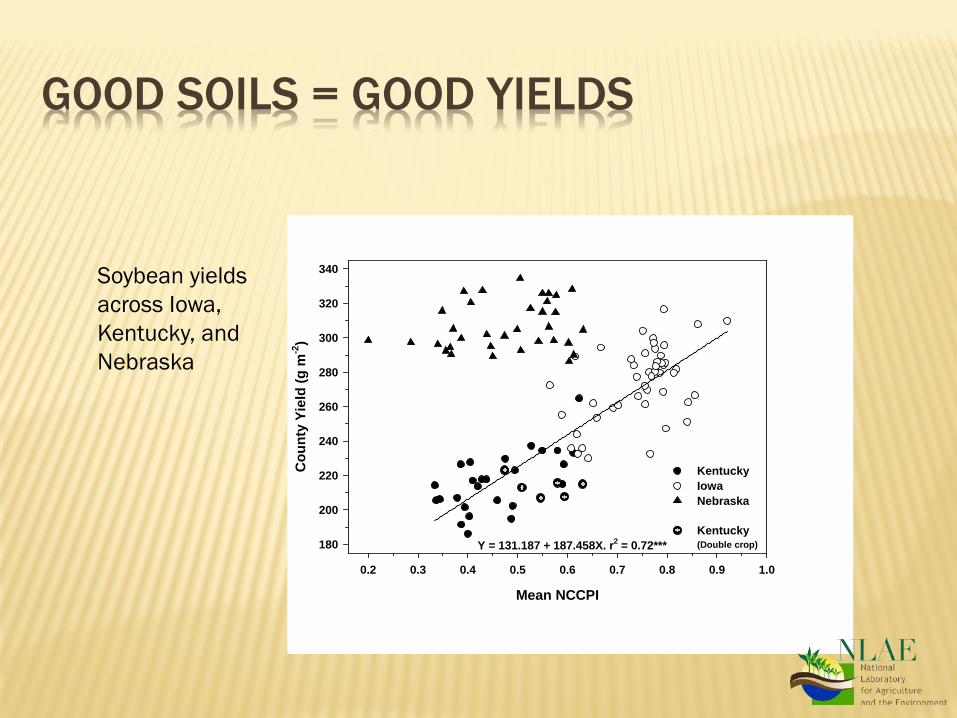
GOOD SOILS = GOOD YIELDS
Mean NCCPI
0.2 0.3 0.4 0.5 0.6 0.7 0.8 0.9 1.0
Cou
nty
Yiel
d (g
m-2
)
180
200
220
240
260
280
300
320
340
KentuckyIowaNebraska
Kentucky(Double crop)Y = 131.187 + 187.458X. r2 = 0.72***
Soybean yields across Iowa, Kentucky, and Nebraska
NCCPI-AG
0.4 0.6 0.8 1.0
Mea
n C
ount
y Yi
eld
(g m
-2)
500
600
700
800
900
1000
KentuckyIowa
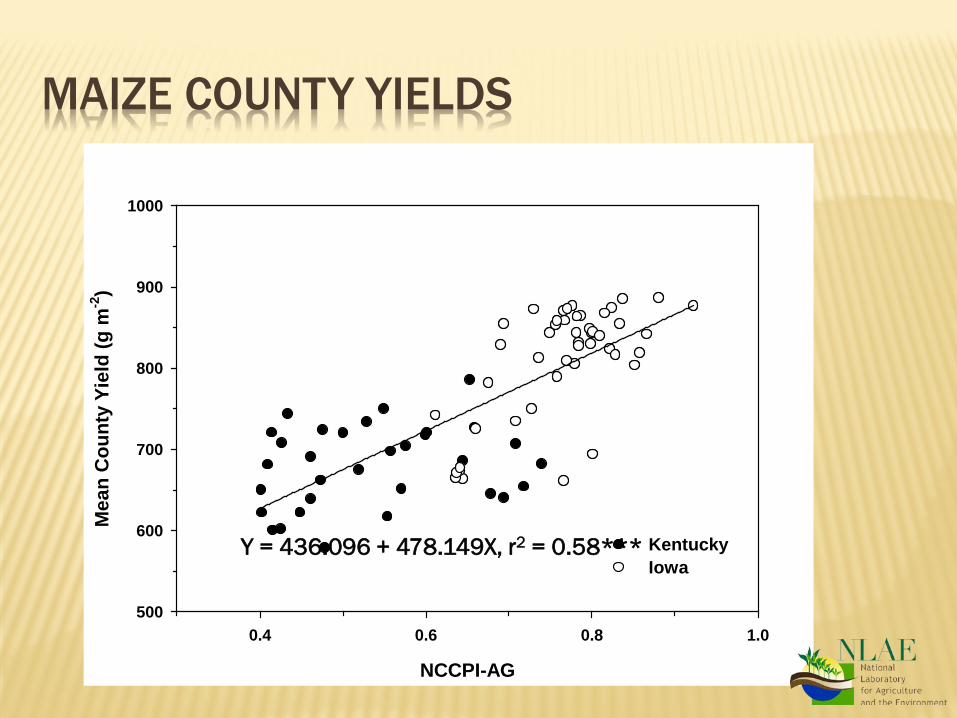
Y = 436.096 + 478.149X, r2 = 0.58***
MAIZE COUNTY YIELDS
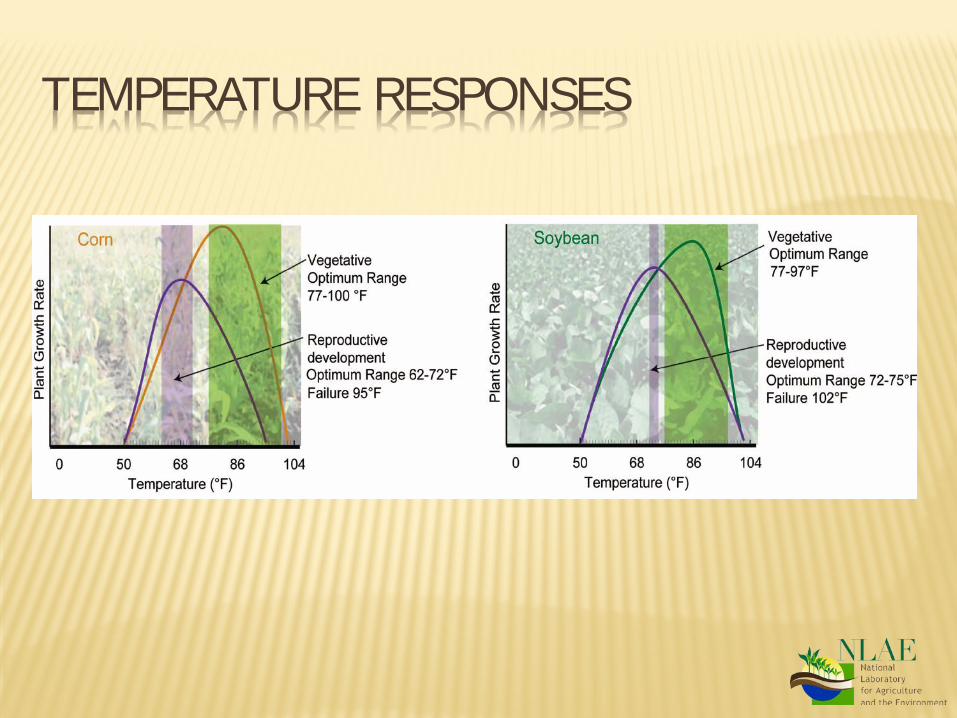
TEMPERATURE RESPONSES
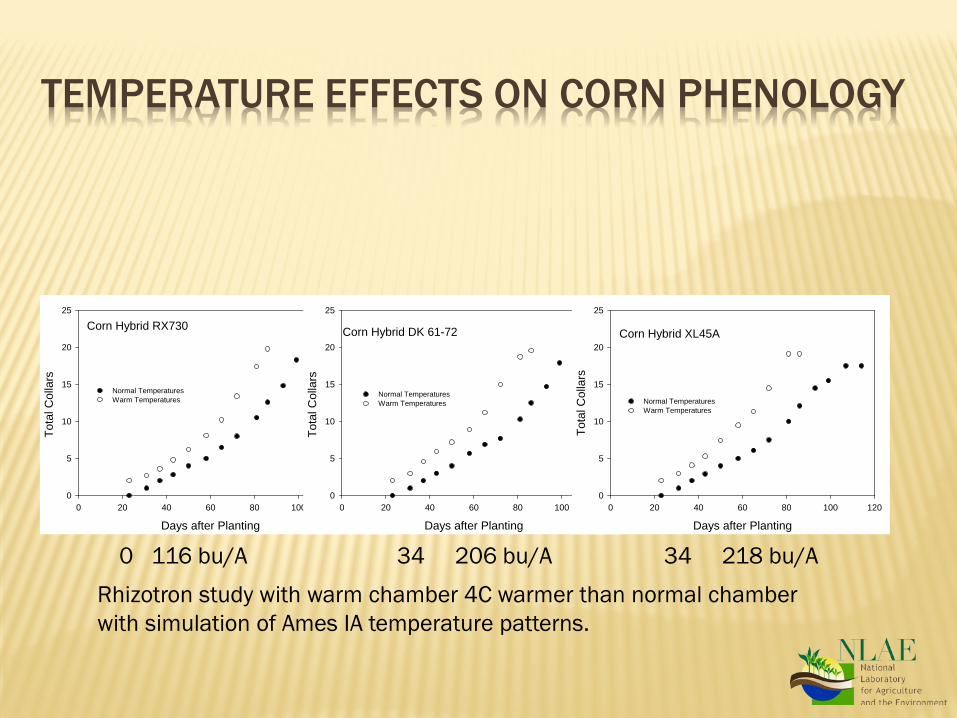
TEMPERATURE EFFECTS ON CORN PHENOLOGY
Corn Hybrid RX730
Days after Planting0 20 40 60 80 100 120
Tota
l Col
lars
0
5
10
15
20
25
Normal TemperaturesWarm Temperatures
Corn Hybrid DK 61-72
Days after Planting0 20 40 60 80 100 120
Tota
l Col
lars
0
5
10
15
20
25
Normal TemperaturesWarm Temperatures
Corn Hybrid XL45A
Days after Planting0 20 40 60 80 100 120
Tota
l Col
lars
0
5
10
15
20
25
Normal TemperaturesWarm Temperatures
Rhizotron study with warm chamber 4C warmer than normal chamber with simulation of Ames IA temperature patterns.
0 116 bu/A 34 206 bu/A 34 218 bu/A
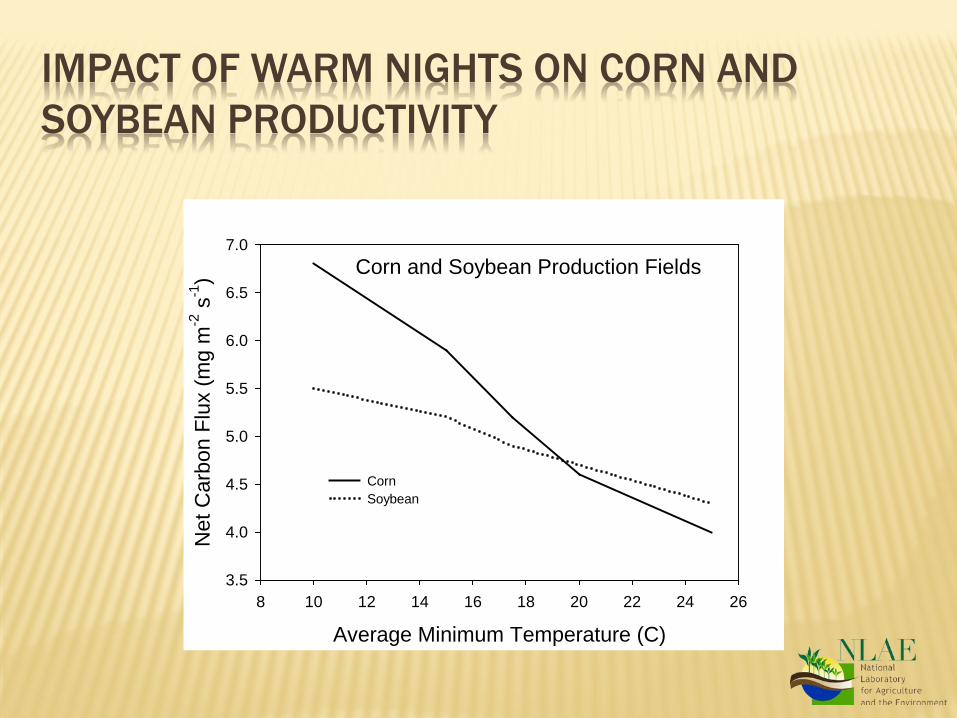
IMPACT OF WARM NIGHTS ON CORN AND SOYBEAN PRODUCTIVITY
Corn and Soybean Production Fields
Average Minimum Temperature (C)8 10 12 14 16 18 20 22 24 26
Net
Car
bon
Flux
(mg
m-2
s-1
)
3.5
4.0
4.5
5.0
5.5
6.0
6.5
7.0
Corn Soybean
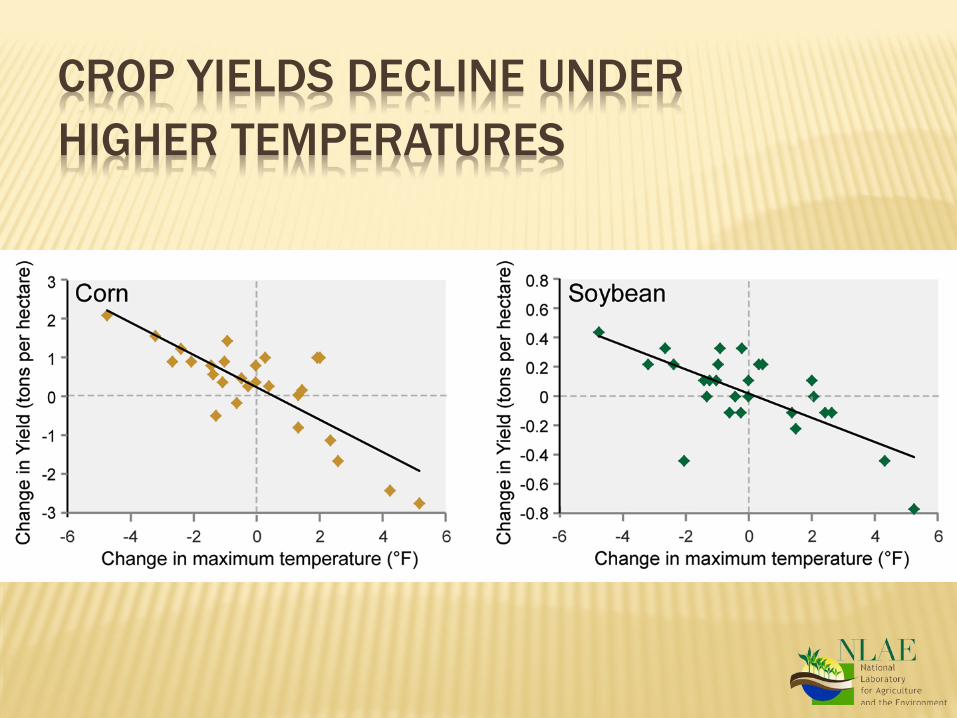
CROP YIELDS DECLINE UNDER HIGHER TEMPERATURES
APPLICATION OF THESE RESULTS
Producers will not deal with a single climate factor, exposed to all factors, temperature, precipitation, carbon dioxide, solar radiation
What is in the producers control? Concept that we must begin the process of
understanding agriculture systems as the interactions of genetics, environment and management.
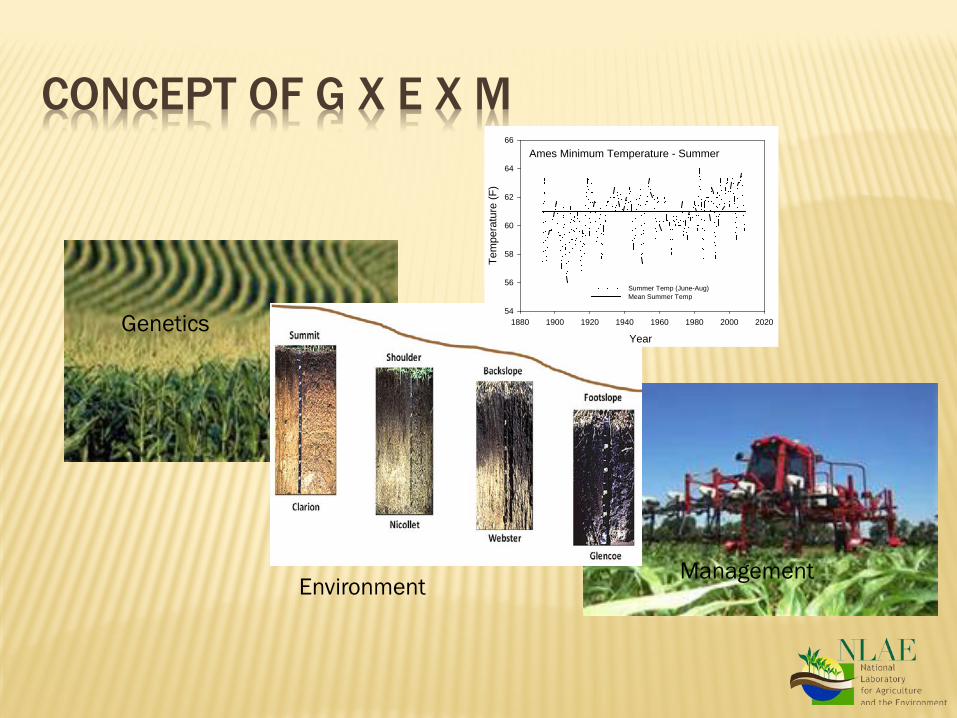
CONCEPT OF G X E X M
Genetics
Environment Management
Ames Minimum Temperature - Summer
Year 1880 1900 1920 1940 1960 1980 2000 2020
Tem
pera
ture
(F)
54
56
58
60
62
64
66
Summer Temp (June-Aug)Mean Summer Temp
FOUNDATION OF CLIMATE RESILIENCE FOR AGRICULTURE IS BASED ON:
Soil and soil water availability Yield variation within fields and among years is
due to soil water availability which exaggerates the temperature effect.
Soil water increases the ability of the crop to utilize nutrients
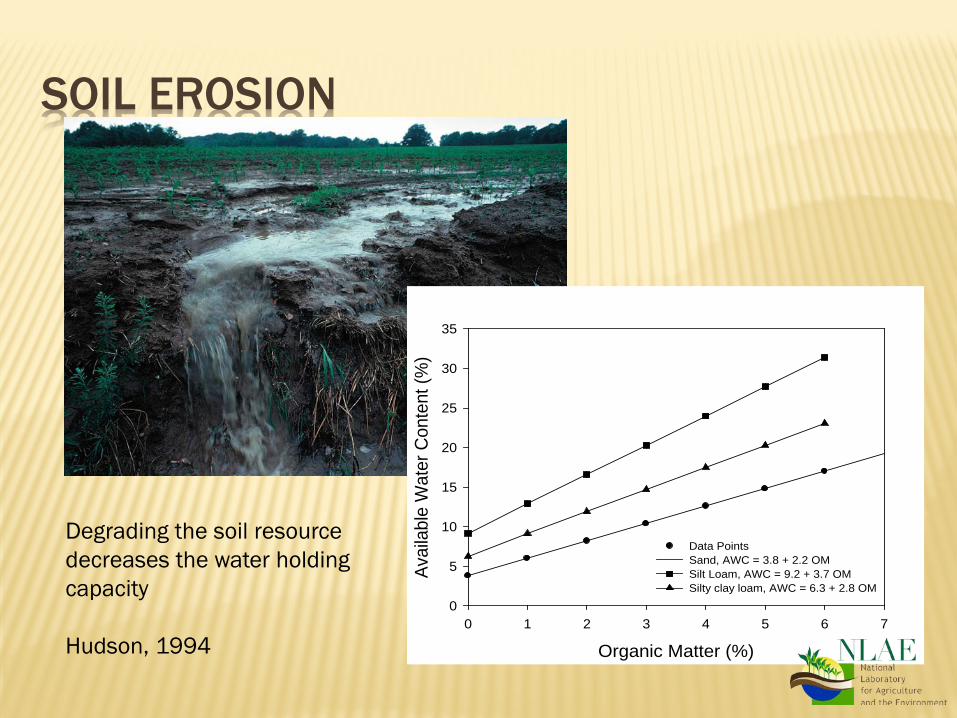
SOIL EROSION
Organic Matter (%)0 1 2 3 4 5 6 7
Avai
labl
e W
ater
Con
tent
(%)
0
5
10
15
20
25
30
35
Data Points Sand, AWC = 3.8 + 2.2 OMSilt Loam, AWC = 9.2 + 3.7 OMSilty clay loam, AWC = 6.3 + 2.8 OM
Degrading the soil resource decreases the water holding capacity Hudson, 1994
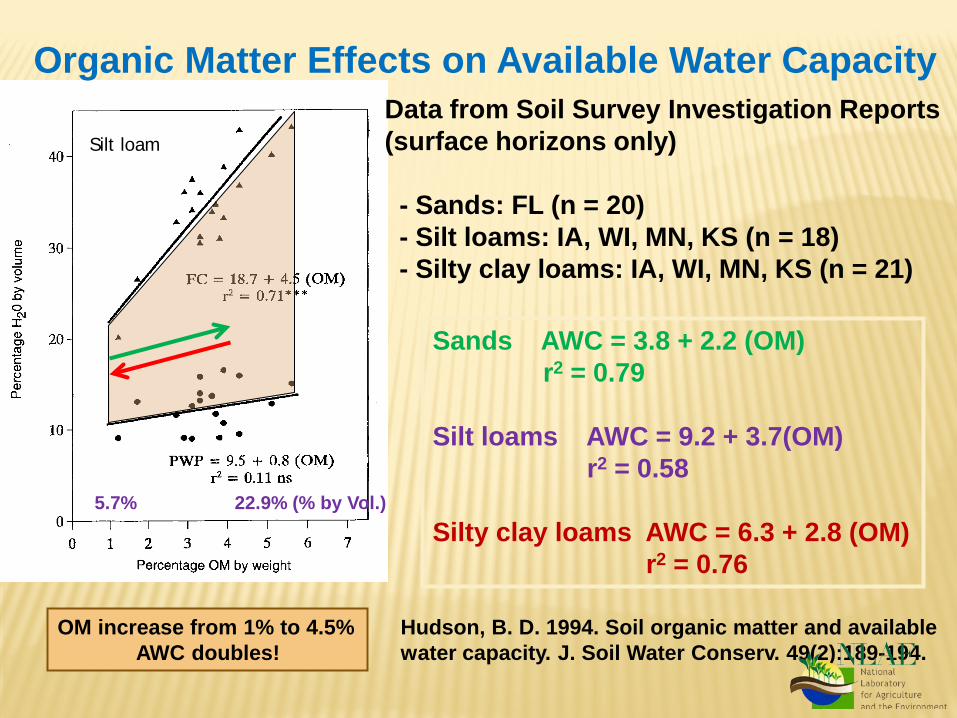
Organic Matter Effects on Available Water Capacity
Silt loam
OM increase from 1% to 4.5% AWC doubles!
5.7% 22.9% (% by Vol.)
Data from Soil Survey Investigation Reports (surface horizons only) - Sands: FL (n = 20) - Silt loams: IA, WI, MN, KS (n = 18) - Silty clay loams: IA, WI, MN, KS (n = 21)
Sands AWC = 3.8 + 2.2 (OM) r2 = 0.79 Silt loams AWC = 9.2 + 3.7(OM) r2 = 0.58 Silty clay loams AWC = 6.3 + 2.8 (OM) r2 = 0.76
Hudson, B. D. 1994. Soil organic matter and available water capacity. J. Soil Water Conserv. 49(2):189-194.
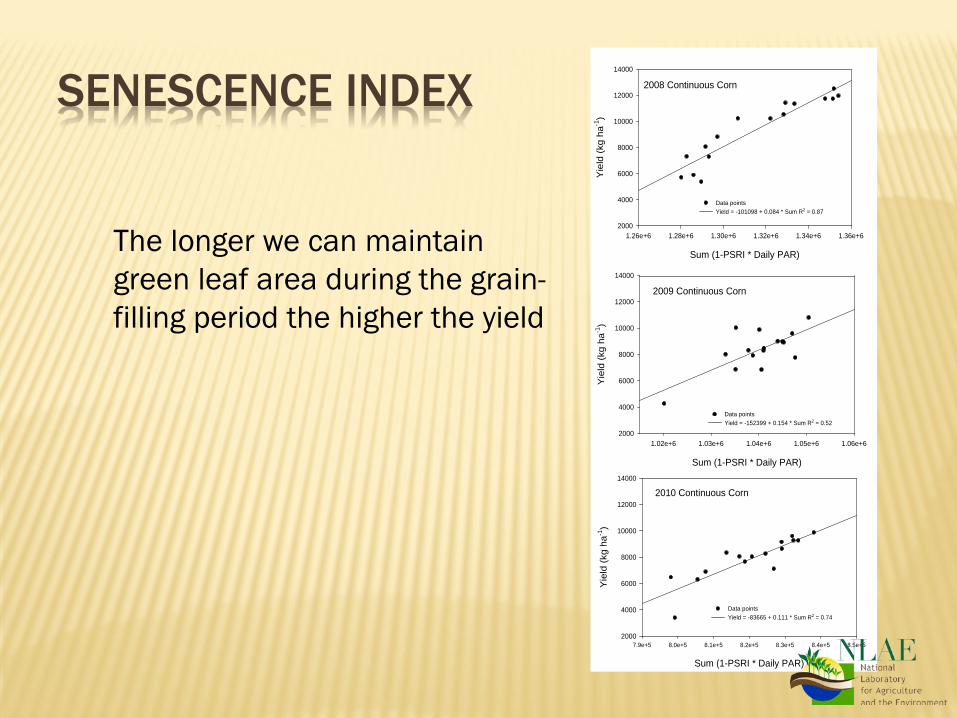
SENESCENCE INDEX 2008 Continuous Corn
Sum (1-PSRI * Daily PAR)
1.26e+6 1.28e+6 1.30e+6 1.32e+6 1.34e+6 1.36e+6
Yie
ld (k
g ha
-1)
2000
4000
6000
8000
10000
12000
14000
Data points Yield = -101098 + 0.084 * Sum R2 = 0.87
2009 Continuous Corn
Sum (1-PSRI * Daily PAR)
1.02e+6 1.03e+6 1.04e+6 1.05e+6 1.06e+6
Yie
ld (k
g ha
-1)
2000
4000
6000
8000
10000
12000
14000
Data points Yield = -152399 + 0.154 * Sum R2 = 0.52
2010 Continuous Corn
Sum (1-PSRI * Daily PAR)
7.9e+5 8.0e+5 8.1e+5 8.2e+5 8.3e+5 8.4e+5 8.5e+5
Yie
ld (k
g ha
-1)
2000
4000
6000
8000
10000
12000
14000
Data points Yield = -83665 + 0.111 * Sum R2 = 0.74
The longer we can maintain green leaf area during the grain-filling period the higher the yield
CONSERVATION AGRICULTURE BENEFITS
Short-term Reduce soil water
evaporation Increase infiltration of
rainfall or irrigation events
Reduce the overall of evapotranspiration rate if plants are grown in standing stubble
Long-term Increase the soil water
holding capacity through improved organic matter content
Increase water availability to the crop
Increase rooting depth
CLIMATE RESILIENCE
Will have to rely on capturing, storing, and making available maximum amount of soil water to the crop during the growing season
Implement cropping system which increase the organic matter content of the soil and reduce erosion under the shifting precipitation patterns

CLIMATE FACTORS
Inputs Temperature Precipitation Solar radiation Carbon dioxide
Direct Growth Phenology Yield
Indirect Insects Diseases Weeds
Soil is the underlying factor as a resource for nutrients and water
GOOD NEWS
You can’t control the weather but you can manage the soil and management inputs to increase climate resilience
Aggressive soil management to improve organic matter (soil water storage and infiltration rates) will pay dividends in improved yield stability and water and nutrient use efficiency
IMPROVED SOIL MANAGEMENT PRACTICES COULD BE IMPLEMENTED ON MY FARM BY: Decreasing tillage Increasing the retention of crop residue Adding cover crops to provide for more
ground cover and residue Changing a crop rotation to diversify crops I am not convinced any of these can work on
my farm