climate change adaptation from start to finish: the case ... uno/adaptation... · climate change...
TRANSCRIPT
Climate change adaptation from start to finish: The case for Colombia
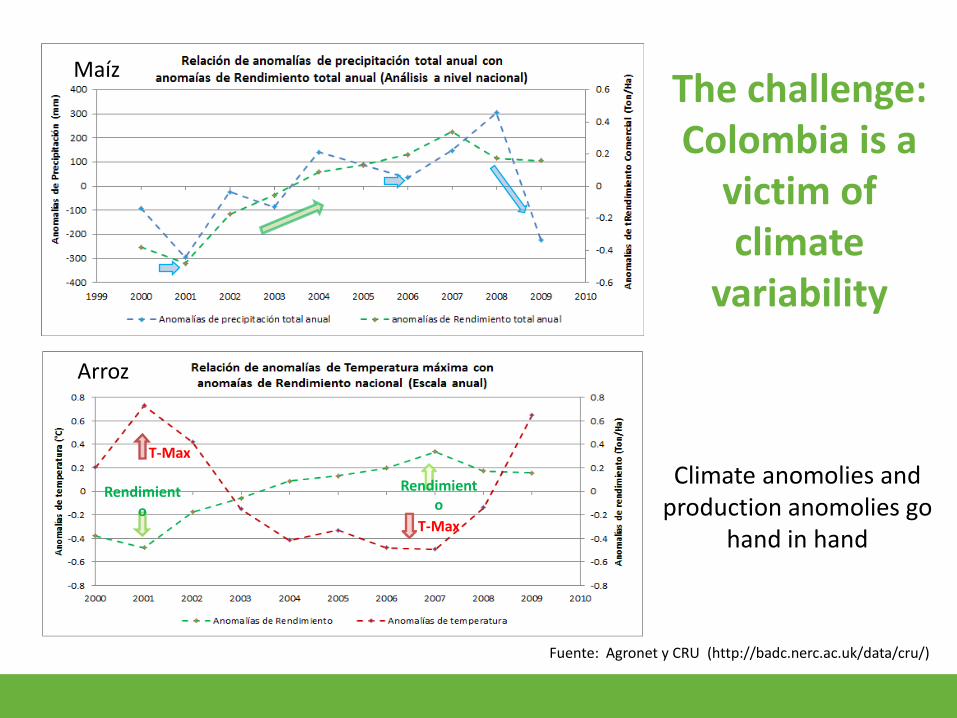
Climate anomolies and production anomolies go
hand in hand
Fuente: Agronet y CRU (http://badc.nerc.ac.uk/data/cru/)
The challenge: Colombia is a
victim of climate
variability
Maíz
T-Max
T-Max
Rendimiento
Rendimiento
Arroz
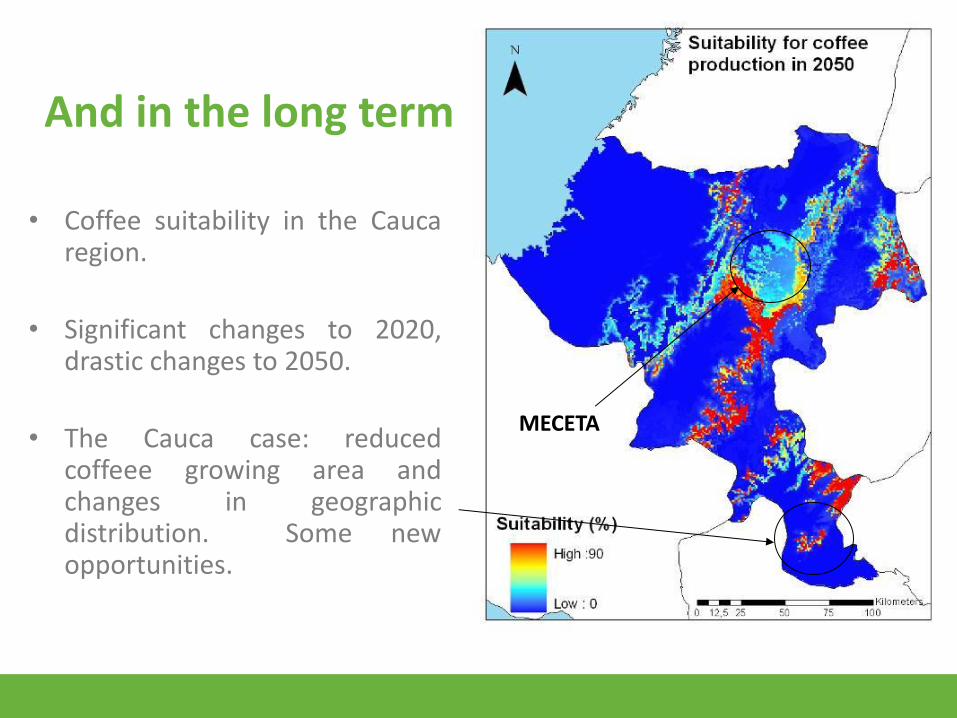
And in the long term
• Coffee suitability in the Cauca region.
• Significant changes to 2020, drastic changes to 2050.
• The Cauca case: reduced coffeee growing area and changes in geographic distribution. Some new opportunities.
MECETA
Diagnose the problem
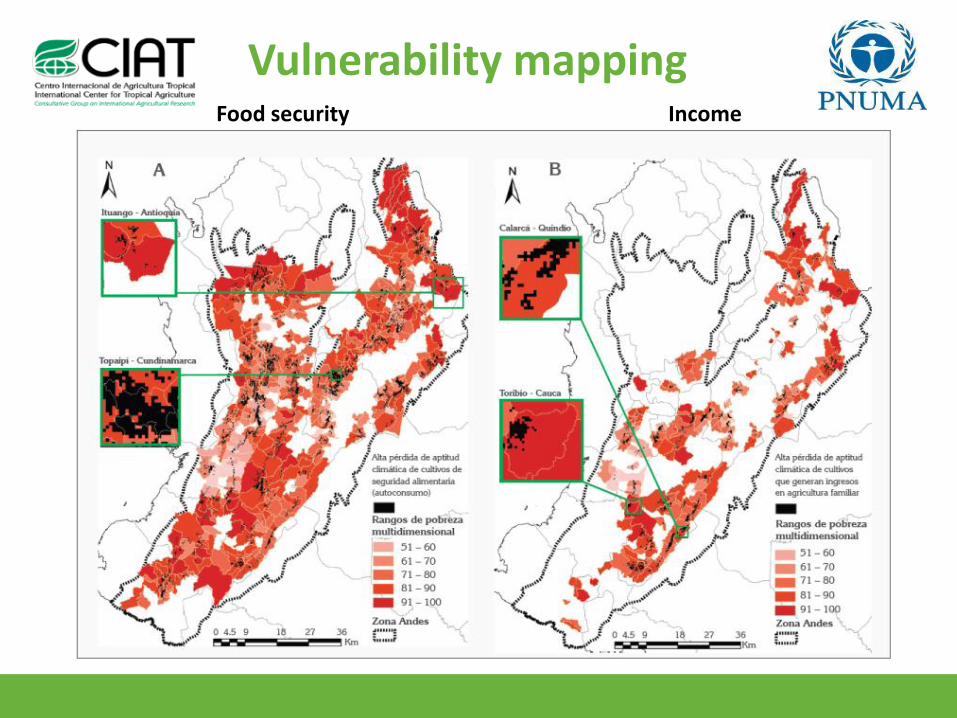
Vulnerability mapping Food security Income
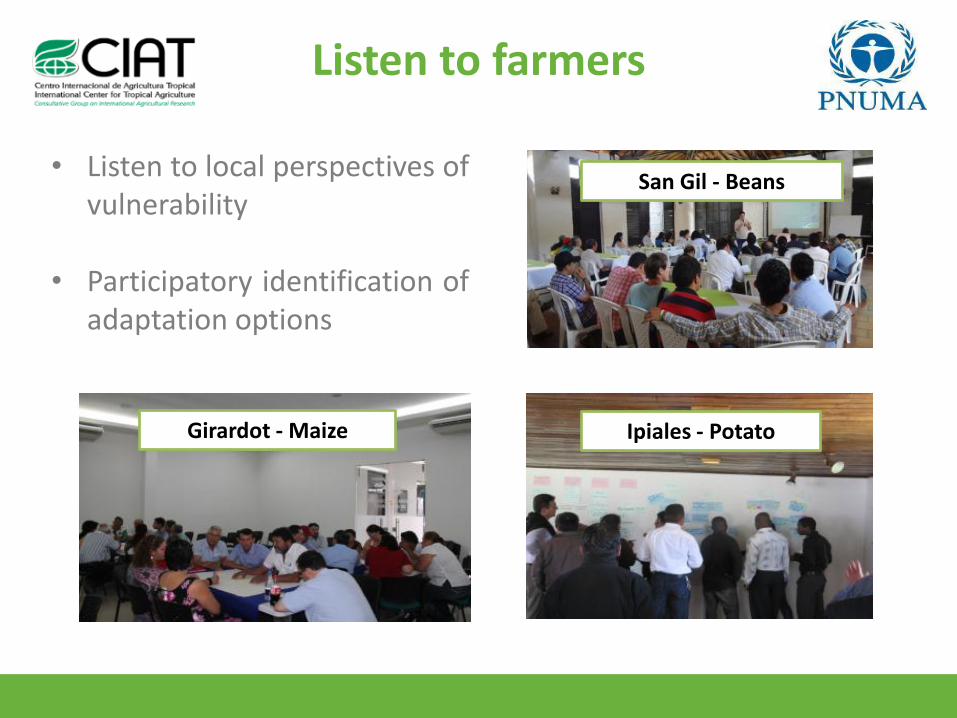
Listen to farmers
• Listen to local perspectives of vulnerability
• Participatory identification of
adaptation options
Girardot - Maize
San Gil - Beans
Ipiales - Potato
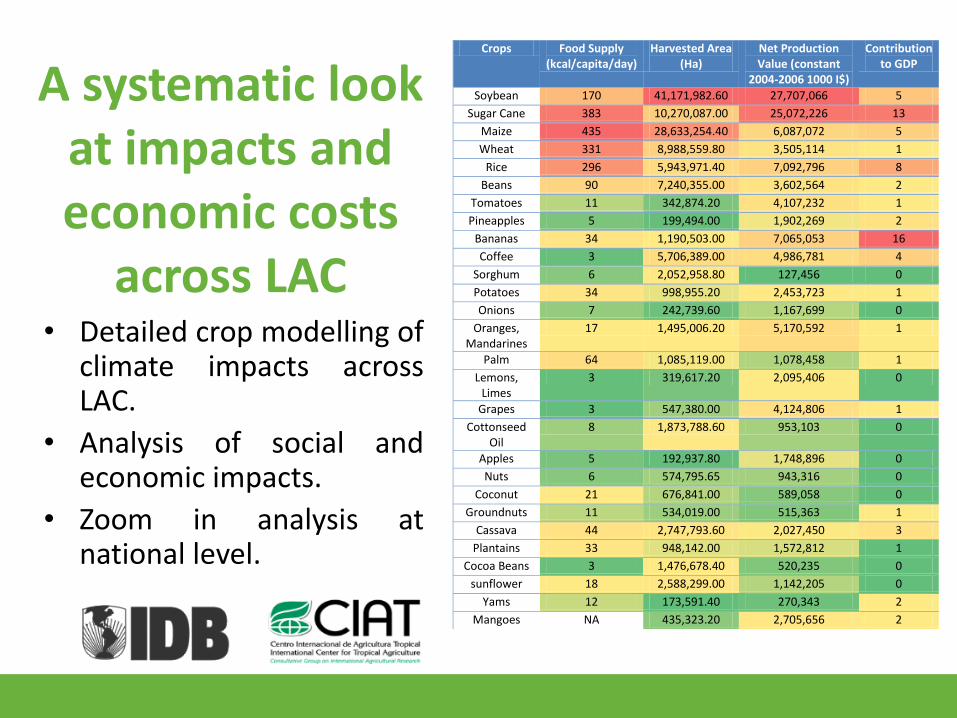
A systematic look at impacts and economic costs
across LAC • Detailed crop modelling of
climate impacts across LAC.
• Analysis of social and economic impacts.
• Zoom in analysis at national level.
Crops Food Supply (kcal/capita/day)
Harvested Area (Ha)
Net Production Value (constant
2004-2006 1000 I$)
Contribution to GDP
DSSAT model?
IMPACT? Regional Importance
Soybean 170 41,171,982.60 27,707,066 5 y mixed y
Sugar Cane 383 10,270,087.00 25,072,226 13 n y y
Maize 435 28,633,254.40 6,087,072 5 y y y
Wheat 331 8,988,559.80 3,505,114 1 y y n
Rice 296 5,943,971.40 7,092,796 8 y y y
Beans 90 7,240,355.00 3,602,564 2 y mixed y
Tomatoes 11 342,874.20 4,107,232 1 n n y
Pineapples 5 199,494.00 1,902,269 2 n n y
Bananas 34 1,190,503.00 7,065,053 16 n mixed y
Coffee 3 5,706,389.00 4,986,781 4 n n y
Sorghum 6 2,052,958.80 127,456 0 y y y
Potatoes 34 998,955.20 2,453,723 1 y y y
Onions 7 242,739.60 1,167,699 0 n n y
Oranges, Mandarines
17 1,495,006.20 5,170,592 1 n n y
Palm 64 1,085,119.00 1,078,458 1 n mixed n
Lemons, Limes
3 319,617.20 2,095,406 0 n n y
Grapes 3 547,380.00 4,124,806 1 n n n
Cottonseed Oil
8 1,873,788.60 953,103 0 n mixed n
Apples 5 192,937.80 1,748,896 0 n n n
Nuts 6 574,795.65 943,316 0 n n n
Coconut 21 676,841.00 589,058 0 n n n
Groundnuts 11 534,019.00 515,363 1 y mixed n
Cassava 44 2,747,793.60 2,027,450 3 n y y
Plantains 33 948,142.00 1,572,812 1 n mixed y
Cocoa Beans 3 1,476,678.40 520,235 0 n n n
sunflower 18 2,588,299.00 1,142,205 0 n n n
Yams 12 173,591.40 270,343 2 n n n
Mangoes NA 435,323.20 2,705,656 2 n n n
Prioritise
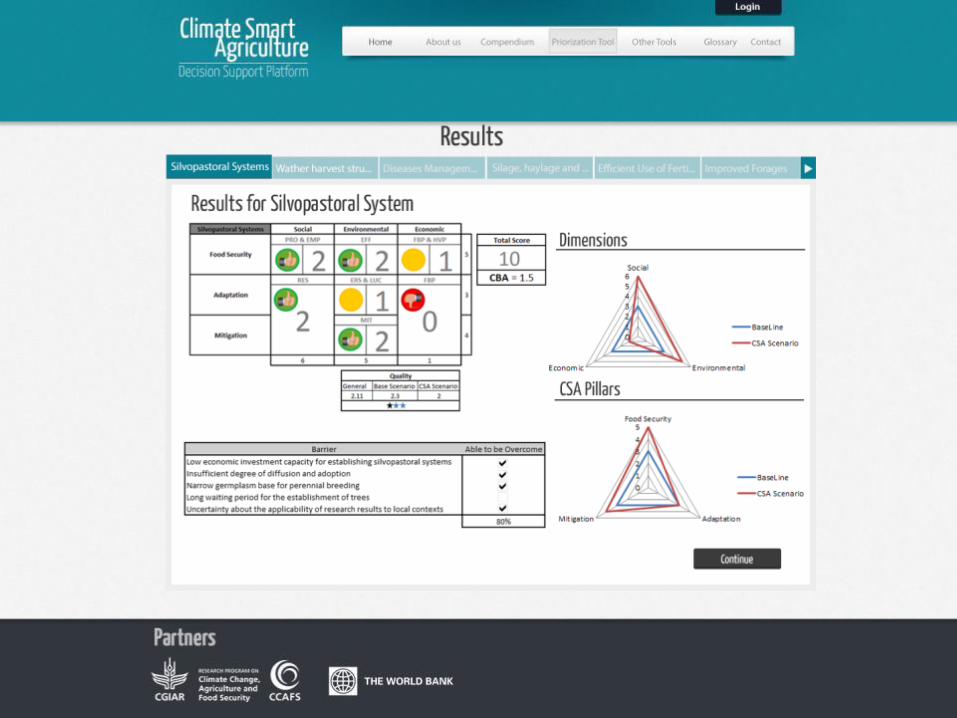
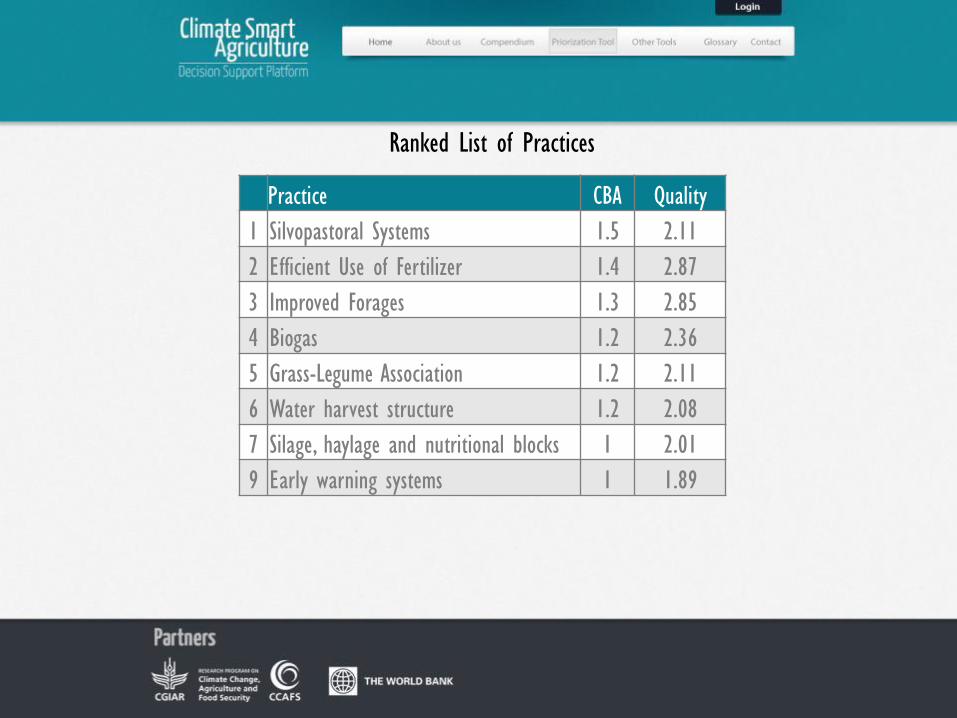
Practice CBA Quality
1 Silvopastoral Systems 1.5 2.11
2 Efficient Use of Fertilizer 1.4 2.87
3 Improved Forages 1.3 2.85
4 Biogas 1.2 2.36
5 Grass-Legume Association 1.2 2.11
6 Water harvest structure 1.2 2.08
7 Silage, haylage and nutritional blocks 1 2.01
9 Early warning systems 1 1.89
Ranked List of Practices
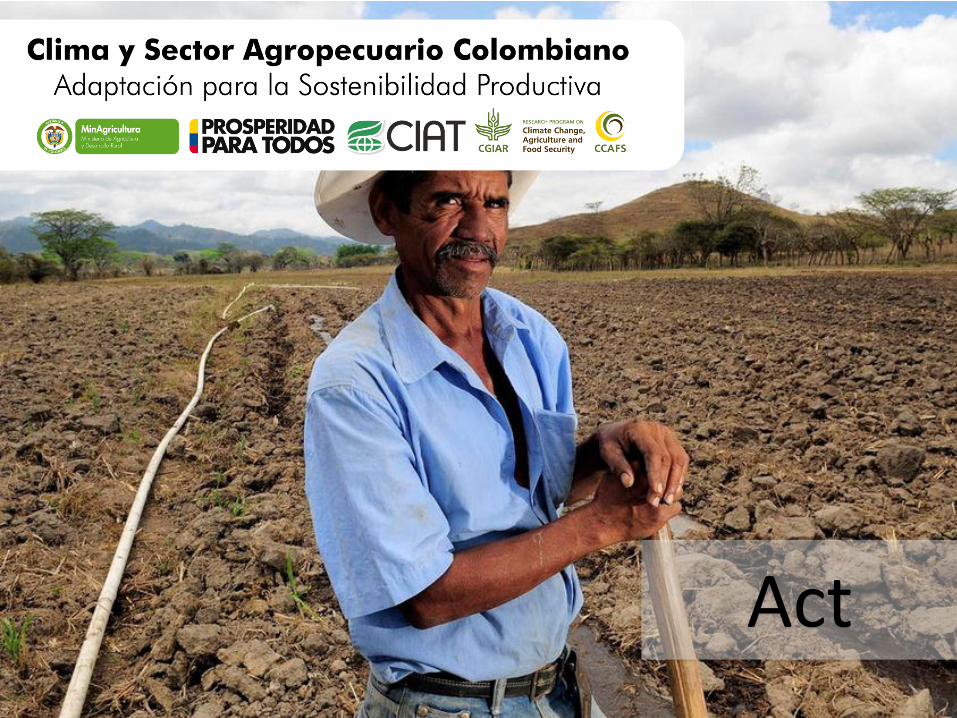
Act
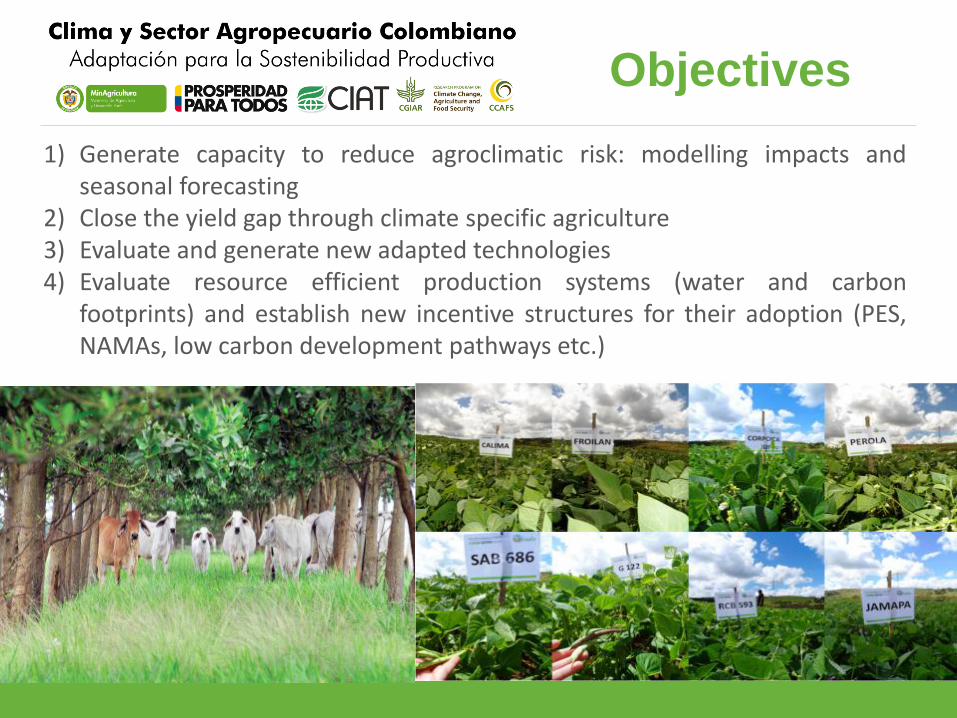
Objectives
1) Generate capacity to reduce agroclimatic risk: modelling impacts and seasonal forecasting
2) Close the yield gap through climate specific agriculture 3) Evaluate and generate new adapted technologies 4) Evaluate resource efficient production systems (water and carbon
footprints) and establish new incentive structures for their adoption (PES, NAMAs, low carbon development pathways etc.)
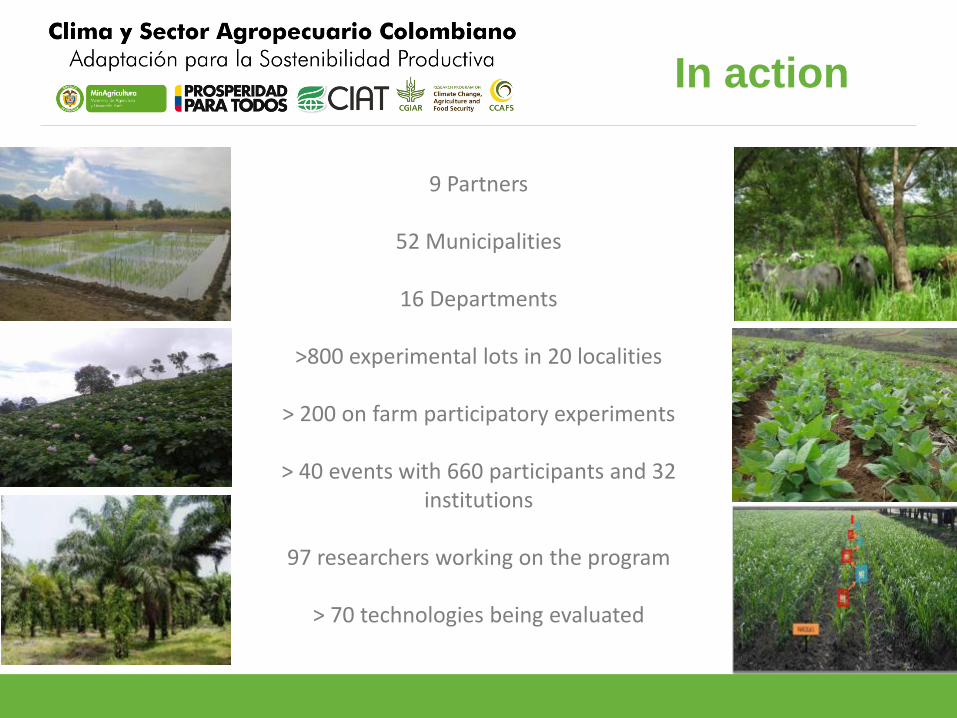
In action
9 Partners
52 Municipalities
16 Departments
>800 experimental lots in 20 localities
> 200 on farm participatory experiments
> 40 events with 660 participants and 32 institutions
97 researchers working on the program
> 70 technologies being evaluated
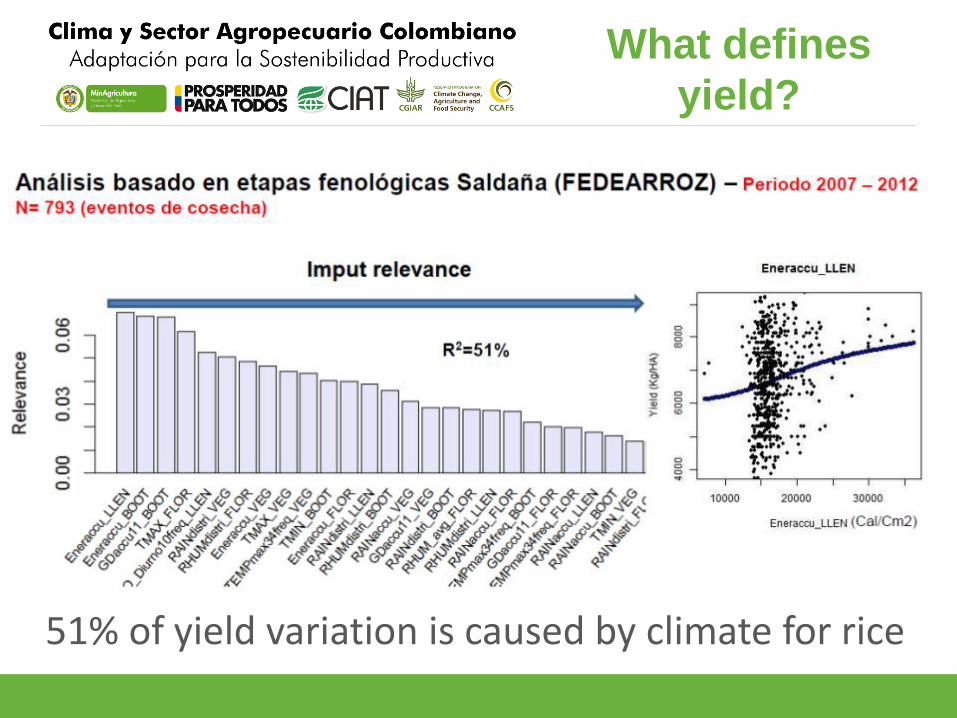
What defines
yield?
51% of yield variation is caused by climate for rice
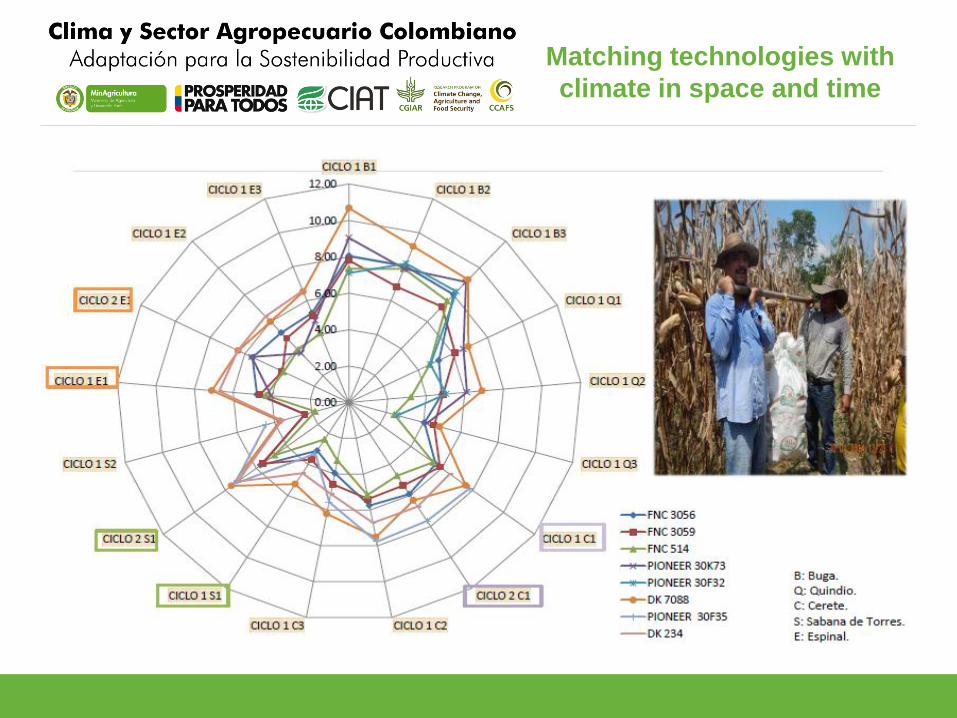
Matching technologies with
climate in space and time
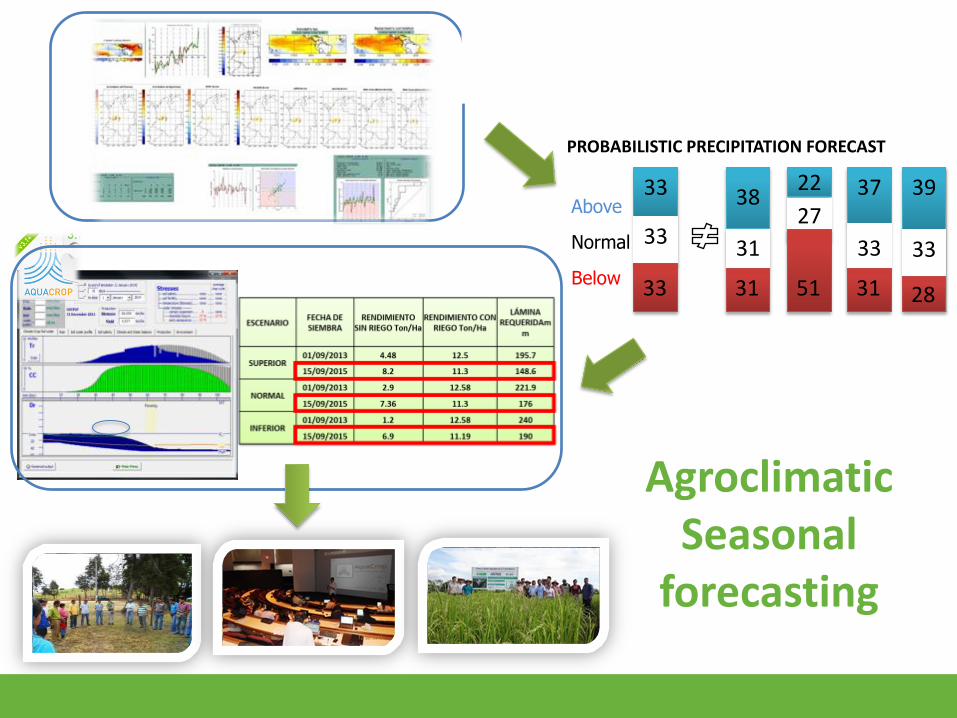
PROBABILISTIC PRECIPITATION FORECAST
33
33
33
Above
Normal
Below
38
31
31
22
27
51
37
33
31
39
33
28
Agroclimatic Seasonal
forecasting
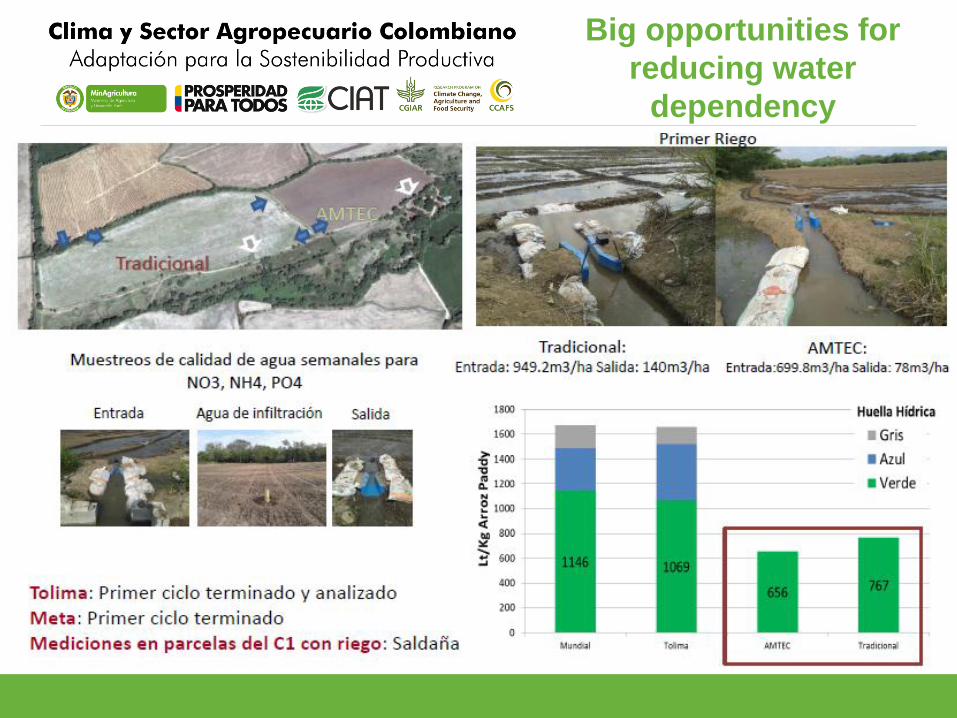
Big opportunities for
reducing water
dependency
Global learning
Leb by
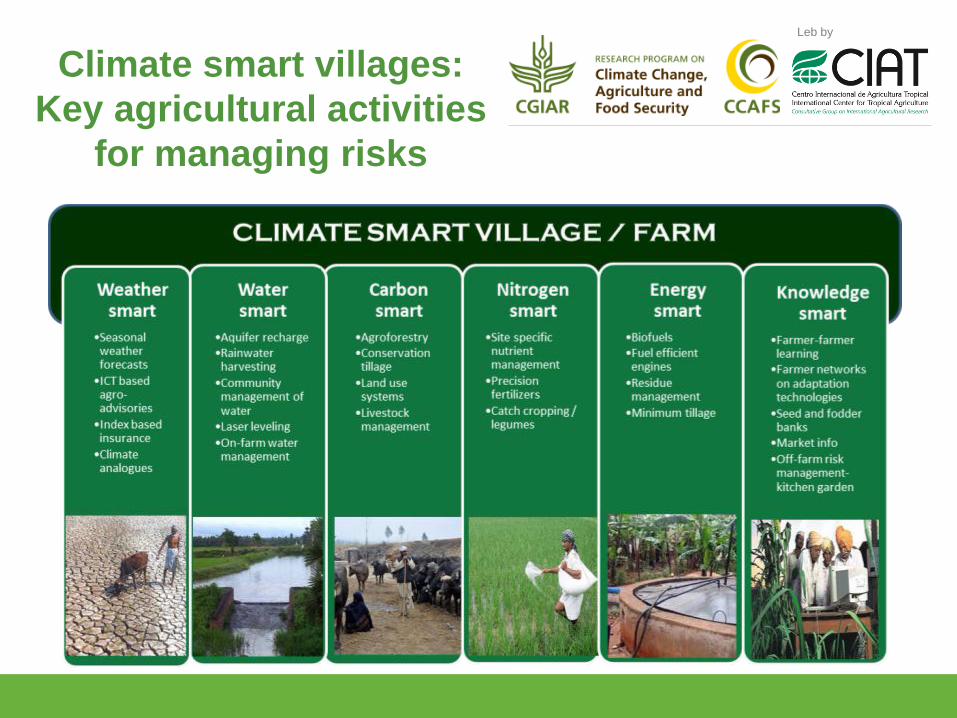
Climate smart villages:
Key agricultural activities
for managing risks
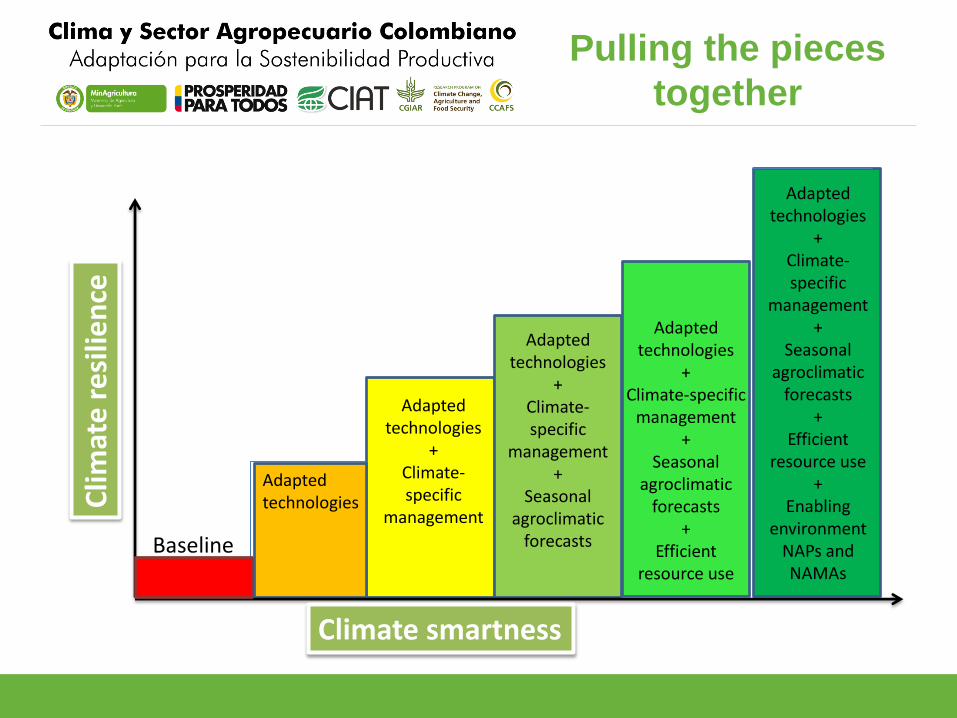
Clim
ate
re
silie
nce
Baseline
Adapted technologies
Adapted technologies
+ Climate-specific
management
Adapted technologies
+ Climate-specific
management +
Seasonal agroclimatic
forecasts
Adapted technologies
+ Climate-specific
management +
Seasonal agroclimatic
forecasts +
Efficient resource use
+ Enabling
environment NAPs and NAMAs
Climate smartness
Adapted technologies
+ Climate-specific
management +
Seasonal agroclimatic
forecasts +
Efficient resource use
Pulling the pieces
together
¡Gracias!
www.aclimatecolombia.org