climate biota of the early paleogene - earth-prints · early paleogene organized by: department of...
TRANSCRIPT
Climate& Biota of the
Bilbao 2006
Early Paleogene
Organized by:
Department of Stratigraphy and Paleontology
Faculty of Science and Technology
University of the Basque Country

SponsorsProvincial Government of Biscay
Faculty of Science and Technology
University of the Basque Country
Basque Government
Ministry of Education and Culture of Spain
Bilbao Town Council
Zumaia Town Council
Getxo Town Council
Galdakao Town Council
Basque Energy Board (EVE)
IRIZAR Group
The Geological and Mining Institute of Spain (IGME)
Bilbao Turismo & Convention Bureau
Algorri Research Centre
International Subcommission on Paleogene Stratigraphy (ISPS)
Edited by:
Bernaola Gilen, Baceta Juan Ignacio, Payros Aitor, Orue-Etxebarria Xabier and Apellaniz Estibaliz
Contributing authors:
Alegret Laia, Angori Eugenia, Apellaniz Estibaliz, Arostegi Javier, Baceta Juan I., Bernaola Gilen, Caballero Fernando, Dinarès-Turell
Jaume, Luterbacher Hanspeter, Martín-Rubio Maite, Monechi Simonetta, Nuño-Arana Yurena, Ortiz Silvia, Orue-Etxebarria Xabier, Payros
Aitor, Pujalte Victoriano
We recomend to reference this book as follows:
Bernaola G., Baceta J.I., Payros A., Orue-Etxebarria X. and Apellaniz E. (eds.) 2006. The Paleocene and lower Eocene of the Zumaia
section (Basque Basin). Climate and Biota of the Early Paleogene 2006. Post Conference Field Trip Guidebook. Bilbao, 82p.
Baceta J.I., Bernaola G. and Arostegi J. 2006. Lithostratigraphy of the Mid-Paleocene interval at Zumaia section. In: Bernaola G., Baceta
J.I., Payros A., Orue-Etxebarria X. and Apellaniz E. (eds.) 2006. The Paleocene and lower Eocene of the Zumaia section (Basque
Basin). Climate and Biota of the Early Paleogene 2006. Post Conference Field Trip Guidebook. Bilbao, 82p.
Printed by: KOPIAK. Bilbao
ISBN: 84-689-8940-1
D.L..:
May 2006

VenuePalacio EuskaldunaConference Centre and Concert HallBILBAO. 12-20 June, 2006
Honor CommitteeMr. Juan José Ibarretxe MarkuartuPresident of the Basque Government
Mr. Juan Ignacio Pérez IglesiasRector of the University of the Basque Country
Mr. José Luis Bilbao EgurenDeputy General of the Provincial Government of Biscay
Mr. José Antonio Campos GranadosMinister of Education, Universities and Research of the Basque Country
Mrs. Belén Greaves BadilloMinister of Culture of the Provincial Government of Biscay
Mr. Iñaki Azkuna UrretaMayor of the Bilbao Council
Mrs. M.ª Eugenia Arrizabalaga OlaizolaMayor of the Zumaia Council
Mr. Iñaki Zarraoa ZabalaMayor of the Getxo Council
Mr. Joseba Escribano EtxebarriaMayor of the Galdakao Council
Mr. Miguel Ángel Gutiérrez OrtizVice-rector of Research of the University of the Basque Country
Mr. Juan Ramón González VelascoDean of the Faculty of Science and Technology of the University of the Basque Country
Mr. José Ignacio Hormaeche Azumendi General Manager of the Basque Energy Board (EVE)
Mr. Andoni Etxebarrieta GarmendiaGeneral Coordinator of the IRIZAR Group

ConvenorsVictoriano Pujalte & Xabier Orue-Etxebarria
University of the Basque Country
Organizing CommitteeVictoriano Pujalte (University of the Basque Country, Bilbao)
Xabier Orue-Etxebarria (University of the Basque Country, Bilbao)
Estíbaliz Apellaniz (University of the Basque Country, Bilbao)
Juan I. Baceta (University of the Basque Country, Bilbao)
Gilen Bernaola (University of the Basque Country, Bilbao)
Fernando Caballero (University of the Basque Country, Bilbao)
Aitor Payros (University of the Basque Country, Bilbao)
Jaume Dinarès-Turell (Istituto Nazionale Geofisica e Vulcanologia, Roma)
Nieves López-Martinez (University Complutense of Madrid)
Alejandro Robador (Geology and Mining Institute of Spain, Madrid)
Birger Schmitz (University of Lund, Sweden)
Josep Serra-Kiel (University of Barcelona)
Josep Tosquella (University of Huelva)
Scientific CommitteeMarie Pierre Aubry (Rutgers University, New Jersey, USA)
William A. Berggren (Woods Hole Oceanographic Institution, USA)
Henk Brinkhuis (Utrecht University, Netherlands)
Christian Dupuis (Mons Polytechnics, Belgium)
Philip D. Gingerich (University of Michigan, USA)
Eduardo A. M. Koutsoukos (Rio de Janeiro, Brasil)
Hanspeter Luterbacher (Barcelona, Spain)
Eustoquio Molina (University of Zaragoza, Spain)
Ursula Röhl (Bremen University, Germany)
Birger Schmitz (University of Lund, Sweden)
Ellen Thomas (Yale University, New Haven, CT, USA)
Scott Wing (Smithsonian Institution, USA)
Lisa C. Sloan (University of California, Santa Cruz, USA)
James C. Zachos (University of California, Santa Cruz, USA)
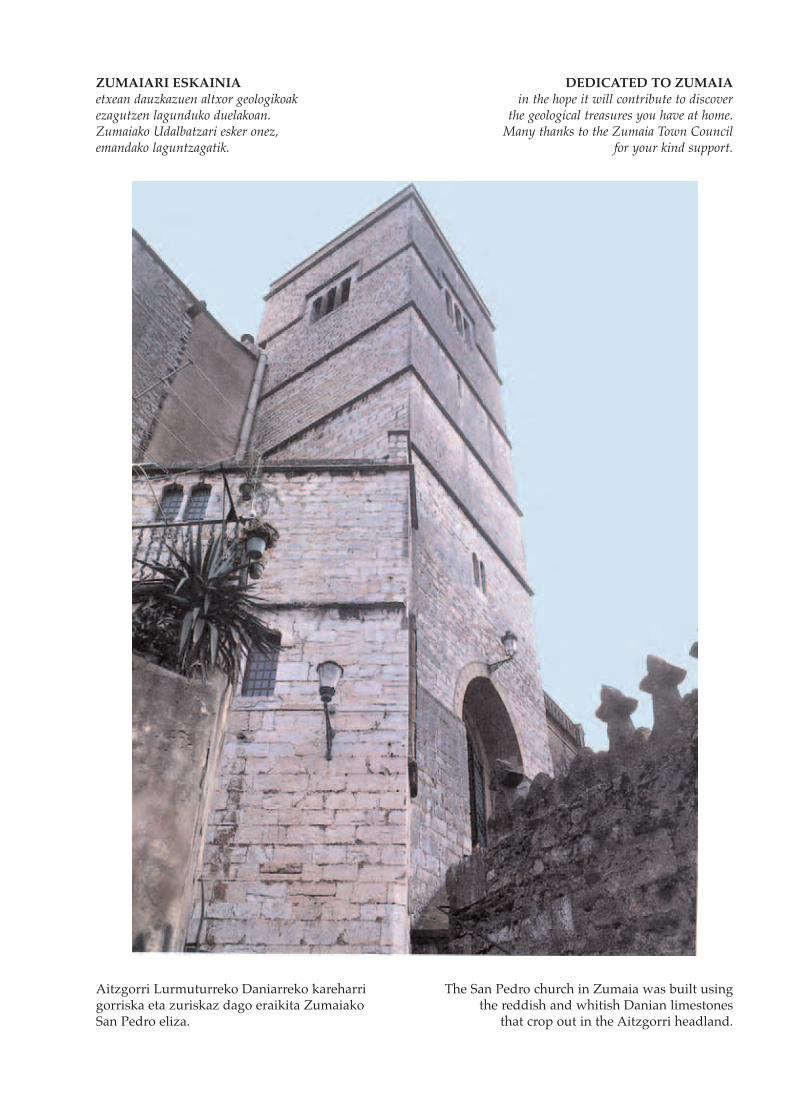
ZUMAIARI ESKAINIAetxean dauzkazuen altxor geologikoakezagutzen lagunduko duelakoan.Zumaiako Udalbatzari esker onez,emandako laguntzagatik.
DEDICATED TO ZUMAIAin the hope it will contribute to discover
the geological treasures you have at home.Many thanks to the Zumaia Town Council
for your kind support.
Aitzgorri Lurmuturreko Daniarreko kareharrigorriska eta zuriskaz dago eraikita ZumaiakoSan Pedro eliza.
The San Pedro church in Zumaia was built usingthe reddish and whitish Danian limestones
that crop out in the Aitzgorri headland.


CONTENTS
1.- CONTRIBUTION OF PROFESSOR AXEL VON HILLEBRANDT’S PIONEERING RESEARCHES TO
PROMOTE ZUMAIA AS A GLOBAL REFERENCE SECTION
(X. Orue-Etxebarria, E. Apellaniz)......................................................................................................................................
1.- INTRODUCTION
1.1. The Upper Maastrichtian and lower Paleogene in the Pyrenean Basin (G. Bernaola, J.I. Baceta, V. Pujalte)....
1.2. The Zumaia section (J.I. Baceta, V. Pujalte, G. Bernaola, X. Orue-Etxebarria, E. Apellaniz)...................................
2.- THE CRETACEOUS/PALEOGENE (K/P) BOUNDARY
2.1. The K/P boundary and the Pyrenean Basin (G. Bernaola, E. Apellaniz, X. Orue-Etxebarria)..............................
2.2. Lithostratigraphy of the K/P boundary interval (J.I. Baceta, V. Pujalte)..............................................................
2.3. Calcareous nannofossil turnover across the K/P boundary (G. Bernaola)............................................................
2.4. Planktic foraminifera turnover across the K/P boundary (E. Apellaniz, X. Orue-Etxebarria, H. Luterbacher)..
2.5. Evolution of the early Paleogene planktic foraminifera (E. Apellaniz, X. Orue-Etxebarria, H. Luterbacher).....
3. CYCLO-, MAGNETO- AND CALCAREOUS PLANKTON BIOSTRATIGRAPHY OF THE DANIAN
LIMESTONE
3.1. Magnetostratigraphy of the Danian Limestone (J. Dinarès-Turell, J.I. Baceta, V. Pujalte).................................
3.2. Cyclostratigraphy of the Danian Limestone (J. Dinarès-Turell, J.I. Baceta, V. Pujalte).......................................
3.3. Planktic foraminifera biostratigraphy of the Danian Limestone (X. Orue-Etxebarria, E. Apellaniz).................
3.4. Calcareous nannofossil biostratigraphy of the Danian Limenstone (G. Bernaola).............................................
4.- THE MID-PALEOCENE INTERVAL AT ZUMAIA
4.1. An overview (J.I. Baceta, G. Bernaola)......................................................................................................................
4.2. Lithostratigraphy (J.I. Baceta, G. Bernaola, J. Arostegi).........................................................................................
4.2. Magneto- and cyclostratigraphy of the Mid-Paleocene interval (J. Dinarès-Turell, J.I. Baceta, V. Pujalte)......
4.3. Calcareous nannofossils assemblages across the Mid-Paleocene (G. Bernaola, Y. Nuño-Arana).........................
4.4. New planktic foraminifera biozonation from the Mid-Paleocene (X. Orue-Etxebarria, F. Caballero, E.
Apellaniz)............................................................................................................................................................................
4.5. Benthic foraminifera from the Danian-Selandian transition (S. Ortiz).................................................................
4.6. Benthic foraminifera from the Selandian/Thanetian transition at Zumaia (L. Alegret, M. Martín-Rubio).......
4.7. The Mid-Paleocene Biotic Event (MPBE) (G. Bernaola, J.I. Baceta, X. Orue-Etxebarria, L. Alegret, M. Martín-
Rubio, J. Arostegi, J. Dinarès-Turell)..................................................................................................................................
4.8. Looking for a suitable criterion to define the Danian/Selandian & Selandian/Thanetian boundaries (G.
Bernaola, X. Orue-Etxebarria, V. Pujalte, J.I. Baceta).......................................................................................................
5 THE PALEOCENE/EOCENE BOUNDARY INTERVAL
5.1. An overview (G. Bernaola, X. Orue-Etxebarria)........................................................................................................
5.2. The Paleocene/Eocene boundary at Zumaia section (J.I. Baceta, V. Pujalte, G. Bernaola)...................................
5.3. Magnetostratigraphy of the P/E boundary interval (J. Dinarès-Turell, J.I. Baceta, V. Pujalte)...........................
5.4. Cyclostratigraphy of the P/E boundary interval (J. Dinarès-Turell, J.I. Baceta, V. Pujalte)................................
5.5. Calcareous nannofossil turnover across the P/E boundary interval (G.. Bernaola, E. Angori, S. Monechi).......
5.6. Planktic foraminifera across the P/E boundary interval (X. Orue-Etxebarria, E. Apellaniz, F. Caballero) .......
5.7. Benthic foraminifera from the Paleocene/Eocene transition (Laia Alegret and Silvia Ortiz)...............................
9
13
14
18
18
20
24
26
29
30
35
36
38
38
42
44
46
47
49
49
51
54
55
59
62
63
67
73

THE PALEOCENE AND LOWER EOCENEOF THE ZUMAIA SECTION
(BASQUE BASIN)


CONTRIBUTION OF PROFESSOR AXEL VON HILLEBRANDT´SPIONEERING RESEARCHES TO PROMOTE ZUMAIA AS A
GLOBAL REFERENCE SECTION
(X. Orue-Etxebarria, E. Apellaniz)
The lower Paleogene Zumaia section is one of the best-known and most studiedland-based succesion in the world. This is partly due to the fact that this section con-tains a continuous and expanded record of the Paleocene, is easily accessible and is beau-tifully exposed in sea-cliffs. Furthermore, the position of the section between theTethys and the North Sea makes it an important link between these two classicalregions. But the success of Zumaia as a global reference section is also a result of thepioneering work on planktic foraminifera carried out by Professor von Hillebrandt morethan 40 years ago.
Professor Axel von Hillebrandt was born on April 12th, 1933 in Tilsit (East Prusia)where he completed his secondary education studies in 1952. Later on, he undertook hisuniversity career choosing Geology at the universities of München and Freiburg between1952 and 1957. This last year he obtained his Geology Diploma by the Technic Universityin München with the Diploma Thesis entitled “Die Schichten der Gosau und desAlttertiärs im Nordem und Nordwestern des Untersberges (Becken von Reichenhall)”.
In the summer of 1958 he took part in a scientific-mountaineering expedition tothe southern Pyrenees (Ordesa Valley, Monte Perdido). Availing himself of that oppor-tunity, he had his first contact with the cliffs in Zumaia, where he had come around totake sediment samples for micropaleontologic studies. The reason of this visit was theindication by his Diploma Guide Professor, Dr. P. Schmidt-Thomé. The latter, deeplyinpressed by the superb outcrops in Zumaia, most probably knew the area from his dearfriend J. Gómez de Llarena, local geologist that had already published some papers onthe Cretaceus and Paleogene of Gipuzkua.
It was that very year, 1958, being camped next to the road going from Zumaia toGetaria with his friend Dr. Herm, geologist who worked in the upper Cretaceous between
- 9 -
Fig. 1.- Axel von Hillebrandt
Deba and the Aitzgorri headland at the same time Dr. Hillebrandt was researching inZumaia, that he had the opportunity to meet Joaquín Gómez de Llarena, who came tovisit them together with Professor Kockel (Marburg). Already in 1960 he took hisDoctorate exam, with a Thesis entitled “Das Paleozän und tiefere Untereozän im Beckenvon Reichenhall und Salzburg”.
Between 1960 and 1962 he held the position of Assistant Lecturer at the Instituteof Paleontology and Historic Geology of the University of München and from October1963 the same position at the Institute of Geology and Paleontology of the TechnicUniversity of Berlin. Also in 1963 he got married (was widowed in 1990), later on havingtwo daughters, Barbara and Ingrid.
In 1961, 1962 and 1964 he visited the Southern Pyrenees and Zumaia with the aimof measuring stratigraphic profiles and taking samples for his micropaleontologic stud-ies. The scientific results of these excursions in the Pyrenees were published in EclogaeGeol. Helv., 55/2, 1962 and later on translated into Spanish in Notas y Comunicacionesdel Inst. Geol. Y Min. de España, 73, 1964.
After several articles mostly published in german journals, in 1965 appeared thework by Dr. Hillebrandt which granted Zumaia international renown in the Geology(Micropaleontology) field, entitled “Foraminiferen-Stratigraphie im Alttertiär vonZumaya (Provinz Guipúzcoa, NW-Spanien) und ein Vergleich mit anderen Tethys-Gebieten.- Bayer. Akad. Wiss., math.-nat. Kl., 123, S.1-62, 3 Prof., 3 Kartenskizzen, 5Tab., München”. Moreover, this work constituted the subject of his Thesis for qualifi-cation at the Technic University of Berlin and it also included the results of the studiescarried out in Muskiz, Province of Navarre.
From 1965 onwards, professor Hillebrandt extened his micropaleontologic studiesto the South of the Iberian peninsula, a fact that was later on reflected in several arti-cles published in the Rev. Española de Micropaleontología, Bull. De la Société Géologiquede France, etc., where a correlation between the biozones of planktic foraminifera andlarger foraminifera was proposed. In 1967, using his excellent mountaineer and climberskills, which enabled him to sample even in the most adverse situations, he took part ina mountaineering and scientific expedition to the Central Mountain Range in Peru.
From 1966 to 1968 he was Professor in the Geology School of the University ofSantiago de Chile and in 1969 he was appointed Professor of the Technic University ofBerlin. His paleontologic research widened to include groups as varied as plankticforaminifera, larger foraminifera and finally ammonites. Between 1971 and 1997 he madeseveral visits to Chile, Peru and Argentina in order to deal with his scientific studies,mostly dedicated to ammonites from the Pliensbachian of South America.
Throughout his long career he has supervised a number of Theses, both DiplomaTheses and Doctoral Theses, carried out by students of the Insitute of Geology andPaleontology of the Technic University in Berlin. He has also been the Doctoral Thesissupervisor of J. Martínez (1977) and J. Cremades (1982), from the University ofGranada, as well as of Xabier Orue-Etxebarria (1982), from the University of the BasqueCountry.
In the management area, both university and scientific, he has been part of sever-al committees and international groups, having held, among others, the position ofUNESCO’s Consultant for Micropaleontology in the School of Geology of Central America
- 10 -

at the University of Costa Rica. He was also Director of the Institute of Geology andPaleontology at the Technic University of Berlin from 1984 to 1987, Chairman of theGerman Subcommission on Jurassic Stratigraphy between 1988 and 1995, Chairman of“Paläontologische Gesellschaft” from 1995 to 1997, and finally retired in 1998.
It is clear that, in a summary like this, it is impossible to exhaustively describe all hisworks, which are close to a hundred, although it is necessary to mention that, even afterhis retirement he continues developing an active research, mainly dedicated to studyammonites from the lower Jurassic in South America. This fact has been reflected in thepublication of monographies on ammonites from the Hettangian, Sinemurian andPliensbachian.
Finally, we would like to highlight professor Hillebrandt’s human aspect. Those of uswho have been lucky enough to meet him, either while he stayed in Elche (Alicante) andMonte Perdido (Huesca) or during his participation in the 2nd International ConferenceGlobal Bioevents, held in Bilbao in 1987, appreciate his kindness in sharing with us his knowl-edge and vast experience. In our particular case, we must underline his behaviour as scien-tific director, as he always managed to find some time for discussing and contributed tothe subject of Xabier´s Thesis. Furthermore, we will never forget his generosity when hehosted us in his home in Berlin in 1980, during the period in which we corrected theDoctoral Thesis. Since then, not only is he a master, but also a dear friend.
Dr. Hillebrandt, mila esker eta besarkada bero-bero bat.(thank you and a huge hug. // viele Danke un liebe Grüβe.)
On behalf of the Organizing Committee, your friendsXabier Orue-Etxebarria and Estibaliz Apellaniz.
- 11 -
Fig. 2.- Zumaia cross section from Hillebrandt (1965).


THE PALEOCENE AND LOWER EOCENE OF THE ZUMAIA SECTION (BASQUE BASIN)FIELD-TRIP GUIDEBOOK
1.- INTRODUCTION
1.1. The Upper Maastrichtian and lower Paleogene in the Pyrenean Basin (G. Bernaola, J.I. Baceta,V. Pujalte)
The Pyrenees are an unusual geologic area due to the thickness and cartographic extension of theMesozoic and Cenozoic sediments. It was configured as an emerged area during the Mid Cenozoic(between 30-40Ma) as a result of the tectonic convergence undergone by the European and Iberianplates (Pujalte et al. 2002). Until the uplift of the Pyrenees the Pyrenean area constituted an openmarine basin opened westward to the Proto-Bay of Biscay and North Atlantic. However, although thePyrenean Basin was opened to the Atlantic Ocean it shared with the Tethys similar climatic conditionsand biotic communities.
In the Pyrenean domain the upper Maastrichtian, Paleocene and Ilerdian (Lower Ypresian) aremade up by an up to 500 m thick sedimentary succession representative of a wide-range of sedimen-tary environments, from continental to deep marine. The outcrops of these successions are extensive inboth sides of the Pyrenean chain and in the Basque Basin, and their maping and facies analysis haveallowed the elaboration of precise paleogeographic reconstructions (Fig. 3).
The upper Maastrichtian, Paleocene and Ilerdian (MPI) succession was deposited in a relativetectonic calm phase that precedes the principal orogenic phase (Puigdefàbregas y Souquet, 1986;
The Paleocene and lower Eocene of the Zumaia section
- 13 -
��
����������� ������
��
��
��
�� �
�
���
�
�����������
�� � ���������
��������
������������
��� �������
���
������������� !"#��$
%�
���� ��
� ������������ ���&������������$
�'�� (����������� ��� )���* ���+�*)�������������+�)���,�$
'���$���-��*���
.*��� ��/� ����� ��0
������ �������� ��
��� ���������������)�/�����+���)����* +���)����� �+�)��+��)��,+���)�� �� ���+���)�1�+��)�2����+���)������+� �)�3�� ��
������
�
*
����
Fig. 3.- Late Danian (60 Ma) paleogeography of the Pyrenean domain, with indication of outcrops location and referencelocalities (after Baceta et al., 2004).

Vergés, 1993; Baceta, 1996; Pujalte et al., 2002; Muñoz, 2002). This interval is, moreover, charac-terised by a general transgressive trend, that together with the tectonic quiscence and a predominantlywarm and semiarid climatic regimen (Medus & Colombo, 1991; Schmitz & Pujalte, 2003) brought outa substantial reduction of the siliciclastic input from the adjacent emerged areas and favoured the devel-opment of an extensive shallow marine carbonate platform system during the Paleocene and Ilerdian(Fig. 4). These platforms exceeded 50 Km in width and at some intervals developed bioconstructedmargins (coralgal reefs) that coexisted with bioclastic shoals and, landward, with protected lagoons,carbonate beach systems and wide tidal plains. The pioneer studies about the Paleocene and lowerYpresian platforms of the Pyrenean basin were done by Mangin (1959-1960), von Hillebrandt (1964)and van de Velde (1967). From the later publications deserve to be stressed Garrido and Rios (1972),Plaziat (1981), Eichenser (1988), Betzler (1989), Barnolas et al. (1990), van der Hurk (1990),Luterbacher et al. (1991), Pluchery (1995), Serra-Kiel et al. (1994), Baceta (1996), Baceta et al. (2005).
The carbonates of the abovementioned platforms and the underlying upper Maastrichtian mate-rials grade landwards to continental or transitional deposits, that have been classically named “Garum”or “Garumnian facies” (Leymerie, 1863; Rosell et al., 2001), or Trem Group (Cuevas, 1992).
Seawards, the MPI platform systems evolved to slope areas characterised by a discontinuoussedimentary record and accumulation of breccias, conglomerates and carbonatic turbidites derivedfrom the adjacent platforms (Plaziat, 1975; Baceta et al., 1991; Baceta, 1996; Pujalte et al., 1998a, b).Overall, the slope zones demarcate a central deep basin area (Basque Basin), with an estimated waterdepth of about 1000 m (Pujalte et al., 1998) whose deposits have been principally preserved in theBasque Arc (Bizkaia and Gipuzkoa) and in the North Pyrenean Zone (Fig. 3). In the Basque Basin thesedimentation during the MPI was predominantly hemipelagic, and as a result laterally extensive suc-cessions composed of an alternation of marls, marly limestones and limestones were deposited. Someof the sections that contains these facies (mainly Zumaia, Gipuzkoa) are global reference sections forthis time interval as they have been the subject of multiple studies about late Cretaceous ammonitesand inoceramids (e.g. Wiedmann, 1988; Ward et al., 1991; Ward & Kennedy, 1993), late Maastrichtian-lower Paleogene calcareous plankton (e.g. von Hillebrandt, 1965; Orue-Etxebarria, 1983; Arenillas,1996; Bernaola, 2002), magnetostratigraphy and cyclostratigraphy (Roggenthen, 1976; Ten Kate &Sprenger, 1993; Pujalte et al., 1995; Dinarès-Turell et al., 2002, 2003) and furthermore because theyoffer excellent sections of some significant chronoestratigraphic boundaries such as theCretaceous/Paleogene (Lamolda et al. 1988; Lamolda & Gorostidi, 1992; Apellaniz et. al, 1997;Apellaniz, 1998; Arenillas et al., 1998) Danian/Selandian (Schmitz et al., 1998), Selandian/Thanetianor Paleocene/Eocene (Canudo et al. 1995; Schmitz et al., 1997; Baceta et al. 2000; Dinarès-Turell etal., 2002; Orue-Etxebarria et al., 2004).
1.2 The Zumaia section (J.I. Baceta, V. Pujalte, G. Bernaola, X. Orue-Etxebarria, E. Apellaniz)The Zumaia section, located in the coast of the Gipuzkoa province halfway between the cities of
Bilbao and San Sebastian, is an essentially continuous lower Santonian to lower Eocene succession thatcrops out along a series of sea-cliffs and beaches. The MPI of the Zumaia section (latitude/longitude42°18.00’N /2°15.30’W) is one of the best-known and most studied worldwide. In fact the section con-tains a complete and very expanded record of the Paleocene, is easily accessible and is beautifullyexposed at the Aitzgorri headland seacliffs and the contiguous Itzurun beach (Fig. 5). Furthermore, theposition of the section between the Tethys and the North Sea makes it an important link between thesetwo paleogeographical domains.
Due to its easy accessibility and superb quality of exposure, the Zumaia section already attract-ed the attention of pioneer workers in the region (e.g., Gómez de Llarena, 1946). It was later the sub-
Climate & Biota of the Early Paleogene, Bilbao 2006
- 14 -

ject of general studies about planktic foraminifers (Hillebrandt, 1965), calcareous nannofossils(Kapellos, 1974; Van Vliet, 1982) or sequence stratigraphy (Baceta, 1996; Pujalte et al., 1998a), tomention but a few. Several other papers have focused on the analysis of the Cretaceous/Paleogene(K/P) and the Paleocene/Eocene (P/E) boundaries including Alvarez et al. (1982), Smit and Ten Kate
The Paleocene and lower Eocene of the Zumaia section
- 15 -
���������������������������������� �����������������������
������������������������
�����4����� ��
'���$���-�������� ��� ����� ��
���*������ �-� ������4�*������
���������������*�����
���&������&������� ���+� �-� �������4��������������������������������� ����4��������5��������� �
��������� ��������� ��� 0�' ��0�4�*� ��������������� ��$
��� � ���
���������� ��������� ��6 � �� ��� *��'+��- ��4���������$�'�� (�������������������� *��'+������� �������� ��$
������ �������� ��
��� !�
76�* ��������
����� ��'�����
5
��8��-9��������"#���� :���
�;
�;*
�;�
�<
�=
�=*
�>
�>*
�>�
�?
�"
� @��
��;#
��A
��B
��C
��"
��?
��>
��=
��<��;
<?�
<"�
<C�
<B�
<A�
=#�
<>�
<?�
<"�
<C�
<B�
<A�
���3�����
�2�������
������
/���������
���/D
$�
����:����
�:�D
��<?�
��<"
��<"*
��D
���
�
?>
??
?"
?C
?B
?A
"#
";
"<
"=
">
"?
""
%���� ��&'� &! �$'�� (&$)
/�%;
/�%<
/�%=
/�%>
/�%"
/�%?
�*���%�+�������,-./0
��1.
��1�
�1.
�1�
��1.
��1�
)�1��
$ *$ �$ $ �$
55
Fig. 4.- Biochronostratigraphic framework of the Paleocene-lower Ilerdian succession of the SW Pyrenees, showing deposi-tional sequences and main facies. (modified from Baceta et al., 2004).

(1982), Wiedman (1986), Canudo and Molina (1992), Gorostidi (1993), Kunht and Kaminski (1993),Ward and Kennedy (1993), Canudo et al. (1995), Ortiz (1995), Schmitz et al. (1997, 1998), Knox(1998), Apellaniz (1999), Adatte et al. (2000), Bernaola (2002), Orue-etxebarria et al., (2004).
During the last decade the Zumaia section was considered a suitable section as the boundary stra-totype for the K/P and P/E boundaries and now it has been proposed for the definition of the Selandianand Danian stages (see www.stratigraphy.org/gssp.htm). The Zumaia section, in effect, complies withmost of the requirements listed by the International Commission on Stratigraphy (ICS, see Remane etal., 1996), namely: (a) it posses an adequate thickness of exposed sediments, since the Paleocene inter-val in Zumaia is in fact but a small segment of a near-continuous section spanning from the Campanianto the lowest Lutetian; (b) no biostratigraphic gap or condensation are recognizable; (c) a high sedi-mentation rate, Zumaia being in fact one of the most expansive open marine successions of thePaleocene so far reported; (d) identifiable geochemical and geomagnetic signals (Schmitz et al., 1997and below), a clear proof of minor diagenetic alteration; (e) abundant, well diversified open marine fos-sils, including planktic foraminifers and calcareous nannofossils; (f) good exposure and easy accessi-bility.
The lower Paleogene sediments of Zumaia were deposited at an estimated water depth of about1000 m (Pujalte et al. 1995, 1998). The upper Maastrichtian, Paleocene and Ilerdian at Zumaia are rep-resented by rythmic alternations of hemipelagic limestones and marlstones, plus some intercalations ofthin bedded carbonate, siliciclastic and mixed turbidites. This lithologic cyclicity has been attributed toorbital forcing by different authors (Ten Kate and Sprenger, 1993; Dinarès-Turell et al. 2002, 2003).
The MPI succession at Zumaia is arranged into four main lithological units that are easy torecognise in the field: The Zumaia-Algorri Fm., the Danian Limestones Fm., the Itzurun Fm. and TheEocene Flysch (Fig. 5).
I) Zumaia-Algorri Fm. (Mathey, 1982). This unit reaches a thicknes of ~200 m and encompass-es the Middle-Upper Maastrichtian. The upper member, which includes the upper Maastrichtian, ischaracterised by alternations of purple marls and grey marly limestones with intercalations of thin-bed-ded siliciclastic turbidites. The Cretaceous/Paleogene (K/P) clay marks the boundary between theZumaia-Algorri Fm. and the overlying Danian Limestones Fm.
II) Danian Limestone Fm. (Apellaniz et al.,1983). This is composed of a 49 m-thick alternationof pink-grey limestones and marls with few intercalations of thin calcareous turbidites. According toPujalte et al. (1998) this unit represented an stage of low sedimentation rates across the whole BasqueBasin. Its boundary with the overlying Itzurun Fm. is defined by a sharp drop in the total carbonatecontent from 75% to less than 25%.
III) Itzurun Fm (Baceta et al., 2004). It is a 80 m thick alternation of grey limestones and marlswith intercalations of thin-bedded siliciclastic and calcareous turbidites. At the base of this formationthere is a marl-dominated interval. The carbonate content increases upwards, reaching its maximum atthe middle-upper part of the unit, and then decreases progressively to research a minimum at the P/Eboundary. The turbidite content is higher in the upper part of the Itzurun Fm.
IV) Eocene Flysch: This interval is a marl-dominated unit with abundant intercalations of thin-bedded siliciclastic turbidites. At the base of this unit there are is a 4 m thick distinct interval of red-dark grey lutites that represents the important negative δ13C shift of the P/E boundary.
Climate & Biota of the Early Paleogene, Bilbao 2006
- 16 -

The Paleocene and lower Eocene of the Zumaia section
- 17 -
�2
���
��
�
9��������*��� ���'��"#����1��3����(�,� ��'��+�;AB<$
�������� ��� ����������������-��������������� ���
(��'���������� ��� ���'���*�������������������*�����
���������������(�,� �������8����� !+;AB=$
�������� ��� �����5�-���������� ����������D
E�(���������� ��� ���'�������� ������*�����
��4#�#�(�, ��������� !�<##>$�������� ��� ��-���
������ �����������(��'���������� ��� ���'���
*�����������������4������ ������*�����D
���� �����������&��� ��'��*��
���� �����������(��'�*�������������� ��
���'���*�������������������*�����D�����'��*��
����5�-������������ � ��� ���'�����$������*�
�;#����'��5������� ��� �����������&�
7�6������:�9�������3�F���������F������F��
��>�6���?������:�%�:��������:�9�������3�F
��/��:E��2���6�� �3�:������/:�:�����G�93/�:���H���� ��$
�����#�
��%�����
���43������������
)����������������
��4#�#����+�
��� ����+�����
!������5��
"!)���
�����������+����
�����
���������
�167/��������
���� ��
�2
����� ����������
��"��#�����"
�������
�$����
������
�
�
.
7
�& ���
'���& ���
!''�$
$� �
�&!�
������
���������
����,
���$����
8'$�����
)��� $� � ���
Fig. 5.- Generalised early Paleogene paleogeography of Western Europe and geologic map of the Upper Cretaceous-LowerPaleogene outcrops in the Zumaia area. Synthetic lithologic section of the uppermost Cretaceous-lower Paleogene inteval ofthe Zumaia section, showing four main stratigraphic units.

2.- THE CRETACEOUS/PALEOGENE (K/P) BOUNDARY
2.1 The K/P boundary and the Pyrenean Basin (G. Bernaola, E. Apellaniz, X. Orue-Etxebarria)The K/P boundary is one of the best and most studied mass extinction events in the geological
record. Although it has been the subject of multiple high resolution analyses over the last three decades,there are still some unresolved aspects related to the type and causes of the extinction. In general, twobasic extinction patterns have been proposed, a gradual one starting below or just above the boundaryand an abrupt or mass extinction. The identification of the extinction pattern is essential to the deter-mination of its causes. According to Pospichal (1996b), a gradual or stepwise extinction might haveresulted from long term climatic and/or sea-level changes (Clemens et al., 1981; Hallam, 1987) or froman extended period of intense volcanism that modified the composition of the atmosphere (McLean,1982, 1985; Officer & Drake, 1983, 1985; Officer et al. 1987), whereas an abrupt mass extinctionmight have resulted from a catastrophic event such as an impact of a large asteroid (Alvarez et al.,1980, 1984) or an intense volcanism (Courtillot et al., 1988).
Presently, there is no doubt about the presence of a extraterrestrial body impact in connectionwith the K/P boundary, but total agreement does not exist among the authors to determine if there wasone or several impacts (Keller et al., 2004 and references therein) and if the extraterrestrial cause wasthe unique and/or principal reason of the biotic crisis. A mix of coincident causes such as an intenseperiod of volcanism and long term climatic and/or sea-level changes could have given rise to a grad-ual extinction that could have reached its climax with one or several meteoritic impacts.
In the Pyrenean Basin the K/P boundary is preserved in numerous deep marine sections distrib-uted in three major bands of outcrops: the Bilbao area, the San Sebastian area, and the Pamplona area(Fig. 3). In addition to these, scattered outcrops also occur in southern Aquitaine (Pau area). Some ofthe Basque sections have been the focus of palaeontological, geochemical, magnetostratigraphic andsedimentological studies including many detailed micropalaeontologic analyses. Indeed, several ofthem are already classic, notably those of Zumaia (Percival and Fischer, 1977), Bidart (Perch-Nielsen,1979; Delacotte et al., 1985), Hendaia (Seyve, 1990) or Sopelana I (Orue-etxebarria, 1982; Lamolda etal., 1983) as well as the lesser known from Monte Urko (Orue-Etxebarria et al., 1991).
In Zumaia section as in all deep-marine sections of the Pyrenean basin, the K/P boundary sepa-rates two different groups of rocks. The rocks below the boundary are mostly reddish to purplish marlsand marlstones (Upper Member of the Zumaia-Algorri Formation, Mathey, 1986, also referred to as“Maastrichtian marls”), whereas the rocks above it correspond to a group of grey and pink pelagic lime-stones and marlstones that are called “Danian Limestones” (Apellaniz et al., 1983) (Figs. 6a, 6c).Sequence stratigraphic analyses have established that the K/P boundary is included within a singledepositional sequence (Ma-Da Depositional Sequence in Figure 4, see also Baceta, 1996 and Pujalte etal., 1997). In fact, the K/P boundary is included within the transgressive systems tract (TST) and inmost sections corresponds to a period of very low sedimentation rates (condensed interval). At Zumiathe TST spans the upper 2 m of the Cretaceous and the lower 3 metres of the “Danian Limestones”.
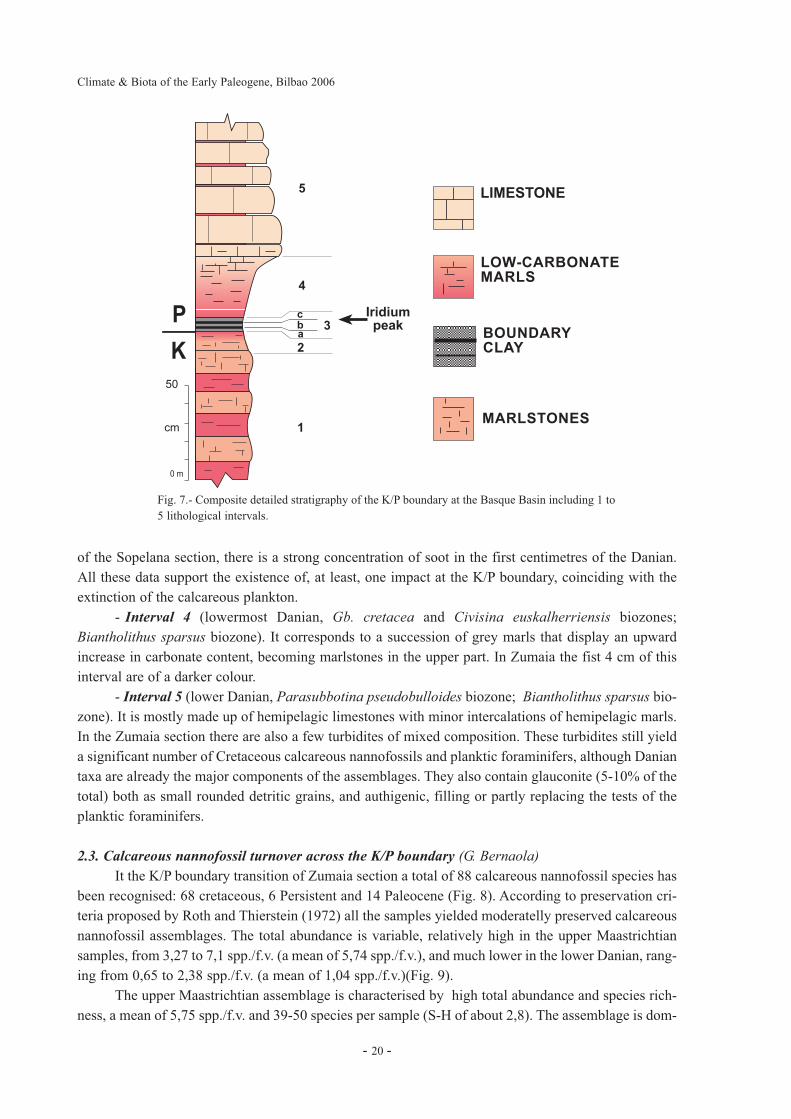
2.2. Lithostratigraphy of the K/P boundary interval (J.I. Baceta, V. Pujalte)Due to the dominant hemipelagic nature of the sedimentation in the Basque Basin, the lithos-
tratigraphy of the various K/P boundary sections, including Zumaia, is quite similar.Our observations demonstrate that the composite detailed stratigraphy of the K/P boundary in the
Basque Basin includes 5 well-defined lithologic intervals (Fig. 7), some of which may be locally miss-ing due to tectonic deformation during the Alpine Orogeny. From base to top, the lithologic successionis as follows.
Climate & Biota of the Early Paleogene, Bilbao 2006
- 18 -

- Interval 1 (upper Maastrichtian, Abathomphalus mayaroensis biozone; Micula murus andMicula prinsii biozones). It includes 20-30 cm thick couplets of compact, grey and reddish marls andmarlslones. In Zumaia and other sections such as Urrutxua, and Herrera there are intercalations of thin,mixed carbonate-siliciclastic turbidites with silt/fine sand sized detritic quartz (50-65 %) and tests ofplanktic foraminifers (10-20%) embedded in a matrix of micritic mud.
- Interval 2 (uppermost Maastrichtian, uppermost part of the A. mayaroensis biozone and M.prinsii biozone). It is mainly characterized by a gradual but rapid decrease in the carbonate content.Calcareous plankton is abundant in this interval.
- Interval 3 (K/P boundary clay). It includes a clay level that varies in thickness between 1 and8 cm. These differences are partly the result of interbed sliding, as demonstrated by the presence of cal-cite slickensides in some sections . Three layers can be differentiated within this clay bed (Fig. 6d,6e,7). The lowest one (a) is a grey or yellowish silty bed that usually contains planktic foraminifer testswith indications of dissolution. The intermediate layer (b) is a reddish to brownish siltstone wheremicrospherules with Ni-rich spinel crystals are significantly present. The uppermost layer (c) includesthinly laminated, dark grey siltstones. The highest iridium anomaly occurs at the contact between theupper two layers. At Zumaia the boundary clay is not laterally continuous due to the presence of cal-cite slickensides and it is only is visible in small patches (Fig. 6b). At Zumaia and other Basque BasinK/P sections features of impact deposits ocurr: iridium, Ni-rich spinels and soot (Rocchia et al., 1996).The strongest peak of iridium has been found at Urrutxua section with almost 29 ppm. In the sediments
The Paleocene and lower Eocene of the Zumaia section
- 19 -
Fig. 6.- Field photographs showing different aspects of the K/P boundary transition in several Basque Basin sections. (A-C)General view of the K/P boundary at Zumaia and Hendaia sections. (B,D,E) Detailed view of the K/P boundary clay inZumaia, Urrutxua and Bidart sections.
of the Sopelana section, there is a strong concentration of soot in the first centimetres of the Danian.All these data support the existence of, at least, one impact at the K/P boundary, coinciding with theextinction of the calcareous plankton.
- Interval 4 (lowermost Danian, Gb. cretacea and Civisina euskalherriensis biozones;Biantholithus sparsus biozone). It corresponds to a succession of grey marls that display an upwardincrease in carbonate content, becoming marlstones in the upper part. In Zumaia the fist 4 cm of thisinterval are of a darker colour.
- Interval 5 (lower Danian, Parasubbotina pseudobulloides biozone; Biantholithus sparsus bio-zone). It is mostly made up of hemipelagic limestones with minor intercalations of hemipelagic marls.In the Zumaia section there are also a few turbidites of mixed composition. These turbidites still yielda significant number of Cretaceous calcareous nannofossils and planktic foraminifers, although Daniantaxa are already the major components of the assemblages. They also contain glauconite (5-10% of thetotal) both as small rounded detritic grains, and authigenic, filling or partly replacing the tests of theplanktic foraminifers.
2.3. Calcareous nannofossil turnover across the K/P boundary (G. Bernaola)It the K/P boundary transition of Zumaia section a total of 88 calcareous nannofossil species has
been recognised: 68 cretaceous, 6 Persistent and 14 Paleocene (Fig. 8). According to preservation cri-teria proposed by Roth and Thierstein (1972) all the samples yielded moderatelly preserved calcareousnannofossil assemblages. The total abundance is variable, relatively high in the upper Maastrichtiansamples, from 3,27 to 7,1 spp./f.v. (a mean of 5,74 spp./f.v.), and much lower in the lower Danian, rang-ing from 0,65 to 2,38 spp./f.v. (a mean of 1,04 spp./f.v.)(Fig. 9).
The upper Maastrichtian assemblage is characterised by high total abundance and species rich-ness, a mean of 5,75 spp./f.v. and 39-50 species per sample (S-H of about 2,8). The assemblage is dom-
Climate & Biota of the Early Paleogene, Bilbao 2006
- 20 -
�
'
#��
?#
�� �
.
/
9
7
��)�� &��
�&:1 �$%&�� �)�$��
)�$�� &���
%&!���$8 ��8
��+ �����#�
���;
Fig. 7.- Composite detailed stratigraphy of the K/P boundary at the Basque Basin including 1 to5 lithological intervals.

The Paleocene and lower Eocene of the Zumaia section
- 21 -
��
�� �� �
%
����
% �$����� ��������������&�����
����������������&��� �#�����
��' �$�'�������������' �$�'������(���������' �$�'��������� ��� ���������' �$�'������&�����$� �������' �$�'������#���'���' �$�'�������&&�������' �$�'���������& ����������' �$�'������&��������
% �$��������������)������'����� �"��������)������'�������������*��������� �'���$� ��������������� �'���$� �������*�"�������(������ ��'��&��������(����������+� ����������%���$� ���������#� ��%���$� �����������������$��'� ���� �$���������$��'� ������������������$��'� ���� ��� �����% �$�'����� ������� (���,�% �$�'����� ��������$���������% �$�'����� ��������������% �$�'����� ��������&��������+������� ���&�����
�'�' �$�'��������'��� �'�' �$�'��������������� �'�' �$�'������������ �
�'�' �$�'������������
�'�' �$�'�������� ������� �'�' �$�'�������������&�� � �'�' �$�'��������-����������$�����&�� �����"��������% �$��������� ��&��� �����% �$��������� ��������
% �$��������� ������(��������% �$��������� ����(�������
����������������*� #��������������������������������% �$�������������������#�����% �$�������������������% �$������������������% �$��������������'� ���% �$�����������������% �$����������������� ��% �$����������������% �$��������������������% �$������������&��$ ��% �$��������������% �$������������'"&�����%�$ ��������(� ����%�$ ����������� �����'���$� ����&�*� � �����'���$� ����#�����������������-�� �������D��������-�� ���������� ���������-�� �����������������������-�� ������ �'�����������-�� �������#�����������'���$� ����&� &�$��������'���$� ����+��&�����������'���$� ��������������������'���$� ��������� ���� ���' �$� ������"����##�
� ���' �$� ����$��,������� ���' �$� ��������(� ����������(��������� �-�' �$����
� ���' �$� ���������"��
���(��������� �-���������������� �-�������������������� �-�&����� ����������� �-�&���������������������� �-�& ������������� �-���(����������������� �-� �$� ����������� �-�' �$� ����������� �-���'"&�����
��
�� �� �
��� ��������������� �������� ������ ��������������������� ��� ����������������������������������� !������������ !� �������������������!� �������������������� �!������"��������������!������"���������� � ���!������"������� !� �����������#�����!� ������������������! ��� ������������! �� �� ����������! �� ������ ������� ���� ���!������������ ���� �� ���!����� ����������� $��� ���������������%�������������#�����%�������������� ���%�������������� �������%����������������������%�������������� ����������&�������������������&������������������ �'��� ����������� ���������'��� ����������� ��(��� ����'��� ����������(��� ����)���*������������������)� ��������������� )� � �������������������)� � ����������������)� � ������������ ����)� � ����������������)������������)��������*�)������� ��)������ �����)������� +�� ��������������� �����, ���������� ��(��� ��������, ���������� �� �����, ���������� ��� �����, ���������� ������ ���, ���������� ����-�����, ���������� ���� , ���������� ���������, ��������� ������-��.��� ����� ��� �/����������������� ���/�������� �������/�����������"�� ������/���������� � ����/������������������/���������� ����� ���/�������������������0�������������������0��������������� ������� ����� ������������ ��� �����������������1������������������1����������� �#2��"���� ����� �����2��"���� ������������2��"���� �������*����3��� �������������� �� ��3��� ������������ ����
��� ������ ������ �����!������������ �� ����� ����4������������������� �� �������� ��������5��,���"��������������)� ���������*� ���
��������������������������������������� ���!������������ ������+������������ *����! �������������� ����������� �� �������� ������������� �� ������� ���������� �� �������� ������!������"������������
'����+���
����+��#�
'���������
�0 �� �$�&!�����&(&�����
%0'���� � (&$�)���(�$�
Fig.
8.-
Bio
stra
tigra
phic
dis
tribu
tion
of c
alca
reou
s na
nnof
ossi
l and
pla
nkto
nic
fora
min
ifers
for t
he u
pper
mos
t Cre
tace
ous
and
low
erm
ost P
aleo
gene
from
the
Zum
aia
sec-
tion.

inated by more than 99% of cretaceous species the persistent ones being very rare (Fig. 10). The mostabundant species, that represent 70-80% of the total assemblage, are W. barnease, Cr. ehrenbergii, M.decussata, Pr. cretacea, Pr. intercisa, Retecapsa spp., Ze. spiralis, Ark. cymbiformis, Eiff. turriseifeliiand Ah. regularis. The remaining 20-30% is composed by those species that never reach the 2-3%,such as M. attenuatus, Cy. serratus, Chiastozygus spp., Pr. spinosa, M. murus and M. prinsii, the latestthe marker of the base of the Micula prinsii biozone. The thickness of the M. prinsii biozone, whichcharacterises the terminal Maastrichtian in complete sections, changes among the Basque Basin sec-tions. It is 6 m thick at Zumaia but it is just few centimetres in Monte Urko section (Gorostidi andLamolda, 1991), and up to 10 m in Bidart (Bernaola 2002). All the sections have a similar sedimenta-tion rate and the difference in the thickness of this biozone in different sections is due to a taphonom-ic control.
In connection with the lithological change between horizon 2 and 3 an important turnover in cal-careous nannofossil assemblages is registered. The calcareous nannofossil total abundance suddenlydrops from 4,76 to 0,77 spp/f.v. (a reduction of the 84%) and the diversity also shows a marked decrease(Fig. 9). In connection with this lithological change a slight increase in the relative abundance ofThoracosphaera spp. is also observed, from very rare to about 3% of the total assemblage (Fig. 11).However, the calcareous nannofossil assemblage is very similar to that found in the underlying sedi-ments and the Cretaceous species are the dominant group (Fig. 10). During the last two decades themassive occurrence or increased frequency of Thoracosphaera spp. has been widely used to define theK/P boundary.
Three centimetres above the lithological change the relative abundance of Thoracosphaera spp.increases abruptly, reaching the 30% of the total assemblage. At Zumaia section Thorocospharea spp.is not the only persistent species that blooms above the K/P boundary. Following the bloom of
Climate & Biota of the Early Paleogene, Bilbao 2006
- 22 -
# ; < =
0678
# ;# <# =# ># ?#
�9����������
�<'�<'#
��?
��;#� �$
�?
�;#
#
��?
��;#� �$
�?
�;#
#
��?
��;#� �$
�?
�;#
��� :� *
# ;#
Fig. 9.- Calcareous nannofossil total abundance and species richness (spp./f.v., S-H)across the K/P boundary interval at Zumaia section.

Thorocospharea spp. the blooms of other persistent species such as Cy. reinhardtii, Oct. multiplus, Br.bigelowii are registered (Fig. 11). The group of the persistent species is completed by Pl. sigmoides andM. inversus that never reach 5% of the total assemblage.
12 cm above the lithological change that marks the K/P boundary (boundary between intervals2 and 3) the assemblage is dominated by persistent species. This calcareous nannofossil assemblagedominace change is very fast (Fig. 10).
After an abrupt decrease across the first 25 cm of the Paleocene, the relative abundance of cre-taceous species decreases progressively, being rare 1m above the K/P boundary. At Zumaia the domi-nace of the persistent species extends up to 7 m above the K/P boundary, where the new Paleocenespecies become the dominant species (Fig. 10).
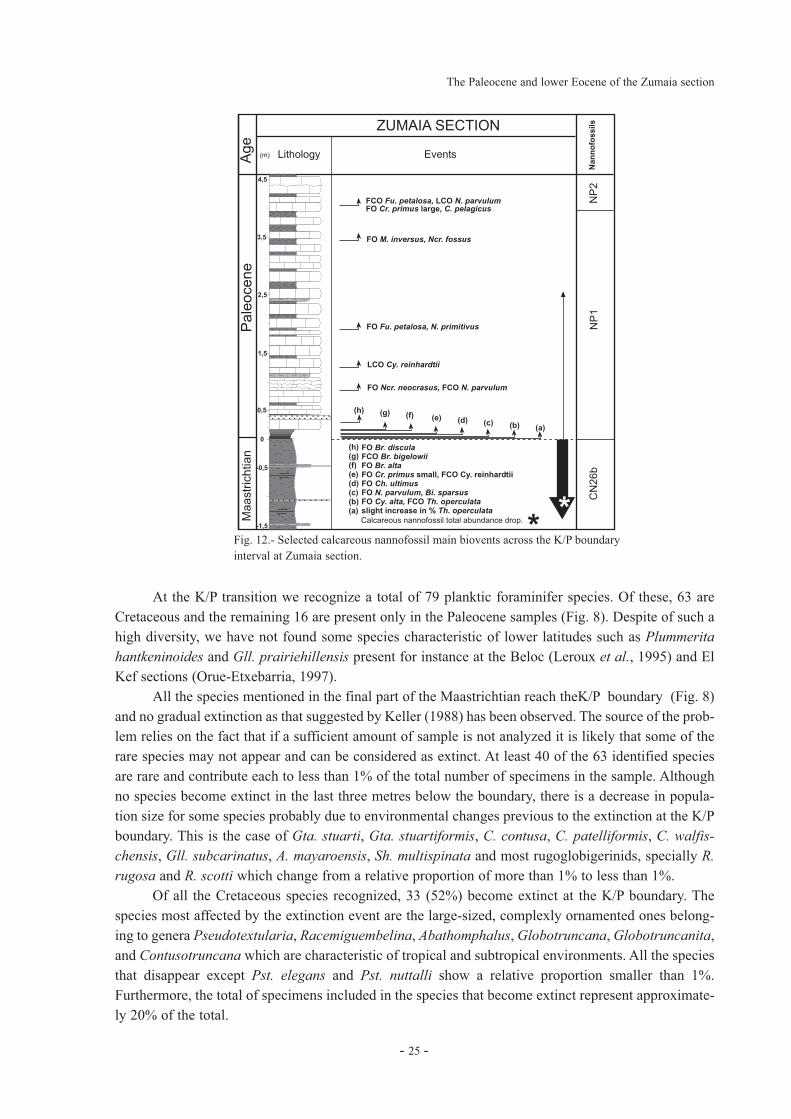
Several new Paleocene species have their First Occurrence (FO) in the first meter of thePaleocene (Fig. 12). B. sparsus and B. hughesii appear just above the Ir anomaly, followed by the FOof Br. discula, Br. alta, Cy. alta, Ch. ultimus Cr. primus small and Ne. parvulum. Ne. romeinii, veryabundant in low latitude sections such as El Kef, is not present in Zumaia section. Following theblooms of the persistent species the blooms of the some diminute Paleocene species, such as Ne. parvu-lum Fu. petalosa, Pr. dimorphosus and Pr. martinii, are registered (Fig. 11).
The understanding of the calcareous nannofossil extinction model and the subsequent recoveryover the K/P transition largely depends on the interpretation of the Cretaceous species found in Daniansediments. In the present study the persistent species are the unique forms that are considered confi-dently survivors. It is not possible to prove or disprove unequivocally the survivorship of most van-ishing species by means of the criteria proposed by previous authors. Some of the Cretaceous speciescould have survived for a short time but they were not able to adapt to the hostile environment andchanges in ocean circulation related to the K/P event(s) and did not serve as ancestors to Paleogenespecies.
After the K/P event(s) the persistent species suddenly become the dominant group of the non-reworked assemblage. Their total abundance, however, is low along the first meters of the Danian, sug-gesting a persistence of low nannofossil carbonate production for at least the first million years.
The Paleocene and lower Eocene of the Zumaia section
- 23 -
# ; < = > ? " C B
�;#
�?
#
?
;#
# <# ># "# B# ;##
#
I� ���������
� �$ � �$
���D6�D&D
������ ��
����������
��� ����
������ �� ���������� ��� ����
������ ��
����������
��� ����
�;#
�?
?
;#
Fig. 10.- Changes in relative (%) and absolute (spp./f.v.) abundance of Creataceous,Persistent and Paleocene species across the K/P boundary interval at Zumaia section.
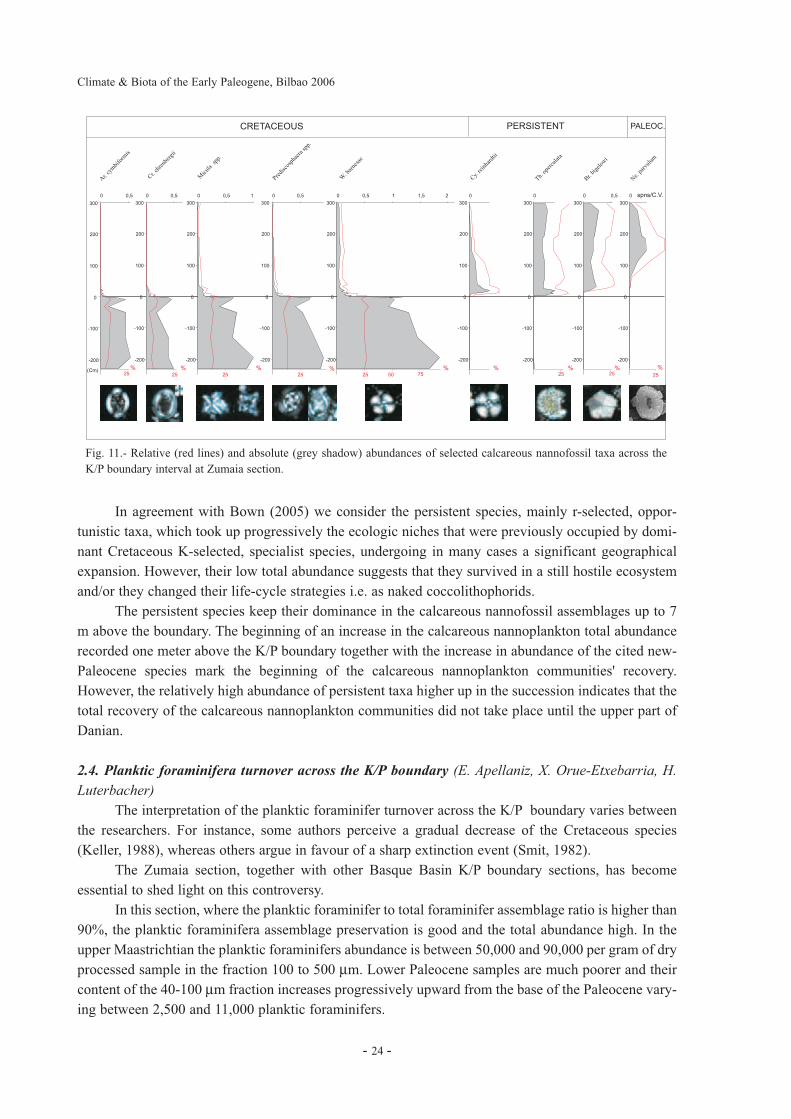
In agreement with Bown (2005) we consider the persistent species, mainly r-selected, oppor-tunistic taxa, which took up progressively the ecologic niches that were previously occupied by domi-nant Cretaceous K-selected, specialist species, undergoing in many cases a significant geographicalexpansion. However, their low total abundance suggests that they survived in a still hostile ecosystemand/or they changed their life-cycle strategies i.e. as naked coccolithophorids.
The persistent species keep their dominance in the calcareous nannofossil assemblages up to 7m above the boundary. The beginning of an increase in the calcareous nannoplankton total abundancerecorded one meter above the K/P boundary together with the increase in abundance of the cited new-Paleocene species mark the beginning of the calcareous nannoplankton communities' recovery.However, the relatively high abundance of persistent taxa higher up in the succession indicates that thetotal recovery of the calcareous nannoplankton communities did not take place until the upper part ofDanian.
2.4. Planktic foraminifera turnover across the K/P boundary (E. Apellaniz, X. Orue-Etxebarria, H.Luterbacher)
The interpretation of the planktic foraminifer turnover across the K/P boundary varies betweenthe researchers. For instance, some authors perceive a gradual decrease of the Cretaceous species(Keller, 1988), whereas others argue in favour of a sharp extinction event (Smit, 1982).
The Zumaia section, together with other Basque Basin K/P boundary sections, has becomeessential to shed light on this controversy.
In this section, where the planktic foraminifer to total foraminifer assemblage ratio is higher than90%, the planktic foraminifera assemblage preservation is good and the total abundance high. In theupper Maastrichtian the planktic foraminifers abundance is between 50,000 and 90,000 per gram of dryprocessed sample in the fraction 100 to 500 μm. Lower Paleocene samples are much poorer and theircontent of the 40-100 μm fraction increases progressively upward from the base of the Paleocene vary-ing between 2,500 and 11,000 planktic foraminifers.
Climate & Biota of the Early Paleogene, Bilbao 2006
- 24 -
���
���� �
��
# #+?
=##
�<##
;##
#
��;##
�<##
# #+?
! ��� �
��� �
��
# #+? ;
)��
������
�
# #+?
, ����
����
�� ��
���
# #+? ; ;+? <
2 ��
� ����
�
#
!� � ��
��� �
���
#
�� ���
� ���
��
# #+?
� �����
��5�
#
+� ���
*����
�3�����:9/ ��3/�/���� ����:�D
I II II II I I
����6�DHD=##
�<##
;##
#
��;##
�<##
=##
�<##
;##
#
��;##
�<##
=##
�<##
;##
#
��;##
�<##
=##
�<##
;##
#
��;##
�<##
=##
�<##
;##
#
��;##
�<##
=##
�<##
;##
#
��;##
�<##
=##
�<##
;##
#
��;##
�<##
=##
�<##
;##
#
��;##
�<##
��$<?<?<?<? ?# C?<?<?<?<?
Fig. 11.- Relative (red lines) and absolute (grey shadow) abundances of selected calcareous nannofossil taxa across theK/P boundary interval at Zumaia section.
At the K/P transition we recognize a total of 79 planktic foraminifer species. Of these, 63 areCretaceous and the remaining 16 are present only in the Paleocene samples (Fig. 8). Despite of such ahigh diversity, we have not found some species characteristic of lower latitudes such as Plummeritahantkeninoides and Gll. prairiehillensis present for instance at the Beloc (Leroux et al., 1995) and ElKef sections (Orue-Etxebarria, 1997).
All the species mentioned in the final part of the Maastrichtian reach theK/P boundary (Fig. 8)and no gradual extinction as that suggested by Keller (1988) has been observed. The source of the prob-lem relies on the fact that if a sufficient amount of sample is not analyzed it is likely that some of therare species may not appear and can be considered as extinct. At least 40 of the 63 identified speciesare rare and contribute each to less than 1% of the total number of specimens in the sample. Althoughno species become extinct in the last three metres below the boundary, there is a decrease in popula-tion size for some species probably due to environmental changes previous to the extinction at the K/Pboundary. This is the case of Gta. stuarti, Gta. stuartiformis, C. contusa, C. patelliformis, C. walfis-chensis, Gll. subcarinatus, A. mayaroensis, Sh. multispinata and most rugoglobigerinids, specially R.rugosa and R. scotti which change from a relative proportion of more than 1% to less than 1%.
Of all the Cretaceous species recognized, 33 (52%) become extinct at the K/P boundary. Thespecies most affected by the extinction event are the large-sized, complexly ornamented ones belong-ing to genera Pseudotextularia, Racemiguembelina, Abathomphalus, Globotruncana, Globotruncanita,and Contusotruncana which are characteristic of tropical and subtropical environments. All the speciesthat disappear except Pst. elegans and Pst. nuttalli show a relative proportion smaller than 1%.Furthermore, the total of specimens included in the species that become extinct represent approximate-ly 20% of the total.
The Paleocene and lower Eocene of the Zumaia section
- 25 -
��
� ��
���
��
���'�
��
�-�
�����*������%9�����/����:�
���' � -� �&���� �$
=9
1=9
1�=9
.=9
�=9
7=9
/=9
��
;�
�<
��
<"*
����� ������ � ������ ���*������� �D > >
( &��������� � &����������(&���������������3� �����������
(&������������ ������������
(&���������� ��������������
� &���������������
(&�������������� �( &����������
(&����������( &�������������(&������(&�����������������=( & ?,�����������(&�����������(&���������� �����������(&������ �( &���������������3����+�������@������������
-�0-�0-+0-�0-�0-*0-30-�0
-�0-�0-+0-�0-�0-*0-30-�0
Fig. 12.- Selected calcareous nannofossil main biovents across the K/P boundaryinterval at Zumaia section.

With regard to Paleocene samples, we think that most of the Cretaceous species found in thesesamples are surviving ones. We do not agree with Smit (1982, 1990) and Olsson et al. (1999) who sug-gested that only one or very few species survived the K/P boundary extinction. Our opinion is basedmainly in the following observations: (1) it should be pointed out that not only in the sections of thisstudy but also in Caravaca, Brazos River, El Kef, etc., upper Maastrichtian foraminifers consistentlyoccur at the base of the Paleocene; it would be intriguing to think that reworking processes would workin the same way for the same intervals in all these sections; (2) it is still more significant to realize thatmost of the Cretaceous species found in the base of the Paleocene are always the same in all the sec-tions and that, furthermore, their stratigraphic distribution or temporal extinction at the beginning ofthe Paleocene is always very similar in all of them; (3) on the other hand, if they are reworked speci-mens it is difficult to explain why most of the species are the small-sized and thin-walled ones and notthose with a solid test and thick-walled; and (4) finally, it is important to indicate that most of the plank-tic foraminifers considered to be surviving species are smaller in the basal Paleocene samples than theywere in the latest Cretaceous ones.
The 30 surviving species progressively disappear along the Civisina euskalherriensis and P.pseudobulloides biozones. In the lower Paleocene samples we have recognized 16 Paleocene species,three that first appear in the Gb. cretacea biozone, nine that first occur through the Civisina euskalher-riensis biozone and the other four that first appear in the P. pseudobulloides biozone.
These results partially agree with Smit’s idea in the sense that all the species of the end of theMaastrichtian reach the K/P boundary, where they suffer a sudden extinction. On the other hand, thereare a high number of species surviving the extinction which mainly affected the less cosmopolitanspecies.
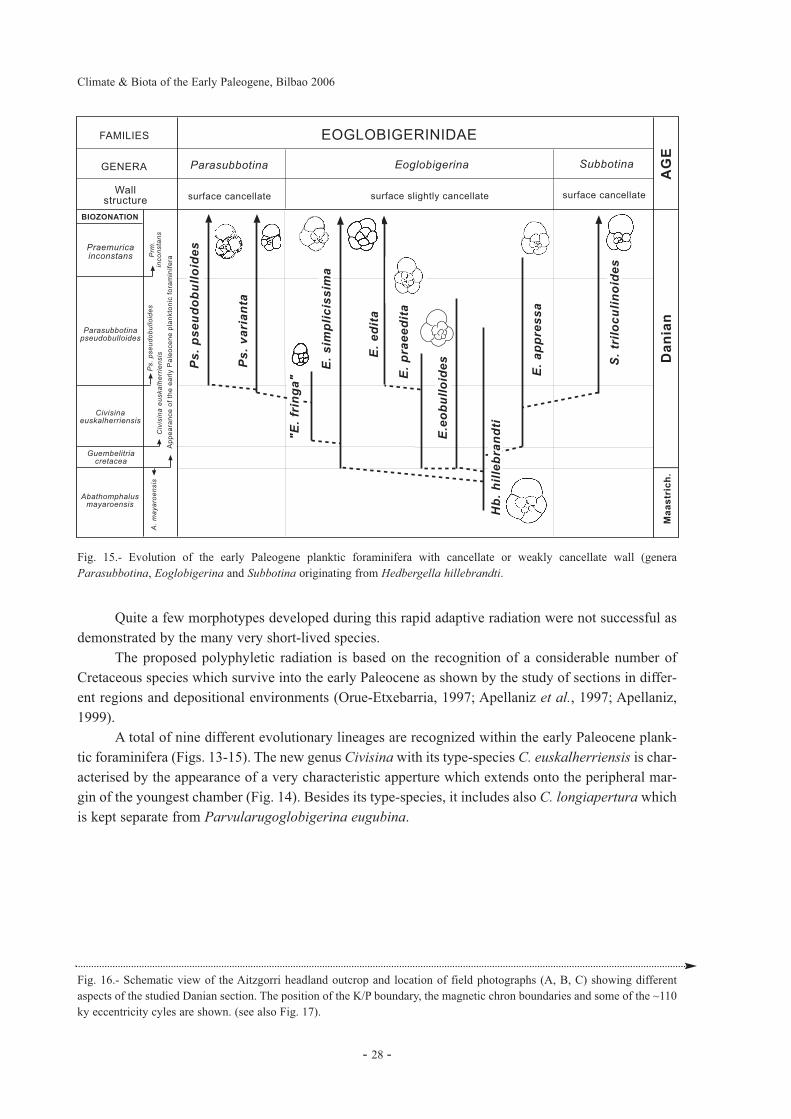
The extinction of more than half of the species of the end of the Cretaceous was probably causedby the impact of, at least, one extraterrestrial bolide. This statement is reinforced by the relationshipbetween the moment of the extinction and the appearance of the impact markers. Larger-sized species(i. e., G. arca or Pst. deformis), or even some small ones, initially survived to the environmental stressconditions at the beginning of the Paleocene by becoming smaller, but they later suffered a terminalextinction since they were not able to further adapt themselves to the new stressful conditions createdby the impact. On the other hand, some small-sized surviving species, which were able to endurestressful environments, suffered a phyletic extinction evolving towards forms that would occupy theecological niches left empty after the boundary extinction. Based on data we now have (Apellaniz etal., 2002) both from the Basque Basin and elsewhere, we can affirm that all or almost all the speciescharacteristic of the beginning of the Paleogene did evolve from surviving Cretaceous forms, but froma number of species notably higher than that suggested up to now (Fig. 13-15).
2.5. Evolution of the early Paleogene planktic foraminifera (E. Apellaniz, X. Orue-Etxebarria, H.Luterbacher)
Evolutionary trends in planktic foraminifera across the K/P boundary are very well documentedin numerous surface sections of the Basque Country (Western Pyrenees). Apellaniz et al. 2002 pro-posed a phylogeny of the early Paleogene planktic foraminifera which was somewhat more complexthan those suggested by previous authors. They favour a polyphyletic radiation which starts after thefaunal crash at the Cretaceous/Paleogene boundary from the surviving populations of Hedbergella spp.,Heterohelix (s.l.) spp. and Guembelitria spp. which show considerable morphologic variability (Figs.13-15). These morphotypes which lived in the K/P ‘Strangelove’ocean (Zachos et al., 1989) underwentimportant and maybe in part heterochronous morphologic changes in their attempt to occupy ecologi-cal niches emptied by the mass extinction at the end of the Cretaceous.
Climate & Biota of the Early Paleogene, Bilbao 2006
- 26 -

The Paleocene and lower Eocene of the Zumaia section
- 27 -
E������/
J���3�
:�-��8�� �
���
���
���
��������
�2��:J9����������� J9�������3����� �:J�:��J�3������
��� �'���$� ��� %���$� ����� )������'��� % �$�������
������� �������� ����������������� �� �' �����
��������!�����
��������������������
���������
��������������
"�������
"���������
#������������
"��������
"������$��������
"���������
�!�
��"
����
����
���
!��
����
����
��!
�&��
���$
� �
����
��(
����
����
�+�
����
����
���
���
���
�� �
��'�
���
����
��
����
���
�5�
����
� �
���
����
��������������������
%�&"&�� �&�
������$$�����&�����$� �����
��(��������+� ����������
%���$� �������������
�$�����&�� ����"��������
E������
J���3�
K�����������
���
���
���
)������+�
,
�:J�:��J�3������
��(����� ����������
���� ���� ��� ���������������
�������������
������������������
�����/F�3������
% �$����� ���
��������� �'
�����������%����������
"�����������
"��������������
"����������������
&���������
&�������������������
&�������������
�!�
��"
����
����
���
!��
����
����
��!
�&��
���$
� �
����
��(
����
����
�+�
����
����
���
���
���
�� �
��'�
���
����
��
����
���
�5�
����
� �
���
����
��������������������
%�&"&�� �&�
������$$�����&�����$� �����
��(��������+� ����������
%���$� �������������
�$�����&�� ����"��������
&�����������
���(� �.��'�' !
��������
Fig. 13.- Evolution of the early Paleogene planktic foraminifera with perforate wall (except species of the genusParvularugoglobigerina) originating fom Heterohelix spp., Guembelitria cretacea and Guembelitria trifolia.
Fig. 14.- Evolution of the early Paleogene planktic foraminifera (genera Parvularugoglobigerina, Globanomalina andPraemurica) originated from Hedbergella holmdelensis.
Quite a few morphotypes developed during this rapid adaptive radiation were not successful asdemonstrated by the many very short-lived species.
The proposed polyphyletic radiation is based on the recognition of a considerable number ofCretaceous species which survive into the early Paleocene as shown by the study of sections in differ-ent regions and depositional environments (Orue-Etxebarria, 1997; Apellaniz et al., 1997; Apellaniz,1999).
A total of nine different evolutionary lineages are recognized within the early Paleocene plank-tic foraminifera (Figs. 13-15). The new genus Civisina with its type-species C. euskalherriensis is char-acterised by the appearance of a very characteristic apperture which extends onto the peripheral mar-gin of the youngest chamber (Fig. 14). Besides its type-species, it includes also C. longiapertura whichis kept separate from Parvularugoglobigerina eugubina.
Climate & Biota of the Early Paleogene, Bilbao 2006
- 28 -
Fig. 16.- Schematic view of the Aitzgorri headland outcrop and location of field photographs (A, B, C) showing differentaspects of the studied Danian section. The position of the K/P boundary, the magnetic chron boundaries and some of the ~110ky eccentricity cyles are shown. (see also Fig. 17).
Fig. 15.- Evolution of the early Paleogene planktic foraminifera with cancellate or weakly cancellate wall (generaParasubbotina, Eoglobigerina and Subbotina originating from Hedbergella hillebrandti.
E������/
J���3�
K�����������
���
���
���
)������+�
,
�:J�:��J�3������
������$$����� ��' �$�'����� �$$�����
��������������� ����������-'������������&����������������
&��������
'�������������
('�������(
'������
'��������
)���������������
�!�
��"
����
����
���
!��
����
����
��!
�&��
���$
� �
����
��(
����
����
�+�
����
����
���
���
���
�� �
��'�
���
����
��
����
���
�5�
����
� �
���
����
��������������������
%�&"&�� �&�
������$$�����&�����$� �����
��(��������+� ����������
%���$� �������������
�$�����&�� ����"��������
���������������
������������
'���������
'����������

3. CYCLO-, MAGNETO- AND CALCAREOUS PLANKTON BIOSTRATIGRAPHY OF THEDANIAN LIMESTONE
3.1. Magnetostratigraphy of the Daniam Limestone (J. Dinarès-Turell, J.I. Baceta, V. Pujalte)The intensity of the Natural remanent magnetization (NRM) of the 1992 samples collected for
the magnetostratigraphic analysis of the Danian of the Zumaia section (Figs. 16-17) was generallyaround 1x10⁻³ A/m although it was lower for some of the whitish-coloured carbonate-rich beds. Threemagnetization components can be recognized in most samples upon demagnetization, in addition to aviscous magnetization removed below 100-150°C. Component H conforms the ChRM and has eithernormal or reverse polarity in bedding-corrected coordinates. Before bedding-correction, component Hhas a steep inclination not compatible with a Paleocene to recent geomagnetic field direction, whereasthe mean ChRM inclination after bedding correction is near the expected Paleocene inclination for thesite paleolatitude.
The ChRM declination, inclination and VGP latitude together with relevant biostratigraphicand lithologic information for the studied section is shown in Fig. 17. Taken the K/P boundary, knownto occur in the upper part of chron C29r, as the starting point, the succession of magnetozones at
The Paleocene and lower Eocene of the Zumaia section
- 29 -

Zumaia can be straightforwardly correlated to the standard GPTS. Six reversal boundaries are unam-biguously identified at a bed level. Within chron C26r, a few samples with positive VGPs that delin-eate two short normal zones that may represent cryptochrons are identified (Fig. 17).
3.2. Cyclostratigraphy of the Danian Limestone (J. Dinarès-Turell, J.I. Baceta, V. Pujalte)In order to evaluate sedimentary-forcing mechanisms from the lower Paleocene strata, a litho-
logic coded series has been generated at intervals of 1 cm and studied with spectral analysis. A bed-by-bed lithologic log was created in the field and the GSA Rock Colour Chart (based on the Munsell®colour system of Hue/Value/Chroma codes) was used to estimate the colour of all limestone beds.Marlstone beds are mostly reddish in colour. Limestone beds can be grouped in three colour categories(reddish, pinkish and whitish), which have a clear relation to carbonate content (red colour decreaseswith relative high carbonate content). In addition to the bedding stacking information in terms of lime-stone/marl lithology, the arbitrary coding for the lithologic series takes into account the colour of thebeds as follows. Limestone beds have been given a value of 90, 60 or 40 depending whether they werewhitish, pinkish or reddish in colour respectively. Marlstone beds have been given a value of 10 or 20depending on the field appreciation of their relative carbonate content. A value of 20 has been alsoassigned to corresponding marly bed partitions within crowded bundles. Consequently, the evenlyspaced (1cm) constructed lithologic series ranges from 10 to 90 and represents an approximation to acarbonate proxy record.
Standard (Fourier) spectra were calculated for the lithologic-coded series. For that use and forfiltering purposes, the software package “AnalySeries” has been employed. The Continuous WaveletTransform (hereafter CWT) has also been applied to analyze the time evolution of the spectral powerand to test its statistical significance. For nonstationary time series, the CWT can be particularly use-ful to unravel and document periodicities that might be present at different times (i.e. localization ofperiodicities), related, for instance, to variations of the sedimentation rate or to detect (temporal) dis-continuities of the accumulation. The CWT has been chosen as it is proven superior to the windowedFourier transform, given its inherent multi-scale character.
The stacking of hemipelagic marlstone and limestone lithologies at Zumaia defines a cyclic (orrhythmic) bedding pattern (Figs. 16, 18). The basic noticeable cycles are the bedding couplets, whichconsist of alternating pairs of marl and limestone beds in different relative proportions or by a verticalvariation in carbonate content within marl or limestone intervals. Thickness of these couplets rangesfrom 15 to 45 cm (average of about 25 cm). The limestone/marl couplets can in turn be grouped intobundles usually containing 4 to 6 couplets. A whole range of bundles has been observed. These includeopen bundles where usually all the constituent couplets retain their marly and lime portions (i.e. bun-dles E6-E8 in Fig. 16C), and crowded bundles which, in contrast, almost lack recognizable the marlypartitions between limestones (i.e. bundles E23-E29 in Fig. 16B). The thickness of the bundles dimin-ishes from open (maximum thickness of ~2 m) to crowded ones (minimum thickness of ~60 cm) withan average of about 1.2 m. The precession (~21 kyr average periodicity) and eccentricity (~100 kyr)origin for the couplets and bundles is roughly confirmed when the duration of magnetozones and bios-tratigraphic intervals retrieved in the Early Paleocene segment are compared to standard time-scales.
Spectral analysis of the coded series was first performed in the depth domain (Fig. 19). Theresults using the Blackman-Tukey method, which is based on the standard Fourier transform, revealspectral peaks in the frequency band at 21-26-31 cm and 83-122 cm that correspond to the averagethickness of the basic lithologic couplet and bundle cycles respectively (Fig. 19A). The filtered recordof the 1.22 m component follows well the stacking pattern of bundles. The difference in bundle thick-ness is probably indicative of varying sedimentation rates along the section. The global wavelet spec-
Climate & Biota of the Early Paleogene, Bilbao 2006
- 30 -

trum (Fig. 19B) shows significant peaks at periods of 30 cm and 1.22 m that are comparable to the onesdetected with the Blackman-Tukey method that correspond to the ~21/kyr precession and ~100 kyr
The Paleocene and lower Eocene of the Zumaia section
- 31 -
��������� ���� ��� ��
��
�
�
�
�
�
�
�����
�
�������
��������
���
�� ����
���������
����������� � ��
�
�
��
��
��
��
��
��
��
��
��
��������� � !�"������
#�����$��%&�������'���()*
�+� ��� ��� � ��
������������� �������
������ �� ������� �� ��
� ������ ������������
�������������� �� �
���������������������
��������������� ��� ��
��������� ���� �� �
� �������������� �� �
��������� �� ��������������� ��� �
� ������������� ������� ��� �
� ���������� ��� ��� �
� ������� �����!������� ��� �
��,�
��,�
��,�
��,�
��,�
��,�
��,�
��,�
��,�
��,�
����
����
����
����
����
����
���
!�- .$��(��*
����� ���������� ���
� ������"� ���������
�
�
�
�
�
�
�
��
��
��
�
�
�����!� ����
��
���
��
�!
�
��
��
��
��
�
�
��
��
�!
�
��
��
!
��
Fig. 17. Stratigraphic variations of declination, inclination of the ChRM vectors and virtual geomagnetic pole (VGP) latitudeplotted on a lithologic log where main biostratigraphic events and position of paleomagnetic samples are indicated. Open cir-cles denote unreliable data and crosses mark the position of samples that have provided no data. Correlation to the GPTS isprovided.

eccentricity cycles respectively. In addition, a longer period peak at 4.4 m is also obvious. This periodmost likely corresponds to the 404-kyr eccentricity cycle. Recent long-term numerical simulations ofthe orbits of the major planets in our solar system (Varadi et al., 2003) has enabled an accurate Earth’sorbital eccentricity time series (Va03_R7 solution) to be computed back to 110 Ma with restricted accu-racy beyond the past 50 Ma. More recently Laskar et al. (2004) have also provided a full integrated tar-get orbital solution.
For orbitally tuning “floating” geologic records, one should ideally use the single and more sta-ble long eccentricity cycle of 404-kyr period. The corresponding peak of this cycle in the depth domaindoes not seem to be clearly present and persistent in the Zumaia lithologic coded series (see above).However, we note that the strongest localization of this peak in the 33-43 m interval (Fig. 19) includestwo obvious thick whitish (carbonate-rich) bundles (E35 and E36) that conform a maxima in the cor-responding 4.4 m filter output as previously noted. Another interval of high amplitude in the 4.4 m fil-ter output (and significance of this period in the local wavelet) occurs towards the base of the sectionwhere several carbonate-rich bundles exist. The time span between these two intervals can roughly beestimated to be about 2.8-3.2 Ma (by counting the ~100-kyr eccentricity bundles or the number of max-ima in the 4.4 m filter output and assumed to correspond to the 404-kyr eccentricity cycle). This is con-sistent with the long-term eccentricity cycle of ~2.4 Myr period which defines modulation nodal pat-terns of ~2.0 Myr and ~2.8 Myr. When examining the Va03_R7 eccentricity solution for the time inter-val 61-66 Ma, it is found that two such nodes of low eccentricity amplitude exits at ~62.1 Ma and ~64.9Ma resulting in a 2.8 Myr modulation cycle (Fig. 20) (note that low-amplitude ~100-kyr eccentricityresults in a high- amplitude 404-kyr eccentricity). A direct tuning of the Zumaia section to the Va03_R7eccentricity solution can therefore be attempted by matching the intervals of high significance of the4.4 m period to the nodes of the ~2.8 modulation cycle as the starting point. The node towards the baseof the section is less obvious and could also be marred by long-term effects of the K/P boundary (i.e.,nannofossil abundance does not recover until 12 m above the K/P boundary). The obvious carbonate-rich bundles E35 and E36 from the upper interval appear more suitable for correlation. The phase rela-tionship between the sedimentary record and the astronomical target needs first to be established. Weassume that relatively carbonate-rich intervals correspond to eccentricity minima as usually found in
Climate & Biota of the Early Paleogene, Bilbao 2006
- 32 -
Fig. 18.- Key features of the lithologic stacking pattern for the Paleocene Zumaia section.

marine pelagic records. Consequently, the center of bundles E35 and E36 are correlated to consecutiveeccentricity minima that define a distinct minimum in the 404-kyr eccentricity cycle around 62.35 Ma(Fig. 20) as a start in our tuning. The tuning procedure continues by matching successive bundles to
The Paleocene and lower Eocene of the Zumaia section
- 33 -
�
�������
��������
�
�
! �
�������������
�
�
��
��
��
��
��
��
��
��
��
#�����$��%&�������'���()*
���
� ������������
�,���)
/��),�%�0��
1��2��� �(� ���#��)*
� �� � ��
��������������� ���!
34
�����
���� �
�������������"�� ���!
!�����(�)*
��������+���������� +
/��),�%�0��
�,�� �,�� �,���
�,�
�
�,�+�5
��5
�����#�
��������+���������� +
!�����(�)*1���������%���� +��
����
����� ������
�
�
�
�
�* �*
Fig. 19.- (a) Lithologic column, coded lithologic series and filter outputs (Gaussian fil-ter centred on 1.22 m (0.8197 ±0.4m-1 bandpass) and 4.4 m (0.2272 ±0.05 m-1 band-pass) on a stratigraphis scale. At the bottom is shown the power spectra (Blackman-Tukey method with a Barlett window) of the coded lithologic series where the bandwidth(BW) and the period of relevant peaks are given. (b) local wavelet power spectrum of thecoded lithologic series using a Morlet wavelet. The colored contours are at normalizedvariances of 2, 5, 10 and 20. The thick white contours enclose regions of greater that 95%(dashed) and 80% (continuous) confidences for a red-noise process with a lag-1 autore-gressive process plotted only for periods greater than 64 cm. Cross-hatched regions oneither end indicate the “cone of influence” where edge effects become important (seeTorrence and Compo, 1998). The global wavelet spectrum for the entire series is shownat the bottom.

Climate & Biota of the Early Paleogene, Bilbao 2006
- 34 -
"�������,�(�,��+,����*
)� )�6
�
�
�
7
+
"��&���$ ����
�
�
�
�
�
�
�
��
��
��
�
�
�����!� ����
��
���
��
�!
�
��
��
��
��
�
�
��
��
�!
�
��
��
!
��
��
��
��
��
��
��
����897����,�(��������*�
.$��(��*
)� )�6
�� +����������� ���� ��� ��
:�� ���
������#����������������������� ���$��%&�'
���� ������!
�
��
��
��
��
"������,�(+,�����,�����*
.$��(��*
�����
%�������������#&���)�#������# )� )�6
��,777���
��,�77���
��������������
�
�
��
��
��
��
��
��
��
��
��
#�����$��%&�������'���()*
"��������,�(��������*�
Fig. 20.- Tuning of the lithologic bundles (E-cycles) to eccentricity minima in the eccentricity time series of solution Va03_R7[Varadi et al., 2003]. Corresponding 404-kyr eccentricity minima are shaded. Two equivalent time slices of the eccentricitytime series of solution La93 (Laskar et al., 1993) with an envelope around eccentricity minima and maxima are plotted forcomparison. The two La93 solution time slices have been chosen to anchor on two nodes of low eccentricity amplitude in theVa03_R7 solution. Initial tuning matches the two carbonate-rich bundles 35 and 36 to consecutive eccentricity minima thatconform a minimum in the 404-kyr eccentricity cycle related, in turn, to a node of low eccentricity amplitude of the ~2.4 Myreccentricity modulation. The new Laskar La04 orbital solution is also shown.

successive eccentricity minima in the Va03_R7 solution (Fig. 20). For comparison purposes two time-slices of the La93 solution containing an equivalent ~2.8 Myr modulation cycle are plotted in Fig. 20in addition to the most recent La04 solution.
In order to be more useful we compute elapsed time (as opposite to absolute ages) and estimateduration of chrons and relative ages for bioevents by both cycle counting precession cycles and by theeccentricity-based tuning to the Va03_R7 orbital solution. A cycle-tuned duration for the different EarlyPaleocene chrons from C29r to C27n at Zumaia is presented in Table 1
3.3. Planktic foraminifera biostratigraphy of the Danian Limestone (X. Orue-Etxebarria, E.Apellaniz)
All studied samples contained planktic foraminifera although the content was variable with thepoorest at the K/P boundary clay (200-300 specimens/g and smaller than 100 um). Higher in the sec-tion, the richness, diversity and size of planktic foraminifera increase gradually, allowing the separa-tion of more than 500 specimens per sample.
The distribution of species at Zumaia (Fig. 21) largely coincides with that pro-posed in the stan-dard biozonation although some significant differences have been detected. Firstly, the highest occur-rence (HO) of Parvularugoglobigerina eugubina was recognised 5 cm above the lowest occurrence(LO) of Parasubbotina pseudobulloides, which in turn coincides with the LO of Subbotina triloculi-noides and other significant species such as Eoglobigerina edita or Globoconusa daubjergensis.Secondly, the LO of Globanomalina compressa is clearly older (4.52 m stratigraphically below) thanthe LO of Praemurica inconstans-trinidadensis. The same biostratigraphic circumstances have alsobeen observed in higher-resolution studies of other Lower Paleocene sections from the westernPyrenees such as Sopelana and Bidart (Apellaniz et al., 1997; Apellaniz, 1998), which raises questionson the validity of the criteria used by Berggren et al. (1995) to establish the Pa/Pl and Plb/Plc biozon-al boundaries. Consequently, we kept the criteria used in an earlier work by Berggren and Miller (1988)that use the first appearance datum (FAD) of Ps. pseudobulloides and the FAD of Pr. inconstans-trinidadensis to define the Pa/Pl and Plb/Plc boundaries respectively. Likewise, the coincidence of theLOs of Ps. pseudobulloides and S. triloculinoides, which are older than the HO of P. eugubina, makesit impossible to differentiate the P1a and Plb subzones as proposed by Berggren et al. (1995) andBerggren and Miller (1988).
The Paleocene and lower Eocene of the Zumaia section
- 35 -
Chron CK95 ODP Sites 1001A, 1050C Rohl et al (2001)
Bjala (Bulgaria) Preisenger et al., (2002)
Zumaia Dinarès-Turell et al. 2003
Duration (kyr) Cycles Durationa (kyr) Cycles Durat.a (kyr) Cycles Durationa (kyr) C29r_Pal. 245 ~14 300 11 231 12 252 (228) C29n 769 ~32 670 31 651 38-39 796-819 (879) C28r 342 - 9 189 12-13 252-273 (210) C28n 1135 - 54 1134 49 1029 (1089) C28 1477 1280b 63 1323 61-62 1287-1302 (1228) C27r 1223 23-25 obliq. 929-1010 44 924 50 1050 (964) C27n 356 11-13 obliq. 444-525 10 210 11 231 (273) C27 1579 36 obliq. c ~1450 54 1134 61 1280 (1248)
Table 1Cycle-tuned estimates for the duration of Early Paleocene chrons. Cycles refer to precession otherwise is specified.
a) Applying a modern mean precession and obliquity periods of 21 kyr and 40.4 kyr respectively). Duration in brackets is fromthe eccentricity-based tuning to the Va03_R7 astronomical target.b) Estimated assuming an intermediate spreading rate (16.7 km Ma-1) for C28 (interpolated from the South Atlantic magnet-ic anomaly profile.c) Cycle counting in Hole 1001A indicates 47 precession cycles + 11 obliquity (obliq.) cycles for C27.

The P1/P2 and P2/P3 biozones can be identified unambiguously at Zumaia because the speciesthat define them (Praemurica uncinata and Morozovella angulata respectively) are abundant sincetheir first occurrence. Finally, it is worth noting that due to the loose sample spacing in the upper partof the studied section, the LO of Igorina albeari, a datum that defines the P3a/P3b subzone accordingto Berggren et al. (1995), cannot be precisely determined.
3.4. Calcareous nannofossil biostratigraphy of the Danian Limenstone (G. Bernaola)Preservation and abundance of calcareous nannofossils vary along the section in a similar way
to the planktic foraminifera. Calcareous nanno-fossil abundance is low (0.77 specimens/field of view,spp./f.v.) in the marly interval above the K/P boundary and progressively increases along the first 12 mof the Danian limestones where it reaches similar values to those observed in the uppermost Cretaceous(~5 spp./f.v.). The nannofossil abundance keeps constant, or increases slightly, up to the marl-limestoneto reddish marl transition at 49 m, where it increases sharply with values of 22 spp./f.v. at the base ofthe reddish marls (Fig. 21).
In accordance with the vertical distribution of the calcareous nannofossil species, we recognisedat Zumaia the first five biozones of the biostrati-graphic scale of Martini (1971) (Fig. 2l). It is impor-tant to point out that to establish the NP1/ NP2 and NP2/NP3 biozone boundaries we considered themodifications introduced by Perch-Nielsen (1981, 1985) based on the taxonomic clarifications ofRomein (1979). The NP1/NP2 is consequently defined by the LO of Cruciplacolithus primus (large)(and not the LO of Cr. tenuis) whereas the NP2/NP3 boundary is defined by the LO of Cr. edwarsii(and not the LO of Ch. danicus). The precise location of all the zonal boundaries is shown in Fig. 21.The NP3/NP4 and NP4/NP5 boundaries are defined by the LO of Ellipsolithus macellus andFasciculithus tympaniformis respectively (Martinii, 1971). Although E. macellus appears discontinu-ously during the first 16 m after its first appearance (Fig. 2l) we think that its LO at 23.95 m is reliablesince it is very close to the LO of Neochiastozygus saepes (occurring at 25.75 m at Zumaia), used athigh latitudes to approximate the NP3/NP4 boundary (Perch Nielsen, 1979). The first occurrence of F.tympaniformis at 50.5 m is similar to that reported by von Salis in Schmitz et al. (1997). We also notethat the LO of Neochiastozygus perfectus, which in North Sea sections first appears just below theunconformity separating Danian and Selandian deposits occurs 150 cm below the first record of F. tym-paniformis (Thomsen, 1994).
Climate & Biota of the Early Paleogene, Bilbao 2006
- 36 -

The Paleocene and lower Eocene of the Zumaia section
- 37 -
()*()+,-./��)��-0-//1*/
� �
� �
� �
� �
� �
������������� �
#������ ���
����������� �����
������
���
$��
������������
�����
�������
�$�������
�������
������������
%�$
����
�����
��������$
�
��$�������
#������������
%�$
�����!����
���� �����!���
��
������� �
%�$
������
��
�$����
��
���
"#$%�&"
'(�
)��&"
$������*��!��
���+�����,
%���-.�
������*��!��
/�%���-.�
������*��!�
��������������������
�����������������������
"%&0(&"1("23('42(��
��
5�
��
�
��
��
��2� �
*)�341(�0-+)'1�10,+/
����
�����
����������
����
���
&����'�����
���
��������� ����
������ ��
������
& �����������
��������
���������������
���
%�����������
������ ���
�����
���������
��& ����$��
�����
������ �
��� ��������
������ ��
���"� ������
���
���"� ������
���
"#$%�&"
'(�
)��&"
'��������/
�$�������!��
'������������ ���!!
��������������������
�����������������������
"%&0(&"1("23('42(��
��
5�
�� ������ �����+���� �����
��6
��
6
782
782��������,����,���,��
��
�
�
�
�
�
�
�$�
�
�������
��������
���
�� ����
���������
Fig. 21.- Selected calcareos nannofossil and planktonic foraminifera species distribution across the Danian Limestone of the Zumaiasection. 1-7 and a-d Planktonic foraminifera and calcareous nannofossil biovents as shown in fig. 17.

4.- THE MID-PALEOCENE INTERVAL AT ZUMAIA
4.1. An overview (J.I. Baceta, G. Bernaola)The mid-Paleocene represents one of the most interesting intervals of the Zumaia section, as it
includes abrupt lithologic changes, a short-term episode of remarkable paleoceanographic change, andone of the most complete records of the main biostratigraphic events and magnetic reversals that tookplace during the late Danian-middle Thanetian time span. Some of these attributes were alreadystressed in several previous works on the section (e.g. Pujalte et al., 1993, 1995 and 1998; Arenillas,1996, Baceta, 1996, Schmitz et al., 1998; Dinares-Turell et al., 2003, Bernaola, 2002, Baceta et al.,2004), although they have been overshadowed by the more striking events associated to theCretaceous/Paleogene and Paleocene/Eocene boundaries. A raising interest on some of the biotic,oceanographic and even astronomic signals across the interval and the need of a formal decision aboutthe internal subdivision of the Paleocene epoch, have prompted a detailed re-inspection of the mid-Paleocene of the Zumaia section. In fact, it has been proposed as a firm candidate for the definition ofthe GSSP's of the Danian-Selandian and Selandian-Thanetian boundaries (see www.stratigraphy.org/gssp.htm) and, under this perspective, the field trip will deal on the main results obtained in ongoingstudies and the initiation of the discussion about the most suitable criteria.
For a better understanding of the time interval involved, the mid-Paleocene is considered in thisand following sections as the stratigraphic interval comprising from the reversal defining the top of themagnetochron 27n (upper Danian) to the NP6-NP7 zone boundary (Fig. 22), just a few metre upwardsfrom the reversal at the base of magnetochron 26n (lower? Thanetian). This interval is nicely exposedin the cliffs along the southern half of the Itzurun beach (Fig. 23), which will be firstly observed fromthe distance from the cliff top and later analysed in detail at the cliff base. The San Telmo chapel rep-resents the best reference point for the two stops; it is a small construction overlooking the beach, thanis easy to recognise by being resting just on the cliff edge.
4.2. Lithostratigraphy (J.I. Baceta, G. Bernaola, J. Arostegi)The mid-Paleocene succession at the Itzurun beach is 48m thick and occurs dipping 40-60º to
the NNE. The outcrops have a similar orientation and thus offer a continuous dip section, only inter-rupted by the presence of three fault systems (F1 to F3 on Fig. 23). These are normal faults with asso-ciated normal and reverse faults and joints, that in the case of F2 and F3 have duplicate significantintervals of the succession. A careful correlation of distinctive beds in the hangingwalls and footwallsof the fault systems has allowed a detailed reconstruction of the stratigraphy of the mid-Paleocene suc-cession and its more representative intervals (Fig. 22).
Stratigraphically, the mid-Paleocene comprises the upper part of the Danian Limestone(Apellaniz et al., 1983) and the lower-middle parts of the Itzurun Fm (Baceta et al., 2004). These twointervals are respectively 16 m and 32 m thick. The two units are mainly made up of regular alterna-tions of (hemi)pelagic indurated limestones, marlstones and marls. In the Danian Limestone theindurated limestones are dominant, whereas in the Itzurun Fm the proportions of the three lithologiesvary considerably. Additionally, they also include minor but significant amounts of thin-bedded tur-bidites, of siliciclastic, calcareous and mixed nature. The transition between the two formations ismarked by an abrupt lithologic change, which is interpreted as the expression of the prominent episodeof sea level fall that characterised the end of the Danian across the whole Pyrenean Domain (Baceta etal., 2004, Baceta et al. 2005).
Climate & Biota of the Early Paleogene, Bilbao 2006
- 38 -

The Paleocene and lower Eocene of the Zumaia section
- 39 -
�������������
������������������
����������
��������������
�������
������
����
�����
%�
#�
?
;#
;?
<#
<?
=#
=?
>#
>?
?#
??
"#
<"�
<C�*�����
*�����
���������������
�������������
�,���*�+�#�
(&"���������������
(& ��%������
(&�,������
(& ���������
��������
)��������
�'A
�'B
�'6
�'9
�'/
'7�
'7�
'/
�,�������
),�++�#��
�,�#�����
),
��3#����
��,���#����������
Fig. 22.- Integrated lithostratigraphy and biostratigraphy of the Mid-Paleocene of the Zumaia section. Biozonations: (a) Orue-Etxebarria et al. (this volume), (b) Berggren et al. (1995), (c) Bernaola (2002) according to Martini (1971).

For descriptive purposes, the Danian Limestone and Itzurun Fms can be subdivided in a seriesof informal members that can be easily identified in the outcrops. In the upper part of the DanianLimestone, largely of pink-reddish colours, two members named the "crowded" and the "stratified"intervals can be distinguished (Figs. 22 and 23). The crowded member is 7 m thick and consists of lime-stones amalgamated or with very thin marly interbeds. The stratified member, 9 m thick, takes its namefrom the good definition of the bedding and the clear contrast between limestones and interveningmarlstones, which occur forming some of the best examples of ca.100 ky eccentricity cycles identifiedin the section (see Dinares-Turell et al., 2003 and descriptions below). In the upper part, 4 m below thetop of the unit, are located the "Jan Smit beds", a distinct couple of beds named in honour to Prof. J.Smit, who was the first noting than these and other characteristic beds of the upper Danian Limestonecan be identified and correlated between Zumaia and the also well-known section of Hendaia I. Laterworks have demonstrated that the Danian Limestone can be correlated bed-by-bed across the wholebasin floor domain, including sections such as Sopelana, Trabakua, Monte Urko, Zumaia, Artadi andHendaia I and II (Baceta, 1996, Pujalte et al., 1998).
Climate & Biota of the Early Paleogene, Bilbao 2006
- 40 -
�
�
�
�
(�(.(7
*���-����
*���-����
��4#�#�(� ���������,(�
)'%�
+������������
������*���������
������*��������5��
�������
�������
������%
������
�������
Fig. 23.- Panoramic view and synthetic sketch of the Mid-Paleocene outcrops in the Itzurun beach, showing the distributionof the main lithological units/members and the three fault systems that disrupt the succession.
San Telmochapel

The sedimentologic features of the Danian Limestone are rather constant across the section. Thelimestones range in composition between 70-95% in CaCO3 and the marlstones between 40-65%, withclay minerals as subordinate component and traces of quartz, dolomite, plagioclase and Fe oxides andsulphides. The study of 18 samples from marly interbeds in the upper 12 m of the unit has revealed thatthe clay association includes illite (40-78%), smectite (7-15%) and chlorite/smectite mixed-layer min-erals (33-50%) and that kaolinite only occurs as a trace component in 3 samples. These results differsignificantly from those of Gawenda et al. (1999), which stressed that kaolinite occurs in proportionbetween 20-30%. In thin section, the limestone occur as burrowed micritic mudstone-wackstones withtests of planktic foraminifers and rare calcispheres. Trace fossils are very common in both marlstonesand limestones, mainly corresponding to Planolites, “Thalassinoides” and occasional Zoophycus. Theupper part of the unit also intercalates two levels 1-3 cm thick of calcareous turbidites, largely com-posed of tests of planktic foraminifers. Other turbidite levels within the Danian Limestone also includesignificant amounts of fragments of shallow benthic biota, such as red algae, benthic foraminifers andcorals, indicating that although being located in a distal position the Zumaia section received resedi-mented material from the shallow platform areas.
As mentioned above, the boundary between the Danian Limestone and the Itzurun Fm is markedby a distinct lithological change, from limestone- to marl-dominated, that creates a distinct retreat ofthe cliff face. This change is associated to a progressive but rapid 30-40% decrease in CaCO3 in boththe hard (limely) and softer (marly) beds. However, it is important to note that this lithologic boundarydoes not imply any important change in the clay mineral assemblages. Based on calcareous nannofos-sil age estimations and detailed mapping, this important lithologic boundary can be correlated with theprominent discontinuity that segments the Paleocene succession across the slope and shallow platformdomains, known as the mid-Paleocene unconformity (Baceta et al., 2001 and 2005). This discontinu-ity developed as a consequence of a prominent sea level fall, both in time and magnitude, leading tothe subaerial exposure of the Paleocene carbonate platforms during an interval estimated in about 2.5My (Baceta et al. 2005). According to this correlation, the rapid decline in carbonate detected at the topof the Danian Limestone in Zumaia and other coeval section of the basin floor is interpreted as aswitch-off in the support of fine-grained carbonate sediment (micrite) from the carbonate platforms tothe open sea (Baceta et al., 2004). The biostratigraphic analysis and detailed correlation betweenZumaia and the sections of Artadi and Trabakua indicate that there is no significant stratigraphic gapassociated to the Danian Limestone-Itzurun Fm boundary and, consequently, the marked lithologicchange must be viewed as a correlative distal conformity of the mid-Paleocene unconformity.
The 32 m thick interval of the Itzurun Fm considered here shows higher vertical variations inboth the relative proportion of (hemi)pelagic sediments and the amount of turbidite intercalations. Itcomprises the lower two informal members in which can be subdivided the formation (members A andB), of 24 m and 52 m in thickness, respectively (Fig. 22). The member A is largely dominated by marlylithologies, whereas the member B includes significant proportions of indurated limestones. Theboundary between the two members has been established arbitrarily at the point in which limestonesbeds reach and maintain values in CaCO3 higher than 60%. In contrast to the Danian Limestone, darkto light grey colours dominate across the Itzurun Fm. However, the base of the formation is defined bya 5.5 m thick interval of marls and marlstones of a characteristic red colour (the red marl, Figs. 22 and23), which records a decrease in the thickness of the sedimentary couples of about 25-30%. This isinterpreted in terms of a significant drop in the sedimentation rate, linked to the prominent mid-Paleocene drop of sea level identified across the Pyrenean Basin.
The Paleocene and lower Eocene of the Zumaia section
- 41 -
On the great scale, the members A and B of the Itzurun Fm record a progressive increase inCaCO3 after the abrupt decrease that labels its lower boundary, culminating in the upper part of mem-ber B with values similar to those in the Danian Limestone. The composition of the limestones in theItzurun Fm is rather similar to those in the underlying Danian Limestone (micritic mudstone-wack-stones with planktic foraminifers), but occasionally they also contain minor amounts of silt-sizedquartz and glauconite, this later as sub-mm grains and infilling the foraminiferal tests. 18 and 16 sam-ples from the members A and B, respectively, have been analysed to determine the clay mineral asso-ciations in the Itzurun Fm. They have reavealed that the unit records a progressive change from illite-rich to illite/smectite-rich clays. Trace fossils are also common, but in this case the association is dom-inated by Zoophycus. Moreover, the Itzurun Fm differs from the Danian counterpart in the amount andtype of turbidite intercalations. In the marly member A they mostly are of siliciclastic nature, whereasin the member B, which shows a higher number, they are usually of siliciclastic or mixed carbonatic-siliciclastic nature. The carbonate grains mainly correspond to abraded tests of planktic foraminifers.The presence of fragments of red algae and large benthic foraminifers (nummulitids and orthophrag-minids) in several turbidites of the middle-upper part of the member B evidences that by this time theplatform areas were again submerged and were able to produce and export resedimented material to thebasin.
A few meter above the limit between the members A and B of the Itzurun Fm, a prominent re-entrant can be recognised in the cliffted outcrops. Its corresponds to a 1 m thick interval recording adrastic decrease in CaCO3, relatively high values in magnetic susceptivility that is interpreted as theexpression of the mid-Paleocene biotic event (MBPE, see Figs. 22 and 23 and description below).
4.2. Magneto- and cyclostratigraphy of the Mid-Paleocene interval (J. Dinarès-Turell, J.I. Baceta, V.Pujalte)
In order to locate chron C26n along the mid-Paleocene succession a total of 101 samples fromdifferent stratigraphic levels were sampled using a gasoline-powered drill or as oriented hand-samples.This study extends upwards the integrated magnetostratigraphy presented by Dinarès-Turell et al.(2003) and represents the completion of the entire Paleocene Epoch interval, for which now all mag-netic reversals are documented at a bed level, jointly with the uppermost Paleocene magnetostratigra-phy from Dinarès-Turell et al. (2002) (see also chapters 3.2 and 5.3 in this guide). In order to increasethe reliability of chron C26n position and its cycle duration along the magnetically weak (see below)mid-Paleocene interval, an additional section (Ibaeta) was also studied (23 sample levels). Naturalremanent magnetization (NRM) and remanence through all demagnetization stages were measuredusing a 2G-Enterprises high-resolution (45 mm diameter) pass-through cryogenic magnetometerequipped with DC-squids and operating in a shielded room at the Istituto Nazionale di Geofisica eVulcanologia in Rome, Italy.
In general, the intensity of the NRM was relatively low, around 4 x 10⁻⁴ A/m although it waslower for some of the carbonate-rich beds. Two magnetisation components can be recognized in mostsamples upon demagnetisation, in addition to a viscous magnetisation removed below 5 mT or 100º-150°C. Magnetic behaviour upon demagnetization was similar to the one documented for the upper-most Paleocene samples (Dinarès-Turell et al., 2002). Component H conforms the ChRM and haseither normal or reverse polarity in bedding-corrected coordinates (Fig. 24). Before bedding-correction,component H has a steep inclination not compatible with a Paleocene to recent geomagnetic field direc-tion, whereas the mean ChRM inclination after bedding correction is near the expected Paleocene incli-nation for the site paleolatitude. The VGP latitude together with the lithologic log for both the Zumaiaand Ibaeta sections is shown in Fig. 24.
Climate & Biota of the Early Paleogene, Bilbao 2006
- 42 -

The Paleocene and lower Eocene of the Zumaia section
- 43 -
42434445464748495051525354555657585960
��)
������7+�
��
��
��
��
��
��
��
�7
�+
��
��
��
���
��
�
� !��������
6162636465666768697071727374
��
��
��
��
��
�7
�+
��
��
��
��
��
��
��
��
�7
�+
��
��
��
��
��
��
��
��)
������7+�
��
��
��
��
��
��
��
�7
�+
� !��!�"��� ��
� !��������
���
��
�
���
��
�
� !��������
�"��� ��
��������#�
���
��������#�
65666768697071727374 64 63 62
�!3:
(�$���#*
(�$���#*
(�$���#*
:�� ���
:�� ���
Fig.
24.
- V
irtua
l ge
omag
netic
pol
e(V
GP)
lat
itude
and
lith
olog
ic l
ogs
for
the
Zum
aia
and
Ibae
ta s
ectio
ns.
The
posi
tion
of c
hron
C26
n an
d co
rrel
atio
nbe
twee
n bo
th s
ectio
ns is
sho
wn.
MPB
Ede
note
s th
e M
id P
aleo
cene
bio
tic e
vent
(see
cha
pter
4.8
in th
is g
uide
). O
pen
cir-
cles
den
ote
unre
liabl
e da
ta a
nd c
ross
esm
ark
the
posi
tion
of s
ampl
es t
hat
have
prov
ided
no
data
. The
num
berin
g of
the
ecce
ntric
ity (
110
kyr)
rel
ated
E-c
ycle
sfo
llow
num
berin
g fo
r un
derly
ing
stra
tath
at s
tarts
abo
ve t
he K
/Pbo
unda
ry a
sre
porte
d by
Din
arès
-Tur
ell e
t al.
(200
3).

The identification of the (~110 kyr) eccentricity related bundles (E-cycles) for the mid-Paleoceneinterval is shown in Fig. 24. Numbering of the E-cycles follows that of the underlying strata as report-ed in Dinarès-Turell et al. (2003) and in Fig. 20 in this guide. A calcium carbonate and low-field mag-netic susceptibility proxy records along the mid-Paleocene interval is currently under evaluation inorder to substantiate the cyclostratigraphic stacking pattern and long term quasi-periodic cycles withavailable orbital target solutions before attempting any tuning. However, a cycle duration of chron C26rand C26n and relative positioning of the Mid-Paleocene Biotic Event (MPBE) and biostratigraphicevents (see below) can be established. Cycle counting for chron C26r tentatively provides about 31eccentricyty ~110 kyr E-cycles or about 137 precession (~21 kyr) cycles. Chron C26n contains 11-12precession cycles and the MPBE is located ~8 precession cycles below the base of chron C26n in cor-respondence to an eccentricity maxima if the phasing between the lithologic cycles and the orbitalparameters hypothesized in Dinarès-Turell et al. (2003) for the lower Paleocene is correct.
4.3. Calcareous nannofossils assemblages across the Mid-Paleocene (G. Bernaola, Y. Nuño-Arana)The calcareous nannofossil assemblages recorded in the mid-Paleocene of Zumaia section are
well preserved, quantitatively rich and very diverse (Bernaola, 2002). Throughout the last 15 m of theDanian Limestone the assemblage is dominated by C. pelagicus, Pr. martini and Br. bigelowi thattogether with Sph. primus, Ericsonia spp., Pr. bisulcus and Tw. pertusus are the mayor components ofthe assemblage. In the uppermost Danian the calcareous nannofossil diversity is relatively high (S-H2,1 and 26-31 species per sample), especially if we compare it with that registered in the lower Danian(Bernaola, 2002). Althought the calcareous nannofossil assemblage do not show significant changesduring the upper Danian, few meters below the lithological change from the Danian Limestone to theoverlying red marls of the Itzurun Fm a relative abundance decrease of Br. bigelowi and Sph. primusand a relative abundance increase of Tw. pertusus is registered. In the upper 15 m of the DanianLimestone we have recorded the FOs of Sphenolithus primus, Ch. bidens, and the first specimens ofthe genus Fasciculithus (Fig. 25).
Nch. perfectus first occur in the last marly interval of the Danian Limestone. This finding couldbe important in the location of the Danian/Selandian boundary at Zumaia section as the FO of this taxonin Zumaia concurs with it first appearance in the uppermost part of Danian limestones in Denmark(Thomsen (1994). However, the most important calcareous nannofosil assemblage turnover across themid-Paleocene at Zumaia occurs in connection with the lithological change from the Danian Limestoneto the overlying Itzurun Fm. At this lithological change, we observe a significant increase in the totalabundance of calcareous nannofossils and, also, an abrupt decrease in the relative and total abundanceof Br. bigelowi, that changes from being abundant in the uppermost Danian Limestone (from 8 to 22%)to be very rare in the Itzurun Fm (Fig. 25). In connection with these assemblage changes, we also notethe diversification of the genera Fasciculithus (FOs of F. bitectus, F. janni and F. ulii) (Fig. 25).
In the red marl, the calcareous nannofossil assemblage is dominated by the same species that pre-vail in the Danian Limestone, with the exception of Br bigelowi. In this interval, besides the FOs of theabovementioned fasciculiths, we also observe the FOs of Ch. consuetus, F. billi and F. tympaniformis.The presence of F. bitectus F. janni and F. ulli is restricted to the red marl interval.
Close to the boundary between the red marl and the overlying grey marly beds, we observe aslight total abundace decrease in calcareous nannofossil but no other significant change, with theexception of the FOs of F. pileatus and Tw. tovae.
The calcareous nannofossil assemblage across the grey marlstones of the member A of theItzurun Fm is similar to that found in the underlying red marl and is mainly dominated by C. pelagi-
Climate & Biota of the Early Paleogene, Bilbao 2006
- 44 -

The Paleocene and lower Eocene of the Zumaia section
- 45 -
�������������
������������������
����������
��������������
�������
������
����
������
#�
?
;#
;?
<#
<?
=#
=?
>#
>?
?#
??
"#
����������������
�������������
��%������
+�������� �)��������� �������������, �,�����$�����
���������
)��������
�'A
�'B
�'6
�'9
�'/���������������,
����������
�������������
������� ����$��� �����������
��������� ��-������������
������������
������������ �,�����������
��������������� �����������
�������������������
�� ���������� �'��+*,�������
�������� �)���������� ���������
$&����������
+����������
�����������
+����������
Fig. 25.- Main calcareous nannofossil bioevent across the mid-Paleocene interval in the Zumaia section. CO = common occur-rence, RO = rare occurrence.
cus, Pr. martini, Pr. bisulcus and Tw. pertusus. The most important change in calcareus nannofossilassemblages across the A and B members of the Itzurun Fm is the occurrence and diversification of thegenus Heliolithus and the first occurrence of the specimens of the genus Discoaster, one of the mostimportant calcareous nannofossil group throughout the whole Paleogene. Across the upper A and the Bmembers of the Itzurun Fm we also record the FOs of C. nitiscens, Z. branlettei, Tw. eminens, B. ele-gans, H. cantabriae, S. anharropus, H. kleinpelli, B. conicus and D. bramlettei, among others (Fig. 25).
4.4. New planktic foraminifera biozonation from the Mid-Paleocene (X. Orue-Etxebarria, F.Caballero, E. Apellaniz)
The high planktic foraminifera total abundance and species richness found in all the samplesfrom the mid-Paleocene as well as the thickness of the Paleocene in the Zumaia section, have allowedthe establishment of a new planktic foraminiferal biozonation. We have differentiated 5 biozones basedon the first occurrence biohorizons (FOs) of selected species in the studied succession (Fig. 22).
Morozovella angulata Interval Zone (= lower part of P3a of Berggren et al., 1995 and ofBerggren & Pearson, 2005).
Definition: Biostratigraphic interval between the LO of Morozovella angulata and the LO ofIgorina pusilla.
Remarks: In the studied section only the final part of this biozone is represented, and includesthe lower 3 m of the succession. The most characteristic species of the assemblage are M. angulata, M.conicotruncata, Subbotina triloculinoides, Parasubbotina varianta and Globanomalina ehrenbergiamong others.
Igorina pusilla Interval Zone (emended herein; =middle part of P3a of Berggren et al., 1995and of Berggren & Pearson, 2005).
Definition: Biostratigraphic interval between the LO of Igorina pusilla and the LO ofMorozovella occlusa.
Remarks: This biozone is 10 m thick and has a planktic foraminifera assemblage similar to theprevious biozone, also including S. linaperta, S. velascoensis, different igorinids and the first speci-mens of the genus Acarinina.
Morozovella occlusa Interval Zone (herein defined; =upper part of P3a of Berggren et al., 1995and of Berggren & Pearson, 2005).
Definition: Biostratigraphic interval between the LO of Morozovella occlusa (= M. crosswick-sensis) and the LO of Igorina albeari.
Remarks: We use the FO of M. occlusa to mark the base of this 11 m thick biozone because thistaxon is the most abundant of the velascoensis group in all the samples of the Middle and UpperPaleocene. M. velascoensis first occurs together with M. occlusa.
Igorina albeari Interval Zone (= P3b of Berggren et al., 1995 and P3b and P4a of Berggren &Pearson, 2005).
Definition: Biostratigraphic interval between the LO of Igorina albeari and the LO ofGlobanomalina pseudomenardii.
Remarks: The first specimen of I. albeari, which mark the base of this biozone, appear 10 mabove the lithological change from the Danian Limestone to the overlying red marls of the Itzurun Fm.I. albeari includes those forms with a biconvex trochospiral growth, more than 7 chambers in the last
Climate & Biota of the Early Paleogene, Bilbao 2006
- 46 -
whorl with a peripherial margen with muricocarina in the last chambers and a high spiral side in thecentral part. This biozone is 7 m thick.
Globanomalina pseudomenardii Interval Zone (= lower part of P4a of Berggren et al., 1995and of P4b of Berggren & Pearson, 2005).
Definition: Biostratigraphic interval between the LO of Globanomalina pseudomenardii and theLO of Acarinina soldadoensis.
Remaks: The upper part of the studied section belongs to the Gl. pseudomenardii biozone, whosebase has been defined by the first occurrence of this taxon. Gl. pseudomenardii is very rare in the firstsamples of the biozone and the first specimens are relatively small and have an indistinct muricocarina.
In general, the planktic foraminifera total abundance and species richness, particularly those ofmorozovellids and igorinids, increase progressively from the upper part of the Danian Limestone to thetop of the studied succession, in agreement with the ideas of Norris (1997) and Olsson et al. (1999). Atthe beginning of the Gl. pseudomenardii biozone there is a new increase in the planktic foraminiferdiversity, especially in acarininids and globanomalinids.
On the other hand, the ratio of planktic foraminifera to the total foraminifera content increasesfrom 0.8 in the lower part of the succession to 0.9 in the Gl. pseudomenardii biozone. Regarding to theDanian Limestone and the overlying red marl transition we do not find any important change in thenumber of first and last appearances of planktic foraminifer species.
4.5. Benthic foraminifera from the Danian-Selandian transition (S. Ortiz)Benthic foraminifera from the Danian-Selandian transition in the >100 mm size fraction are
better preserved in the Selandian marls (Morozovella crosswicksensis Zone of Arenillas 1996), wherethe benthic foraminiferal assemblages are also more diverse and heterogeneous. Deep-bathyal taxa,such as Bulimina trinitatensis, Cibicidoides hyphalus, Cibicidoides velascoensis, Gyroidinoides globo-sus, Stensioeina beccariiformis, Pullenia coryelli, Nuttallides truempyi, Clavulinoides amorpha,Clavulinoides trilatera, and Gaudryina pyramidata, are abundant, most of them typical from theVelasco-type fauna (van Morkhoven et al., 1986) (Fig. 26). Taxa typical from sublitoral settings arealso common (e.g., Angulogavelinella avnimelechi, Osangularia plummerae). Flysch-type agglutinat-ed foraminifera, such as Hyperammina dilatata and Rhabdammina spp., and calcareous-cementedforaminifera (e.g., Clavulinoides spp.), are both common. Agglutinated assemblages are typical of the“low to mid-latitude slope” DWAF (Deep Water Agglutinated Foraminifera) of Kuhnt et al. (1989).These assemblages suggest deposition at the middle-lower part of the slope.
Calcareous taxa are common, especially at the Selandian (up to 80%), which mainly consist ofplanoconvex trochospiral morphotypes (e.g., Nuttallides truempyi, Angulogavelinella avnimelechi),biconvex trochospiral (e.g., Stensioeina beccariiformis, Osangularia plummerae), and cylindricaltapered morphotypes (e.g., Bulimina spp.). Agglutinated taxa are more abundant at the Danian (up to95%), which mainly consist of cylindrical tapered morphotypes (e.g., Clavulinoides trilatera,Clavulinoides amorpha, Marssonella spp., Karrerulina horrida) and rounded trochospiral/streptospiralmorphotypes (e.g, Cribrostomoides trinitatensis, Recurvoides spp.).
Epifaunal and infaunal morphogroups show constant values close to 50% throughout the sec-tion, suggesting intermediate trophic levels and well-oxygenated waters at the seafloor. A transitionfrom oxic to suboxic conditions at the seafloor has been recorded in several shallow-sea settings world-wide. Further studies are needed to corroborate whether these paleoenvironmental changes are globalat different paleodepth settings.
The Paleocene and lower Eocene of the Zumaia section
- 47 -

Climate & Biota of the Early Paleogene, Bilbao 2006
- 48 -
=#
>#
?#
"#
'4
2%
/0%
'
+$
;+
<,,
%/
�$
+;
+0�
&
%
';�
74
'4
&= ������� �!� �
�"#�$"�#"��%��&��&�#�"�%�"#�$"�#"��%
�!���!�� ������!�� �!���!�� ������!��
,!�>�,������*�#�� ������ ����,>�����*�#�� ������ ��/�>�/�������� ������ ��?,>�?����������������� ��
?�>�?������������� ��0>�0��� ���!�>�!����� �������� ��/,>�/��������������� ��
/�>�/�������� ������ ��:�� ������� ��?,>�?����������������� ��:�� ������� ���>������� �� �� ������,!�>�,������*�#:����������� ������ ��
?�>�?������������� ��0>�0��� ����� �������� !�>�!����� �������� ��/,>�/��������������� ���
"#�$"�#"��%
,!�
��,/�?,
/,!�
0
?�
,!�
��,/�?,
/,!�0
?�
������������� ����6,!�8
�������������� ���6��,8
/�
?,�
,!�?�0!�
/,
,!�
��������������������6!�8
� �����������������������������6,!�8
�������� ���������������6/�8
?,�
?�0!�
/, /�
Fig. 26.- Benthic foraminiferal assemblagles across the Danian/Selandian transition in the Zumaia section

4.6. Benthic foraminifera from the Selandian/Thanetian transition at Zumaia (L. Alegret, M.Martín-Rubio)
Samples from the Selandian-Thanetian transition at Zumaia contain well-preserved benthicforaminifera in the >63mm size fraction. Benthic assemblages are highly diverse and heterogeneousthrough the studied interval. They contain abundant representatives of the bathyal to abyssal Velasco-type fauna, as well as species that are common at bathyal settings. Nevertheless, the presence of speciesthat are common a shallower depths (e.g., Angulogavelinella avnimelechi) suggests deposition in themiddle part of the slope (Fig. 27).
Assemblages contain 50-60% of calcareous taxa, which mainly consist of elongated taperedmorphotypes (e.g., laevidentalinids, Pleurostomella spp., Pyramidina rudita), planoconvex trochospi-ral (e.g., Angulogavelinella avnimelechi, Cibicidoides hyphalus, C. howelli, C. proprius, Gyroidinoidesbeisseli, Nuttallides truempyi, Nuttallinella florealis), and biconvex trochospiral morphotypes (e.g.,Anomalinoides spp., Cibicidoides pseudoperlucidus, Osangularia spp., or Stensioeina beccariiformis).
Agglutinated assemblages are typical of the “low to mid-latitude slope” DWAF (Deep WaterAgglutinated Foraminifera) biofacies of Kuhnt et al. (1989), and they are mainly dominated by flat-tened trochospiral (trochamminids), streptospiral (Recurvoides spp.) and rounded planispiral forms(Haplophragmoides walteri, Haplophragmoides spp.). Cylindrical tapered (Clavulinoides, Dorothia,Marssonella), elongate tapered (Karrerulina, Reophax, Subreophax), tubular or branching(Bathysiphon, Hyperammina, Rhizammina) and flattened planispiral and streptospiral forms(Ammodiscus, Glomospira, Repmanina) are also common to abundant. Agglutinated assemblagesmainly consist of morphogroups with an inferred active deposit feeding habit, with a small percentageof suspension feeders (Kaminski and Gradstein, 2005).
Both agglutinated and calcareous assemblages consist of mixed infaunal and epifaunal mor-phogroups, suggesting that mesotrophic conditions occurred at the seafloor during most of the studiedinterval. Nevertheless, changes in the relative abundance of various benthic foraminiferal species andmorphogroups in a short interval in coincidence with the Selandian/Thanetian transition, where a dra-matic decrease in the planktic/benthic ratio is observed, suggest a major disruption in the paleoenviron-mental conditions at the seafloor at that time. The question remains whether changes in composition ofbenthic foraminiferal assemblages (and the related paleoenvironmental inferences) can be linked tomajor changes occurred not only in planktic groups in this area, but also to the environmental changesinferred from deep-sea cores worldwide.
4.7. The Mid-Paleocene Biotic Event (MPBE) (G. Bernaola, J.I. Baceta, X. Orue-Etxebarria, L.Alegret, M. Martín-Rubio, J. Arostegi, J. Dinarès-Turell)
Recent studies of deep-sea sections at Central Pacific (Shatsky Rise) and South Atlantic (WalvisRidge) oceans have confirmed the existence of several dissolution levels interspersed in the carbonatesediments of the late Paleocene-early Eocene (Eocene Layer of Mysterious Origin, ELMO; X-eventlayer; Mid-Paleocene Biotic Event layer). Similarly to the Paleocene-Eocene Thermal Maximum(PETM) interval, these levels are characterized by the presence of a clay-rich layer, associated with anabrupt drop in carbonate content, and a pronounced peak in magnetic susceptibility (MS) that reflectsan increase in clay content. All these dissolution intervals have been interpreted as the sedimentaryresponse to abrupt climatic changes; in fact, the few micropaleontologic and geochemical analyses car-ried out hitherto suggest that they represent short lived events of considerable evolutionary significanceprobably related to hyperthermal events.
The Paleocene and lower Eocene of the Zumaia section
- 49 -
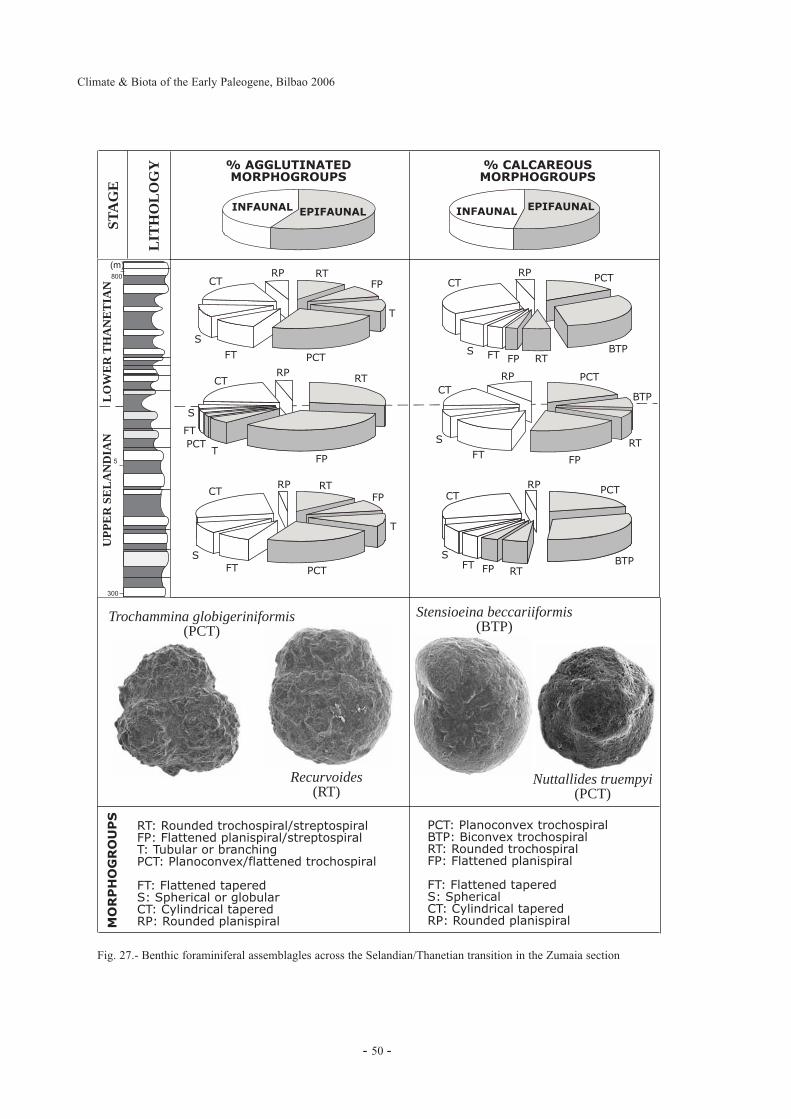
Climate & Biota of the Early Paleogene, Bilbao 2006
- 50 -
PCT
BTPRTFPFT
S
CTRP
PCT: Planoconvex trochospiralBTP: Biconvex trochospiralRT: Rounded trochospiralFP: Flattened planispiral
FT: Flattened taperedS: SphericalCT: Cylindrical taperedRP: Rounded planispiralM
OR
PH
OG
RO
UP
S
% CALCAREOUSMORPHOGROUPS
INFAUNAL EPIFAUNAL
% AGGLUTINATEDMORPHOGROUPS
PCT
FP
T
RP
FTS
CT RT
RT: Rounded trochospiral/streptospiralFP: Flattened planispiral/streptospiralT: Tubular or branchingPCT: Planoconvex/flattened trochospiral
FT: Flattened taperedS: Spherical or globularCT: Cylindrical taperedRP: Rounded planispiral
INFAUNAL EPIFAUNAL
PCT
FP
T
RP
FT
S
CTRT PCT
BTPRTFPFTS
CTRP
300
800
5
UP
PE
R S
EL
AN
DIA
N
(m)
LO
WE
R T
HA
NE
TIA
NST
AG
E
LIT
HO
LO
GY
Stensioeina beccariiformis(BTP)
Nuttallides truempyi(PCT)
Trochammina globigeriniformis(PCT)
Recurvoides(RT)
PCTFP
T
RP
FT
S
CT RT PCT
BTP
RT
FPFT
S
CTRP
Fig. 27.- Benthic foraminiferal assemblagles across the Selandian/Thanetian transition in the Zumaia section

Developing studies in the mid-Paleocene succession of Zumaia (Western Pyrenees) haverevealed the presence of a 1 m thick clay-rich interval characterized by a drop in carbonate content, apeak in MS and important calcareous nannofossil and foraminifer assemblage changes. This interval islocated 4 m above the FO of Heliolithus kleinpelli, the marker of the base of Zone NP6, 2 meters belowthe C25r/C26n reversal and within thelower part of the Zone P4 of planktic foraminifers. According tothis data, it might be equivalent to the Mid-Paleocene Biotic Event found at Shatsky Rise and WalvisRidge.
The micropaleontologic analyses show an important drop in the planktic/benthic ratio in connec-tion with the clay-rich interval, from 90% to less than 10%. During the event, planktic foraminifersform a low diversity assemblage dominated by subbotinids. Benthic foraminifer assemblages are char-acterized by a maximum in the percentage of agglutinated taxa, an increase in the percentage of cal-careous taxa Nuttalides truempyi and Stensioeina beccariformis and a decrease of agglutinated suspen-sion feeders and calcareous infaunal groups. Finally, calcareous nannofossils show important assem-blage changes in connection with the clay-rich interval, mainly defined by a sharp increase of C. pelag-icus, Ericsonia spp. and Heliolithus spp. and a decrease of Tw. pertusus and Prinsius spp.
According to preliminary cyclostratigraphic data, this event (MPBE) is located ~8 precessioncycles below the base of chron C26n in correspondence to an eccentricity maxima.
4.8. Looking for a suitable criterion to define the Danian/Selandian & Selandian/Thanetian bound-aries (G. Bernaola, X. Orue-Etxebarria, V. Pujalte, J.I. Baceta)
During the nineteenth and early twentieth centuries many different Paleogene stages weredefined. The most well-known Paleocene historical stages, e.g., the Danian, Montian, Heersian,Sparnacian, Thanetian, Landenian, and Selandian, have their type areas in northwestern Europe wherethey were mostly defined at unconformities corresponding to sequence boundaries. At a meeting inWashington, D.C., 1989 it was voted and agreed on by the International Subcommission on PaleogeneStratigraphy (ISPS) that the Paleocene shall be divided into three stages: the Danian, Selandian, andThanetian (Jenkins & Luterbacher 1992). In fact, twentieth century research has shown that the Danian,Selandian, and Thanetian together represent most of Paleocene time.
Later, in the symposium on “Stratigraphy of the Paleocene” held in Göteborg (Sweden) on 1993,the principies for dividing the Paleocene into stages were discussed and it was formally decided athree-fold división of the Epoch.
When selecting GSSP's it is important to consider the potential utility of the new global stageconcepts, however, historical tradition should be respected. The respective time-rock extents of the newSelandian and Thanetian GSP-delimited stages should, ideally, reflect global change, but also roughlycoincide with the stratigraphic extents of the respective historical, regional stages (Knox, 1994).
In the type region, Denmark, the base of the Selandian is marked by an unconformity betweenthe limestones of the Danskekalk Fm and the greensands and marls of the Lellinge Fm (Thomsen andHeilmann-Clausen, 1985). The limestone/chalk deposition had prevailed throughtout the entireMaastrichtian and Danian. After the Da/Se transition, grey marls and clays dominated sedimentationfor several million years. In terms of calcareous nannofossil zonations, the basal Selandian in Denmarkfalls in the upper part of Zone NP4 or to the lower part of Zone NP5 (Thomsen, 1994).
Prestwich (1850-54) introduced the term “Thanet Sands” to describe the succession of fine,locally glauconitic and argillaceous sandstones and sandy clays wich overlie the Upper Cretaceouschalk in the Isle of Thanet and adjcent districts in southern England. In its original type area, the uncon-formity related base of the Thanetian has been dated with the upper part of the nannofossil zone NP6(Aubry, 1994; Knox, 1994).
The Paleocene and lower Eocene of the Zumaia section
- 51 -

All the events traditionally used to place the Danian/Selandian (i.e., the top of chron C27N, FOof M. angulata and I. albeari planktic foraminifera, The FO of F. tympaniformis) andSelandian/Thanetian (i.e., the base of chron C26N) boundaries can be identified in the Zumaia section(Figs. 28 and 29). The study of the mid-Paleocene of the Zumaia section has revealed that all theseevents occur forming a distinct sequence. Before selecting a section to place the Danian/Selandian andSelandian/Thanetian boundary stratotypes, the criterion to identify these boundaries should be precise-ly defined. A first step should be the description of the succession of the events that characterizes bothboundary intervals. In this work the succession of events that characterised the Danian/Selandianboundary has been informally considered as extending from the base of Chron C27n to the FO of I.albeari (Fig. 28). On the other hand, the succession of events that characterised theSelandian/Thanetian boundary has been informally considered as extending from the FO of Gl.pseudomenardii to the FO of D. mohleri (Fig. 29).
Evaluating the pros and cons, and the usefulness of each of the events identified at Zumaia isbeyond the scope of this fieltrip guidebook, as this decision is in the domain of the InternationalSubcommission on Paleogene Stratigraphy (ISPS). Consequently, only the relative position of the dif-ferent events suitable to be selected as "official" markers of the Da/Se and Se/Th boundaries, and theircorrelation with other zonal scales, are highlighted in figures 28 and 29.
For the Danian/Selandian boundary, the Zumaia section provides 9 different events as suitablecriteria, from older to younger: a) FO of I. pusilla and/or S. primus, b) top of chron C27n, c) FO of M.occlusa, d) FO of Nch. perfectus, e) mid-Palecocene sea level fall with the associated paraconformityin deep-basin areas and the mid-Paleocene unconformity (MPU) in near shore areas, f) diversificationof fasciculiths, g) FO of F. tympaniformis, h) δ13C relative minimum and i) FO of I. albeari (Fig, 28).
Climate & Biota of the Early Paleogene, Bilbao 2006
- 52 -
������������������
����������
��������������
�������
�������������
�����5��*���-����+������������3�+��+���3�0
�������������5����*�+�����
-�0
-�0
-�0
-�0
-30
-*0
-�0
#�
?
;#
;?
<#
<?
(&�*����������)����������
(&�**�����
(&�*���������������
(&�*������������
(&�*������������������������
�'9
�'/
'7�
'7�
����* .B�
��7 ������5������#�
-+0
-�0
Fig. 28.- Suitable criteria to define the base of the Selandian

As is shown in figure 28, six of the nine events are located within an interval of 5 meters encom-passing the uppermost Danian Limestone and the lowermost Itzurun Fm. At Zumaia the FO of M.angulata, usually used to define the base of the Selandian stage, is found 8 m below the top of chronC27n.
For the Selandian/Thanetian boundary, the Zumaia section provides 6 different events as suitablecriteria, from older to younger: a) FO of P. pseudomenardii, b) FO of H. kleinpelli, c) The MPBE, d)base of chron C26n, e) top of chron C26n and FO of D. mohleri (Fig. 29).
As is shown in figure 29, the six events are located within an interval of 17,5 meters encompass-ing the uppermost A and the lowermost B memberf of the Itzurun Fm.
The Zumaia section satisfies most of the infrastructural, biostratigraphic and geological require-ments listed by the International Commission on Stratigraphy (ICS) (Remane et al., 1996), as demon-strated above (see section 1.2 of this guide). In particular, the great sedimentary thickness and expand-ed charactyer of the section, have allowed the accurate location of successive biostratigraphic andmagnetostratigraphic events and their chronological succession can be easily established.
The Paleocene and lower Eocene of the Zumaia section
- 53 -
�������������
�����
�����
����
-�0
-�0
-�0
-*0
<?
=#
=?
>#
>?
?#
??
"#
����* .6�
(&&���������������
(& ��%������
�-�+��������
(& �+*, ���������
�'A
�'B
�'6
�'9
'7�
'/
�����* .6�
-+0
-�0
Fig. 29.- Suitable criteria to define the base of the Thanetian

5 THE PALEOCENE/EOCENE BOUNDARY INTERVAL
5.1. An overview (G. Bernaola, X. Orue-Etxebarria)The P/E boundary transition, characterized by a prominent negative excursion of δ13C values
(CIE) in both marine and continental records (Stott et al., 1990; Kennet & Stott, 1991; Koch et al.,1992; 1995; Bralower et al., 1995; Thomas & Shakleton, 1996; Beerling & Jolley, 1998), has focusedthe interest of the scientific community in the last two decades. This interval is known as the PETM(Paleocene/Eocene Thermal Maximum) and is one of the most abrupt and transient extreme climateglobal events documented in the ancient geologic record. According to recent works the PETM onlylasted for ~220 k.y. (Röhl, 2000, Agnini et al., 2005), and is characterized by extremely warm climat-ic conditions, drastic changes in the global carbon budget, modifications in oceanic circulation andchemistry (possible change in the thermocline and circulation in the oceans) and reorganization ofecosystems. In fact, this event had an important biotic impact on both land and marine organisms,affecting groups as diverse as land mammals (e.g. Wood et al., 1941; Clyde & Gingerich, 1998), deep-water benthic foraminifers, (Thomas, 1990; 1998; Thomas & Shackleton, 1996; Speijer et al., 1996),benthic communities of middle and outer neritic marine settings, (Speijer 1994; Speijer et al., 1996;Speijer and Schmitz, 2000), and shallow marine larger foraminifera fauna (Orue-Etxebarria et al.,2001; Pujalte et al., 2003).
The PETM also affected the photic zone, where various groups of planktic marine organisms suf-fered considerable turnovers. Dinoflagellates showed a global dispersion and an abundance increase ofthe representatives of genus Apectodinium in coastal environments (Crouch, et al., 2001), plankticforaminifera experienced a radiation of shallow-dwelling tropical taxa (Kelly et al., 1996; 1998; 2005;Berggren & Ouda, 2003) and the calcareous nannoplankton communities underwent an importantassemblage turnover that lasted for the duration of the event (Aubry, 2001; Bralower, 2002; Kahn &Aubry, 2004; Orue-Etxebarria et al., 2004).
Studies conducted in the last decade have revealed the Pyrenean area as a key region to under-stand the P/E boundary events. Besides its strategic paleogeographical position, approximately 35ºN in
Climate & Biota of the Early Paleogene, Bilbao 2006
- 54 -
Fig. 30.- a) Outcrop photograph of the P/E boundary interval at Zumaia showing the Siliciclastic Unit (SU). (b) Detailed viewof the P/E boundary.
�
� /9
� ���� ��� ����
�

the net evaporation zone and between the classic stratotypic sections of the NW Europe and the newlyproposed GSSP in Egypt, the Pyrenean area has numerous outcropped successions, usually expandedand of good quality of exposure, that represent a wide range of settings, from continental to deepmarine. A high-resolution correlation between continental, shelfal and bathyal marine successions bymeans of the CIE has proved that a major turnover of larger foraminifers occurred during the PETM.This fact demonstrates that the impact of the PETM upon the evolution of benthic fauna was grater thanpreviously thought.
5.2. The Paleocene/Eocene boundary at Zumaia section (J.I. Baceta, V. Pujalte, G. Bernaola)The Zumaia section is one of the most expanded and biostratigrafically complete P/E sections
with deep water marine deposits so far reported. The outcrop of the P/E boundary interval (P/E BI) is located partly at the Itzurun beach and partly
along the NE side of the footpath from the village of Zumaia to the beach (latitude/longitude42º18.00’N/2º15.30’W) (Fig. 30). In fact the footpath splits the outcrop in two segments, referred to belowas the southern and northern ones (Fig. 31). The lower part of the P/E BI occurs in the northern segment.
The Paleocene and lower Eocene of the Zumaia section
- 55 -
Fig. 31.- a) Field-sketch of the outcrop, in the cliffs of the Itzurun beach, Zumaia section. The limestones in the righ hand(SW) side of the outcrop are of Danian age, while the turbiditic succession in the left hand (NE) side correspond to the earlyEocene. b) Field sketch of the northern segment of the P/E boundary interval. c) Field sketch of the southern segment of theP/E boundary interval.
+�
* �
�
�������������
%
'
�
" �
!"
�'
#�
'
"
%����������������
�(
�)�*
!!
�
�
�$
�+
,
�
�$�
+,
��
$
�
+
�
+
+
,
�-
������ ������������� �����
"!)����� �&��.�/
�-
�(
�)�* �0

The existence of several small faults or «tectonic disturbance zones» has been quoted in mostpublished descriptions of the Zumaia section (e.g., Hillebrandt, 1965; Gawenda et al., 1999). However,only Baceta et al. (2000) made an specific mention about how these faults omit or repeat parts of thestratigraphic succession.
The main tectonic disturbance in this outcrop is the fault labeled F4, which is accompanied by aswarm of smaller, satellite faults. Clearly, the main effect of fault F4 has been the duplication of theinterval comprised between reference beds F and K (Fig. 31c). Our data show that this duplicationwould not be detected by biostratigraphic methods, as the whole duplicated interval is situated withinthe same planktic foraminiferal and calcareous nannofossil biozones. Nevertheless, failure to recognizethe tectonic duplication would result in an overestimated stratigraphic thickness. It is also relevant tomention that the lower half of this outcrop is not longer visible due to the construction of a concretestaircase descending to the beach. Therefore, the duplication illustrated in figure 31 is even more dif-ficult to appreciate nowdays than it was 12 years ago.
The northern outcrop is affected by three additional faults (F5, F6 and F7 in 31b). The attitudesand the effects of faults F5 and F6 are similar to that of fault F4, having both produced duplications ofparts of the succession (Fig. 31).
Fault F4 is different from faults F4, F5 and F6, and no match can be attained between the strati-graphic successions separated by fault F7 (Fig. 31b). Such a mismatch is clear proof that fault F7 omitsan interval of the stratigraphic succession. The extent of this missing interval is thought to be compar-atively small.
Thus, it can be affirmed that most faults segmenting the P/E BI of the Zumaia section just repeatparts of the succession, the only exception being the minor omission of fault F7. Properly dealt with,the disruption of these fauts can be removed, and the original stratigraphic succession can be success-fully reconstructed. To facilitate the identification of the different intervals of the succession, we havecross-referenced the litholog and the outcrop section (letters D to T in figures 31 and 35).
Following the usage of some previous authors, we have placed the zero level of our litholog atthe horizon in which Schmitz et al. (1997) found the onset of the negative Carbon Isotopic Excursion(CIE). The deposits below and above our zero level belong respectively to the Paleocene and to theEocene (Fig. 32).
The bulk of the P/E boundary interval is represented by rhythmic alternations of hemipelagiclimestones and marlstones, plus numerous intercalations of thin-bedded turbidites (mostly 1-4 cmthick, but some 10 cm thick, Baceta et al., 2000). The uppermost part of the Paleocene is representedby a 0.8 m thick unit (Unit III) mostly composed by hemipelagic limestones that include a 4 cm thickturbiditic level. This unit, that in fresh cuts presents a greenish color due to the high glauconite content,is a widespread marker bed observed in several other sections of the Basque Basin and used in region-al correlations (Baceta, 1996; Pujalte et al., 1998; Smichtz et al., 2000). The green limestone is cappedby a 35-40 cm thick marlstone bed (Unit IV), the base of which contains the onset of the CIE and thetop the begining of the Benthic Foraminiferal Extinction Event (BEE) (Schmitz et al., 1997). The marlshave a greenish brown appearance, quite different from the grey marls below (Units I and II).
Above the 40 cm thick marlstone of the lowermost Eocene (Unit IV), there is a 4 m thick inter-val (Unit V) composed almost exclusively of claystones and silty claystones called “Siliciclastic Unit”(SU). The transition from marl to clay is gradual over about 5-10 cm. The lower 1.3 meters of the SUare almost devoid of carbonate microfossils. In the upper 2.7 meters of the SU the carbonate contentincreases slightly but relatively low values persist (Schmitz et al., 1997).
Climate & Biota of the Early Paleogene, Bilbao 2006
- 56 -

Above the SU, and after a rapid and progressive transition, the succession is composed again byrhythmic alternations of hemipelagic limestones and marlstones plus some intercalations of thin-beddedturbidites (Unit VI), particularly from meter 10 onward (Unit VII).
The CaCO3 δ13C and δ18O measurements across the P/E BI at Zumaia section were carried out bySchmitz et al. (1997) (Fig. 33).
The Paleocene and lower Eocene of the Zumaia section
- 57 -
!����������<���3� )�3���������,�������
%��4����
1./
1.7
1..
1.�
1�C
1�A
1.6
1.B
1.A
1.C
�& &
! $
&''�
�-��
�+���
����+�
01�.
1��
1C
1A
1B
16
1�7
1�/
1�6
1�B
D�.
D�7
@;>
@;"
@;C
@;B
@;A
@<;
D��
DC
DA
DB
E�9���E> ����������&�
�'��5������5� (�$
D�
D.
D7
D/
D6
1�
1.
17
1/
176
17/
177
17.
17�
17B
17A
17C
1/�
�
��
����2
2
2�
2��
#
�?
�;#
�;?
�<#
�<?
�=#
�=?
�>#
@<#
@;?
@;#
@?
(����,
(����,�����,
�����,
�
'����+���
��+���
��������
��������
8����,
�'A
�'C
�'�
),�#����,
�,�
��+�E�����
�,������������
�,���#���
,
�A# �>? # >? A#
HJ��������
.9�
.9�
./�
%���;>A#
%���;A>#
%���<?<#
%���<B=#
%���=#B#
%���=;B?
%���=>>?
%���="A?
%���=B;#
%���=BA?
%���>#;?
%��;>B#���%��;><?
%��;=;#%��;<C#
%��A<?
%��C##
%��?"#%��?<?%��>"?
%��>;#%��=B#%��=<#
%��<"#
%��<;#%��;C#%��;>#
%��;;#%��A#%��"?
%��?#�"#%��=#�>#%��<<�=#%��;#�;C
%��#�"���%���?#%���A#
%���;>#
%���<##%���<>#%���<B#%���==#
%���?"#
%���B##
%���;;?#
%��<#B#���
%��;A<?
%��;CB?
%��;C##
%��;?C#%��;?#?
%��;><#%��;=??%��;==#%��;=;#
%��;<##%��;;A#%��;;>?
%��;#"?%��;#<#%��;#;#%��A=?%��BC?%��B=#%��CA#%��C>?%��C#?
%��?A?%��???%��?=#
%���<?%���C?%���A?%���;>#%���;A?
%���<A#%���==?
%���<";#
%���;>>?
%���C>#
%���>#?%���><?%���>"#
%���???%���?B?%���">?%���"C#
%���B##%���B=#
%���BA?%���A>?
%���;#=?
%���;;#?%���;;=#%���;;??%���;;B#
%���;"B#
%���;CB?
%���;B>#
%���;A>?
%���<;=#
%���<<<#
%���<<C?
%���<=>#
%���<?<#
%���==>#
%���=>?#
%���=?B#
%���="A?
%���=B;#
%���=A;#
%���>#;?
%���<"B?
%���<CC?
%���<A=?
%���=#B#
%���=;B?
%���=<C#
%���>A?%���?;#%���?<#
%���<=?%���<>?%���<"?
%��>B#
%��<"?
%��;"? %��;>?%��;C#
%��;##
�� ��%��<�� �%��"#
%��;>#%��;<#
%��;A#%��<;# %��<##
%��<>?%��<=#
%��=B#
%��==#%��=##
%��<??
%��="#%��=>#
%��>=?%��>;? %��>##
%��>"?%��>??
%��A#%��;##
Fig. 32.- Lithostratigraphic column and magnetostratigraphy of the Zumaia Paleocene/Eocene transition. The position of calcareous nannofossil and planktic foraminifersamples are shown separately.

According to these authors, calcite concentrations lie typically at 75-80% in the limestones and40-50% in the marls (Units I, II and III). In the marls between +0.30 and 0.35 m (unit IV) calcite fallsto 25% (Fig. 33). At +0.35-0.40 m calcite drops to 5%. In the lower 1 m of the clay interval calcite con-centrations lie typically in the range 0-5%. In the upper 3 m there are many horizons with 10-20% cal-cite (Fig. 33). Examination of sieving residues (>63 μm) from the clay interval reveals common diage-netic calcite.
The δ13C record shows a relatively stable pattern throughout the 11 m interval below the zerolevel (units I, II and III), with most values in the range 1-1.7‰. From the topmost few centimetres ofthe limestone and across the 30-40 cm of marls immediately below the benthic extinction event (unitIV), δ13C shows a negative shift on the order of 1.4 -1.8‰ (Fig. 33). From values around 1.2‰ in theuppermost few centimetres of the limestone, δ13C falls to values in the range -0.2‰ to -0.6‰, in themarl interval between +0.30 and 0.35 m. In the poorly calcareous parts of the overlying clay intervalδ13C values continue to fall (except for the +0.35 0.40 m sample), reaching extremely negative valuesof -3.9‰ to -4.5‰ at some levels in the interval 2-3.3 m above the zero level (Fig. 33). In the marlsabove the dissolution clay δ13C returns gradually to more positive values and thereafter, throughout theoverlying 8 m of marl limestone, fluctuates around 1‰, (Fig. 33).
The δ18O values are relatively stable throughout the marl and limestone parts of the section, withmost values in the range -3.5‰ to -4‰ (Fig. 33). In the clay interval, however, δ18O shows widely scat-tered distribution, ranging between -2.6‰ and -6.6‰. The wide scatter indicates that diagenesis mayhave severely affected the original isotopic signals in this part of the section.
In a 1 cm thick layer between units III and IV Schmitz et al. (1997) found a small Ir anomaly.The higest Ir concentration measured in the layer was 157 ppt, compared to an average value of 51 ppt,for the rest of the section.
Climate & Biota of the Early Paleogene, Bilbao 2006
- 58 -
Fig. 33.- CaCO3, δ13C and δ18O profiles across the P/E boundary interval at the Zumaia section (from Schmitz et al., 1997)

5.3. Magnetostratigraphy of the P/E boundary interval (J. Dinarès-Turell, J.I. Baceta, V. Pujalte)In order to define chron C25n along the late Paleocene and earliest Eocene time interval sixty-seven
stratigraphic levels were sampled along 57 m of stratigraphic succession. Samples were mostly taken fromthe indurated limestone beds. Natural remanent magnetisation (NRM) and remanence through all demag-netisation stages were measured using a 2G-Enterprises high-resolution (45 mm diameter) pass-throughcryogenic magnetometer equipped with DC-squids and operating in a shielded room at the IstitutoNazionale di Geofisica e Vulcanologia in Rome, Italy.
The intensity of the NRM was moderate to weak, generally between 1x10⁻⁴ A/m and 5x10⁻⁵ A/m.Two magnetisation components can be recognized in most samples upon demagnetisation, in addition toa viscous magnetisation removed below 5 mT or 100º-150°C. A low coercivity and low temperature com-ponent (L) is unblocked between 5 mT and 20-30mT (or 150°C and 300°C), and a high coercivity and tem-
The Paleocene and lower Eocene of the Zumaia section
- 59 -
Fig. 34.- Outcrop photograph of the P/E boundary interval at Zumaia (a). The base of the Carbon IsotopeExcursion (CIE) marking the P/E boundary is shown. The cyclic interval above the siliciclastic unit into theEocene (b) shows clear bundling of 5-6 basic marl-limestone couplets indicating that correspond to preces-sion (~21 kyr) and eccentricity (~110 kyr) cycles respectively. See lithologic column in Fig. 2 for exact loca-tion of the labelled reference beds.

Climate & Biota of the Early Paleogene, Bilbao 2006
- 60 -
0��,�����
2-��.����������������
�+� ��� ��� � �
��������� ��������
� ��� ��� � �� ��
� !�"������
(����������� ������
$���,��� ������
��#�
��#�
����
5
,
0
6
7
1
8
3
�
�
�
)2����
���
���
��+
��7
���
���
���
���
���
���
���
���
��+
��7
���
���
���
���
���
���
���
���
��+
;��#����#��������#����#
���
���
���
���
�+
��
��
��
�
�
�
�
+
��
��
��
��
����
%����)�$�����#�)%��#
�#1�2������ ������
�#1�$����� ����<��������# %������
�&��
*
'
�
-
9
+
�
1��<����
(1,�2�:,,�/�����;� ������<��==>!
��������������
����
�#1�(���� ��������
�#1�$������������
�#1�)��� ���������
#�����$��%&�������'���()*
Fig. 35. Stratigraphic variations ofdeclination, inclination of the ChRMvectors and virtual geomagnetic pole(VGP) latitude plotted on a lithologiclog where key reference beds aregiven a letter. For a full detailedlitholog covering the interval -53 m to+27 m see Baceta et al., (2000). Theposition of the ZT paleomagneticseries and the new IT series are indi-cated. Open circles denote unreliabledata and crosses mark the position ofsamples that have provided no data.Uncertainty in the placement of thebase of normal polarity chron C25n isshown by a hatched band.

perature component (H) is unblocked above 20-30 mT (or above 300°C) until fields around 100 mT (orabout 550°C). The data is therefore compatible with magnetite as the main carrier of the remanence.Component L has a northerly declination and moderate to steep downward inclination (~60°) beforerotation of bedding to the horizontal, and thus corresponds to the geocentric axial dipole direction forthe site latitude. Consequently, component L is interpreted as a recent overprint. Component H trendstoward the origin of the demagnetisation diagram and presents both normal and reverse polarities. Nofold test is available due to similar bedding dip throughout the section (dip angle/dip direction,64°/032°). Nevertheless, the following observations provide supporting evidence that the calculatedChRM directions are primary in age: (1) the presence of both normal and reverse ChRM directions, (2)the presence of a low coercivity/temperature present day field overprint in addition to the ChRM mag-netization, (3) the mean inclination after bedding correction is near the expected Palaeocene inclinationfor the site location, (4) mean ChRM directions before bedding correction are not compatible withPalaeocene to recent geomagnetic field direction.
The declination, inclination and VGP latitude together with relevant biostratigraphic and litho-logic information for the studied interval is shown in Fig. 35. Chron C25n has been delimited between-25.2 m to about -35.0 m although the C25n lower boundary reversal could be located to a slightlylower position (-37.7 m) if a NRM delay acquisition process is advocated (see Dinarès-Turell et al.,2002 for further details).
The Paleocene and lower Eocene of the Zumaia section
- 61 -
��,�+�������,��7����
1.���,����)�������
��������� ������ �����������
$%�&�&$'�(������
��
������������������������������������������
�
��
�
��,������
��,������
��,����
��#�
��#�
��#�
�������(!���������%���*
�������(!���������%���*
�+���������= �(������� ���#*�
��,�������
�����������= �(������� ���#*�
���
���
��,��+������,�+����(��#���<��&��>�:*�
1.���,����)�������
�����,��7����(��#���<��&��>�:*�
�+7�= �(�7�� ���#*�
��,�������
��������+��= �(������� ���#*
�����
��,���������,�+7����
Fig. 36.- Different age estimates of relevant P/E boundary interval events. The top of chron C25n is usedas fixed datum in the three cases.
5.4. Cyclostratigraphy of the P/E boundary interval (J. Dinarès-Turell, J.I. Baceta, V. Pujalte)Cyclostratigraphy has proved to be a valuable metronome to parse time in the geologic record
and has recently been applied to the P/E transition interval from Ocean Drilling Program (ODP) Sites1051 and 690 (Norris and Röhl, 1999, Röhl et al., 2000, Cramer, 2001) and in the Forada section(Agnini et al. 2005). The polarity record of ODP Hole 690B is hampered by a strong drilling-inducedoverprint (Ali et al., 2000). However, apparent good magnetostratigraphic results from the upper partof chron C25r up to the lowermost Eocene chron C24r for ODP Site 1051 has enabled to propose a cli-matic orbital origin for the cycles observed in colour reflectance, magnetic susceptibility and Fe inten-sity counts (Norris and Röhl, 1999). They estimate a duration of 481 ky to 523 ky for polarity chronC25n, which is consistent with the 487 ky duration determined by assuming constant seafloor-spread-ing rates between radiometric tie points (Berggren et al., 1995). Moreover, 924 ky to 966 ky is also esti-mated for the duration of the Palaeocene part of chron C24r (i.e., up to the onset of the δ13C anomalyor CIE) in ODP Site 1051 (Norris and Röhl, 1999).
Leaving aside the thin-bedded turbidites, the succession studied in Zumaia is composed of cyclesor lithology couplets formed by an indurated limestone part and a marly interval (Figs. 34 and 35).Chron C25n includes about 21-23 of these cycles and, hence, taking the duration constraints for thischron derived by Norris and Röhl, (1999), an average duration of 21 to 25 ky can be estimated for eachcycle. This is consistent with the ~21 ky mean duration of the orbital precession cycle (Herbert et al.,1995) given the uncertainties in identifying the cycles and determining the paleomagnetic boundariesboth in ODP Site 1051 and at Zumaia. Similarly, the number of couplets for the Palaeocene part ofchron C24r in the Zumaia section contains ~47 (assuming that 2 cycles actually occur in the not out-cropping interval -12 to -14 m, Fig. 35). This implies a mean duration of about 20-21 ky for the cou-plets, again suggesting that they likely represent the expression of orbital precession. At present, wecannot directly ascertain whether the lithologic couplets in the lowermost Eocene section are alsoexpressions of orbital forcing, but grouping of 4-5 individual couplets in larger bundles (Figs. 34 and35) does suggests they may correspond to the precession and the ~100 ky eccentricity Milankovitchcycles respectively.
As pointed out by Norris and Röhl (1999), the temporal calibration of the Palaeocene part ofChron C24r at ODP Site 1051 is in conflict with previous estimates, because their cyclostratigraphicanalysis brings the base of the CIE to an age of 54.93-54.98 Ma (taking 55.9 Ma for the top of C25n,Cande and Kent, 1995). A similar conclusion can be reached in the present study, since the duration ofthe Palaeocene part of C24r at Zumaia, as devised by cycle counting, places the P/E boundary ~0.987My younger (i.e. at ~54.913 Ma) than the top of C25n (Fig. 36). These figures would imply that thebase of the CIE (i.e., the P/E boundary) might be between 570 and 520 ky younger than its current esti-mation of 55.5 Ma (Berggren and Aubry, 1998). It is important to remark that the FAD of Tribrachiatusbramlettei (marker of the NP9/NP10 boundary) occurs in Zumaia and elsewhere almost immediatelyabove the onset of the CIE (Monechi et al., 2000a, b; Fig. 36). Therefore, if the absolute age of 55 Maassigned by Berggren and Aubry to this event is correct, the base of the CIE should only be slightlyolder than this figure.
However, the absolute calibration of the P/E boundary is conditionally constrained on an40Ar/39Ar age of 55 Ma for the –17 ash layer within the Mo clay sequence, Denmark (Cande and Kent,1992). The –17 ash is also present in DSDP Hole 550, and recent reappraisal of the original paleomag-netic data from this Hole (Ali and Hailwood, 1998) indicates the position of the base of Chron C24nshould be older (~0.5 My) and the original estimate was in error. If this could be substantiated by newdata elsewhere, the P/E boundary and other biostratigraphic and magnetostratigraphic boundariesshould be shifted to older ages accordingly. Clearly, a new anchor point with a well-constrained
Climate & Biota of the Early Paleogene, Bilbao 2006
- 62 -

absolute age is needed and sections like Zumaia will be invaluable to reassess the chronology of theP/E boundary interval.
The section provides a complete and unambiguous record of chron C25n that suggests an orbitalorigin for the lithologic cycles observed throughout the P/E boundary interval. This is a major achieve-ment in any marine succession embracing the P/E transition and provides the necessary constraints tofurther valuate the chemobiostratigraphical events spanning this interval.
5.5. Calcareous nannofossil turnover across the P/E boundary interval (G.. Bernaola, E. Angori, S.Monechi)
Except for the first 1,3 m of the Siliciclastic Unit which are almost barren of calcareous nanno-fossils, all the studied samples of the Zumaia section are generally rich and well diversified.Preservation varies from moderate to poor being moderate in the Upper Paleocene and poor to moder-ate in the Eocene part.
The Paleocene and lower Eocene of the Zumaia section
- 63 -
1./
1.7
1..
1.�
1.
1�C
1�A
1.9
1.6
1.B
1.A
1.C
�& &!
$&
''��
-���+���
����+�01�.
1��
1�
1C
1A
1B
16
1�7
1�/
1�9
1�6
1�B
(����� ����� ������ � ����� �>
�>��#��?-�CC60
�>�)������-�CB�0��������-��*������/��������� ;AA"$
� ������ ��
�>
��B
��;;
��
A�
�;#
*
*�
&�#�1��E��,����./
��B
��A
��;#
��;;
D�.
D�7
@;>
@;?
@;"
@;C
@;B
@;A
@<#
@<<
@<;
D��
D�
DC
DA
DB
��/����0������������(�
1����+������+��*�2
D�
D.
D7
D/
D9
D6
1�
1.
17
1/
19
�
176
179
17/
177
17.
17�
17
17B
17A
17C
1/
1/�
�������
���������������,
.�����������
+�������
���������� +���������
������)�������������������������,
��������
/������������,
����������
�������������
.�����������
����������+���������
+�����������+����������
+�������������� .�����������5��,
.���������
.������������,�, +�������
.�����������,�,���+*,��������������
.�����������
+������������
+�����������
������������,
+��������
+��������
+�������
�����������
������
����������
.9�
.9�
./�
Fig. 37.- First (FO) and last (LO) occurrences of the most important calcareousnannofossils and their relative position within chrons C25r, C25n and C24r.

Climate & Biota of the Early Paleogene, Bilbao 2006
- 64 -
��
�
���
���
�
�9..97$�,�����#�
7���
�,�����#�
7���
(��+�+#����#�
@���+��������,
@
#<?
?#C?
#?
;#;?
<#�>
+?�;
+?;+
?#
;?=#
>?#
?;#
;?<#
#<#
>#"#
B##
;<
#<#
>##
<??#
C?;#
#
�% .�
"<(
1D
"<(
D1
"<(
1D
"<(
D1
$�,�����������,�,
7���
$�,�����������,�,
7���
"?3��������#�
@ ,����3�+#�
@ ����#����,
@
��7
"!)���
��
�
#<?
?#C?
�
����
����
L�
����
$���
+���
���
����
���,
"'��
���
����
�&��
���
LL
�"�
�'�
��&
����
�
Fig.
38.
- R
elat
ive
and/
or a
bsol
ute
abun
danc
e of
sel
ecte
d ca
lcar
eous
nan
nofo
ssil
taxa
acr
oss
the
Pale
ocen
e/Eo
cene
tra
nsiti
on i
n th
e Zu
mai
a se
ctio
n. T
he r
elat
ive
abun
danc
e of
Zygr
ablit
hus,
Dis
coas
ter
spp.
and
Fas
cicu
lithu
ssp
p. h
as b
een
calc
ulat
ed fr
om th
e n
on-(
Tow
eius
per
tusu
s +
C. p
elag
icus
) ass
embl
age.

We have observed significant changes in the occurrence and disappearance of several calcareousnannofossils taxa throughout the whole studied interval, however, the major turnover in the calcareousnannofossils has been recognized within the interval from about 5 m below to about 10 m above theP/E boundary, in which several genera become extinct or diversify (Fig. 37)
In the 40 cm thick marl bed capping the green limestone (Unit IV), just above the onset of theCIE and below the BEE, several first and last occurrences are registered, e.g. the LO of the last repre-sentatives of the genus Neocrepidolitus, a survivor of the mass extinction at the K/P boundary, as wellas the LOs of Munarrinus emrei, Fasciculithus alanii and Scapholithus apertus. The disappearance ofthe latter two species has been observed shortly below the BEE in several other sections in the Tethys(Bybell & Self-Trail, 1995; Angori & Monechi, 1996; Monechi et al., 2000a). In shallow marinedeposits of the Basque Basin, the LO of Sca. apertus has been used to approximate to the P/E bound-ary whenever the conventional markers are very rare or absent (Pujalte et al., 2003). The FOs of therepresentatives of the Rhomboaster-Tribrachiatus lineage occur in the same thin marly interval.
During the last 10 years, the morphological interpretation of the Rhomboaster-Tribrachiatus lineagehas been cotroversial (Bybel & Self-Trail, 1995; Aubry et al., 2000, von Salis et al., 2000). This taxonomicproblem is important, because Martini (1971) chose Rhomboaster bramlettei to mark the base of Zone NP10,an event usually used to approximate to the P/E boundary. In the present study and following the taxonomicremarks in Angori & Monechi (1996), we have differentiated 8 species of this lineage: 3 morphological vari-ants of Rh. bramlettei (Rh. bramlettei “short arms”, Rh. bramlettei “long arms”, Rh. bramlettei var. T),Rhomboaster spineus, Rhomboaster contortus, Tribrachiatus digitalis; Tribrachiatus cf. orthostylus andTribrachiatus orthostylus. We adopt the definition of Zone NP10 by Bybell & Self-Trail (1995, see alsoAngori & Monechi, in Molina et al., 2000), according to which the lowermost occurrence of Rhomboaster (i.e.Angori & Monechi’s Rh. bramlettei s.a.) defines the base of the Zone NP10.
The FO of Rh. bramlettei s.a. has been pinpointed 30 cm above the onset of the CIE and 10 cmbelow the BEE. This is somewhat lower than observed in other sections of the Basque Basin (Trabakua)and the Tethys area (Caravaca, Alamedilla) where the FO of this taxon occurs above the BEE. It has tobe noted that only very rare specimens of Rh. bramlettei s.a. are found below the BEE at Zumaia whichcan only be detected by an exhaustive study over several tracks. Together with Rh. bramlettei s.a. a raretriradiate form has been identified. Those forms, called T. cf. orthostylus by Monechi et al. (2000a),have been observed in a similar stratigraphic position (some meters below the occurrence of T.orthostylus s.str.) in several other sections, e.g. Caravaca and Alamedilla (Angori & Monechi, 1996;Monechi et al., 2000a).
Just above the 1.3 m non-calcareous interval of the lower part of the SU, we find the FO ofDiscoaster araneus, Rh. bramlettei l.a. and Rh. spineus in meters 1.65, 1.7 and 3 m respectively.Together with Discoaster anartios, which is absent in Zumaia, this species constitutes theRhomboaster-Discoaster araneus association (Aubry, 2001), a short-lived species association charac-terized by nannoliths with anomalous structure. The stratigraphic distribution of the Rhomboaster-Discoaster araneus association at Zumaia, as in other sections of the Tethys and North Atlantic region,is restricted to the PETM interval.
The FO of the remaining species of the Rhomboaster-Tribrachiatus lineage species have beenobserved starting from the top of the SU (Fig. 37). Rh. bramlettei var T has its FO 4.65 m above theCIE onset, approximately at the level where the carbonate content begins to reach pre-P/E boundaryvalues. T. digitalis, used to mark the base of the Subzone NP10b (Aubry, 1996) and proposed as a gooddatum to correlate deep marine successions with the base of the Ypresian stage (Aubry, 1996), has beendetected only in two samples (in meter 8.25 and 9.25). In Zumaia, the occurrence of this taxon is very
The Paleocene and lower Eocene of the Zumaia section
- 65 -

rare and discontinuous; it has not been found by Schmitz et al. (1997), whereas Monechi et al. (2000b)report it in only one sample. The FO of Rh. contortus was observed at meter 10.1, and its LO in meter21.35, 50 cm above the FO of T. orthostylus at the top of the studied part of the succession (Fig. 37).
The quantitative analysis carried out in Zumaia allowed recognizing well defined different infor-mal assemblage intervals that document the changes in the calcareous nannofossil during the PETMtime interval.
Five assemblage (intervals) zones can be recognized: two below the onset of the CIE and threeabove it (Fig. 38).
The Paleocene assemblage (Zone A) is characterized by abundant C. pelagicus, Tw. pertusus, andthe representatives of the genus, Fasciculithus, Discoaster and Sphenolithus, the former being quiterich in number of species. The calcareous nannofossil abundance and species richness is high (40 to 50species and S-H higher than 2,1), indicative of general stable oceanic conditions with a stratiphiedwater column and low nutrient content.
The boundary between the Zone A and Zone B is marked in the studied sections by the begin-ning of a decreasing trend (drop) in Fasciculithus both in abundance and species richness and by areverse increase in abundance of Zygrhablithus. Although the average diversity is still high (S-H val-ues around 2), greater fluctuations can be observed in the number of species from sample to sample(from 36 to 51 species per sample). The calcareous nannofossil assemblage stability of zone A was bro-ken; a prelude of the geochemical and oceanic changes at the PETM.
The base of the following assemblage Zone C coincides with the onset of the CIE and it ismarked by an increase of Discoaster and Fasciculithus and by a sharply decrease in the abundance ofZygrhablithus. Rhomboaster is also recorded in connection with the onset of the CIE.
This zone includes the whole CIE and on the basis of the species recognized and of their fluctu-ations in abundanceit can be subdivided into two parts: a lower part Zone C-1 and an upper part ZoneC-2. Zone C-1 (Figs. 38) corresponds approximately to the interval between the onset of the CIE andthe BEE and it is discriminated at the base and top by two distinctive increases in abundance ofDiscoaster, mainly D. multiradiatus (rare D. nobilis, D. delicatus and D. falcatus), and ofFasciculithus, mainly F. tympaniformis (rare F. cf. hayii and F. thomasii). Zygrhablithus shows a sig-nificant abundance decrease and an inverse correlation with Fasciculithus. The calcareous nannofossilrichness shows a slight decrease throughout this zone (Zone C-1) both in the number of species persample (e.g. from 40 to 30 in Zumaia) and in the S-H index values (from 2 to 1,3). These changes inZumaia occurs parallel to the abrupt turnover of calcareous nannofossils in high latitudes and can beexplained as a sudden expansion of the low latitude warm water assemblages to high latitudes proba-bly due to an abrupt increase of the surface water temperatures. The calcareous nannofossil assemblagefluctuations recorded in Zumaia could be the reflection of different pulses of that expansion, with thedeterioration of the stable water column conditions of the upper Paleocene and the establishment ofmore unstable conditions.
The upper part of Zone C, Zone C-2, corresponds to the interval between the BEE (around theminimum carbon isotope values) up to the level where δ13C returns to pre-excursion values. It is distin-guished by abundant Fasciculithus (which shows a marked decreasing trend across this zone) and bythe absence of Zygrhablithus. Zone C-2 shows lower calcareous nannofossil abundances and speciesdiversity, but the most important feature that characterizes this interval is the presence of the so-calledD. araneus-Rhomboaster assemblage, an event restricted to the PETM of the Tethys-Atlantic province(Kahn & Aubry, 2004).
Climate & Biota of the Early Paleogene, Bilbao 2006
- 66 -

In Zumaia the RD-assemblage appears a bit higher than the onset of the CIE, at the base of ZoneC2, approximately at the level where the benthic foraminifera extinct around the minimum carbon iso-tope values, and disappear when the δ13C return to pre-boundary values.
D. araneus is regularly present in the entire Zone but its maximum abundance is registered inthe middle part of it (very low δ13C values). As reported in Figure 38 R. bramlettei long arms has thesame range as D. araneus, whereas D. spineus only appears sporadically. R. bramlettei short arms, thathas its FO before the other representatives of the RD-assemblage, shows its highest abundance in con-nection with δ13C low values, and becomes less common with the extinction of the other representa-tives of the RD-assemblage. In fact, when δ13C return to pre-excursion values D. araneus, Rhomboasterspineus, and Rhomboaster bramlettei long arms disappear and R. bramlettei short arms become lessabundant. The origin and paleoecologic affinities of most of the representatives of the R-D assemblageis unknown, especially those of the Rhomboaster-Tribrachiatus lineage. According to the shape andmorphological features of the some forms included in the R-D assemblage, we suggest that at least D.araneus , D. anartios and Rh. bramlettei long arms and Rh. spineus, as well as Discoaster with a bigstem, should be interpreted as malformed forms produced by the increase in CO2 concentration. Thepresence (abundance) of these taxa in different areas could indicate the proximity to the zones wherethe methane was released.
The following Zone D correlates with the return of the δ13C to pre-excursion values and recordsimportant changes in calcareous nannofossil assemblages. Zygrhablithus reappears and increases con-siderable, becoming one of the most abundant taxa together with C. pelagicus, Toweius and minorSphenolithus, whereas Discoaster and Fasciculithus experiment an important relative abundancedecrease. The RD-assemblage is no longer present and only some representative of R. bramlettei shortarms can be found.
A relative abundance increase of Neochiastozygus, Hornibrookina and Braarudosphaerabigelowii can also be found. Together with all these changes and in parallel to the δ13C increase thereis a relatively fast raise in the calcareous nannofossil abundance and species richness (S-H 1,75 and 25-32 species per sample). These changes are indicative of an important turnover in the ocean water col-umn structure.
5.6. Planktic foraminifera across the P/E boundary interval (X. Orue-Etxebarria, E. Apellaniz, F.Caballero)
Planktic foraminifer assemblages are rich; the number of specimens per gram of dried residueranges from 19.000 to 55.000, occasionally reaching up to 80.000 specimens in samples from a fewmeters below the SU. In contrast, from most samples of the SU less than 200 specimens per gram wereobtained. The proportion of planktic foraminifers versus total foraminifers is usually larger than 90%and in many occasions exceeds 95%. Preservation of tests is generally good; some details of the orna-mentation are normally less clearly developed than in tropical specimens and may occasionally ble-blurred due to secondary incrustations and/or recrystallization. A total of 37 species of plankticforaminifera have been recognized. The stratigraphic distribution of these species is shown in figure39.
Planktic foraminifera of the Zumaia section had already been examined by several previousauthors (Hillebrandt, 1965; Canudo & Molina, 1992; Arenillas & Molina, 1995; Canudo et al., 1995;Pardo et al., 1996; Schmitz et al., 1997; Arenillas & Molina, 2000 and Orue-Etxebarria et al., 2001).
The Paleocene and lower Eocene of the Zumaia section
- 67 -
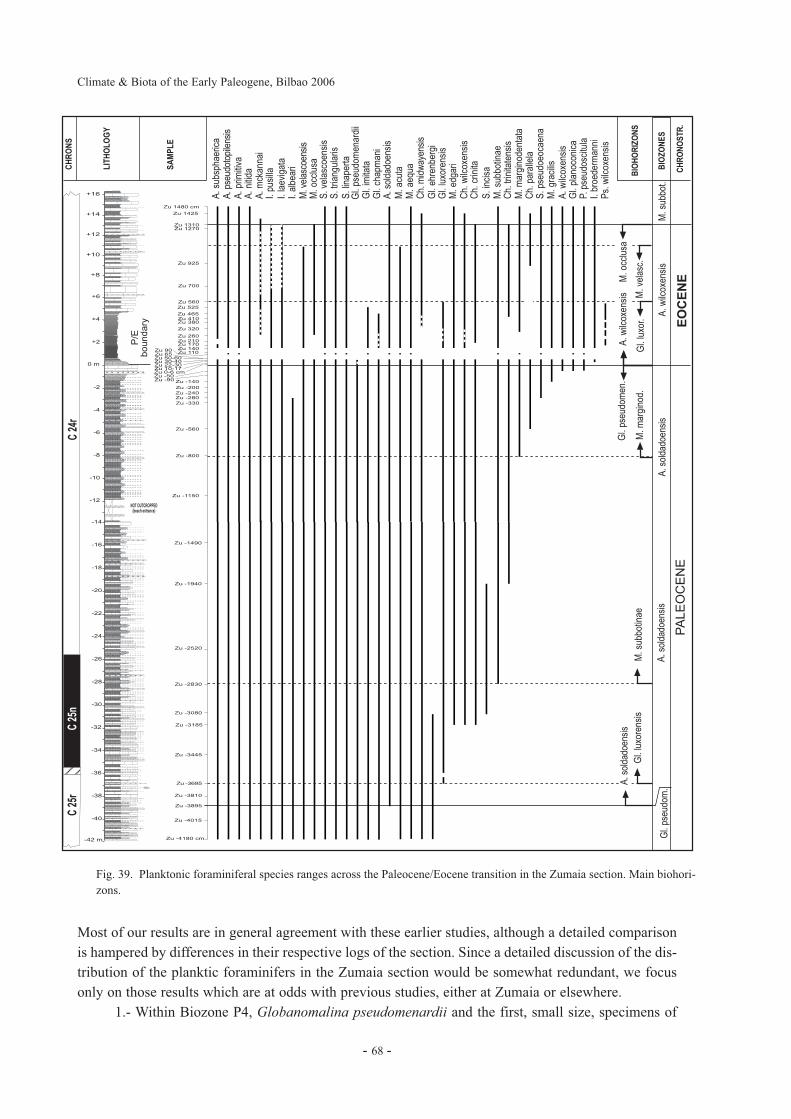
Most of our results are in general agreement with these earlier studies, although a detailed comparisonis hampered by differences in their respective logs of the section. Since a detailed discussion of the dis-tribution of the planktic foraminifers in the Zumaia section would be somewhat redundant, we focusonly on those results which are at odds with previous studies, either at Zumaia or elsewhere.
1.- Within Biozone P4, Globanomalina pseudomenardii and the first, small size, specimens of
Climate & Biota of the Early Paleogene, Bilbao 2006
- 68 -
%��;>B#���
%��;><?
%��;=;#%��;<C#
%��A<?
%��C##
%��?"#%��?<?
%��>"?%��>;#%��=B#
%��=<#
%��<"#%��<;#%��;C#%��;>#%��;;#%��A#
%��"?%��?#�"#%��=#�>#%��<<�=#%��;#�;C%��#�"���%���?#%���A# %���;>#
%���<##%���<>#%���<B#%���==#
%���?"#
%���B##
%���;;?#
�& ���
�& &! $&''��-���+�������+�0
�;<
�D�(
��� ,
����
��
D� ��
���
�D��
�
��
���
�D��
�**
����
J�D�
��,
����
��
��
��:
��
��
%���;>A#
%���;A>#
%���<?<#
%���<B=#
%���=#B#
%���=;B?
%���=>>?
%���="A?
%���=B;#
%���=BA?
%���>#;?
%���>;B#���
�<>
�<<
�<#
�;B
�<"
�<B
�;>
�;"
�="
�=>
�=<
�=#
�=B
�>#
.9�
.9�
J�D�
����
�
D
�><��
�D��
�
��
���
�6�
* ��
��
�;#
�B
�"
@;<
@;>
@;"
@;#
@B
@<
@>
@"
�<
�>
#��
��D�(
��� ,
����
��D�
*� �
���
���
�D��
���
���
���
J�D�
���
� �
��
�D�(
��� ,
����
��
D�-�
�����
/D��
���
� �
��
�'D
���
���
��
D���
-��
���
�
�'D
�����
����
����
�D��
�**
����
�'D
�����
���
'D�(
��� ,
����
��
D��-
��
J�D�
��,
����
��
�'D��
�(
����
���
D��M
��
D���
��D
�� �
�����
J�D�
�'�
��
�J
�D���
���
J�D�
����
�
���
��
/D���
���
��/D
����
�-��
���
/D�&
���
� ��
���
�D�
����
��
D�&��
��
�����
�D��
*��
��D�
��&
�-�
�D�
����
���D
���5
��
��D
�����
�D
�����
���&
�D��
���
� �
�����
���D
���*
��'
����
�D��
�**
�D�D
�� �
�����
%�&"&
���
�$&
�&�
$,
��)'�
�
�� �
&�&
�8
�$&��
%�&�&$�"&��
�D��
�-�
� D
J�D�
����
�
��D
J�D�
��,
�D�
D�&��
��D
�D�(
��� ,
����
�
J�D�
�'��
�*��
-�
/D���
���
./�
Fig. 39. Planktonic foraminiferal species ranges across the Paleocene/Eocene transition in the Zumaia section. Main biohori-zons.

Morozovella subbotinae (Fig. 39) coexist; a fact that has been pointed out before in other sections sit-uated westward (Orue-Etxebarria et al., 1992; Orue-Etxebarria et al., 1996).
2. - In the Zumaia section, Gl. pseudomenardii ranges up to the P/E boundary (Fig. 39). Thisextended range is in contrast to the indications of other authors who place the last occurrence (LO) ofthis species at the boundary between zones P4 and P5 (Canudo y Molina, 1992; Canudo et al., 1995;Lu et al., 1998; Molina et al., 1999; Berggren et al., 2000; Arenillas & Molina, 2000). According toBlow (1979) this species extends until the Globorotalia (Acarinina) wilcoxensis berggreni Biozone ofthe basal Lower Eocene. From its first occurrence (FO) up to 11,50 m below the P/E boundary, thespecimens of Gl. pseudomenardii are rather frequent and reach a maximum diameter of 0,45 mm.However, above this level they become smaller and with a less distinct keel. Within 10 m below theCIE, they are very rare and reache a maximum size of 0,25 mm. This reduction in size and frequencydoes not coincide with any facies change. The persistent presence of Gl. pseudomenardii in all samplesof Zone P4 indicates that they are unlikely to correspond to reworked tests.
3.- The first specimens of Gobanomalina luxorensis occur in the lower part of the Acarinina sol-dadoensis Biozone, (Fig. 39). However they are very rare and become more common only from sam-ple Zu -280 cm onward. This is in contrast to the observations of Speijer & Samir (1997) in the east-ern Mediterranean Region that Gl. luxorensis is very rare below the BEE (< 0,1%), but becomes veryfrequent (up to 10% of total planktic foraminiferal assemblage) above this level where it is the domi-nant species within the Globanomalina lineage. In Zumaia, it always constitutes < 1% of the totalplanktic foraminiferal assemblages and the most representative of the genus Globanomalina in the top-most Paleocene is Gl. imitata.
4.- Nine out of 12 samples examined from the 4 m thick Siliciclastic Unit (Unit V), above theP/E boundary have provided planktic foraminifers, whereas other authors reported them from only onesample (Canudo & Molina, 1992; Canudo et al., 1995; Schmitz et al., 1997; Molina et al., 1999 andArenillas & Molina, 2000). Even after a very careful examination of all samples above the CIE onset,we have not found any specimens of Acarinina sibaiyaensis, Morozovella allisonensis and M. africana,species restricted to the PETM which were described by Kelly et al. (1996) and found by Lu et al.(1998) throughout the Tethys realm. These species have neither been found in other sections of thePyrenees (Orue-Etxebarria et al., 1996; Orue-Etxebarria et al., 2001 and Pujalte et al., 2003). They maybe characteristic of tropical latitudes (Kelly et al., 1996), or that M. allisonensis and A. sibaiyaensis areecophenotypical variants (Kelly et al. 1998). Pardo et al. (1999) A. sibaiyaensis and A. africana nei-ther in the Zumaia section, nor in Site 401 of the Bay of Biscay.
5.- Pseudohastigerina wilcoxensis is very rare in the Zumaia section and occurs very sporadical-ly at the lower part of the SU, approximately 1 meter above the onset of the CIE (Fig. 39).
6.- In Zumaia, we could not observe a significant increase in the proportion of acarininids in con-nection with the CIE (Fig. 40). Such an increase has been reported by Kelly et al. (1996, 1998) fromtropical regions, by Lu et al. (1998) and Pardo et al. (1999) from sections of the Tethys realm.
Representatives of the genera Subbotina, Morozovella and Acarinina dominate the plankticforaminiferal assemblages below the P/E boundary (Fig. 40). In contrast to Schmitz et al. (1997),Molina et al. (1999) and Arenillas & Molina (2000) we find a significant increase in the proportion ofacarininids, from 15-20% to 30-40%, only from sample Zu 465 cm, i.e. well above the CIE onset.However, most samples from the SU contain too few specimens (< 200 per gram) of plankticforaminifera to allow significant analyses of the proportions of the planktic foraminiferal genera.
7.- In the planktic foraminiferal assemblages of the Zumaia section, no drastic changes atspecies level occur in conjunction with the P/E boundary. The same species dominate below and aboveit. Above the SU, LOs of species such as Globanomalina chapmani, Gl. imitata, Igorina pusilla and
The Paleocene and lower Eocene of the Zumaia section
- 69 -

I. laevigata are gradual (Fig. 39). The occurrence of the latter species in samples above the P/E bound-ary casts some doubts on the use of their LOs as markers for the P/E boundary, which according toArenillas & Molina (1996) coincide with the FOs of A. sibaiyaensis and A. africana.
8.- The planktic foraminiferal biozonation of the interval around the P/E boundary has experi-enced several modifications since Berggren et al. (1995). The LO of Parasubbotina variospira insteadof the LO of Acarinina subsphaerica is used by Berggren et al. (2000) to draw the boundary betweensubzones P4a and P4b of the Globanomalina pseudomenardii Zone (P4).
The Morozovella velascoensis Zone (P5) has been subdivided into two subzones making use ofthe LO of Igorina laevigata (Arenillas & Molina, 1996). Another subdivision of Zone P5 uses the FOsof Acarinina sibaiyensis and/or of A. africana which is thought to coincide concide with the LO of
Climate & Biota of the Early Paleogene, Bilbao 2006
- 70 -
�D��
�**
����
J�D�
��,
����
���
D���
-��
DJ
�D���
��
���
DJ
�D���
, �D
�D�&
���
D
�6�
* ��
��
I�/
�**
���
<? ?# I��
����
��
<? I��-
���
<? I��
� 8
&��
�
<? I��
'��
-���
*D
I�J
� *
� �
�D
1./
1.7
1..
1.�
1.
1�C
1�A
1.9
1.6
1.B
1.A
1.C
�& &! $&''��-���+�������+�0
1�.
1��
1�
1C
1A
1B
16
1�7
1�/
1�9
1�6
1�B
./�
D�.
D�7
@;>
@;?
@;"
D��
D�
DC
DA
DB
D�
D.
D7
D/
D9
D6
1�
1.
17
1/
19
�
176
179
17/
177
17.
17�
17
17B
17A
17C
1/
1/�
.9�
.9�
�D�
��D��
D����
D�D
�� �
����
�����
D�(���
,��
���
J�D��
���
D����
D�� �
D%�&"&
���
�����&��(��'���(���������������$
�D�(
��� ,
D���
D� ��
�D
%�&�&
$�"&
���
D� ��
���
�D�(
��� ,
��D
�D��
�
��
���
Fig. 40.- Relative abundance of planktic foraminiferal genera across thePaleocene/Eocene transition in the Zumaia section. Note the significant increment ofAcarinina's proportions take place around 6,5 m above the P/E boundary.
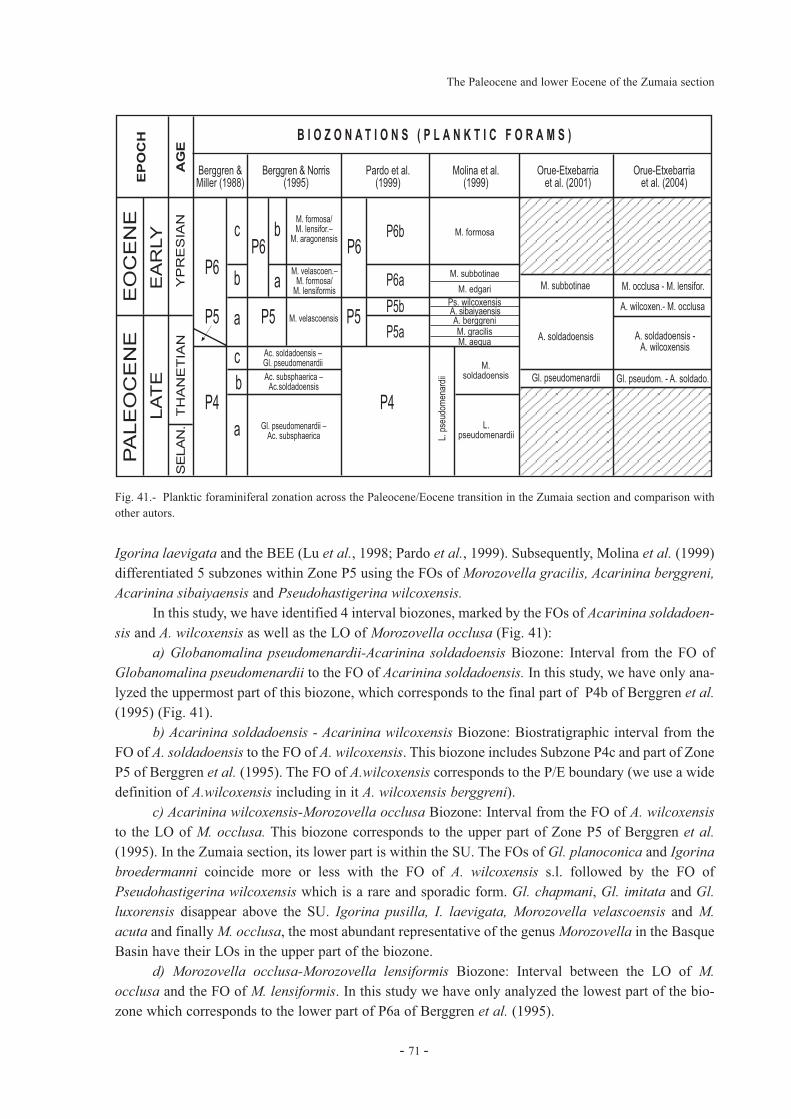
Igorina laevigata and the BEE (Lu et al., 1998; Pardo et al., 1999). Subsequently, Molina et al. (1999)differentiated 5 subzones within Zone P5 using the FOs of Morozovella gracilis, Acarinina berggreni,Acarinina sibaiyaensis and Pseudohastigerina wilcoxensis.
In this study, we have identified 4 interval biozones, marked by the FOs of Acarinina soldadoen-sis and A. wilcoxensis as well as the LO of Morozovella occlusa (Fig. 41):
a) Globanomalina pseudomenardii-Acarinina soldadoensis Biozone: Interval from the FO ofGlobanomalina pseudomenardii to the FO of Acarinina soldadoensis. In this study, we have only ana-lyzed the uppermost part of this biozone, which corresponds to the final part of P4b of Berggren et al.(1995) (Fig. 41).
b) Acarinina soldadoensis - Acarinina wilcoxensis Biozone: Biostratigraphic interval from theFO of A. soldadoensis to the FO of A. wilcoxensis. This biozone includes Subzone P4c and part of ZoneP5 of Berggren et al. (1995). The FO of A.wilcoxensis corresponds to the P/E boundary (we use a widedefinition of A.wilcoxensis including in it A. wilcoxensis berggreni).
c) Acarinina wilcoxensis-Morozovella occlusa Biozone: Interval from the FO of A. wilcoxensisto the LO of M. occlusa. This biozone corresponds to the upper part of Zone P5 of Berggren et al.(1995). In the Zumaia section, its lower part is within the SU. The FOs of Gl. planoconica and Igorinabroedermanni coincide more or less with the FO of A. wilcoxensis s.l. followed by the FO ofPseudohastigerina wilcoxensis which is a rare and sporadic form. Gl. chapmani, Gl. imitata and Gl.luxorensis disappear above the SU. Igorina pusilla, I. laevigata, Morozovella velascoensis and M.acuta and finally M. occlusa, the most abundant representative of the genus Morozovella in the BasqueBasin have their LOs in the upper part of the biozone.
d) Morozovella occlusa-Morozovella lensiformis Biozone: Interval between the LO of M.occlusa and the FO of M. lensiformis. In this study we have only analyzed the lowest part of the bio-zone which corresponds to the lower part of P6a of Berggren et al. (1995).
The Paleocene and lower Eocene of the Zumaia section
- 71 -
�'& �
���
�2
��
����
�/����
D
����
��
3�F
% � & " & � � � & � � - ' � � � � � ( & $ � ) � 0
���--����4������� ;ABB$
�"
�?
�>
�?
�
*
�*
�"*
�D�� �� �6�D������� �DN
�D��- ������
�D�&���� ��DN�D�� �� �6
�D������� ����
�D�&���� �����
��D�� � ������NJ�D����� ��������D���*��'�����N��D� � �����
J�D����� �������N��D���*��'����
�D�� � �����
�D���** ����F�
3�
/��
�
�:
��
��
���--����4�� ���� ;AA?$
��
��
:�
��
�
J�D����� �D����D�� � D
�D�� � ��������D�(��� ,�����
�D� ���������D������� �D
�D�(��� ,��D���D� �����
:������,�*�������D� <##;$
:������,�*�������D� <##>$
�? �?*�?
��D�(��� ,������D���*��������D�*��--�����D�-������
�D� � �����
�>�D
���� �������D��
���
���
��
�
�D��M�
�"
�"
�"*
�D���** ����
�D��-��
�D�� �� �
�� �����D ;AAA$
� ��������D ;AAA$
J�D����� ������
Fig. 41.- Planktic foraminiferal zonation across the Paleocene/Eocene transition in the Zumaia section and comparison withother autors.

Climate & Biota of the Early Paleogene, Bilbao 2006
- 72 -
,'%4!%+%<,,%/��7+%�;+
%4!%+%'42%/�=,/%0;+
�@�@
A@
$;1%/0;�=6����� ����������8
�@B
�@B
�@B
0�&%0%/;%0
';�74'4&=
�"&�!�
����"&�!�
������!��
�!���!��
����� �!� �
&��&�#�"�%
)��
����
���
���4
��"
�6�CC
�8
&�&"0����������
���
����
���
���
��������
�����
��
�
���
��
���
���
�����
�� �
������!��
�!���!��
����� �!� �
&��&�#�"�% ��������� ����
Fig.
42.
- Ben
thic
fora
min
ifera
l ass
embl
agle
s ac
ross
the
Sela
ndia
n/Th
anet
ian
trans
ition
in th
e Zu
mai
a se
ctio
n

The Paleocene and lower Eocene of the Zumaia section
- 73 -
5.7. Benthic foraminifera from the Paleocene/Eocene transition (Laia Alegret and Silvia Ortiz)Benthic foraminiferal assemblages from the Paleocene-Eocene transition at Zumaia have been
studied by Ortiz (1995) and Kuhnt and Kaminski (1997), among others. Assemblages contain abundantrepresentatives of the Velasco-type fauna and from the agglutinated flysch-type fauna, and they indi-cate a middle to lower bathyal depth of deposition (Fig. 43).
Upper Paleocene benthic foraminiferal assemblages consist of highly diversified communitiesthat contain 30-50% of agglutinated taxa. A wide range of morphotypes is recorded in the upperPaleocene, including biconvex trochospiral (e.g., Anomalinoides rubiginosus, Stensioeina beccari-iformis), planoconvex trochospiral (Cibicidoides hyphalus, C. velascoensis), rounded trochospiral (e.g.,Cribrostomoides trinitatensis, Gyroidinoides globosus), rounded planispiral (e.g., Pullenia coryelli),cylindrical tapered (e.g., Bulimina velascoensis, Dotothia retusa, Clavulinoides amorpha), or flattenedtapered morphotypes (e.g., Hormosina velascoensis), among others. Assemblages contain both infau-nal and epifaunal morphogroups, and they are dominated by oligotrophic, deep-water taxa that arecommon under well-oxygenated conditions.
A global extinction event of deep-sea benthic foraminifera (BEE) has been identified in coin-cidence with the P/E boundary not only at Zumaia, but also at many other sites and sections worldwide(Tjalsma and Lohmann, 1983; Thomas, 1998, 2003). The P/E boundary at Zumaia is marked by a dra-matic decrease in diversity of the benthic foraminiferal assemblages, and the extinction of ~30% of thespecies. The extinction of Stensioeina beccariiformis is significant, because the extinction of its shal-low-water type (Angulogavelinella avnimelechi) allows correlation to the extinction event at shallow-er settings.
A sharp increase in the relative abundance of small, thin-walled agglutinated taxa such asHaplophragmoides spp., Repmanina charoides or Trochammina spp. (up to 80% of the assemblages),is also recorded in a dissolution interval located in the lowermost Eocene. Such an increase in the per-centage of agglutinated foraminifera has been observed to occur at the beginning of the CIE-intervalnot only in Zumaia and in other bathyal sections from the Basque Basin (Orue-Etxebarria et al., 1996),but also in many sections across the world (e.g., Thomas, 1998), including the stratotype section atDababiya (Egypt; Alegret et al., 2005).
Above the dissolution horizon, the calcareous oligrotrophic species Nuttallides truempyi andOridorsalis umbonatus dominate the assemblages, and agglutinated species such as Karrerulina con-versa or Repmanina charoides are also common (Ortiz, 1995; Kuhnt and Kaminski, 1997). Diversityof the Eocene assemblages is lower than in the Paleocene, suggesting that benthic foraminiferal assem-blages from the lowermost 15 m of the Eocene had not completely recovered from thePaleocene/Eocene event. Further studies are needed to describe in more detail the recovery of the ben-thic foraminiferal assemblages after the P/E boundary, and to look into the causes of the dissolutioninterval in the lowermost Eocene at Zumaia.
ACKNOWLEDGEMENTSSincere thanks are given to all the Organisms that have generously sponsored the CBEP2006
International Meeting and Field trips, the logos of which are shown on the back cover of this book.Contributing authors to this guide acknowledge continuing financial support to their researches
from the following Institutions: University of the Basque Country, for 9/UPV00121.310-1455/2002and previous Research Projects, and the Ministry of Science and Technology of the SpanishGovernment, for CGL2005-01721/BTE, CGL2005-02770/BTE and previous Research Projects. Inaddition, G. Bernaola acknowledge a post-doctoral grant from the Basque Country Government, andJ.I. Baceta and L. Alegret a research grant from Ministerio de Educación y Ciencia.

Climate & Biota of the Early Paleogene, Bilbao 2006
- 74 -
��#���������5��
'����+���
��+���
"#������+����
�,!,
�'�
�'C
�'��
0������������
0������!���
������������
**
�
�!��
����
����
�!��
�'���
���
!�*� �
�-��
���
�!
�$��
� �
������
DD
!��
� ���
����
���
3!��
�$$�
�����
�& � !����
**
��
'����+���
��+���
�& � !
����
.9�
�!
�$��
� �
�����&
�D��
"����������
�������
%(�
�'A
./�
.9�
% !�
�-�
����
���!��
� ��
����
���
�!
�$��
� �
������
DD
�!�*
� ��-
����
���
!��&�
����
% !�
�-�
����
��
�!
����
�����
�
�!��
�����
�" �
�3
!����
���
Fig.
43.
- Zum
aia
P/E
boun
dary
tran
sitio
n pi
ctur
e sh
owin
g th
e pr
ecis
e lo
catio
n of
the
prin
cipa
l tec
toni
c st
ruct
ures
and
mag
nest
ostra
togr
aphi
c an
d ca
lcar
eous
pla
nkto
n ev
ents
.

REFERENCES
Adatte, T., Bolle, M.P., de Kaenel, E., Gawenda, P, Winkler, W. and von Salis, K. (2000): Climatic evolution from Paleoceneto earliest Eocene inferred from clay-minerals: a transect from northern Spain (Zumaya) to southern (Spain, Tunisia)and southeastern Tethys margins (Israel, Negev). GFF, 122: 7-8.
Agnini C., Fornaciari E., Giusberti L., Backman, J., Capraro, L., Grandesso P., Luciani V., Muttoni, G., Rio D. and Tateo F.,(2005): The early paleogene of the Valbelluna. Early cenozoic extreme climates (ODP Leg 208 Post Cruise Meeting)Field trip Guidebook.
Alegret, L., Ortiz, S., Arenillas, I. and Molina, E., (2005): Paleoenvironmental turnover across the Paleocene/Eocene bound-ary at the Stratotype section in Dababiya (Egypt) based on benthic foraminfiera. Terra Nova 17, 526-536.
Ali, J.R. and Hailwood, E.A., (1998): Magnetostratigraphic (re) calibration of the Paleocene/Eocene boundary interval inboles 550 and 549, Goban Spur, eastern North Atlantic. Earth Planet. Sci. Lett., 161, 201-213.
Ali, J.R., Kent, D.V. and Hailwood, E.A., (2000): Magnetostratigraphic reinvestiga-tion of the Palaeocene/Eocene boundaryinterval in Hole 690B, Maud Rise, Antárctica. Geophys. J. Int., 141, 639-646.
Alvarez, L.W., Alvarez, W., Asaro, F. and Michel, H.V. (1980): Extraterrestrial cause for the Cretaceous-Tertiary extinction.Science 208, 1095-1108.
Alvarez, W., Alvarez, L.W., Asaro, F. and Michel, H.V. (1982): Current status of the impact theory for the terminal Cretaceousextinction. Geological Society of America Special Paper, 190, 305-315.
Alvarez, W., Alvarez, L.W., Asaro, F. and Michel, H.V. (1984): The end of the Cretaceous: Sharp boundary or gradual transi-tion. Science 223, 1183-1186.
Angori, E. and Monechi, S. (1996): High-resolution nannofossil biostratigraphy across the Paleocene-Eocene boundary atCaravaca (southern Spain). Israel Journal of Earth Sciences., 44: 197-206.
Apellaniz, E. (1998): Los foraminíferos planctónicos en el tránsito Cretácico-Terciario: análisis de cuatro secciones en depósi-tos de cuenca profunda de la Región Vasco-Cantábrica. Tesis Doctoral, Univ. País Vasco, 390 p.
Apellaniz, E. (1999): Los foraminíferos planctónicos en el tránsito Cretacico-Terciario. Análisis de 4 secciones en depósitosde cuenca profunda en la Región Vasco-Cantábrica. Tesis doctoral. UPV/EHU, 1-391.
Apellaniz, E., Lamolda, M.A. y Orue-Etxebarria, X. (1983): Posición estratigráfica de las “Calizas del Danés”, País Vasco.Revista española de Micropaleontología, 15, 447-455
Apellaniz, E., Baceta, J.I., Bernaola, G., Núñez-Betelu, K., Orue-Etxebarria, X., Payros, A., Pujalte, V., Robin, E. and Rocchia,R. (1997): Analysis of uppermost Cretaceous-lowermost Tertiary hemipelagic successions in the Basque country(Western Pyrenees): evidence of a sudden extinction of more than half planktic foraminifer species at the K/T bound-ary. Bull. Soc. Geol. France, 168: 783-793.
Apellaniz, E., Orue-Etxebarria, X. and Luterbacher, H. (2002): Evolution of the Early Paleocene planktonic foraminifera: ABasque point of view. N.JB. Geol. Paläont. Abh, 225(2), 157-194
Arenillas, I. (1996): Los foraminíferos planctónicos del Paleoceno-Eoceno inferior: sistemática, bioestratigrafía, cronoestrati-grafía y paleoceanografía. Tesis Doctoral, Univ. Zaragoza, 513 p.
Arenillas, I. y Molina, E. (1995): Análisis cuantitativo de los foraminíferos planctónicos del Paleoceno de Zumaya: implica-ciones paleoambientales y eventos paleoceanográficos. - Geogaceta, 17: 23-26.
Arenillas, I. y Molina, E. (1996): Bioestratigrafía y evolución de las asociaciones de foraminíferos planctónicos del tránsitoPaleoceno-Eoceno en Alamedilla (Cordilleras Béticas). Revista Española de Micropaleontología. 18, 75-96.
Arenillas, I., Arz, J.A. y Molina, E. (1998): El límite Cretácico-Terciario en Zumaia, Osinaga y Musquiz (Pirineos): controlbioestratigráfico y cuantitativo de hiatos con foraminíferos planctónicos. Rev. Soc. Geol España, 11: 127-138.
Arenillas, I. y Molina, E. (2000): Reconstrucción paleoambiental con foraminíferos planctónicos y Cronoestratigrafía del trán-sito Paleoceno-Eoceno de Zumaya (Guipúzcoa). Revista Española de Micropaleontología. 32(3): 283-300.
Aubry, M. P. (1994): The Thanetian Stage in NW Europe and its significance in terms og global events. GFF 116, 43-44.Aubry, M.-P. (1996): Towards an Upper Paleocene-Lower Eocene High Resolution Stratigraphy Based on Calcarous
Nannofossil Stratigraphy. Israel. J. of Earth Sc. 44, 239- 253. Aubry, M.P. (1998): Early Paleogene calcareous nannoplankton evolution: A tale of climatic deterioration. - In: Aubry, M. P,
Lucas, S. & Berggren, W. A. (Eds.): Late Paleocene-early Eocene climatic and biotic events in the marine and terres-trial record: 158-203; New York (Columbia University Press).
Aubry, M.-P. (2000): Where should the Global Stratotype Section and Point (GSSP) for the Paleocene/Eocene boundary belocated? Bul!. Soc. Géol. 171,461-66.
Aubry, M.P. (2001): Provincialism in the photic zone during the LPTM. - In: Ash, A. M. & Wing, S. L. (eds): Climate andBiota of the Early Paleogene, Internacional meeting, Wyoming, USA, 6p.
Aubry, M.P. and Berggren, W.A. (2000): The Homeless GSSP: The dilemma of the Paleocene/Eocene boundary. TertiaryResearch. 20, 107-112
The Paleocene and lower Eocene of the Zumaia section
- 75 -

Aubry, M.P, Requirand, C. and Cook, J. (2000): The Rhomboaster-Tribrachiatus lineage: A remarkable succession of eventsfrom 55.5 to 53.2 Ma. - GFF, 122: 15-18.
Baceta, J.I. (1996): El Maastrichtiense superior, Paleoceno e Ilerdiense inferior de la Región Vasco-Cantábrica: SecuenciasDeposicionales, Facies y Evolución Paleogeográfica. Tesis Doctoral, Univ. País Vasco, 372 p.
Baceta, J.I., Pujalte, V. y Orue-Etxebarria, X. (1991): Rasgos erosivos y deposicionales en la zona proximal de un “slope-apron” carbonatado del Paleoceno Inferior (Eibar, Cuenca Vasca). Geogaceta, 10: 76-78.
Baceta, J.I., Pujalte, V., Dinarès-Turell, J., Payros, A., Orue-Etxebarria, X. and Bernaola, G. (2000): The Paleocene-Eoceneboundary interval in the Zumaia section (Gipuzkoa, Basque basin): magnetostratigraphy and high-resolution lithos-tratigraphy. Rev. Soc. Geol. España, 13: 375-391.
Baceta, J. I.; Wright, V. P. and Pujalte, V. (2001): Palaeo-mixing zone karst features from Palaeocene carbonates of northSpain: criteria for recognizing a potentially widespread but rarely documented diagenetic system. SedimentaryGeology: 139, 205-216.
Baceta, J. I., Pujalte, V., Serra-Kiel, J., Robador, A. and Orue-Etxebarria, X. (2004): El Maastrichtiense final, Paleoceno eIlerdiense inferior de la Cordillera Pirenaica. In: J.A. Vera (Ed.), Geología de España. Sociedad Geológica de España-Instituto Geológico y Minero de España, Madrid, pp. 308-313.
Baceta, J.I., Pujalte, V. and Bernaola, G. (2005): Paleocene coralgal reefs of the western Pyrenean Basin, N Spain: evidenceconcerning the post-Cretaceous recovery of reefal ecosystems. Palaeogeogr., Palaeoclimatol., Palaeoecol , 224: 117-143.
Barnolas, A., Robador, A., Serra-Kiel, J. and Caus, E. (1990): Introduction to the early Paleogene of the south Pyrenean basin(IGCP 286, Early Paleogene benthos, field-trip). ITGE, Madrid, 159 p.
Beerling, D. J. and Jolley, D. W. (1998): Fossil plants record and atmospheric 12CO2 and temperature spike across thePalaeocene-Eocene transition in NW Europe. — Journal of the Geological Society, London. 155, 591-594.
Berggren, W.A., Kent, D.V., Swisher, C.C.III and Aubry, M.P. (1995): A revised Cenozoic geochronology and chronostratig-raphy. In: Geochronology, time scales and global stratigraphic correlations (Berggren, W.A., Kent, D.V., Aubry, M.P.and Hardenbol, J., Eds.). S.E.P.M. spec. publ., 54: 129-212.
Berggren, W.A. and Aubry, M.-P., (1998). The Paleocene/Eocene Epoch/Scries Bounday: Chronostratigraphic Frame-workand Estimated Geochronology. In: Late Palaeocene-Early Eocene Climatic and Biolic Events in the Marine andTerrestrial Records (M.-P. Aubry et al., eds), pp. 18-36. Columbia University Press, New York.
Berggren, W.A., Lucas, S. and Aubry, M.-P. (1998). Late Paleocene-Early Eocene Climatic and Biotic Evolution: Anoverview. In: Late Palaeocene-Early Eocene Climatic and Biotic Events in the Marine and Terre.itrial Records (M.-P.Aubry et al., eds), pp. 15-17. Columbia University Press, New York.
Berggren, W.A., and Miller, K.G., 1988. Paleogene tropical planktonic foraminiferal biostratigraphy and magnetobiochronol-ogy. Micropaleontology, 34:362-380.
Berggren, W. A., Aubry, M.P., Van Fossen, M., Kent, D. V, Norris, R. D. & Quillévéré, F. (2000): Integrated Paleocene cal-careous plankton magnetobio-chronology and stable isotope stratigraphy: DSDP Site 384 (NW Atlantic Ocean) -Palaeogeography, Palaeoclimatology, Palaeoecology, 159: 1-51.
Berggren, W. A. and Ouda, K. H. (2003): Upper Paleocene - lower Eocene planktonic foraminiferal biostratigraphy of theDababiya section, Upper Nile Valley (Egypt). Micropaleontology, Supplement. VO- 49; NO- 1; PG- 61-92
Berggren, W. A. and Pearson, P. N. (2005): A Revised Tropical To Subtropical Paleogene Planktonic Foraminiferal Zonation.Journal of Foraminiferal Research.2005; 35: 279-298.
Bernaola, G. (2002): Los nannofósiles calcáreos del Paleoceno en el dominio Pirenaico. Bioestratigrafía, cronoestratigrafía ypaleoecología. Tesis Doctoral, Univ. País Vasco, 445 p.
Betzler, C. (1989): The upper Paleocene to middle Eocene between the rio Segre and the rio Llobregat (eastern southPyrenees). Facies, stratigraphy and evolution. Tübinger Geowiss. Arb., Reihe A, 2: 133 p.
Blow, W.H., (1979): ‘Cainozoic Globigerinida’. E.J. Brill, 3 Volumes, Leiden, 1413pp. Atlas.Bown, P.R. (2005). Selective calcareous nannoplankton survivorship at the Cretaceous-Tertiary boundary. Geology.Bralower, T. J. (2002): Evidence of surface water oligotrophy during the Paleo-cene-Eocene termal máximum: Nannofossil
assemblage data from Ocean Dril-ling Program Site 690, Maud Rise, Weddell Sea. - Paleoceanography, 17(2): 1023. Bralower, T. J., Zachos, J. C., Thomas, E., Parrow, M., Paull, C. K., Kelly, D. C., Premoly Silva, I., Sliter, W. V. and Lohmann,
K. C. (1995): Late Paleocene to Eocene paleoceanography of the ecuatorial Pacific Ocean: Stables isotopes recordedat ODP Site 865, Allison Guyot. — Paleoceanography, 10, 841-865.
Bybell, L. M. and Self-Trail, J. M. (1995): Evolutionary, biostratigraphic, and ta-xonomic study of calcareous nannofossilsfrom a continuous Paleocene/Eocene boundary section in New Jersey. U.S. Geol. Surv., Prof. Paper 1554, 36 pp.
Cande, S.C. and Kent, D.V. (1995): Revised calibration of the geomagnetic polarity timescale for the Late Cretaceous andCenozoic, J. Geophys. Res. 100. 6093-6095.
Canudo, J.I. and Molina, E. (1992): Planktic foraminiferal faunal turnover and bio-chronostratigraphy of the Paleocene-Eocene boundary at Zumaya (Northern Spain). Revista de la Sociedad Geológica de España, 5, 145-157.
Climate & Biota of the Early Paleogene, Bilbao 2006
- 76 -

Canudo, J.I., Keller, G., Molina, E. and Ortiz, N. (1995): Planktic foraminiferal turnover and d13C isotopes across thePaleocene-Eocene transition at Caravaca and Zumaya, Spain. Palaeogeogr. Palaeoclimatol. Palaeoecol., 114: 75-100.
Clemens, W.A. Archivald, J.D. and Hickey, L. J. (1981): Out with a whimper not a bang. Paleobiology 7, 293-298. Clyde, W.C. and Gingerich, P. D. (1998): Mammalian community response to the latest Paleocene thermalmaximum: An iso-
taphonomic study from the northern Bighorn basin, Wyoming. Geology 26:1011-1014. Courtillot, V., Féraud, G., Maluski, H., Vandamme, D., Moreau, M.G., and Besse, J. (1988): Deccan flood basalts and the
Cretaceous/Tertiary boundary: Nature, v. 333, p. 843-846. Cowie, J.W., Zieger, W., and Remane, J. (1989): Stratigraphic Commission accelerates progress, 1984-1989. Episodes, 112:
79-83.Cramer, B.S. (2001): Latest Palaeocene-earliest Eocene cyclostratigraphy: using core photographs for reconnaissance geo-
physical logging. Earth. Planet. Sci. Leu., 186, 231-244. Cremades, J. (1982): Contribución al conocimiento de los foraminíferos planctónicos y al estudio bioestratigráfico del Eoceno
y Oligoceno del sector oriental de las Cordilleras Béticas. Tesis Doctoral. Universidad de Granada. 350 p.Crouch, E.M., Heilmann-Clausen, C., Brinkhuis, H., Morgans, H.E.G., Rogers, K.M., Egger, H., and Schmitz, B. (2001):
Global dinoflagellate event associated with the Late Paleocene Thermal Maximum. Geology, 29:315–318. Cuevas, J.L. (1992): Estratigrafía del “Garumniense” de la Conca de Tremp, Prepirineo de Lérida. Acta Geol. Hisp., 27: 95-
108.Delacote, O., Renard, M., Laj, C., Perch-Nielsen, K., Premoli Silva, I. and Clauser, S. (1985): Magnétostratigraphie et bios-
tratigraphie du passage Crétacé-Tertiaire de la coupe de Bidart (Pyrenees Atlantiques). - Bull. Soc. géol. Fr., (8), I, 3,243-254.
Dinarès-Turell, J., Baceta, J.I., Pujalte, V., Orue-Etxebarria, X and Bernaola, G. (2002): Magnetostratigraphic and cyclostrati-graphic calibration of a prospective Paleocene-Eocene stratotype at Zumaia (Basque basin, Northern Spain). TerraNova, 34: 279-290.
Dinarès-Turell, J., Baceta, J.I., Pujalte, V., Orue-Etxebarria, X., Bernaola, G. and Lorito, S. (2003): Untangling thePalaeocene climatic rhythm: an astronomically calibrated Early Palaeocene magnetostratigraphy and biostratigraphyat Zumaia (Basque basin, northern Spain). Earth and Planetary Science Letters. 216, 483-500.
Eichenseer, H. (1988): Facies geology of late Maastrichtian to early Eocene coastal and shallow marine sediments, Tremp-Graus basin, northeastern Spain. Tesis Doctoral, Univ. Tübingen (Publicada en Arb. Inst. u. Mus. Geol. Pal.Universität Tübingen, 1, 273 p.
Farley, K. A., and S. F. Eltgroth (2003): An alternative age model for the Paleocene-Eocene thermal maximum using extrater-restrial 3He, Earth Planet. Sci. Lett., 208, 135– 148.
Garrido-Megías, A. y Ríos, L.M. (1972): Síntesis geológica del Secundario y Terciario entre los ríos Cinca y Segre (PirineoCentral de la vertiente surpirenaica, provincias de Huesca y Lérida). Bol. Geol. Min., 83: 1-47.
Gawenda, P., Winkler, W., Schmitz, B. and Adate, T (1999): Climate and bio-productivity control of carbonate turbidite sed-imentation (Paleocene to earliest Eocene, Gulf of Biskay, Zumaia, Spain). - Journal of Sedimentary Research, 69(6):1253-1261.
Gómez de Llarena, J. (1946): Revisión de algunos datos paleontológicos del Flysch cretáceo y nummulítico de España. Not.Com. Inst. Geol. Min. España, 15: 109-1665.
Gorostidi, A. (1993): Nanofósiles calcáreos y eventos del Cretácico Medio-Superior de la Cuenca Vasco-Cantábrica. TesisDoctoral. Universidad del País Vasco / Euskal Herriko Unibertsitatea 331pp.
Gorostidi, A y Lamolda, M.A. (1991): El paso Cenomaniense-Turoniense de Menoyo (Alava): Variaciones de la nanoflora cal-cárea. Geogaceta, 10, 54-57.
Hallam, A. (1987): End-Cretaceous mass extinction event: Argument for terrestrial causation. Science 238, 1237-1242. Herbert, T.D., Premoli-Silva, I., Erba, E. and Fischer, A.G. (1995): Orbital chro-nology of Cretaceous/Palaeoccne marine sed-
iments. In: Geochronology Time. Scales and Global Stratigraphic Córrela tion. (W.A. Berggren et al., eds). Spec. Publ.Soc. econ. Paleont. Miner., Tulsa, 54, 81-92.
Hillebrandt, A., von (1965): Foraminiferen - stratigraphie in alttertiár von Zumaya (provinz Guipúzcoa, NW Spanien) und einVergleich mit anderen Tethys-Gebieten. Bayr. Akad. Wiss. Math-Natur. Kl. Abh. NF, 123: 1-62.
Jenkins, D. G. and Lutherbacher, H. (1992): Paleogene stages and their boundaries. Neues Jahrbuch für Geologie undPaläontologie, Abh. 186, 1-5.Kahn, A. and Aubry, M. P. (2004): Provincialism associated with the Paleocene/Eocenethermal maximum: temporal Constraint. Marine Micropaleontology, 52, 117-131.
Kaminski, M.A. Gradstein, F.M., et al., (2005): Atlas of Paleogene Cosmopolitan Deep-Water AgglutinatedForaminifera.Grzybowski Foundation Special Publication 10, 547pp.
Kapellos, CH. (1974): Ueber das Nannoplankton im Alttertiär des Profils von Zumaya-Guetaria (Provinz Guipuzcoa,Nordspanien). Eclogae geol. Helv. 67(2):435-444.
Keller, G. (1988): Extinction, survivorship and evolution of planktic foraminifers across the Cretaceous/Tertiary boundary atEl Kef, Tunisia. Marine Micropaleontology, 13: 239-263.
The Paleocene and lower Eocene of the Zumaia section
- 77 -
Keller, G. and Lindinger, M., (1989): Stable isotope, TOC, and CaCO3 record across the Cretaceous Tertiary boundary at ElKef, Tunisia. Paleogeogr. Paleoclimat, Paleoecol., 73: 243-265.
Keller, G., Adatte, Th., Stinnesbeck, W., Stüben, D., Berner, Z., Kramar, U. and Harting, M. (2004): More evidence that theChicxulub impact predates the K/T mass extinction.Meteorites & Planetary Science 39 (7), 1127-1144
Kelly, D.C., Bralower, T.J., Zachos, J.C., Premoli Silva, I. and Thomas, E. (1996): Rapid diversification of planktonicforaminifera in the tropical Pacific (ODP Site 865) during the late Paleocene thermal máximum. - Geology, 24: 423-426.
Kelly, D.C., Bralower, T.J. and Zachos, J.C. (1998): Evolutionary consequences of the latest Paleocene thermal máximum fortropical planktonic foraminifera. -Palaeogeography, Palaeoclimatology, Palaeoecology, 159: 1-51.
Kelly, D.C., Zachos, J.C., Bralower, T.J., and Schellenberg, S.A. (2005): Enhanced terrestrial weathering/runoff and surface-ocean carbonate production during the recovery stages of the Paleocene-Eocene Thermal Maximum:Paleoceanography, v. 20, PA4023, doi: 10.1029/2005PA001163.
Kennett, J.P. and Stott, L.D. (1991): Abrupt deep-sea warming, paleoceanographic changes and benthic extinctions. Nature,353, 225-229.
Khan, A. and Aubry, M. P. (2004): Provincialism in the calcareous nannoplankton during the Paleocene-Eocene thermal max-imum: constrain on timing and duration. Marine Micropalentology, 52: 117-131.
Knox, R. (1994): From regional stage to standard stage: implications for the historical Paleogene stratotypes of NW Europe.GFF 116, 56-57.
Knox, R. (1998): Kaolinite influx within Paleocene/ Eocene boundary strata of western Europe. Newsl. Stratigr., 36: 49-53. Koch, P.L., Zachos, J.C. and Gingerich, P.D. (1992): Correlation betwen isotope records in marine and continental carbon
reservoirs near the Paleocene/Eocene boundary. Nature, 358, 319-322. Koch, P.L., Zachos, J.C. and Dettman, D.L. (1995): Stable isotope stratigraphy and paleoclimatology of the Paleogene
Bighorn Basin (Wyoming, USA). Palaeogeography, Palaeoclimatology, Palaeoecology, 115, 61-89. Kuhnt, W. and Kaminski, M.A. (1993): Changes in the comunity structure of deep water agglutinated foraminifers across the
K/T boundary in the Basque Basin (Northern Spain). Revista Española de Micropaleontología, 25, 57-92. Kuhnt, W. and Kaminski, M. A., (1997): Cenomanian to lower Eocene Deep-water agglutinated foraminifera from the Zumaya
section, Northern Spain. Annales Societatis Geologorum Poloniae 67, 257-270.Kuhnt, W., Kaminski, M.A. and Moullade, M. (1989): Late Cretaceous deep-water agglutinated benthic foraminiferal assem-
blages of the upper Cretaceous North Atlantic and its marginal seas. Geologische Rundschau 78: 1121-1140 (DSDPSpecial Volume).
Lamolda, M.A., Orue-Etxebarria, X. and Proto-Decima, F. (1983). - The Cretaceous-Tertiary boundary in Sopelana (Biscay,Basque Country). - Zitteliana, 10, 663-670.
Lamolda, M.A., Mathey, B. and Wiedmann, J. (1988): Field-guide excursion to the Cretaceous-Tertiary boundary section atZumaya (Northern Spain). En: M.A. Lamolda, E.G. Kauffman And O.H. Walliser (eds.): Paleontology and Evolution:Extinction Events. 2nd International Conference on Global Bioevents, Bilbao, Revista de Paleontología, nº extraordi-nario, p. 141-155.
Lamolda, M.A. and Gorostidi, A. (1992): Nannofossil stratigraphic record in upper Maastrichtian-Lowermost Danian atZumaya. Mem. Ist. Geol. Miner. Univ. Padova, 43: 149-161.
Laskar, J. (1993): Orbital, precessional, and insoltaion quantities for the Earth from 320 Myr to +10 Myr, Astron. Astrophys.270 522-533.
Laskar, J., Robutel, P., Joutel, F., Gastineau, M., Correia, A.C.M. and Levrard, B: (2004): A long term numerical solution forthe insolation quantities of the Earth. Astronomical Solutions for Earth Paleoclimates. 428, 261-285.
Leroux, H., Rocchia, R., Froget, L., Orue-Etxebarria, X., Doukhan, J-C., and Robin, E. (1995): The K/T boundary of Beloc(Haiti) : compared stratigraphical distributions of the boundary markers. -Earth Planet. Sci. Lett., 131, 255-268.
Leymerie, A. (1863): Note sur la systeme Garumnien. Bull. Soc. Géol. France, 20: 483-488. Lu, G., Keller, G. and Pardo, A. (1998): Stability change in Tethyan planktic foraminifera across the Paleocene-Eocene tran-
sition. - Marine Micropaleontology, 35: 203-233. Luterbacher, H.P., Eichenseer, H., Betzler, C. and Van Den Hurk, A.M. (1991): Carbonate-siliciclastic depositional systems in
the Paleogene of the South Pyrenean foreland basin: a sequence stratigraphic approach. In: Int. Ass. Sediment. Spec.Publ., 12: 351-407.
Luterbacher, H.P., Hardenbol, J. and Schmitz, B. (2000): Decisión of the voting members of the Internacional Subcommissionon Paleogene stratigraphy on the criterion for the recognition of the Paleocene-Eocene boundary. - Newsletter of theInternacional Subcommission on Paleogene Stratigraphy, 9: 13.
Lyell, C. (1833): Principies of Geology, being an attempt to explain the forme r changes of the Earth’s surface by referenceto causes now in operation (vol. 3). John Murray, London: 398 p.
Mangin, J.Ph. (1959-1960): Le nummulitique sud-Pyrénéen a l’ouest de l’Aragon. Pirineos, 51-58: 1-659.
Climate & Biota of the Early Paleogene, Bilbao 2006
- 78 -

Martínez, F.J. (1977): Estudio micropaleontológico del Nummulítico de un sector comprendido entre Moreda-Piñar- PedroMartinez (zona subbetica). Tesis Doctoral, Univ. Granada, Vol. I, 219 p., Vol.262 p.
Martini, E. (1971): Standard Tertiary and Quaternary calcareous nannoplankton zonation, In: Proceedings of the SecondPlanktonic Conference Roma 1970, (ed. A. Farinacci), Edizioni Tecnoscienza, Roma, 2, 739-785.
Mathey, B. (1982): El Cretácico superior del Arco Vasco. In: El Cretácico de España. Universidad Complutense de Madrid,111-135.
Mathey, B. (1986). - Les flyschs Crétacé supérieur des Pyrénées Basques. Age, anatomie, origine du material, milieu de dépótet relations avec l’ouverture du golfe de Gascogne. - Université de Dijon, 403 p. (unpublished Ph. D. Thesis).
McLean, D.M. (1982): Deccan volcanism and the Cretaceous-Tertiary transition scenario: a unifying causal mechanism.Syllogeus 39, 143-144.
McLean, D.M. (1985): Deccan Traps mantle degassing in the terminal Cretaceous marine extintions. Cretaceous Research 6,235-259.
Medus, J. y Colombo, F. (1991): Sucession climatique et limite stratigrafique Crétacé-Tertiaire dans le N.E. de l’Espagne. ActaGeol. Hisp., 26: 27-35.
Molina, E. (1994): Paleocene sections in Spain: chronostratigraphical problems and possibilities. GFF, GeologiskaFöreningens i Stockholm Förhandlingar. 116, 58-60.
Molina, E. (1996): El límite Paleoceno/Eoceno en España: características y posibilidades. Geogaceta, 20(7): 1668-1671. Molina, E., Arenillas, I. and Pardo, A. (1999). High resolution planktic foraminiferal biostratigraphy and correlation across
the Paleocene/Eocene boundary in the Tethys. Bulletin de la Société géologique de France, 170, 521-530. Molina, E., Angori, E., Arenillas, I., Monechi, S. and Schmitz, B. (2000): In-tegrated stratigraphy across the Paleocene/Eocene
boundary at Campo (Spain). -GFF, 122 (1): 106-107. Monechi, S., Angori, E. and Speijer, R. P. (2000b): Upper Paleocene biostratigraphy in the Mediterranean región: Zonal mark-
ers, diachronism, and preservational problems. - GFF, 122: 108-110. Monechi, S., Angori, E. and Von Salis, K. (2000a): Calcareous nannofossil turn-over around the Paleocene/Eocene transition
at Alamedilla (southern Spain). -Bulletin de la Société Géologique de France, 171(4): 477-489Norris, R. D. (1997): symbiosis as an evolutionary innovation in the radiation of Paleocene planktic foraminifera.
Paleobiology, Vol. 22, p. 461-480. Norris, R.D. and Róhl, U. (1999): Carbón cycling and chronology of chínate warming during the Palaeocene/Eocene transi-
tion. Nature, 401, 775-778. Officer, Ch.B. and Drake, Ch.L. (1983): The Cretaceous-Tertiary transition. Science 219, 1383-1390. Officer, Ch.B. and Drake, Ch.L. (1985): Terminal Cretaceous enviromental events. Science 227, 1161-1167. Officer, Ch.B., Hallam, A. Drake, C.L. and Devine, J.D. (1987): Late Cretaceous and paroxysmal Cretaceous/Tertiary extinc-
tion. Nature 326, 143-149. Olsson, R.K., Hemleben, C., Berggren, W.A., and Huber, B.T. (1999): Atlas of Paleocene planktonic foraminifera:
Smithsonian Contributions to Paleobiology, v. 85, p. 252. Ortiz, N. (1995): Differential patterns of benthic foraminiferal extinctions near the Paleocene/Eocene boundary in the North
Atlantic and the western Tethys. Marine Micropaleont., 136: 17-30. Orue-Etxebarria, X. (1982). - Los foraminíferos planctónicos del Paleó-geno del Sinclinorio de Bizkaia (Corte de Sopelana-
Punta de la Galea). - Universidad del País Vasco, 271 p. (Unpublished Ph. D. Thesis). Orue-Etxebarria, X. (1983): Los foraminíferos planctónicos del Paleógeno del Sinclinorio de Bizkaia (corte Sopelana-Punta
Galea): Parte 1, Kobie, 13: 175-249. Orue-Etxebarria, X. (1997). - El Kef blind test IV results. - Mar. Mi-cropaleontol., 29, 2, 85-88. Orue-Etxebarria, X., Baceta, J. I., Pujalte, V., Núñez-Betelu, K., Serra-Kiel, J., Apellaniz, E. and Payros, A. (1992): Evaluating
prospective Paleo-cene-Eocene boundary parastratotypes in the deep water Basque Basin, western Pyrenees: Ermuaand Trabakua Pass sections. Biscay, Basque Basin - Zaragoza IGCP Project 308: Palaeocene/Eocene BoundaryEvents. International Meeting and Field Conference, Abstract Volume, p. 9 and 10 page addendum.
Orue-Etxebarria, X., Rocía, R., Pujalte, V., Apellaniz, E. and Baceta, J. I. (1991): Estudio preliminar del tránsitoCretácico/Terciario en la sección del monte Urko (Eibar, País Vasco). - / Congreso del Grupo Español del Terciario,Vic, 240-243.
Orue-Etxebarria, X., Apellaniz, E., Baceta, J. I., Coccioni, R., Di Leo, R., Dinarès-Turell, J., Galeotti, S., Monechi, S.,Núñez-Betelu, K., Pares, J. M., Payros, A., Pujalte , V., Samso, J.-M., Serra-Kiel, J., Schmitz, B. and Tosquella, J.(1996): Physical and bioestratigraphic analysis of two prospective Paleocene-Eocene Boundary Stratotypes in theintermediate-deep water Basque Basin, western Pyrenees: The Trabakua Pass and Ermua sections. - N. Jb. Geol.Paláont. Abh., 201(2): 179- 242.
Pardo, A., Arenillas, I. and Canudo, J.I. (1996): Planktic Foraminifera and Paleo-geographic evolution across the Paleocene-Eocene boundary at Site 401, Zumaya and Alamedilla sections. - International Paleogene Stage Boundaries Meeting,Zaragoza (Spain), June 24-29 (abstr).
The Paleocene and lower Eocene of the Zumaia section
- 79 -

Orue-Etxebarria, X., Pujalte, V., Bernaola, G., Apellaniz, E., Baceta, J.I., Payros, A., Núñez-Betelu, K., Serra-Kiel, J. andTosquella. J. (2001): Did the Late Paleocene Thermal Maximum affect the evolution of larger foraminifers?:Evidences from calcareous plankton of the Campo section (Pyrenees, Spain). — Marine Micropaleontology, 41, 45-71.
Pardo, A., Keller, G. and Oberhansli, H. (1999): Paleoecologic and paleoceano-graphic evolution of the Tethyan realm duringthe Paleocene-Eocene transition. -Journal of Foraminiferal Research, 29 (1): 37-57.
Orue-Etxebarria, X., Bernaola, G., Baceta, J. I., Angori, E., Caballero, F., Monechi, S., Pujalte, V. Dinarés-Turell, J., Apellaniz,E. and Payros, A., (2004): New constraints on the evolution of planktic foraminifers and calcareous nannofossilsacross the Paleocene-Eocene boundary interval: the Zumaia section revisited. N. Jb. Geol. Paläont. Abh., 234(1-3):223-259.
Perch-Nielsen, K. (1979a): Calcareous nannofossils from the Cretaceous between the North Sea and the Mediterranean. IUGSSeries A, 6, 223-72.
Perch-Nielsen, K. (1979b): Calcareous nannofossil zonation at the Cretaceous/Tertiary boundary in Denmark. In: T.Birkelund, R.G. Bromley (eds.), Proceedings Cretaceous-Tertiary Boundary Events symposium, Copenhagen, 2, 120-126.
Perch-Nielsen, K. (1981a): Les nannofossiles calcaires á la limite Crétacé-Tertiaire près de El Kef, Tunisie. Cahiers deMicropaleontologie 3, 25-37.
Perch-Nielsen, K. (1981b): Nouvelles observations sur les nannofossils calcaires a la limite Crétacé-Tertiaire prés de El Kef(Tunisie). Cahiers de Micropaléontologie 3, 25-36.
Perch-Nielsen, K. (1985a): Mesozoic calcareous nannofossils, In: H.M. Bolli, J.B. Saunders, K. Perch-Nielsen (Eds.),Plankton Stratigraphy, Cambridge University Press, 329-426.
Perch-Nielsen, K. (1985b): Cenozoic calcareous nannofossils In: H.M. Bolli, J.B. Saunders, K. Perch-Nielsen (Eds.), PlanktonStratigraphy, Cambridge University Press, 427-554.
Percival S.F. Jr. and Fischer A.G. (1977): - Changes in calcareous nan-noplankton in the Cretaceous-Tertiary biotic crisis atZumaya, Spain. - Evol. Theory, 2, 1-35.
Plaziat, J.C. (1975): Signification paléogéografique dex “clacaires conglomérés des brèches et des niveaux a rhodophycées”dans la sédimentation carbonatée du bassin Basco-Béarnais à la base du Tertiaire (Espagne-France). Rev. Géogr. Phys.Geol. Dyn., 2-17: 239-258.
Plaziat, J.C. (1981): Late Cretaceous to late Eocene paleogeographic evolution of southwest Europe. Palaeogeogr.Palaeoclimatol. Palaeoecol., 36: 263-320.
Pluchery, E. (1995): Cycles de dépôts du continent àl’océan. Les séries d’âge Maastrichtien supérieur à Eocène moyen de lamarge basco-cantabrique et de son arrière-pays ibérique (Espagne du Nord). Tesis Doctoral, Univ. Bourgogne-Dijon,324 p.
Pospichal, J. (1996b): Calcareous nannoplankton mass extinction at the Cretaceous/Tertiary boundary: an update. In: G. Ryder,D. Fastovsky, S. Gartner (Eds.), The Cretaceous-Tertiary event and other catastrophes in Earth history., GeologicalSociety of America, Special Pape, 307, 335-360.
Preissinger, A., Aslanian, S., Brandstatter, F., Grass, F., Stradner, H. and Summesberger, H. (2002): Cretaceous-Tertiary pro-file, rhythmic deposition, and geomagnetic polarity reversals Pap. 356. 213-229.
Prestwich, J. (1850a):. On the structure of the strata between the London Clay and the Chalk in the London and HampshireTertiary systems. Part I. Quaterly Journal of the Geological Society of London, 6, 252-281.
Prestwich, J. (1850b): On the structure of the strata between the London Clay and the Chalk in the London and HampshireTertiary systems. Part II. Quaterly Journal of the Geological Society of London, 8, 235-264.
Prestwich, J. (1854): On the structure of the strata between the London Clay and the Chalk in the London and HampshireTertiary systems. Part III. Quaterly Journal of the Geological Society of London, 10, 75-154.
Puigdefàbregas, C. and Souquet, P. (1986): Tecto-sedimentary cycles and depositional sequences of the Mesozoic and Tertiaryfrom the Pyrenees. Tectonophysics, 129: 173-203.
Pujalte, V.; Robles, S.; Robador, A.; Baceta, J. I. and Orúe-Etxebarría, X. (1993): Shelf-to-basin Palaeocene palaeogeographyand depositional sequences, western Pyrenees, north Spain. In: Sequence Stratigraphy and Facies Associations(Posamentier, H. W., Summerhayes, C. P., Haq, B. U. and Allen, G. P., Eds.). Spec. Publ. Int. Ass. Sediment., 18, 369-395.
Pujalte, V., Baceta, J.I., Dinarès-Turell, J., Orue-Etxebarria, X., Parés, J.M. and Payros, A. (1995): Biostratigraphic and mag-netostratigraphic intercalibration of the latest Cretaceous and Paleocene depositional sequences from the deep-waterBasque Basin, western Pyrenees, Spain. Earth Planet. Sci. Letters, 136: 17-30.
Pujalte, V., Baceta, J.I., Apellaniz, E., Orue-Etxebarria, X., Payros, A. and Serra-Kiel, J. (1998a): Paleocene of the Pyreneesand the North Sea Basin: differences and similarities. Newsletter on Stratigraphy, 36: 43-47.
Climate & Biota of the Early Paleogene, Bilbao 2006
- 80 -

Pujalte, V., Baceta, J.I., Orue-Etxebarria, X. and Payros, A. (1998b): Paleocene strata of the Basque Country, westernPyrenees, northern Spain: Facies and sequence development in a deep-water starved basin. En: Mesozoic andCenozoic Sequence Stratigraphy of European Basins (P.C. de Graciansky, J. Hardenbol, T. Jacquin y P.R. Vail, Eds.),Soc. Econ. Paleont. Miner., Sp. Publ., 60: 311-325
Pujalte, V., Baceta, J.I., and Payros, A. (2002): Tertiary: Western Pyrenees and Basque-Cantabrian region. En: The Geologyof Spain (W. Gibbons y T. Moreno, Eds.), Geol. Soc. (London), 293-301.
Pujalte, V., Orue-Etxebarria, X., Schmintz, , B., Tosquela, , J., Baceta, J. I., Payros, A., Bernaola, G., Caballero, F. andApelleniz, E. (2003): Basal Iler-dian (earliest Eocene) turnover of larger foraminifera: Age constraints based on cal-careous plankton and 8I3C isotopic profiles from new southern Pyrenean sections (Spain). - Geological Society ofAmerica, Special Paper, 369: 205-221.
Remane, J., Bassett, M.G., Cowie, J.W., Gohrbandt, K.H., Lane, H.R., Michelsen, O. and Naiwen, W., (1996): Revised guide-lines for the establishment of global chronostratigraphic standards by the International Commission on Stratigraphy(ICS). Episodes, 19(3), 77-81.
Rocchia, R., Robin, E., Cachier, T., Lim, B., Leroux, H., Apellaniz, E. and Orue-Etxebarria, X. (1996). Impact remains in K-T boundary sediments from the Basque Country. - Meeting on the Cretaceous-Tertiary boundary: biological and geo-logical aspects, París, Abstracts.
Roggenthen, W.M. (1976): Magnetic stratigraphy of the Paleocene. A comparision between Spain and Italy. Mem. Soc. Geol.Italia, 15: 73-82.
Röhl, U., Bralower, T.J., Norris, R.D. and Wefer, G., (2000): New chronology for the late Paleocene thermal maximum andits environmental implications. Geology, 28(10): 927-930.
Romein, A.J.T. (1979): Lineages in early Paleogene calcareous nannoplankton. Utrecht Micropalaeontol. Bulletins, 22, 1-230. Rosell, J., Linares, R. y Llompart, C. (2001): El Garumniense prepirenaico. Rev. Soc. Geol. España, 14: 47-56. Roth, P.H. and Thierstein H. (1972): Calcareous nannoplankton: Leg 14 of the Deep Sea Drilling Project. Initial Reports of
the Deep Sea Drilling Project, XIV, 421-485. Schimper, W.P. (1874): Traite de Paléontologie vegetóle, ou la flore du monde primitif dans ses rapports avec les formations
géologiques. JB Baillére et Fils, Paris. Schmitz, B. and Pujalte, V. (2003): Sea-level, humidity, and land-erosion records across the Initial Eocene Thermal Maximum
from a continental-marine transect in northern Spain. Geology, 31: 689-692. Schmitz, B., Asaro, F., Molina, E., Monechi, S., Von Salis, K. and Speijer, R. (1997): High-resolution Iridium, d13C, d18O,
foraminifera and nannofossil profiles across the lates Paleocene benthic extinction event at Zumaia, Spain.Palaeogeogr. Palaeoclimatol. Palaeoecol., 133: 49-69.
Schmitz, B., Molina, E. and Von Salis, K. (1998): The Zumaya section in Spain: a possible global stratotype section for theSelandian and Thanetian stages. Newsletters on Stratigraphy, 36: 35-42.
Schmitz, B., Aubry, M.P. and Zachos, J.C. (2000): Preface & summary. GFF, 122: 4-6. Serra-Kiel, J., Canudo, J.I., Dinarès-Turell, J., Molina, E., Ortíz, N., Pascual, O., Samso, J.M. y Tosquella, J. (1994):
Cronoestratigrafía de los sedimentos marinos del Terciario inferior de la Cuenca de Graus-Tremp (Zona CentralSurpirenaica). Rev. Soc. Geol. España, 7: 273-297.
Seyve, C. (1990): Nannofossil biostratigraphy of the Cretaceous-Tertiary boundary in the French Basque Country. - Bull.Centres Rech. Expiar. - Prod. Elf-Aquitaine, 14, 2, 553-572.
Smit, J. (1982): Extinction and evolution of planktonic foraminifera after a major impact at the Cretaceous/Tertiay boundary.Geological Society of America, Special Papers, 190: 329-352.
Smit, J. (1990): Asteroid impact, extinctions and the Cretaceous-Tertiary Boundary. Geologie en Mijnbouw, 69: 187-204.Smit, J. and Ten Kate, W.G.H.Z. (1982): Trace-element patterns at the Cretaceous/Tertiary boundary: consequences of a large
impact. Cretaceous Research, 3, 307-332. Speijer, R.P. (1994): Extinction and Recovery Patterns in Benthic Foraminiferal Paleocommunities across the
Cretaceous/Paleogene and Paleocene/Eocene Boundaries.Geologica Ultraiectina 124, 191 pp. (Utrecht University,Netherlands).
Speijer, R.P., Van der Zwaan, G.J. and Schmitz, B. (1996): The impact of PaleoceneI/Eocene boundary events of middle ner-itic benyhic foraminiferal assemblages fron Egypt. — Marine Micropaleontology, 28, 99-132.
Speijer, R. P. and Samir, A. M. (1997): Globanomalina luxorensis, a Tethian bio-stratigraphic marker of latest Paleocene glob-al events. - Micropaleontology, 43 (1): 51-62.
Speijer, R.P., Schmitz, B. and Luger, P. (2000): Stratigraphy of late Palaeocene events in the Middle East: implications forlow- to middle-latitude successions and correlations. Journal of the Geological Society of London 157, 36-46.
Stott, L.D., Kennett, J.P., Shackleton, N.J. and Corfield, R.C. (1990): The evolution of Antarctic surface waters during thePaleogene: Inferences from the stable isotopic composition of planktonic foraminifers, ODP leg 113. In: Proceedingsof the Ocean Drilling Program, Scientific Results, (eds. P.F. Barker, J.P. Kennett, et al.). 113, 849-863.
The Paleocene and lower Eocene of the Zumaia section
- 81 -

Ten Kate, W.G. and Sprenger, A. (1993): Orbital cyclicities above and below the Cretaceous/Paleogene boundary at Zumaya(N Spain), Agost and Relleu (SE Spain). Sedim. Geol., 87: 69-101.
Thomas, E. (1990): Late Cretaceous-early Eocene mass extinction in deep sea. In: Global Catastrophes in Earth History (Eds:V.L. Sharpton & P.D. Ward), Geological Society of America Special Publication, 247, 481-495.
Thomas, E. (1998): Biogeography of the late Paleocene benthic foraminiferal extinction In: Late Paleocene-Early Eocene cli-matic and biotic events in the marine and terrestrial records, (Eds: M.-P. Aubry, S. Lucas & W.A. Berggren)),Columbia University Press, New York, 214-243.
Thomas, E. (2003): Extinction and food at the sea floor: A high-resolution benthic foraminiferal record across the InitialEocene Thermal Maximum, Southern Ocean Site 690, in Causes and Consequences of Globally Warm Climates of thePaleogene, GSA Spec. Pap., vol. 369, edited by S. Wing et al.., 319-332, Geol. Soc. of. Am., Boulder, Colo.
Thomas, E. and Shackleton, N.J. (1996): The Paleocene-Eocene benthic foraminiferal extinction and stable isotope anomaliesIn: Correlation of the early Paleogene in Northwest Europe, (Eds: R.W.O’B. Knox, R.M. Corfield & R.E. Dunay),Geological Society of London Spec. Publ., 101, 401-441.
Thomsen, E. (1994): Calcareous nannofossil stratigraphy across the Danian-Selandian boundary in Denmark, GFF 116, 65-67.
Thomsen, E. & Heilmann-Clausen, C. (1985). The Danian-Selandian boundary at Svejstrup with remarksks on the biostratig-raphy of the boundary in Western Denmark. Bulletin of the Geological Society of Denmark, 33, 341-362.
Tjalsma, R.C. and Lohman, G.P. (1983): Paleocene-Eocene bathyal and abyssal benthic foraminifera from the Atlantic Ocean.Micropaleontology, Spec. Publ., 4, 1-90.
Torrence, C. and Compo, G.P. (1998): A practical guide to wavelet analysis, Bull. Am. Meteorol. Soc. 79, 61-78. Van de Velde, J. (1967): Geology of the Ordesa region. Estudios Geol., 23: 163-201. Van der Hurk, A.M. (1990): Eustatic and tectonic controls on carbonate and siliciclastic Paleogene depositional systems in the
South Pyrenean foreland basin (Esera, Cinca and Cinqueta valleys; prov. Huesca, Spain). Tesis Doctoral, Univ.Autónoma de Barcelona, 292 p.
Van Morkhoven, F. P. C. M., Berggren, W. A. and Edwards, A. S. (1986): Cenozoic cosmopolitan deep-water benthicforaminifera. Bulletin des Centres Recherches Exploration-Production Elf-Aquitaine, Memoir, 11: 1-423.
Van Vliet, A. (1982): Submarine fans and associated deposits in the lower Tertiary og Guipuzcoa /northern Spain) PhD.Thesis, Univ. Utrecht: 45 p.
Varadi, F., Runnegar, B., and Ghil, M. (2003): Successive refinememts in long-term integrations of planetary orbits,Astrophys. J. 592 620-630.
Vergés, J. (1993):. Estudi geologic del vessant sud del Pirineu oriental i central, Evolució cinematica en 3D, PhD thesis,University of Barcelona, Barcelona.
von Hillebrandt, A. (1964): El Terciario bajo de la zona del Monte Perdido (Huesca). Not. Com. Inst. Geol. Min. España, 73:61-98.
von Hillebrandt, A. (1965): Foraminiferen-Stratigraphie im Alttertiär von Zumaya (Prov. Guipuzcoa, NW Spanien) und einVergleich mit anderen Tethys-Gebieten. Abh. Königl. Bayer. Akad. Wissench. München, 123: 1-63. Young
Von Salis, K., Monechi, S., Bybell, L.M., Self-Trail, J. and Young, J.R. (2000): Remarks on the calcareous nannofossil gen-era Rhomboaster and Tribrachiatus around the Paleocene/Eocene Boundary. GFF, 122: 138-240.
Ward, P., Kennedy, K.G., McLeod, K.G. and Mount, J. (1991): End-Cretaceous molluscan extinction patterns in the Bay ofBiscay K/T boundary sections: two different patterns. Geology, 19: 14-81.
Ward, P. and Kennedy, K.G. (1993): Maastrichtian ammonites from the Biscay region (France, Spain). Jour. Paleontol., 67: 1-58.
Wiedmann J. (1986): Macro-invertebrates and the Cretaceous-Tertiary boundary. In: Global Bio-Events. (Ed. O. Walliser)Lecture Notes in Earth Sciences, 8, 397-409.
Wiedmann, J. (1988): The Basque coastal sections of the K/T boundary: a key to understanding “mass extinction” in the fos-sil record. En: Paleontology and evolution: Extinction events (M.A. Lamolda, E.C. Kauffman y O. Walliser, Eds.),Rev. Esp. Paleontología, (nº extr.), 127-140.
Wood, H. E., II, Chaney, R.W., Clark, J., Colbert, E. H., Jepsen, G. L., Reeside, J. B. and Stock, C., (1941): Nomenclature andcorrelation of the North American continental Tertiary: Geological Society of America Bulletin, v. 52, p. 1–48.
Zachos, J. C., Arthur, M. A. and Dean W. E. (1989): Geochemical evidence for suppression of pelagic marine productivity atthe Cretaceous/Tertiary boundary. Nature 337, 61– 64.
Climate & Biota of the Early Paleogene, Bilbao 2006
- 82 -