climate and esg reporting of french institutional investors
TRANSCRIPT

ShadeS of reporting
Climate and eSg reporting of french institutional investors
2018
Season ii

2 173 shades of reporting - Season 2
introdUCtionFor the second consecutive year, Novethic has analysed the responses of France’s largest institutional investors to the reporting requirements of Article 173-VI of the Energy Transition Law (LTECV). Only 73 of the 100 largest investors, which constitute the Study Panel, have fulfilled this obligation, but they account for most of the outstanding assets totalling €2370 billion.
This year, the Climate and ESG reporting of these investors were reinforced thanks to an exclusive survey conducted by Novethic, in partnership with the FFA (the French Insurance Federation). Thirty institutions, whose assets exceed 85% of those of the global panel, responded. This dual approach of reports and data provides an accurate overview of how leading French institutional investors measure and manage climate risks and their green investments. More generally, this study qualifies and quantifies the extent of the integration of Environmental, Social and Governance (ESG) factors into the asset management processes of major French investors.
SUmmaryKey points ............................................................................................................................................................. p 3Classification of investors' reporting by category ....................................................................................... p 4Panel of asset owners analysed ...................................................................................................................... p 5Quantifying climate and ESG strategies of the largest French institutional investors ...................... p 6
DETAILED ANALYSIS ..................................................................................................................................... p 10Reporting policy and governance of ESG and climate strategies ........................................................ p 11Reporting on climate risks ............................................................................................................................. p 12Reporting on the integration of ESG criteria ............................................................................................ p 21
CONCLUSION ................................................................................................................................................. p 27
100 french
institutional investors
owning
€2450bn in assets

173 shades of reporting - Season 2 3
Key pointS The vast majority of the largest French institutional investors have become aware of their role
and responsibilities in taking into account climate risks and ESG factors in their management of financial assets. This is confirmed by the second edition of the analysis of the so-called «Article 173» reports.
progress on taking climate risk into account 86% of investors who reported measure and report the carbon footprint of their portfolios.
This is now an unavoidable preamble to the implementation of climate analysis, even if current financial management methodologies are still imperfect and poorly adapted. Fifteen investors integrate their carbon footprint into their improvement plans or their strategic objectives.
The most committed players assess their climate risks more specifically according to the 2015 Paris Climate Conference 2°C objective. Thirteen investors evaluate the alignment of their portfolios with a trajectory of 2°C. Six of them even translate the corresponding trajectory into portfolio temperature.
The deployment of true low-carbon allocation strategies is confined to a very small number of players. On the other hand, exclusion procedures are widespread across large volumes of assets. Twenty-six investors representing €1,873 billion of assets exclude coal. Three of these widen the exclusion to other fossil fuels, such as unconventional oil.
The TCFD (Task Force on Climate-related Financial Disclosures) guidelines are becoming the reference framework, with 15 investors mentioning their recommendations and 10 who used them in their Article 173 reporting.
The methodologies for managing climate risk are far from standardized. The activity thresholds from which coal-related enterprises are excluded are highly variable. Four investors now prefer to rely on a list of controversial companies rather than adopting complex exclusionary methodologies that do not necessarily shield them from NGO campaigns. Finally, three other investors articulate ESG analysis and climate strategies to remove the most carbon-intensive investments from their portfolios.
Transparency on green investments is progressing slowly, even if volumes remain modest. 1.07% of Green assets were reported under Article 173 for the year 2017, compared with 1.05% for the previous year (2016). Strategies which differentiate between brown and green share of portfolios remain the exception.
extending the scope of eSg analysis and developing exclusions The coverage ratio of ESG analysis of the portfolios has increased in the 2018 reports (68% on
average, or four points more than in 2017), mainly from the assessments made by management companies and specialized rating agencies.
In terms of practice, there is on one hand a significant exclusion movement specifically targeting controversial companies and tobacco (44% of investors apply a policy of normative exclusion and 41% of exclusion of tobacco), but on the other hand, ESG management strategies are much less clear. A majority of reports mention Best-in-class or ESG integration, but these terms encompass approaches with widely varying requirements.
Impact measurement remains limited even though there are more references to the Sustainable Development Goals (SDGs). A dozen investors have initiated a reflection on their contribution to the SDGs. Fifteen investors also present either impact investment strategies or various social thematic strategies, but with relatively modest volumes. The total allocated to these initiatives is around €2 billion.

4 173 shades of reporting - Season 2
ClaSSifiCation of inVeStorS' reporting By Categoryrelatively stable ratios between engaged and absentee investorsThe second year of analysis of investor reports shows no major evolution between 2017 and 2018, even if variations within the categories testify to an improvement in how environmental and social dimensions are taken into account in the management of assets. The most engaged investors also have the most assets under management.
CATEGOrIES bY ASSETS UNDEr MANAGEMENT
Engaged players Absentees Newcomers Established Forerunners
Significant progress Progress Category leap Status quo
The most engaged investors, the heavyweights of the French institutional landscape, have integrated climate risk into their investment policies. They manage some €1,320 billion in assets. Their reports are a showcase for new methodologies, or evolutions of existing methodologies. These are being deployed as they emerge, although some still choose to devote their analysis to only one type of climate risk. Reports in this category reveal an imbalance between the degree of potential analysis of real estate portfolios and that of other asset classes. They are also those in which the Sustainable Development Goals (SDGs) and the TCFD (Climate Reporting Task Force) are most mentioned.
Investor reports in this category show slight improvements, such as the addition of an assessment of the portfolio’s climate trajectory and its possible alignment with the 2°C objective of the Paris Agreement or the methodological evolutions of their carbon footprint provider. These reports have been supplemented with evidence not only of a better understanding of the importance of climate risks but also of new exclusions (tobacco and/or coal). They also report on methodological reflections to refine their strategy and adhesion to new engagement initiatives.
This group of investors is heterogeneous in terms of ESG and Climate strategy. Their reports show a wider diffusion of the carbon footprint of their portfolios. For ESG data, the ambition displayed varies. Many reports are just an update of last year; whilst some simply compare their performance with an ESG or Climate index.
There are more investors publishing a report this year. Ten did so for the first time, hence increasing the number of newcomers, but five who published their first report in 2017 did not do so in 2018.
If the number of investors who do not meet the requirements of Article 173 has decreased, that contribution must be put into perspective since six investors in this category submitted reports whose average length did not exceed half a page!
17Engaged
Players
20Established
Forerunners
36Newcomers
27Absentees
3%
16%
27%
54%
Newcomers(36)
3
8
42
75
3
8
25
2
6
Established forerunners
(20)
Engaged players
(17)
Source: Novethic
Source : Novethic
173 shades of reporting - Season 2 5
liSt of panel inStitUtionS Who prodUCed an artiCle 173 report
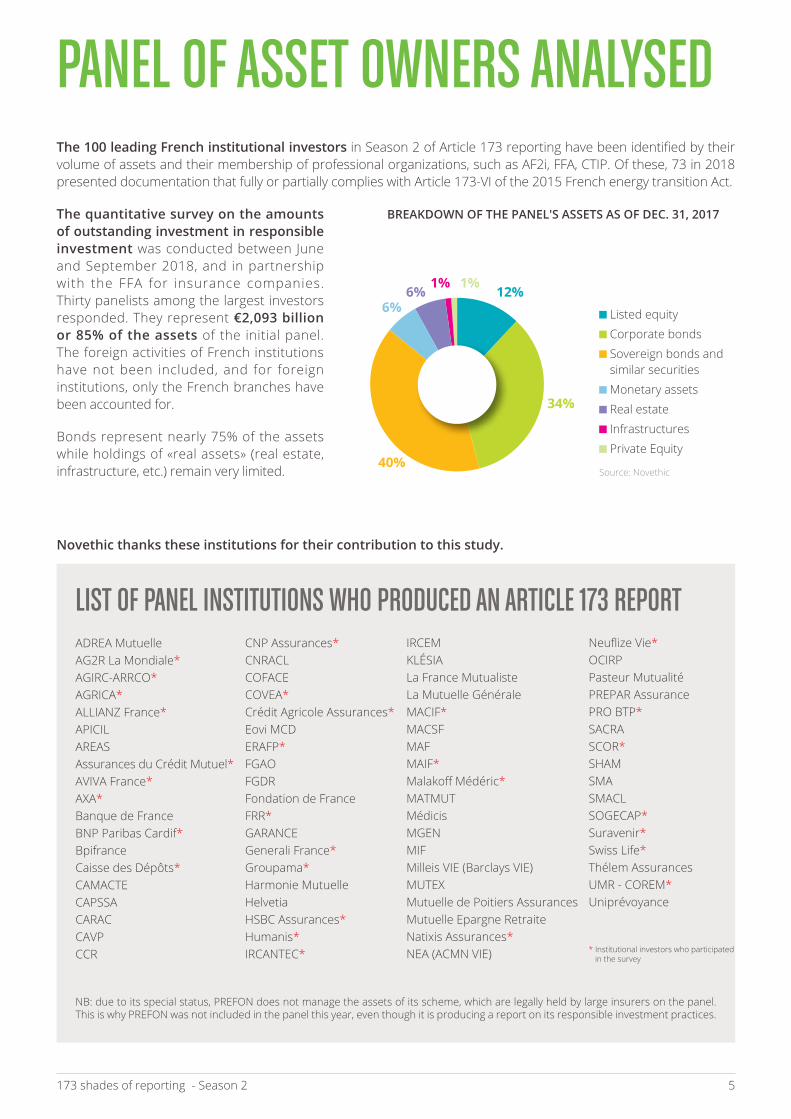
panel of aSSet oWnerS analySedThe 100 leading French institutional investors in Season 2 of Article 173 reporting have been identified by their volume of assets and their membership of professional organizations, such as AF2i, FFA, CTIP. Of these, 73 in 2018 presented documentation that fully or partially complies with Article 173-VI of the 2015 French energy transition Act.
The quantitative survey on the amounts of outstanding investment in responsible investment was conducted between June and September 2018, and in partnership with the FFA for insurance companies. Thirty panelists among the largest investors responded. They represent €2,093 billion or 85% of the assets of the initial panel. The foreign activities of French institutions have not been included, and for foreign institutions, only the French branches have been accounted for.
Bonds represent nearly 75% of the assets while holdings of «real assets» (real estate, infrastructure, etc.) remain very limited.
ADREA MutuelleAG2R La Mondiale*AGIRC-ARRCO*AGRICA*ALLIANZ France*APICILAREASAssurances du Crédit Mutuel*AVIVA France*AXA*Banque de FranceBNP Paribas Cardif*BpifranceCaisse des Dépôts*CAMACTECAPSSACARACCAVP CCR
CNP Assurances*CNRACLCOFACECOVEA*Crédit Agricole Assurances*Eovi MCDERAFP*FGAOFGDRFondation de FranceFRR*GARANCE Generali France*Groupama*Harmonie MutuelleHelvetiaHSBC Assurances*Humanis*IRCANTEC*
IRCEMKLÉSIALa France MutualisteLa Mutuelle GénéraleMACIF*MACSFMAFMAIF*Malakoff Médéric*MATMUTMédicisMGENMIFMilleis VIE (Barclays VIE)MUTEXMutuelle de Poitiers AssurancesMutuelle Epargne RetraiteNatixis Assurances*NEA (ACMN VIE)
Neuflize Vie*OCIRPPasteur MutualitéPREPAR AssurancePRO BTP*SACRASCOR*SHAMSMASMACLSOGECAP*Suravenir*Swiss Life*Thélem AssurancesUMR - COREM*Uniprévoyance
NB: due to its special status, PREFON does not manage the assets of its scheme, which are legally held by large insurers on the panel. This is why PREFON was not included in the panel this year, even though it is producing a report on its responsible investment practices.
brEAKDOWN OF THE PANEL'S ASSETS AS OF DEC. 31, 2017
1%1%12%
34%
40%
6%6%
Listed equity
Corporate bonds
Sovereign bonds and similar securities
Monetary assets
Real estate
Infrastructures
Private Equity
* Institutional investors who participated in the survey
Source: Novethic
Novethic thanks these institutions for their contribution to this study.

6 173 shades of reporting - Season 2
QUantifying Climate and eSg StrategieS of the largeSt frenCh inStitUtional inVeStorS
de-coding divestment and investment strategiesMost investors focus their quantitative reporting on divestment, especially coal, and their investments in green assets. They are much less likely to quantify the amount of assets on which climate risk analysis is based.
70% OF bUSINESS POrTFOLIOS CONCErNED bY CLIMATE EXCLUSIONS
Twenty-six investors apply an exclusion policy on companies involved in the production of energy from thermal coal and/or its extraction. Turnover thresholds still vary from simple to triple (see detailed analysis p.18), but these policies now apply to 70% of equity and corporate credit portfolios, i.e. €776 billion in total.
Two investors also have an exclusion policy targeting unconventional hydrocarbons (oil sands and drilling in the Arctic, in particular) on portfolios of private issuers that represent nearly €250 billion. A third is in the process of formalizing exclusions of this nature for a portfolio of equities and bonds worth some €40 billion.
Some €123.5 million of coal assets were divested in 2017 under exclusionary policies. While most of the energy companies such as RWE or CEZ have already been sold or are being sold, the implementation of exclusions for production thresholds in annual tonnage will gradually lead to the divestment of mining companies.
1.07% GrEEN ASSETS
The combined analysis of the reports and survey data this year indicated €21 billion of green assets, or 1.07% of the total assets of the panel, against 1.05% last year (2016-17). Green bonds (€11.3 billion) represent more than half of this total, or about 0.7% of total bond portfolios. While the funds dedicated to green bonds represent only €300 million, environmental theme funds of listed shares are almost five times larger, at €1.4 billion. In addition, three pension institutions invested €9 billion in low carbon index funds.
Climate-related exclusion policies
as of dec. 31, 2017
Coal
non conventional oil and gas
Systematic divestment 11
7
2
6
2
1
554
64
69
89
248
41
Case-by-case divestment
Solely for new investments
planned for 2018
already implemented
implementation in 2018
mentionsCorresponding
portfolios (€ bn)
asset types
Total of green investments, certified real estate and low-carbon funds
green bonds
renewable energies fundings
29
8
17
7
5
8
3
4
4
38
43
28
5
32
5
11,1
1,8
1,4
3,3
0,9
1,3
0,4
0,3
0,3
11,7
21,1
36,5
9,1
66,3
6,5
0,3
direct investment
direct investment
infrastructure funds
Unspecified investment medium
green private equity (cleantech)
listed green equity funds
Sustainable forestry assets
other
investment through funds
total
green investments total
Certified sustainable real estate
low-carbon funds
total
Unspecified investment medium
investments identified
amounts (€ bn)
Source: Novethic
Source: Novethic

173 shades of reporting - Season 2 7
Scope of climate risk analysisThe quantitative survey work carried out by Novethic makes it possible to decipher the volume of assets covered by climate risk analysis, and to relate them to the total volume of assets managed by the institutions concerned. This detailed data also shows how climate risk analysis is deployed in terms of asset classes and techniques implemented.
This table shows that only a very small number of highly engaged investors test, on a limited volume of assets, methodologies for the quantified assessment of financial risks related to climate change, whether it concerns transition risks or physical risks.
TrANSITION rISKS
One-fifth of the total assets studied are covered by an analysis of the portfolio’s climate trajectory. 2°C scenarios are studied on €460 billion, while a transition risk analysis is carried out on €514 billion, via the assessment of «brown assets», i.e. the most emitting assets. Only 15 institutional investors carry out combined analysis on some €285 billion in assets.
It is important to note that potential financial losses related to transition risks were estimated for only €151 billion of assets, nearly ten times less than the volume of assets covered by the carbon footprint measure.
PHYSICAL rISKS
Physical risk analysis was deployed on €382 billion of shares and bonds, €23 billion of real estate assets and nearly €1 billion of forestry assets. For two investors, it concerned only sovereign bond portfolios. «Stress test» logic – that is, the translation of these analyses into an estimate of the potential financial impact - was applied on €121 billion, three times less than the volume covered by qualitative analysis.
foCUS on infraStrUCtUrerenewable energy investments represent €6.5 billion, or more than a quarter of assets invested in infrastructure. While the average amounts invested in funds dedicated to green infrastructure remain modest (€82 million), investors wishing to finance the energy transition also identify green assets in other infrastructure investments that are not solely devoted to renewable energy.
Climate analysis
Carbon footprint
Analysis of portfolio climate scenarios
Analysis of issuers’ climate
risks
Quantification of the financial
impact (losses or gains) of these climate risks
Transition risks 514 28 22%
28 16%
4 6%
6 5%
382
151
121
Physical risks
Transition risks
Physical risks
Volume of corresponding assets (€ bn)
1380
459
Volume of corresponding assets (€ bn)
675
58
23 3
3
244
12
number of investors
60
24
number of investors
21
11
% of total assets
58%
19%
Up to scope 3
Carbo-intensive sectors exclusively (technological
exposition)
Real estate exclusively
Real-estate exclusively
Carbon-tax impact exclusively
Source: Novethic
including
including
including
including
including

8 173 shades of reporting - Season 2
USE OF ESG ANALYSIS
The Best-in-class approach is the most widely used structured technique: 22 investors say they use it for portfolios totaling €420 billion. However, this preponderance must be qualified by the diversity of practice associated with the label. The heterogeneity of the selectivity requirements, when they are explicit, shows that the borderline is often blurred between Best-in-class, certain practices of structured integration (notably the weighting of securities according to their ESG score, or the requirement of a minimum ESG score of the portfolio) and even normative exclusions (the most controversial companies, sometimes simply equated with the worst ESG scores). The influence of management companies is a factor, since so-called «Best-in-class» volumes are 80% in outsourced management for equities and 65% for bonds.
A growing number of investors, notably those that undertake responsible investment internally, are adopting the Best Effort approach, which consists in selecting the companies that are most efficient in transforming their business models and improving their ESG performance.
Structured ESG integration approaches are progressing, particularly among large insurers and investors with established and leading ESG practices. ESG portfolio scorings (minimum score or progress over time) are now €227 billion.
eSg analysis and approachesCOVErAGE OF ESG ANALYSIS
On average, bond assets, which constitute the bulk of the portfolios of French investors, are largely covered by ESG analysis. This is particularly the case for external asset management, proof that these companies have been trained in recent years to meet the expectations of investors. Unsurprisingly, the biggest investors in the study were also those which use ESG research most widely, particularly with regard to their internal management. Broadened to all asset classes, ESG coverage reaches 68% of all assets.
EqUITY AND bOND POrTFOLIOS COVErED bY AN ESG ANALYSIS (€ bN)
114 142
7227879%
91%
61%
69%58%
39%
31%42%
Equity managed internally
Equity in delegated
management
Bonds managed internally
Bonds in delegated
management
Source: Novethic
Source: Novethic
* Several approaches can be combined by the same investor, sometimes on the same portfolio.
NB : See on p. 22-23, for a detailed description of each of the categories quantified here
eSg selection approach*
ESG Screening
Case-by-case ESG integration
Structured ESG integration
Norm-based exclusion
including best-in-class
including weighting
including best-in-universe
including valuation
including best effort
including min. portfolio score
including portfolio ESG objective
Volume (€ bn)
491
674
289
1262
420
27
13
34
60
225
2
number of investors
27
27
12
32
22
2
4
1
4
8
1
Covered Non-covered

173 shades of reporting - Season 2 9
TObACCO EXCLUSIONS SPrEAD
The exclusion of tobacco stocks from portfolios experienced a new wave of support in 2017 and has become an unavoidable sectoral exclusion, since it now covers more than €1,000 billion of assets, far more than the exclusion of weapons or pornography-related holdings. Nearly €500 million of assets related to the tobacco industry have thus been divested.
Norm-based exclusion policies are deployed for over €1,200 billion of assets and prevail as a standard since they cover 92% of bond holdings in outsourced management, compared to 40% of bond assets in direct management. The trend is less pronounced in equity portfolios, since 57% of assets under direct management are concerned, compared to 48% of delegated assets. The refusal to invest in controversial companies (normative exclusions) led to divestment representing €230 million.
Finally, the ‘Social’ dimension of ESG still makes only a modest appearance, mainly through Impact funds (see table), which represent 0.07% of outstanding volumes.
life inSUranCe: Sri UnitS of aCCoUnt remain niChe prodUCtSThe first figures on the Units of Account (UA) proposed by the insurers on the Study Panel show modest momentum in the retail distribution. Only 5% of UA volumes are managed on an SRI basis, and 1.9% (€5.1 billion) are certified with a recognized label. Taking the example of assets earmarked for the French green TEEC Label (Energy and Ecological Transition for Climate), €361 million are invested, barely half of what French asset owners directly allocate to these same products in equity (€820 million). What about the dissemination and visibility of these financial products on platforms and with savers? Recently launched contracts which include 100% responsible investment units demonstrate the desire of some insurers to explore and conquer this client set.
Source: Novethic
Source: Novethic
Source: Novethic
Volume of corresponding assets (€m)
number of investors
Social-themed equity funds
Impact funds or related to the social economy (e.g. solidarity
funds, investment in local SMEs...)
3
13
519
1482
0,02%
0,07%
% of total assets
number of investors€bn(Volumes as of dec. 31, 2017)
Total volume of unit-linked products
Unit-linked products «managed with SrI criteria»
Unit-linked products with the French SrI label
Unit-linked products with the French TEEC label
Unit-linked products with other labels (Finansol, FNG, LuxFlag...)
347,4
17,3
5,1
0,36
1,64
19
17
16
4
9
exclusion policiesas of dec. 31, 2017
Norm-based exclusion
Tobacco
Gambling
Weapons (beyond controversial weapons)
Pornography
Other (alcohol, palm oil...)
Sector-based exclusion
perimeter (€)
1262 bn
1016 bn
93 bn
12 bn
11 bn
3 bn
mentions
32
30
9
4
5
11

10 173 shades of reporting - Season 2
detailed analySiSFor the 2017-2018 season, Novethic analyzed in detail 73 reports published to comply with the requirements of Article 173, which enabled it to identify both good reporting practices, and practices to be avoided. The corresponding quotes are enclosed in quotation marks.
the variable geometry of article 173 obligationsNearly three-quarters of institutional investors preferred to publish an ad-hoc Article 173 report. The others are meeting their obligations by integrating a dedicated section in their Annual report, their CSR report, or via information on their website.
Nearly 80% of the reports are published in the «Annual Report» or «Publications» section, 18% in the «Engagement» or «Responsible Investment» or «Sustainable Development» sections. Two reports were found in the «Legal and Regulatory Requirements” section.
The average length of the Article 173 reports has slightly increased to about 20 pages this year from 19 pages in 2017. While 16 institutions published substantially longer reports, four investors published much shorter reports, half or less the previous length. The number of pages devoted to climate risk and the integration of ESG criteria was evenly distributed, regardless of the size of the institution.
In addition, some investors with smaller portfolios appear to have interpreted the introduction of SRI charters or commitments in 2017 as an «exemption» from issuing a new Article 173 report in 2018.
Summaries and explanations Among the 2018 reports, four are accompanied by a synthesis or summary at the beginning or end of the report, and one has a separate document. Some technical information, which last year appeared in the body of the report, has been moved to the Appendices.
Finally, we note the desire in the reports to highlight a societal contribution. Thus, beyond scattered references to investments in impact funds, we also observe in a handful of reports sections dedicated to green bonds, TEEC-labeled funds or even SRI funds.
Impact pocket clearly identified
29/12/20171 787
1 389
3 296
120
396
1 311
1 041
79
350
120
Environment Theme
Other ESG themes
TOTAL
Social theme
Equity funds
Equity funds
Green bonds
Fixed-income funds
Infrastructures
Equity funds (including social economy)
marKet ValUe in €m
30/12/20161 213
1 355
2 663
95
312
1278
625
77
275
95
identification of investments in impact funds
Table extracted from a report

173 shades of reporting - Season 2 11
reporting poliCy and goVernanCeof eSg and Climate StrategieSLike last year, 20 “Article 173” reports open with an editorial written by one or more directors or managers. Clearly aware of the issues and the regulatory context for sustainable finance, all say they want to make progress in taking into account extra-financial criteria.
Although the number of climate policies have doubled, the 2018 “Article 173” reporting analysis suggests it will take a few more years for investors to fully meet these obligations and deploy ESG and climate policies at a strategic level.
Relevance of the analysis
Integrating ESG analysis into long term financial strategy
“The integration of ESG criteria is a tool which allows the investor to identify opportunities for business growth. In the medium and long term, it is a carrier of economic outperformance for the buyer.”
Opposing ESG-Climate analysis and Financial analysis
“The second task is to analyze the portfolio and, subsequently, to improve it from an ESG-Climate perspective without harming the financial performance of the portfolio, which remains the primary objective.”
From one year to the next, the deployment of ESG policies in the management of portfolios has not changed significantly. 85% of the reports mention an ESG policy already in place. The others always declare an intention to get there. In rare cases, some even mention not taking extrafinancial criteria into account at this stage.
ESG
DEPLOYMENT
Nearly half of the "173" reports address ESG analysis by referring to their previous years of practice, the same proportion as last year. The other half continue to review the subject and reflect on the approaches and goals set for the use of ESG data.
EVOLUTION
The number of investors declaring the adoption of a broad climate policy in their investment strategy jumped to 60% (20 more than last year). Of those who do not, 15 reports refer to a climate policy being developed, while a dozen others still do not address the issue, or do not link climate analysis to a policy on climate change.
CLIMATE
Climate analysis seems more complex to understand than ESG data. Comments on the novelty of methodologies and the difficulty of integrating them into management remain frequent. However, about ten investors indicated a desire to move from reflection to implementation in 2018.
Source: Novethic

12 173 shades of reporting - Season 2
Source: Novethic
Source: Novethic
reporting on Climate riSKS
A better identificationof sources
a ubiquitous carbon footprint
SOUrCES OF CLIMATE ANALYSIS (Sample: 73)
ASSET CLASSES COVErED bY THE CArbON FOOTPrINTING
Rating agency Asset Manager Other (including consultants) In-house data collection
2017 (63 mentions) 2016 (51 mentions)
In total, 59 institutions specify the source of the climate analysis they use in 2017-18, 11 more than in 2016-17. Among those that indicate their data providers, 20 use a specialised notation on companies' energy transition strategy, provided by rating agencies or specialised consultants. In addition, the use of internal methodology for re-processing climate data is on the rise. These two phenomena testify to the gradual ownership of the subject, even if the resources allocated are often limited.
The carbon footprint measure remains most ly restr ic ted to corporate bond portfolios, followed by equity and sovereign bond portfolios. The carbon footprint of real estate investments, tracked b y m o n i t o r i n g t h e i r e n e r g y consumpt ion , shows a sharp increase on a percentage basis, with 13 measures against nine last year. Fifteen investors set goals or areas of progress for controlling and reducing their carbon footprint, sometimes with annual targets.
The measurement of portfolios’ carbon footprint is still gaining ground. Of the 73 reports analysed in 2017-18, 86% engaged in this exercise for at least a portion of their assets. This figure was only 74% last year, out of 69 identified reports.
About thirty investors continue to accompany carbon footprint results with general considerations about the usefulness and limitations of this indicator. They emphasize that the data is not comparable from one investor to another, and that the carbon footprint is just a non-prospective snapshot of the portfolio which does not allow the piloting of an investment strategy. Despite these caveats, 32 reports share the results of their carbon footprint measurement for both 2016-17 and 2017-18, and in 18 of them, financial institutions also comment on the evolution of the measure. While six investors merely comment on the evolution, most often on the downside, 12 others give more details and highlight the main factors or issuers explaining the difference from one year to the next.
Disclosed Undisclosed No analysis
4134
25
49
3
48
3830
1613
9
559
9
24
2930
14
Corporate bonds
Listed equity Sovereign bonds
Funds Real estate Other
Source: Novethic

173 shades of reporting - Season 2 13
heterogenous methods for measuring Carbon footprintBeyond the carbon footprint results presented, the units used provide information on the chosen methodologies.
COrPOrATES (equity and debt)
The calculation corresponding to the share attributable to the investor of the issues financed by an investment portfolio (in tonnes of CO2 per million Euro invested) is slightly ahead of that of the weighted average carbon intensity (in tonnes of CO2 per million Euros of figures for a company, or per million Euros of GDP for a sovereign issuer). While the TCFD recommendations for asset owners advocate the use of carbon intensity because it provides better information on a portfolio’s exposure to carbon-intensive firms, the prevalence of the calculation of financed emissions is explained by its more widespread use among new entrants, and the fact that it is more intuitive for many investors to normalize the carbon footprint by the value of the portfolio. About a quarter of investors provide a dual carbon footprint according to these two methodologies.
PUbLIC ISSUErS
The calculation of carbon intensity (normalized here by million Euros of GDP) rather than that of financed emissions appears to meet more consensus on sovereign bond portfolios.
rEAL ESTATE
While the monitoring of the energy consumption of real estate portfolios is still in the process of being formalized by a large number of investors, no unit at this stage seems to dominate the reports.
SCOPES
From 39% last year, the proportion of investors who choose to measure a carbon footprint up to Scope 3 (indirect emis-sions excluding energy consumption) has increased to 48% this year. Of the 21 investors in this case, not all comment on their choice, but those who do focus on top-tier suppliers. The double counting of certain CO2 emissions is mentioned occa-sionally. It seems to be accepted regarding the customer-sup-plier relationship (private issuers), but less so when it comes to the emissions of sovereign issuers.
That said, a quarter of investors continue to present their carbon footprint results without specifying which Scopes are included, which shows limited ownership of this indicator.
EMISSION SCOPES CONSIDErED FOr THE CArbON FOOTPrINTING
brEAKDOWN OF THE UNITS USED IN THE rEPOrTS (Sample : 57)
2016 (38 measurements)
Listed equity
Corporate bonds
Sovereign bonds
2017 (44 measurements)
23 15
23 21
Up to scope 2 Up to scope 3
t CO2/€M of turnover or GDP t CO2/€M invested emissions in absolute value (t CO2) other
t CO2/€M of rent t CO2/€M invested emissions in absolute value (t CO2) emissions CO2/m²/year energy consumption
Source: Novethic
Source: Novethic
Source: Novethic
23 27 3
429
23
2 2 5 5 3
9 5 2
26
1
1

14 173 shades of reporting - Season 2
emissions avoided, saved, or extrapolated:data for the most advanced
2°C trajectory: the course is set
Seven reports provided a measure of avoided emissions on at least one asset class last year (2016-17). This figure has increased to 12. In practice, these measures apply to a wide variety of asset classes, and just as for carbon footprint, they do not lend themselves to comparison among investors.
More than half of the reports mention the desire to align their portfolios with the goal of limiting global warming to 2°C, up from the 44% who said they were committed to this path last year. Among the investors who have not yet generalized analysis on all the portfolios, 10 have an initial assessment of this nature for companies in the energy and automotive sectors. It is based on a 2°C trajectory as defined by the International Energy Agency.
POSITIONNING IN rELATION TO THE 2°C ObjECTIVE AND TrANSLATION IN POrTFOLIOS
(Sample : 73)
Source: Novethic
Source: Novethic
At physical asset level
"Saved" emissions (i.e. extrapolation over the duration of the observed decline in the carbon footprint of a portfolio)
2 reports
Emissions avoided by a carbon performance higher than the average performance of each sector
3 reports
- Emissions avoided by energy efficiency
- Emissions avoided due to the deployment of green solutions
5 reports
Measuring avoided emissions linked to better management or the construction of green infrastructure (real estate, forests, renewable energy infrastructure)
3 reports
At issuers' level, consolidated At portfolio level
38%First analyses conducted
18%Clear intention of achievement displayed
44%No positionning

173 shades of reporting - Season 2 15
What type of climate risks?In the two climate risk categories, physical risks and transition risks, overall analysis remains slow to unfold. Physical risks are generally less studied than transition risks. Except for possible valuations of the assets at risk of depreciation (see below), the analysis produces fewer concrete elements that can be included in reporting. Some of the largest investors by volume of assets continue to devote their analysis to only one of the two types of risk.
MENTION OF SPECIFIC WOrK ON CLIMATE rISKS(Sample : 73)
Source : Novethic
Source : Novethic
51%At least one of both risks
7%Planned
42%Not explicitly
taken into account
evaluation of physical RisKs
Deconstruction by type of impact and management integration
“We consider three dimensions of physical risks: Market risk, Supply chain risk, Operations risk [...] The insight from this analysis serves as input for our systematic incorporation of physical climate risks into investment decisions as well as engagement with companies and asset managers.”
“In order to establish the current and future exposure level of each of the real estate assets, a list of climate indicators to be evaluated over the reference period and the future period has been defined for each of the six climatic hazards studied.”
The use of methodologies to quantify the potential losses or profits related to climate risks is rare: nine costings were found for eight investors. Two focus on the impact of physical risks on the value of a real estate portfolio.
Minimisation
“The invested values have little exposure to climate risks. Indeed, 68% of outstanding amounts are placed in the sector of financial corporations and government bonds or similar, whose exposure to the physical risks of climate change is limited.”
“These bonds are mainly securities issued by the OECD countries, which are not very sensitive to climate risks.”
quantifying potential gains or losses linked to climate risks
4
1
2
1
1
Losses
Losses and gains
Physical risks analysis applied to real estate and infrastructure debt portfolios
Physical and transition risks (Climate VaR)
Transition risks (via a carbon tax)
Physical risks (Climate risk scoring)
Physical and transition risks (Clim'Pact)
Number (total : 9)

16 173 shades of reporting - Season 2
Understanding of Climate risks
Two investors conducted a stress test of their portfolios of listed companies to measure losses induced by a sharp rise in the price of a tonne of carbon to $100 within five years, or more gradually, according to the IEA models of three main climate scenarios. One investor relied on a methodology developed by the research firm Four Twenty Seven to provide a climate risk score of its equity portfolios, defined by sector. This was based on granular analysis for each company of "hot spots" exposed to physical risks. The analysis was conducted by two other investors, who did not provide details of their risk score. Finally, two investors analysed their portfolios of private issuers using costing methodologies that model both the effects of physical risks, and transition risks. One of these investors is attempting to quantify the impact on the portfolio of large-scale use of low-carbon technologies in an ambitious 2°C scenario.
deployment of climate analysis
Commitments on the update and improvement
“The methodological reference used is external and well-known: it will be updated in the coming years and the relevance of the analysis will be strengthened”
Long-term deployment
“An objective to reduce the portfolio's carbon footprint in line with the 2°C target will be studied by 2030. An integration of climate risks in the mapping of global risks will be studied.”
Temperature survey of portfolios: a mature data for communication?
Six institutions report on a warming temperature (estimate of the temperature increase corresponding to the current level of emissions of a portfolio), of between 2.5°C and 4.7°C depending on the portfolios. Three others declare having proceeded to a first estimate without publishing the result. They were only two to do it last year. The Carbon Impact Analytics methodology, developed by Carbone 4 for corporate stocks and bonds, is used by four investors who publish one temperature, and two others who do not. There is also a methodology developed by Beyond Ratings for the sovereign bond portfolios of two investors, and a mention of Carbon Delta's Warming Potential methodology for one investor, who does not publish the result. One investor has translated a 2°C trajectory using the Sectoral Decarbonization Approach methodology (see Focus 3) into an implicit warming temperature.
foCUS 1
173 shades of reporting - Season 2 17
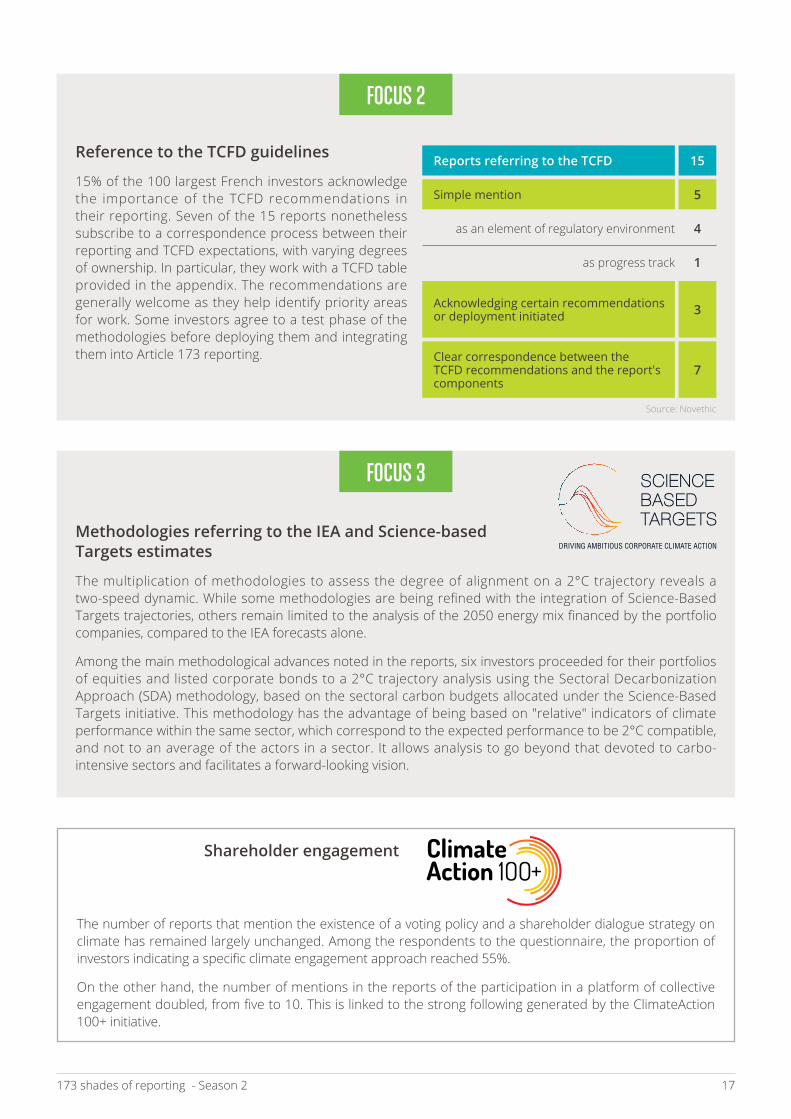
reference to the TCFD guidelines
15% of the 100 largest French investors acknowledge the importance of the TCFD recommendations in their reporting. Seven of the 15 reports nonetheless subscribe to a correspondence process between their reporting and TCFD expectations, with varying degrees of ownership. In particular, they work with a TCFD table provided in the appendix. The recommendations are generally welcome as they help identify priority areas for work. Some investors agree to a test phase of the methodologies before deploying them and integrating them into Article 173 reporting.
Methodologies referring to the IEA and Science-based Targets estimates
The multiplication of methodologies to assess the degree of alignment on a 2°C trajectory reveals a two-speed dynamic. While some methodologies are being refined with the integration of Science-Based Targets trajectories, others remain limited to the analysis of the 2050 energy mix financed by the portfolio companies, compared to the IEA forecasts alone.
Among the main methodological advances noted in the reports, six investors proceeded for their portfolios of equities and listed corporate bonds to a 2°C trajectory analysis using the Sectoral Decarbonization Approach (SDA) methodology, based on the sectoral carbon budgets allocated under the Science-Based Targets initiative. This methodology has the advantage of being based on "relative" indicators of climate performance within the same sector, which correspond to the expected performance to be 2°C compatible, and not to an average of the actors in a sector. It allows analysis to go beyond that devoted to carbo-intensive sectors and facilitates a forward-looking vision.
Shareholder engagement
The number of reports that mention the existence of a voting policy and a shareholder dialogue strategy on climate has remained largely unchanged. Among the respondents to the questionnaire, the proportion of investors indicating a specific climate engagement approach reached 55%.
On the other hand, the number of mentions in the reports of the participation in a platform of collective engagement doubled, from five to 10. This is linked to the strong following generated by the ClimateAction 100+ initiative.
foCUS 2
foCUS 3
reports referring to the TCFD
Simple mention
Clear correspondence between the TCFD recommendations and the report's components
Acknowledging certain recommendations or deployment initiated
as an element of regulatory environment
as progress track
15
5
7
3
4
1
Source: Novethic

18 173 shades of reporting - Season 2
deployment of Climate analySiS in inVeStment poliCy
diSinVeStment: from threShold logiCto BlaCKliSting?
The precise impact of climate analysis on investment policies remains difficult to assess. A third of respondents to the 2018 Novethic survey say this analysis has not yet had a significant impact on their investment decisions. On the other hand, there seems to be a consensus that climate data enriches the analysis. 85% of the institutional investors interviewed had put in place a progress plan with deadlines to improve the integration of climate criteria into the investment process.
Analysis of the reports shows that some analogies with ESG integration are beginning to appear, such as lists of issuers placed "under supervision" before possible divestment, due to their low degree of consideration of the energy transition, or three investors who specify having in their investment process a strategy combining "Best-in-class" and "Best effort" based on carbon intensity. In other words, these investors tend to dismiss issuers that combine high carbon intensity and insufficient transition dynamics. This is in addition to a trio of investors who have spent more than €9 billion of assets on low carbon mandates.
Beyond these rare examples, only the divestment procedures and the growing allocation to green assets are common.
€123.5 MThis is the amount of assets divested during the year under coal exclusion
policies
Source: Novethic survey
A total of 26 investors in 2017-18 report a policy of exclusion or freezing of investments in the thermal coal sector, already in force (20) or in the process of formalization (6), compared to around 20 in 2016-17. Exclusion and divestment criteria remain heterogeneous, with thresholds for turnover or energy production ranging between 15% and 50%. However, the emergence of thresholds in absolute value, via exclusions that apply to any energy company or mining company producing more than 20 million tonnes of coal per year (3 cases) or 100 million tonnes (one case), and criteria to exclude companies involved in the construction of new coal plants or coal mines (8 cases identified).
Four investors rely on the Global Coal Exit List maintained by the German NGO Urgewald and a network of NGO partners to identify companies that still have plans for new investments in coal, and therefore pose a risk of stranded assets.
In addition, 10 investors report a divestment approach on a case by case basis. These prefer a partnership approach in the energy transition, taking into account specificities of a company, a territory or a management mandate. Strictly speaking, with regard to disinvestment, the very variable exposure of portfolios to the coal sector, the diversity of thresholds practiced, or the prior existence of climate analysis that has led to disengagements before 2017 explains why only a handful of reports mention securities sold during the year. The data collected through the Novethic survey nonetheless makes it possible to quantify disinvestment of around €120 million.

173 shades of reporting - Season 2 19
only a feW inVeStorS go Beyond Coal eXClUSionSApart from coal, six other investors specify implementing a policy of exclusion on a scope extended to other types of fossil fuels. Three of them have committed to the exclusion of oil sand and hydrocarbon sectors in the Arctic, while three others exclude carbon companies (oil and gas firms, energy companies or mining groups active in coal) that have the lowest ESG ratings or energy transition strategy scores. Regarding the latter strategy, two investors articulate it with a threshold of annual CO2 emissions in absolute value.
The comparison of the reports from one year to another shows finally that the formalization of the exclusion policies within an institution can spread over several years. For example, an investor who in 2016 pledged to study the appropriateness of divesting from coal, said this possibility is now under consideration, pushing back the possible communication around a decision to next year.
dRawing conclusions fRom climate analysis
Drawing conclusions from Climate analysis
Information not processed
“The main private issuers in the TEE "High Risk" category were ANGLO AMERICAN PLC, CEZ AS, and GLENCORE PLC”
26 coalexclusion policies
20 policies already implemented
8 policies also targetting companies
which plan on building new plants or mines
4 policies are accompanied by production thresholds in
absolute value (20 or 100 Mt)
3 exclusion policies target the carbon intensive companies with
the lowest energy transition ratings
3 exclusion policies also target non conventional oil
and gas
€ 50 Mamount of divestment to be undertaken as a result of portfolio climate analysis
€ 300 Mdisengagement under consideration, in a scenario where they would not progress
Source: Novethic
Extracted from a report

20 173 shades of reporting - Season 2
Excluding Real Estate (see box), the total amount of green investment recorded in the 2018 Article 173 reports increased by around €2 billion to reach €17.2 billion. Compared to the volume of assets of each of the 36 investors who publish this information, the share of green investment remains unchanged at 1.07%, compared to 1.05% last year. There is a gap of €3.8 billion between the green investment volumes found in the reports, and those reported in the Novethic survey, but this is not enough to change the ratio. More detailed analysis shows there is no correlation between this percentage and the size of assets, but this correlation is found more according to the level of progress of the players.
green inVeStmentS: a Very Small inCreaSe in aSSetSGrEEN INVESTMENTS AS A PErCENTAGE
OF GLObAL ASSETS (Sample : 43)
0 - 0,5%
0,5 - 1%
1 - 2%
More than 2%
11
10
16
6
SUStainaBle-BUilding CertifiCationS gain groUnd in the reportSThe volume of certified real estate assets identified in the Article 173 reports was €8.5 billion last year. It has risen this year to €20.8 billion, and to €36.5 billion euros in light of the Novethic survey of the Study panel. This inflation can be explained by both the number of investors mentioning it (about 30, against 20 last year) and the likely recent certification of part of the real estate portfolios.
Green real estate represents on average 26% of total real estate assets. This corresponds to the value of all buildings that have at least a Green label or certification (construction or in-use), or whose labeling is in progress. This is the definition of "green building" that continues to be the most commonly used, for want of something better, even if the energy performance level of the assets certified (BREEAM, HQE and LEED etc) varies greatly. It is therefore difficult to take the analysis further without knowing the exact detail by level of certification, (Good/Silver vs. Excellent/Platinum) and the energy performance thresholds required for each level.
Even though many investors are beginning to set consumption reduction targets for their building stock, only a handful require minimum levels of certification or labeling specifically aimed at energy performance. In addition, the reports do not reveal any significant change in investment in positive energy buildings (€107.5 million recorded last year), except for a reception of a Plus-Energy building reported without details on the amount.
gReen Real estate
Certification analysis supplemented by an internal energy performance appraisal methodology
Few thoughts on the actual energy performance of certified buildings
“The environmental certifications taken into account are to date: HQE, BREEAM and LEED, whatever the level.”
CErTIFIED GrEEN bUILDING 2017
Light green building Medium green building Dark green building
24%
61%
15%
Source: Novethic
Graph extracted from a report
173 shades of reporting - Season 2 21
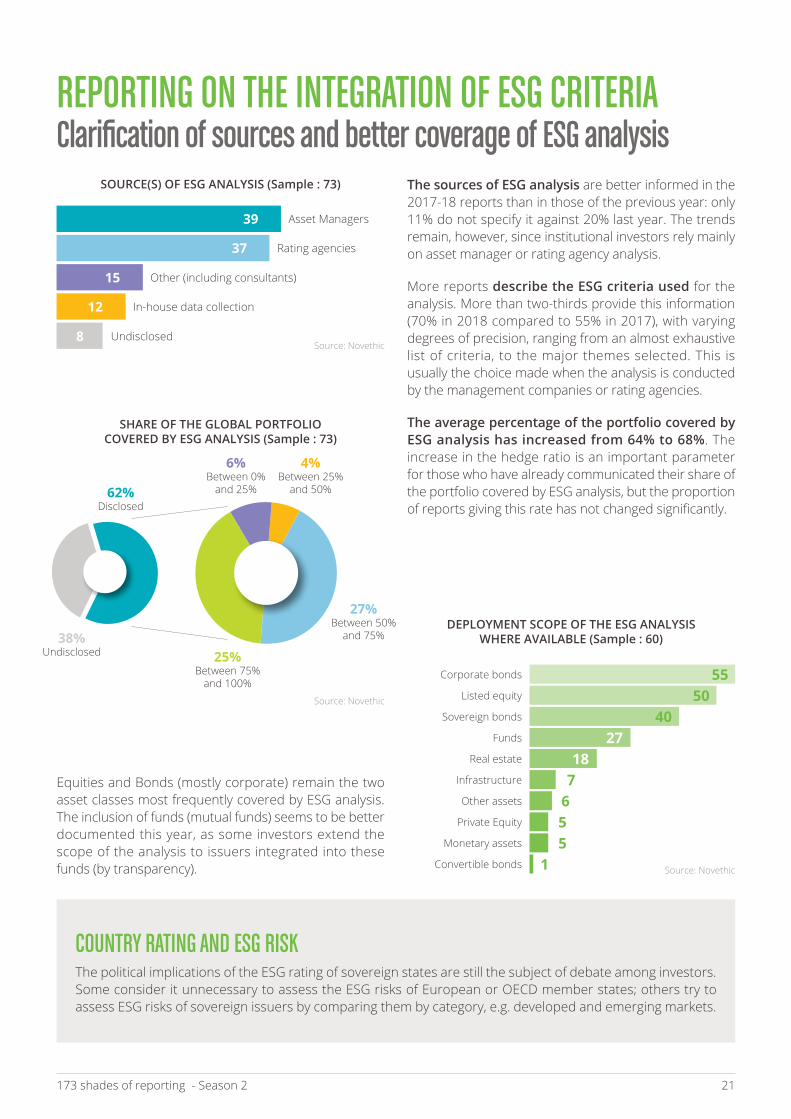
reporting on the integration of eSg CriteriaClarification of sources and better coverage of ESG analysis
The sources of ESG analysis are better informed in the 2017-18 reports than in those of the previous year: only 11% do not specify it against 20% last year. The trends remain, however, since institutional investors rely mainly on asset manager or rating agency analysis.
More reports describe the ESG criteria used for the analysis. More than two-thirds provide this information (70% in 2018 compared to 55% in 2017), with varying degrees of precision, ranging from an almost exhaustive list of criteria, to the major themes selected. This is usually the choice made when the analysis is conducted by the management companies or rating agencies.
The average percentage of the portfolio covered by ESG analysis has increased from 64% to 68%. The increase in the hedge ratio is an important parameter for those who have already communicated their share of the portfolio covered by ESG analysis, but the proportion of reports giving this rate has not changed significantly.
Equities and Bonds (mostly corporate) remain the two asset classes most frequently covered by ESG analysis. The inclusion of funds (mutual funds) seems to be better documented this year, as some investors extend the scope of the analysis to issuers integrated into these funds (by transparency).
SOUrCE(S) OF ESG ANALYSIS (Sample : 73)
SHArE OF THE GLObAL POrTFOLIO COVErED bY ESG ANALYSIS (Sample : 73)
DEPLOYMENT SCOPE OF THE ESG ANALYSISWHErE AVAILAbLE (Sample : 60)38%
Undisclosed
Asset Managers
Rating agencies
Other (including consultants)
In-house data collection
Undisclosed
CoUntry rating and eSg riSKThe political implications of the ESG rating of sovereign states are still the subject of debate among investors. Some consider it unnecessary to assess the ESG risks of European or OECD member states; others try to assess ESG risks of sovereign issuers by comparing them by category, e.g. developed and emerging markets.
62%Disclosed
6%Between 0%
and 25%
4%Between 25%
and 50%
27%Between 50%
and 75%
25%Between 75%
and 100%
39
37
15
12
8
Corporate bonds
Listed equity
Sovereign bonds
Funds
Real estate
Infrastructure
Other assets
Private Equity
Monetary assets
Convertible bonds
5550
4027
187
655
1
Source: Novethic
Source: Novethic
Source: Novethic

22 173 shades of reporting - Season 2
eSg management: a wide range of techniques, not always properly named and explained
The inclusion of the results of ESG analysis into investment processes is not detailed in the reports and is not clearer in the responses to the Novethic survey of the largest French institutional investors. ESG management strategy could only be clearly determined for 55 of the 73 institutions studied.
There are three main approaches. They consist of 1) limiting the main risks by establishing exclusion strategies, 2) integrating ESG criteria into the management, and 3) systematic filtering procedures. Uniquely, the last approach is not applied to all assets but only to specific portfolios. It consists of defining an eligible universe from the ESG point of view, which is supposed to guarantee the extra-financial quality of portfolios that are then built on traditional financial
criteria. This is particularly the case for Best-in-Class SRI mandates, launched in France by major institutional investors over the past 10 years, which have long been the foremost approach and structured practices of asset management companies.
ESG INVESTMENT STrATEGIES (Corresponding volumes as of Dec. 31, 2017 in €bn)
ESG SCrEENING STrATEGIES(Corresponding volumes as of Dec. 31, 2017 in €bn)
Screening
Source: Novethic
Source : Novethic
Screening
Number of corresponding investors
Number of corresponding investors
Case-by-case integration
includingbest-in-class
Structured integration
including best-in-universe
Norm-based exclusion
includingbest effort
While best-in-class selection approaches are very much the most used screening approaches (40% of the explicit reports concerning their ESG management strategy and €420bn of assets), the way in which these are detailed highlights very varied practices. Thus, a handful of investors (€81 billion) call "Best-in-class screening” approaches looser than the strict "Best in class", that is, issuers with the best practices within their respective industries. For these, the established thresholds lead to dismissing the worst performers in the investment universe, a risk reduction approach that is reminiscent of exclusion, rather than selecting the best in a real perspective of ESG quality portfolios.
Chosen by a handful of investors and described as best-in-universe, the other nuance when it comes to screening the best players consists in defining the eligible universe with the best practices not sector by sector, but according to the positioning of the issuers within the global investment universe. This approach sheds a different light on the screening philosophy. In Best-in-class, all sectors of activity are equivalent from the ESG point of view. Best-in-universe is based on the assumption that certain sectors may not contain good ESG practice, while others may list more than the average. But in practice, the reports seem confusing. Some investors working with asset management companies that have evolved towards Best-in-universe approaches continue to list their assets under the banner of Best-in-class.
“best in Class”: Precise technique or buzzword?
491
491
674
420
289
13
1262
60
27
27
X
X
27
22
12
4
32
4

173 shades of reporting - Season 2 23
ESG integration qualifies a set of techniques that generally aim to take ESG criteria into account directly in the construction of portfolios, without fundamen-tally altering their management strategy. In concrete terms, ESG analysis is thus made available to managers so they can use it in the choice of portfolio securi-ties, or by injecting key elements directly into the financial valua-tion parameters of the secu-rities. For a growing number of players, the process is thus objectified quantitatively, at the securities level or at the portfolio level, so that ESG is at the heart of financial analysis parameters and in the construction of portfolios. The techniques identified in this context can be classified as:
AT THE SECUrITIES LEVEL:
• Case-by-case integration: Half of the 55 reports dealing with integration strategy show a discretionary approach without any structure or objective that would allow to conclude that ESG integration goes beyond the principle of a case-by-case approach.
• Valuation: quantified integration of the results of ESG analysis into the financial valuation of securities. This can be done by assigning a variable weight to the ESG rating in the price target calculation, in the fundamental analysis score or in the risk limits of the portfolios. Rarely used by institutional investors (a single explicit report for €34 billion of assets), it is nevertheless implemented by a growing number of management companies on all their funds.
In parallel with the screening steps, we note, as last year, that the most used approach is now ESG integration. More detailed analysis makes it possible to note that this integration always leaves a certain degree of freedom to the manager since it is mostly a case-by-case approach, without any clearly established systematic technique or objective.
ESG INTEGrATION STrATEGIES(Corresponding volumes as of Dec. 31, 2017 in €bn)
Source : Novethic
Case-by-case integration
Structured integration
including Valuation
including Weighting
including Minimum
portfolio score
including Objective
of portfolio improvement
Number of corresponding investors
ESG integration dominates, but what exactly does it cover?
Other investors supplement the static view of the Best-in-class approach by considering for their screening the recent and/or expected evolution of the issuers to establish their selection. This interesting nuance is usually referred to as "Best-effort". It is sometimes explained in the reports but is also associated with the broader description Best-in-class.
The last confusion noted: in half a dozen reports, the Best-in-class technique refers to the fact that the rating of the issuer is actually done by sector but no ESG screening process has been visibly put in place. Management can then adopt a case-by-case ESG integration approach or a weighting approach according to their rating (see ESG integration box below).
All references to Best-in-class are far from associated with the same screening techniques and the same levels of constraint. The name thus seems more a philosophy than a standardized framework whose ESG impact on portfolios could be qualified. Moreover, the borderline between Best-in-class selection, integration and exclusion sometimes seems to be misunderstood as some reports describe techniques by associating them with names that do not correspond to them.
674
289
34 27
225
2
27 12 1 2 8 1
X

24 173 shades of reporting - Season 2
Whatever the techniques adopted, however, institutional investors seem to be aware of the progress they still have to make in terms of ESG management. The survey reveals that 88% plan to improve the integration of ESG criteria in their management, mostly by integrating more ESG analysis into the investment decision and process.
• Weighting: change in weight given to issuers according to ESG criteria. This is usually a form of ESG bonus/malus operated in the construction of portfolios. This strategy is worth €27 billion.
AT THE POrTFOLIO LEVEL:
• Minimum portfolio score: Implemented by a few dozen investors on €225 billion of assets, this strategy establishes the objective of a minimum portfolio score, calculated by establishing the weighted average of the ESG scores of the issuers composing it. The most commonly used objective is that of an ESG score greater than or equal to that of the benchmark.
• Objective to improve the ESG rating of the portfolio: Rather rare, although interesting for its progressive nature, this is a strategy aimed at increasing the ESG score of the portfolio over time. In particular, it allows investors to work on flows without impacting stocks, thus facilitating the link between respect for prudential constraints and the ESG approach.
exclusion processes are making their way and clarifying (a bit) the situationIn 2017, there was rapid adoption of exclusionary practices related to ESG criteria. Now 48 investors, or nearly two-thirds of the reports analyzed, refer to it. This is largely driven by 21 new institutions reporting norm-based exclusion. Responding to a logic of excluding controversial companies, norm-based exclusions consist of exclu-ding from all portfolios issuers guilty of violating fundamental international standards on human rights, environment, etc. T h e m o s t c o m m o n l y u s e d frameworks are: non-fiscal co-ope-ration of states (11), non-OECD states (according to corruption-related standards) or international sanctions (11), or severe violations of the principles of the United Nations Global Compact (9). Many institutions, usually insurers or investors associated with a large bank, apply the group's sectoral policies rather than strict exclusions. The latter may lead to the exclusion, on a case-by-case basis, of the most controversial companies, especially when they operate in sensitive sectors (armaments, palm oil, nuclear power, etc.)
* The exclusion practices of controversial weapons (cluster munitions, anti-personnel mines, chemical and bacteriological weapons, etc.) have not been included here because they simply meet a regulatory compliance requirement.
MAIN TYPES OF EXCLUSION POLICIES(Corresponding volumes as of Dec. 31, 2017 in €bn)
Source: Novethic
Norm-based exclusion (beyond
compliance*)
Exclusion of tobacco
Gambling Weapons (beyond
controversial weapons*)
Pornography Other (alcohol, palm oil...)
32 30 9 4 5 11
Number of corresponding investors
12621016
93 12 11 3
X

173 shades of reporting - Season 2 25
following contRoveRsies
Integrating the results of controversy analysis into engagement and / or investment policy
“Integration of ESG analysis into investment policy [...] The second phase, which was rolled out in 2017, consisted of: • conducting more formal follow-up of the ESG risks related to our
investments, via subscription to monthly analysis of ESG controversy for issuers.
• the selection of issuers with best ESG practices, by stopping any acquisition of securities held directly, whose issuer is simultaneously in the SRI category "Under Supervision" and identified as having a high level of ESG controversy.”
Some reports, thanks to an external analysis, display an astonishing degree of precision on the follow-up of controversies, without any commitment or investment decision being associated with them.
Not drawing conclusions from the analysis of controversial issuers
eSg ControVerSieS: no ConSenSUSNone of the cases of controversy mentioned in the reports appear more than two or three times. The controversies concern banks involved in financing the Keystone XL and Trans Mountain pipelines, the G4S case of mistreatment of prisoners, and the case of German automakers suspected of price collusion and the fixing of depollution technical equipment..
CONTrOVErSY LEVELS EVOLUTION% OF PrIVATE ISSUErS ASSETS
Graph extracted from a report
Non evaluated 2017
2016
Very high
High
Medium
Low
16,1%19,6%
2,3%
13,5%
29,6%
35,0%
2,0%
15,9%
26,5%
39,5%
Sector exclusions are also making their way into the practices of institutional investors. The exclusion of tobacco is progressing the fastest. Ten investors who did not mention it last year are now declaring it in place. The change of status of tobacco, with its fundamentally negative impact on health, probably lies with two factors: companies in this sector are largely dedicated to this activity, thus making it difficult for an investor to consider they would change course. Also, there are only a few large tobacco companies within stock market indices, which probably facilitates their identification and exclusion from portfolios.
Apart from tobacco, 18 investors apply a sector exclusion policy (up from 16 in 2016-17). Other sectoral exclusions frequently cited are gambling (9), alcohol (5), pornography (5), speculative activities on agricultural raw materials (5) and armaments (4).

26 173 shades of reporting - Season 2
eValUation of impaCt: the SdgS
The framework of the Sustainable Development Goals (SDGs) is making headway but its deployment remains marginal. It ranges from the simple reuse of green bond reporting to a more global reflection on the portfolio's contribution to the SDGs. The objectives of investors in this area are built on the SDG data provided to them via the extra financial rating, or according to the CSR policy and/or philosophy of the institution. The picture remains relatively far from concrete evidence of investors' contributions to the SDGs, individually or globally.
engagement progresses
First steps towards the evaluation of porfolios' positive or negative contribution to the SDGs
impact measuRement
ENGAGEMENT PrACTICE
Engagement practice
- voting policies
- shareholder dialogue
- voting statistics provided in the reporting
- participation in ESG-focused engagement platforms : PRI, etc. Source : Novethic
Source: Novethic
MENTION OF SDGS(Sample : 18)
GLObAL POSITIVE CONTrIbUTION TO SDGS : 49%
52
11
Graphs extracted from a report
Very negative Negative Neutral Positive Very positive Non applicable
3%16%
9%
22%
16% 23%
2% 2% 2% 2%
3% 2% 3% 3%
13% 17%7%
1% 10%
8% 1%
9% 1%
13%
38% 32% 54%
16%
12%
20% 44%
50%
36%
32% 26% 52%
68% 45% 53% 34%
Corporate governance
Decent work
Business ethic
Well-being
Primary needs
Development tools
Natural resources
Clean technologies
Deployment initiated
Simple allusion to SDGs
Goals currently
being defined
The number of investors - already in the majority in 2016-17 reports - with a shareholder engagement pol icy continues to grow. In 2017-18, 66% of the reports (and SRI charters) mention such a policy, against 58% in 2016-17.
Among various engagement strategies, voting policies and the practice of shareholder dialogue in particular have developed: voting policies were put in
place by 56% of institutional investors in 2017-18 compared to 49% in 2016-17, and shareholder dialogue was practiced by 45% against 39% in 2016-17. This commitment can be achieved through the direct involvement of the institution when the securities are managed internally, or through requirements communicated to the asset management companies.
In addition, about a dozen investors mention the collaborative engagement initiatives they have become involved with.
66%
56%
45%
27%
10%

173 shades of reporting - Season 2 27
ConClUSionArticle 173-VI of the Ecological Transition Law for Green Growth has had an incredible destiny. Born a few months before the COP 21 and the Paris Agreement, it has gained international notoriety and serves as a reference in terms of reporting requirements imposed on institutional investors.
Its implementation decree provides that the regulatory authorities draw up an assessment, before 31 December 2018, of the first two years of operation. This should be used to draw the lines of a "reference typology fixed by decree on the basis of best practice". While the idea of standardizing the reporting framework is welcome, the first two exercises already leave many unresolved issues:
1. The scope of Article 173
Institutional investors are not a homogeneous group, legally identified as such, and some investors consider that they are not subject to this obligation. Looking at the panel of the 100 largest asset owners in Novethic's study, 27 are still missing. It is a paradox at a time when the European Commission hopes to extend this reporting obligation to all institutional investors in the Union.
A first step for improving the regulatory system could be the clarification and extension of the scope.
2. Linkages between different regulations and existing standards:
Some Article 173 reports clearly refer to the ongoing European work related to the European Commission's Sustainable Financing Action Plan, while others refer to the PACTE draft law. A third category undertakes to base its reporting on the guidelines of the TCFD (Task Force on Climate-Related Financial Disclosure). All testify to the need to clarify the nature of their obligations and benchmarks to be used to monitor climate risks and the integration of ESG criteria.
A second step for improvement could be to define links between Article 173 obligations and the TCFD guidelines. It would also be interesting to create an obligation to match one's carbon footprint with improvement goals.
3. Commitments to finance the energy transition
While many investors state their willingness to be part of the solution by assuming their role as financiers of the energy transition, clear targets to increase the green share of portfolios remain rare. When adding up the green assets reported by institutional investors fulfilling their obligations under Article 173, they increased by 0.02% between 2017 and 2018 to reach 1.07%.
A third area of improvement could be to set a significant threshold of contribution to financing the energy transition by percentage of global assets.
4. Communication to "citizen savers"
One of the unknown uses of Article 173 is to facilitate the information of investors of any kind on the consideration of climate risks and ESG dimensions in different vehicles, including savings owned by individual investors, starting with their life insurance products. The various tests performed show that we are still far from an accessible and intelligible communication.
A fourth avenue for improvement would be to launch large-scale "climate-labeled" unit-linked investment funds and to improve the reporting of the main saving accounts pending a possible European eco-label.
Article 173 remains, in any case, an unparalleled attempt to include institutional investors in the active fight against climate change and the integration of business models that support the Sustainable Development Goals. At a time when the IPCC sounds the alarm by giving us only 10 years to radically transform our global economy, it should be given a much greater capacity for transformation.
Anne-Catherine Husson-TraoreCEO of Novethic

Survey conducted by nicolas redon and Julie nicolas with dominique Blanc, novethic head of research
Season iiShadeS of reporting
Sustainable transformation accelerator. Novethic guides financial institutions, companies and committed citizens to accelerate their sustainable transformation. Subsidiary of the Caisse des Dépôts Group (France), Novethic activates four complementary transformation levers: to produce knowledge and to foster conviction, to implement standardized assessment systems, to develop competencies of sustainable transformation promoters and to highlight model initiatives.