client investment update superannuation products 31 march 2015
TRANSCRIPT

CLIENT INVESTMENT UPDATESuperannuation products
31 March 2015

2
GENERAL ADVICE WARNING AND DISCLAIMER
The information in this presentation has been provided by MLC Limited (ABN 90 000 000 402) a member of the NAB Group of Companies, 105–153 Miller Street, North Sydney 2060 for advisers only. No company in the NAB group, nor MLC limited guarantees the capital value, payment of income or performance of any fund referred to in this presentation.
Any opinions expressed in this communication constitute our judgement at the time of issue and are subject to change. We believe that the information contained in this communication is correct and that any estimates, opinions, conclusions or recommendations are reasonably held or made as at the time of compilation. However, no warranty is made as to their accuracy or reliability (which may change without notice) or other information contained in this communication. Any projection or forward looking statement in this report is provided for information purposes only and no representation is made as to the accuracy or reasonableness of such projection or that it will be met.
Past performance is not a reliable indicator of future performance. The value of an investment may rise or fall with the changes in the market. Returns are not guaranteed and actual returns may vary from target returns described in this document. Please note that all performance reported is before management fees and taxes, unless otherwise stated.
This communication contains general information and may constitute general advice. Any advice in this communication has been prepared without taking account of individual objectives, financial situation or needs. It should not be relied upon as a substitute for financial or other specialist advice.
Before making any decisions on the basis of this communication, you should consider the appropriateness of its content having regard to your particular investment objectives, financial situation or individual needs. You should obtain a Product Disclosure Statement or other disclosure document relating to any financial product issued by MLC Nominees Pty Ltd (ABN 93 002 814 959) as trustee of The Universal Super Scheme (ABN 44 928 361 101), and consider it before making any decision about whether to acquire or continue to hold the product. A copy of the Product Disclosure Statement or other disclosure document is available upon request by phoning the MLC call centre on 132 652 or on our website at mlc.com.au.
Bloomberg Finance L.P. and its affiliates (collectively, “Bloomberg”) do not approve or endorse any information included in this material and disclaim all liability for any loss or damage of any kind arising out of the use of all or any part of this material.
The funds referred to herein are not sponsored, endorsed, or promoted by MSCI, and MSCI bears no liability with respect to any such fund.

3
TABLE OF CONTENTS
1. Market update
2. Investment Futures Framework
3. Activity this quarter
4. More analysis of returns
5. Where to find client tools

MARKET UPDATE
4
1.
What happened Our insights
Very solid returns over the quarter and year to December. Australian and global REITs continued to attract yield hungry investors. Global shares benefited from strong returns in the Eurozone and Japanese markets.
The Bank of Japan’s massive QE program is continuing, and in January, the European Central Bank announced a QE program, commencing in March. Share markets continue to rely largely on QE for their direction, defying underlying risks of these weak economies.
AUD continued to weaken due to declining demand for exports eg iron ore.Unhedged global assets were boosted by the falling AUD.
Our overweight position in foreign currency exposure position worked well but the weaker AUD reduces its potential diversification benefit. We retain this position as the potential benefit still outweighs the risks.
Many assets are at least fully priced.Global liquidity remains massive due to very loose monetary policy and assets are expensive.
It’s uncertain whether very loose monetary policy will continue to boost share markets. Risks remain elevated:•existing geopolitical issues rumble on eg rising popularity of extremist parties in the eurozone and radical Islamist forces in Iraq •Australian shares and the AUD remain vulnerable to adverse developments in China because our national income is slowing and national debt is extremely high •the drama in Europe is far from over, and •interest rates in the US will eventually rise but the impact on economic activity and investment returns is unclear. Future return potential for all major asset classes is lower than average. After the strong returns of this quarter we are increasing our defensive positioning further.
4

MARKET UPDATE1.
All asset classes had positive returns over quarter, 1, 3 and 5 years.
5

Source: Iress
A strong year for most global share markets. Japan and the Eurozone were boosted by QE. Australia’s return was due largely to industrials, as resource and energy companies lost ground. China’s shares benefitted from a surprise interest rate cut in November.
6
Market 1 year return to 31 March 2015
S&P500 (USA) 10.4%
DAX (Germany) 25.2%
CAC (France) 14.6%
Nikkei (Japan) 29.5%
Hang Seng (Hong Kong) 12.4%
Shanghai (China) 84.3%
FT100 (UK) 2.6%
S&P/ASX200 Accumulation- All Industrials- All Resources
14.1%21.0%-13.1%
MARKET UPDATE1.
6

Source: Datastream, OECD
MARKET UPDATE1.
Despite the AUD’s sharp depreciation, it remains overvalued. We continue to overweight our portfolios to foreign currencies to reduce the risk of negative returns in weak scenarios such as a China hard landing.
7

Source: Datastream, NAB Asset Management. Latest observation is Q1 2015
MARKET UPDATE1.
Share markets are not cheap. We remain under or at benchmark weight to growth assets in our portfolios.
8

The world’s most expensive property markets: median house price to median household income ratio
Source: Demographia International Housing Affordability Survey: 2015. Based on data from Q3 2014.
MARKET UPDATE1.
Direct property not an attractive investment. Australia has nine of the 20 most expensive property markets in the world.
9

MARKET UPDATE1.
Bond yields are close to historic lows in most major markets. We remain underweight fixed income because there is a greater risk of yields rising than falling further.
10Source: Datastream, latest observation is 9 April 2015

Source: Datastream, NAB Asset Management. Last observation is March 2015.
MARKET UPDATE1.
Term deposit rates have plunged and the search for yield continues.
11

# Includes options and unrealized gains or losses on currency forwards and futures contracts.
Source: International Value Advisers
MARKET UPDATE1.
Our defensive global shares manager, IVA, has increased cash exposure to 36%, its highest level in years, and reduced fixed income to its lowest level.
12
International Value Advisers’ historical asset allocation

Source: JANA Corporate Investment Services Limited
MARKET UPDATE1.
Recent disclosure changes have drawn attention to investment fees. We invest in assets and strategies that will have a positive impact on the return or risk outcome of our portfolios, after taking fees into account eg the long-term excess return from MLC’s private assets strategy has, on average, far exceeded that of listed markets after taking into account all fees.
13

Our tailored scenarios capture distinct possible futures
INVESTMENT FUTURES FRAMEWORK2.
For a description of each scenario, please refer to ‘MLC’s scenario insights & portfolio positioning’, March 2015
Hig
he
rL
ow
er
Pro
bab
ilit
y
Extended quantitative easing
Three speed global economy (China soft landing)
Early re-leveraging
One speed slow growth world
Two speed recovery
Developed market austerity, recession, stagnation
(Mild) inflationary resolution
China hard landing
Inflation shock
Sovereign yield re-rating
Reform
Stagflation
Extended risk aversion
14
Change in probability since last
quarter

Australian shares (6%)Global shares (hedged) (0.5%)Defensive global shares (unhedged) (15%)Emerging markets strategy (unhedged) (3%)Multi-asset real return strategy (hedged) (14%)Global private assets (hedged) (4%)Low correlation strategy (6%)Insurance related investments (hedged) (2%)Cash (17.5%)Australian non-government bonds (18%)Australian inflation-linked bonds (10%)Global bank loans (3%)Risk management strategy (1%)
15
MLC INFLATION PLUS − MODERATEASSET ALLOCATION AT 31 MARCH 2015
INVESTMENT FUTURES FRAMEWORK− MLC Inflation Plus positions
Potential risk or opportunity
Change in MLC Inflation Plus portfolios this quarter
Risk of a market correction
In recent quarters, several factors have combined to increase market volatility, with uncertain consequences for global growth. These factors include falling commodity prices – particularly for oil and iron ore and the prospect of less aggressive monetary policy in the US, although the introduction of quantitative easing in the eurozone may to an extent act as a mitigant. The Australian dollar and resource-related companies remain vulnerable to slowing growth in China. Because of these risks, and stretched market valuations, the portfolio had been positioned increasingly defensively.
Risk of an eventual rise in inflation
We seek to deliver returns higher than the rate of inflation, which is a moving target. While the forces of deflation are currently strong, we are concerned about an eventual rise in inflation. Inflation-linked bonds can help provide protection against unexpected rises in inflation in scenarios such as Stagflation and Inflation shock. Therefore we’ve further increased the allocation to Australian inflation-linked bonds and reduced the exposure to cash.
Unchanged positions:•High foreign currency exposure•Defensive global shares (instead of broad market global shares)•No direct allocation to long duration traditional bonds
2.

Target asset allocation: MLC Inflation Plus portfolios (super and pension products) at 31 March 2015
MLC Inflation Plus: Conservative Moderate Assertive
Australian shares 2% 6% 7%
Global shares (unhedged) - - -
Global shares (hedged) 0.5% 0.5% -
Defensive global shares (unhedged) 7.5% 15% 31%
Global private assets (hedged) 2% 4% 7%
Emerging markets strategy (unhedged) 2% 3% 6%
Global property securities (hedged) - - -
Low correlation strategy 5% 6% 13%
Multi-asset real return strategy (hedged) 11% 14% 18%
Insurance-related investments (hedged) - 2% 2%
Cash 28% 17.5% 4.5%
Australian non-government bonds 27% 18% 2%
Australian inflation-linked bonds 12% 10% 8%
Global bank loans 2% 3% -
Risk management strategy 1% 1% 1.5%
Borrowings - - -
Total 100% 100% 100%
16
ASSET ALLOCATIONS TAILORED TO INVESTMENT OBJECTIVES
INVESTMENT FUTURES FRAMEWORK− MLC Inflation Plus positions
2.

17
INVESTMENT FUTURES FRAMEWORK− MLC Horizon 4 Balanced positions
Position relative to benchmark Why we have position
Underweight to growth assets
In recent quarters, several factors have combined to increase market volatility, with uncertain consequences for global growth. These factors include falling commodity prices – particularly for oil and iron ore and the prospect of less aggressive monetary policy in the US, although the introduction of quantitative easing in the eurozone may to an extent act as a mitigant. The Australian dollar and resource-related companies remain vulnerable to slowing growth in China. These risks, and stretched market valuations, support our continued defensive positioning.
Underweight to interest rate risk
While bond yields (interest rates on bonds) could decline from their already low levels, the potential for further falls is less than the potential for yields to rise.
Overweight to foreign currencies
Global share markets and the Australian dollar (AUD) tend to move in the same direction. By having an exposure to foreign currencies (for example, not hedging some of our overseas assets to the AUD) we can help insulate the portfolio against losses when share markets fall or are volatile. This position worked well this quarter.
2.
MLC HORIZON 4 – BALANCED ASSET ALLOCATION AT 31 MARCH 2015
Australian shares (29%)Global shares (unhedged) (22%)Defensive global shares (unhedged) (1%)Global property securities (hedged) (4%)Global private assets (hedged) (6%)Multi-asset real return strategy (hedged) (6%)Emerging markets strategy (unhedged) (1%)Low correlation strategy (1.5%)Cash (1.6%)Australian inflation-linked bonds (7%)Australian bonds (10.8%)Global government bonds (2.1%)Global non-government bonds (2.6%)Global multi-sector bonds (3.1%)Global high yield bonds (1%)Global bank loans (0.8%)Global mortgages (0.2%)

Australian shares (31%)
Global shares (unhedged) (24%)
Global shares (hedged) (11%)
Global property securities (hedged) (4%)
Cash (1%)
Australian inflation-linked bonds (7%)
Australian bonds (13%)
Global government bonds (2%)
Global non-government bonds (3%)
Global multi-sector bonds (4%)
2. INVESTMENT FUTURES FRAMEWORK− MLC Index Plus Balanced positions
Position relative to benchmark Why we have position
Underweight to growth assets
In recent quarters, several factors have combined to increase market volatility, with uncertain consequences for global growth. These factors include falling commodity prices – particularly for oil and iron ore and the prospect of less aggressive monetary policy in the US, although the introduction of quantitative easing in the eurozone may to an extent act as a mitigant. The Australian dollar and resource-related companies remain vulnerable to slowing growth in China. These risks, and stretched market valuations, support our continued defensive positioning.
Underweight to interest rate risk
While bond yields (interest rates on bonds) could decline from their already low levels, the potential for further falls is less than the potential for yields to rise.
Overweight to foreign currencies
Global share markets and the Australian dollar (AUD) tend to move in the same direction. By having an exposure to foreign currencies (for example, not hedging some of our overseas assets to the AUD) we can help insulate the portfolio against losses when share markets fall. This position worked well this quarter.
MLC INDEX PLUS – BALANCEDASSET ALLOCATION AT 31 MARCH 2015
18

INVESTMENT FUTURES FRAMEWORK − Potential returns
2.
Future return potential is increasingly compressed across shares and fixed income assets. The higher prices go, the lower future returns must eventually be.40 SCENARIO SET PROBABILITY WEIGHTED REAL RETURNS (MARCH 2015) (5 YEARS, 0% TAX WITH FRANKING CREDITS, PRE-FEES, PRE-ALPHA)
Source: JANA Corporate Investment Services Limited

INVESTMENT FUTURES FRAMEWORK − Potential returns
2.
The graph shows the complete range of potential returns for each portfolio. Portfolios with wider ranges could have more extreme return outcomes than those with narrow ranges.
Source: JANA Corporate Investment Services Limited
POTENTIAL REAL RETURNS (MARCH 2015)(5 YEARS, 0% TAX WITH FRANKING CREDITS, PRE-FEES, PRE-ALPHA)
Rea
l re
turn
s (%
pa)
The darker the shade, the closer the outcomes are to the median.

ACTIVITY THIS QUARTER – Changes to MLC Inflation Plus asset allocations
21
3.
21
Increased the defensive positioning and protection from an eventual rise in inflation.
-2.5%
-2.0%
-1.5%
-1.0%
-0.5%
0.0%
0.5%
1.0%
1.5%
2.0%
2.5%
Australianshares
Globalshares
(unhedged)
Globalshares
(hedged)
Defensiveglobalshares
(unhedged)
Multi-assetreal returnstrategy(hedged)
Emergingmarketsstrategy
(unhedged)
Lowcorrelationstrategy
Cash Australianinflation
linked bonds
Riskmanagement
strategy
MLC Inflation Plus - Conservative MLC Inflation Plus - Moderate MLC Inflation Plus - Assertive

22
A. MLC Inflation Plus portfolio returns
Relative to benchmarkContributors to returnsB. MLC Horizon portfolio returns
Absolute returnsContributors to returnsRelative to peersC. MLC Index Plus portfolio returns
Absolute returnsContributors to returnsD. Asset class fund returns
Relative to benchmark
MORE ANALYSIS OF RETURNS4.

23
4. A. MLC INFLATION PLUS − Returns relative to benchmark
23
MasterKey Super FundamentalsPerformance to 31 Mar 2015
3 months%
1 year % pa
3 years
% pa5 years
% pa7 years
% pa
CPI (latest available is 31 December 2014) 0.5 1.8 2.4 2.4 2.5
MLC Inflation Plus – Conservative Portfolio
Net of fees and tax 2.9 8.2 - - -
Before fees and tax 3.5 10.3 - - -
Return above inflation - aims to achieve 3.5%pa above inflation (before fees and tax) over 3 year periods
3.0 8.5 - - -
MLC Inflation Plus – Moderate Portfolio
Net of fees and tax 4.1 10.7 - - -
Before fees and tax 4.8 13.5 - - -
Return above inflation - aims to achieve 5%pa above inflation (before fees and tax) over 5 year periods
4.3 11.7 - - -
MLC Inflation Plus – Assertive Portfolio
Net of fees and tax 6.3 17.4 12.7 9.6 6.0
Before fees and tax 7.1 20.5 16.2 13.0 9.3
Return above inflation - aims to achieve 6%pa above inflation (before fees and tax) over 7 year periods
6.6 18.7 13.8 10.6 6.8
Source: MLC Limited and JANA Corporate Investment Services Limited

24
MLC INFLATION PLUS ASSERTIVE RETURNS (BEFORE FEES AND TAXES) RELATIVE TO ITS TARGET
4.
Delivered 6.8% pa real return over 7 years to 31 March 2015. Currently on track to deliver target return over shorter time frames too.
A. MLC INFLATION PLUS ASSERTIVE− Returns relative to benchmark
Source: JANA Corporate Investment Services Limited
4.
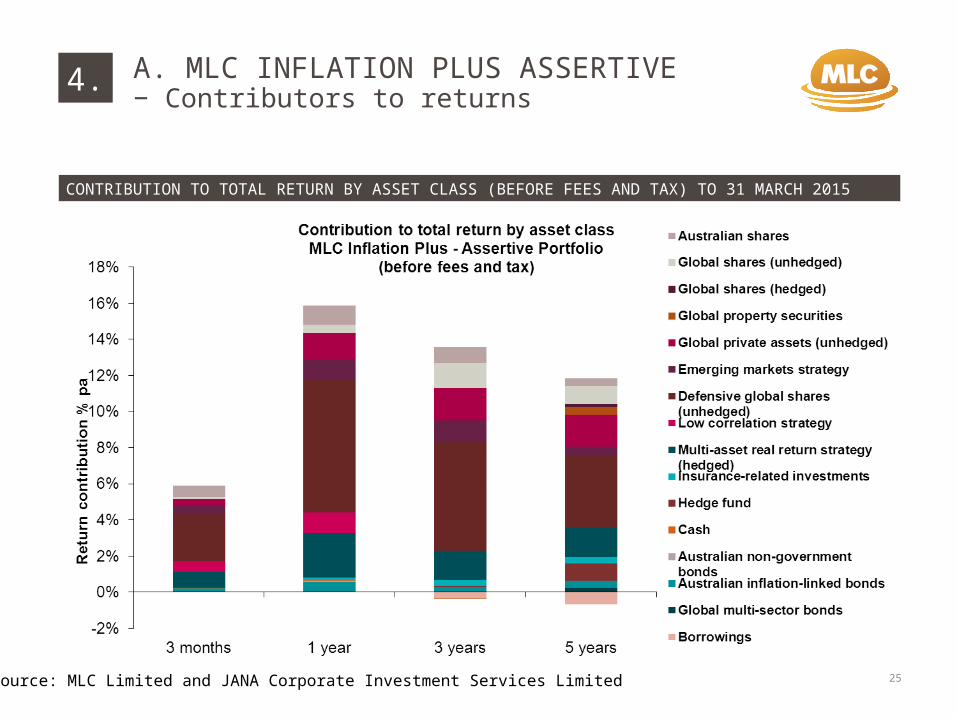
CONTRIBUTION TO TOTAL RETURN BY ASSET CLASS (BEFORE FEES AND TAX) TO 31 MARCH 2015
A. MLC INFLATION PLUS ASSERTIVE − Contributors to returns
25Source: MLC Limited and JANA Corporate Investment Services Limited

MasterKey Super FundamentalsPerformance to 31 March 2015
3 mths%
1 year % pa
3 years % pa
5 years
% pa7 years
% pa
MLC Horizon 1 Bond 0.8 2.4 3.0 3.4 3.6
MLC Horizon 2 Capital Stable 3.3 8.2 7.4 6.0 4.7
MLC Horizon 3 Conservative Growth 4.9 11.6 10.0 7.5 5.4
MLC Horizon 4 Balanced 6.5 14.8 12.6 8.7 5.7
MLC Horizon 5 Growth 7.4 16.6 14.3 9.4 5.8
MLC Horizon 6 Share 8.3 18.4 16.1 10.0 5.9
MLC Horizon 7 Accelerated Growth 10.2 22.2 20.2 11.7 5.9
26
4. B. MLC HORIZON− Absolute returns (net of fees and tax)
26
Source: MLC Limited

• Australian shares
• Global shares (unhedged)
• Fixed income
Key contributors to most portfolios over the quarter
• Australian shares
• Global shares (unhedged)
• Fixed income
Key contributors to most portfolios over the year
4. B. MLC HORIZON− Contributors to returns
27

28
Note: Peer universe is the MLC Morningstar Superannuation Universe
Source: Morningstar Direct
Returns are above median over all timeframes
B. MLC HORIZON – Relative to peers – quartile performance rankings for MLC Super Fundamentals
4.
to 31 March 2015
1 year 3 years 5 years
MLC Horizon 2 Q2 Q2 Q1
MLC Horizon 3 Q2 Q2 Q2
MLC Horizon 4 Q1 Q1 Q1
MLC Horizon 5 Q1 Q1 Q1
MLC Horizon 6 Q1 Q1 Q1

All the MLC Horizon portfolios are above median over all timeframes − a strong result
MLC Horizon 4’s one year peer relative return is in the top quartile. The main reasons are:
• the foreign currency overweight has added value
• peers invest more in hedge funds which on average haven’t performed as strongly as our multi-asset real return strategies (including Inflation Plus). These strategies continue to provide risk control, and
• the portfolio doesn’t have a direct allocation to commodities, which have performed very poorly for peers, on average.
B. MLC HORIZON− Relative to peers
29
4.
29

30
4. C. MLC INDEX PLUS− Absolute returns (net of fees and tax)
30
MasterKey Super FundamentalsPerformance to 31 March 2015
3 months%
1 year % pa
3 years% pa
MLC Index Plus Conservative Growth 4.8 11.7 10.6
MLC Index Plus Balanced 6.3 14.7 13.4
MLC Index Plus Growth 7.2 16.5 15.4
Source: MLC Limited

• Australian shares
• Global shares (unhedged)
• Fixed income
Key contributors to all portfolios over the quarter
• Australian shares
• Global shares (unhedged)
• Fixed income
Key contributors to all portfolios over the year
4. C. MLC INDEX PLUS− Contributors to returns
31

32
4. D. ASSET CLASS FUNDS− Returns relative to benchmark
32
*
Performance to 31 March 2015 1 year 3 years 5 years 7 years 10 years% % pa % pa % pa % pa
MLC Australian Share Fund (before fees and tax) 15.8 15.8 8.0 6.2 8.3
Excess return (relative to S&P/ASX200 Accumulation Index(S&P/ASX300 prior to Sep 2012, S&P/ASX200 Index prior to Nov 2002))
1.6 0.2 -0.5 0.2 0.0
MLC Global Share Fund (before fees and tax) 27.2 22.8 14.3 7.8 7.2
Excess return (relative to MSCI All Country World Index (MSCI World Index prior to July 2002))
-1.4 -1.4 0.6 0.0 0.1
MLC Hedged Global Share Fund (before fees and taxes) 14.3 16.6 13.8 7.5 8.7
Excess return (relative to MSCI All Country World Index Hedged(MSCI World Index Hedged prior to July 2002))
-2.2 -0.7 0.2 -1.0 -0.7
MLC Global Property Fund (before fees and taxes) 27.9 19.31 16.4 8.5 -
Excess return (relative to EPRA/NAREIT ($A Hedged) (UBS GlobalInvestors Index (hedged) prior to 1 Aug 2011))
0.8 0.2 -0.7 0.5 -
MLC Diversified Debt Fund (before fees and tax) 8.7 6.9 7.7 - -
Excess return (relative to 50% Bloomberg AusBond Composite 0+ Yr Index & 50% Barclays Capital Global Aggregate Bond Index (hedged))
-2.0 -0.4 -0.3 - -
Source: JANA Corporate Investment Services Limited

33
Client investment update presentation Presentation of fund performance, updated quarterly
Fund performance commentaries Client report on fund performance for the quarter and year, updated monthly available on Fund Profile Tool
Scenario insights and portfolio positioning
Quarterly update on our investment positions, detailed report for financial advisers and a summary report for clients
Strategy updates Outline of changes to our investment strategies, including client letters and other tools
Economic updates Monthly commentary on economic and market developments, available as video and client Q&A
Year in review Market update prepared for calendar and financial years for your clients
Investment insights and news Commentary on current events and investment issues for your clients
Manager insights Highlights of MLC’s investment managers’ insights on markets and their positions, updated quarterly
Stock stories Our managers outline their rationale for purchasing specific companies, updated quarterly
WHERE TO FIND CLIENT TOOLS5.
Go to the Adviser section of mlc.com.au, then go to Investments, Prices and performance and Investment news & insights