clics integrating data from campus sustainability … integrating data from campus sustainability...
TRANSCRIPT
Paper ID #12529
CLICS – Integrating Data from Campus Sustainability Projects across Disci-plines
Prof. Susan E. Powers, Clarkson University
Susan E. Powers is the Spence Professor of Sustainable Environmental Systems and the Associate Direc-tor of Sustainability in the Institute for a Sustainable Environment at Clarkson University. She receivedher Ph.D. in Environmental Engineering from the University of Michigan in 1992 and has had a varietyof academic appointments at Clarkson University ever since. Her research includes technical and envi-ronmental assessment of sustainability efforts and energy and climate education initiatives at middle, highschool and collegiate levels. In the wide range of classes that Dr. Powers has taught at middle schoolto graduate levels, she focuses on teaching the process of engineering problem solving in a real-worldenvironment. By focusing on complex and relevant environmental problems, the importance of soci-etal impacts and communication can be stressed as well as providing a basis and relevance for technicalmaterial needed to address the engineering problem
Dr. Jan DeWaters, Clarkson University
Jan DeWaters, PhD, PE is an Assistant Professor in the Wallace H. Coulter School of Engineering atClarkson University. She teaches introductory courses on energy issues and energy systems, and is part ofthe development team for Clarkson’s First Year Engineering/Interdisciplinary course, ”Engineering andSociety.” Her research interests are in the broad realm of STEM education and literacy.
Prof. Stefan J. Grimberg P.E., Clarkson UniversityProf. Daqing Hou, Clarkson University
Daqing Hou is Associate Professor in Dept. of Electrical and Computer Engineering at Clarkson Univer-sity, Potsdam, New York. His research interests include Software Engineering, Engineering Education,and Energy Efficiency and Conservation.
Dr. Mary Margaret Monica Small, Clarkson University
Dr. Small is currently the Director of Educational Partnerships at Clarkson University’s Shipley Center forInnovation. She has served as the external evaluator on this project as well as several other NASA and NSFfunded projects. Dr. Small joined Clarkson’s Office of Educational Partnerships in 2006 as CurriculumCoordinator. A career educator, she has been a public school teacher, building principal and central officeadministrator. Dr. Small has also taught organizational leadership and curriculum and assessment coursesat the graduate level.
c©American Society for Engineering Education, 2015
Page 26.351.1
CLICS – Integrating Data from Campus Sustainability Projects across Disciplines
Introduction Field experiences, inquiry through data acquisition and analysis, and communication of findings to external audiences – are all pedagogical practices that help to engage our students with the ill-posed problems they will face as STEM professionals. But how often do we consider using our own campus communities as relevant, experiential learning sites to integrate these practices to motivate students and help them excel? Unfortunately not very often, in part due to the barriers with access to information and real data from our campus operations. Through the project described here, we developed a framework to organize and present data to faculty and students in a way that overcomes many of the hurdles of using campus infrastructure in the classroom. The broad goal of this endeavor is to engage undergraduate students and excel their 21st Century Skills1 through the implementation of relevant project-based experiential learning sites in a variety of classrooms. The 21st century skills include: increased understanding of core STEM content; increased competency with critical thinking skills (systems thinking, problem solving, self-confidence using real world data); and, increased competency with technology skills.1 CLICS (cyber-learning infrastructure for campus sustainability) is a cyber-learning tool developed to integrate data from campus sustainability projects into a form that can be used in a wide variety of classes for relevant, experiential learning opportunities. The broad goal of this endeavor is to engage undergraduate students in order for them to excel their competencies with 21st Century skills. NSF TUES funding was used to develop CLICS’ computational and educational framework, pilot the methods at Clarkson University and assess its impact on students. CLICS has been developed with data specific to Clarkson’s integrated greenhouse and digester project (described below). This data-rich infrastructure provides a wealth of opportunities for understanding and evaluating engineered systems from diverse disciplines and perspectives. Formative assessment of the pilot and initial testing of CLICS during the F13 and S14 semesters led to significant improvements in the computer interface that is used to access and interpret data from these systems with further classroom testing in the Fall 2014 semester. The expected outcomes from this project include: 1. The development and successful piloting of CLICS, which enables easy integration of data
from a variety of campus sites and access to the data by faculty and students. 2. Preliminary evidence that the approach engages students and helps them excel in the skills
required as a successful STEM professional. Use of the cyber-learning interface in classroom demonstrates benefits related to: • Students’ improved 21st century skills • Increased awareness of contemporary issues provided by the experiential learning site P
age 26.351.2
• Increased student engagement in STEM, as evidenced by an increased rate of student interaction with course material and students’ willingness to participate in future courses that offer similar projects.
Rationale The United States’ global competitiveness and the future of innovation in this country depend on the strength of its workforce and the workforce of the future. Numerous reports generated by the government and the private business sector have articulated the essential skills needed by today’s workers and those of the next generation.1- 5 Since the Commission on Achieving Necessary Skills (SCANS) Report6 in the early 1990s, there has been overwhelming consensus that these essential skills can be categorized into three broad areas: Information and Communication, Thinking and Problem Solving, and Interpersonal and Self-directional.4 For example, thinking and problem solving skills require workers to use critical and systems thinking to understand and make complex choices based on the interconnectedness among systems. These workers will also be required to identify problems, formulate solutions, implement new ideas and communicate in a responsive manner to those with diverse perspectives. Federal Reserve Board Chairman Alan Greenspan noted that “Workers must be equipped not simply with the technical know-how but also with the ability to create, analyze, and transform information and to interact effectively with others.”7 To prepare the workforce of tomorrow, today’s learning environment must be enhanced so that students can take what they learned in school and apply it to their profession. Research indicates that students are more successful at doing this when instruction models the process by using real world contexts8,9 as well as engaging pedagogies such as project-based and cooperative learning.4 Two NRC workshops on promising practices in undergraduate STEM education held in 2008 and summarized in a 2011 report10 identified cross-disciplinary educational goals such as problem-solving, communication, and critical thinking that are equal in importance with goals regarding content knowledge and skills. Strategies identified to meet these goals that align with the current project include the following transformative teaching practices: allowing students to “do” science, such as learning in labs and problem solving; providing structured group learning experiences; using computer technology applications; and promoting active, engaged learning.
The objective of this paper is to share the general CLICS framework and its successes in order to generate interest in replicating this type of experience at other institutions with their own campus sustainability data. The paper describes the infrastructure included within the CLICS system, how it has been used in classrooms and the results of our assessment and evaluation of the project for meeting the expected education objectives. Greenhouse – Digester System Over the past five years, an integrated food-waste management system has been developed on Clarkson University’s campus as a research and teaching tool that simultaneously meets some of the campus’ sustainability goals. Details of the infrastructure and use of the system for student research and design classes were previously presented at ASEE11 and are summarized here. The P
age 26.351.3
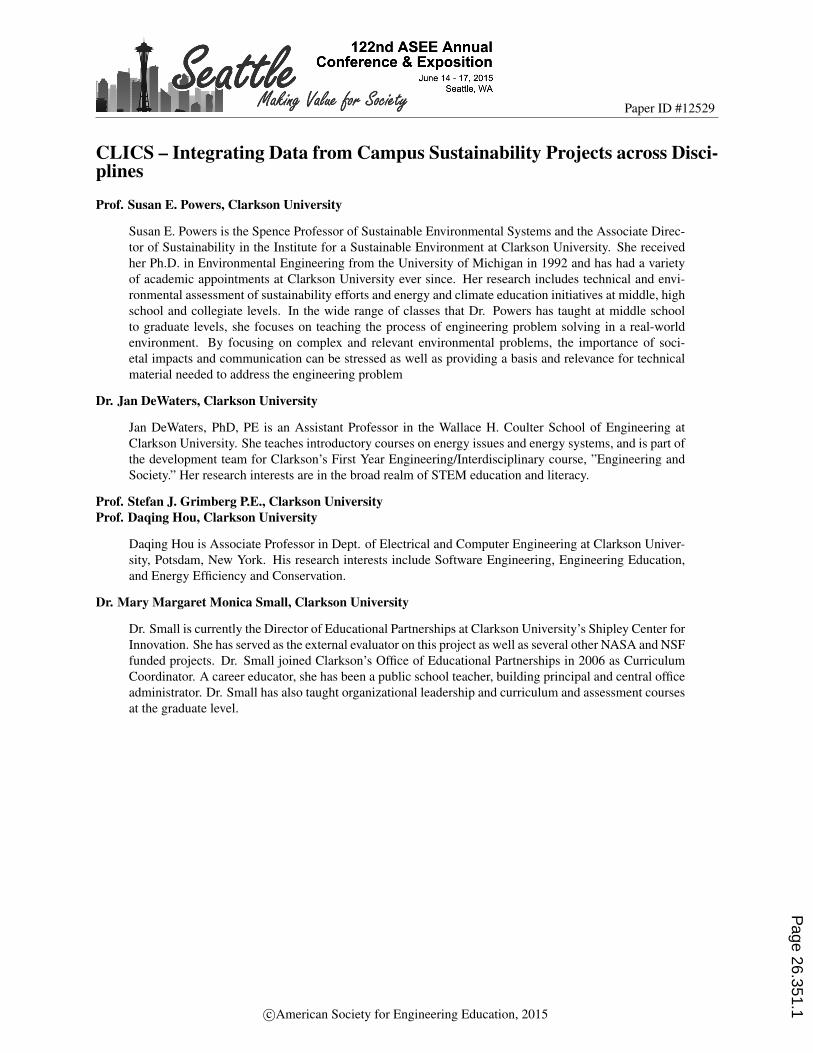
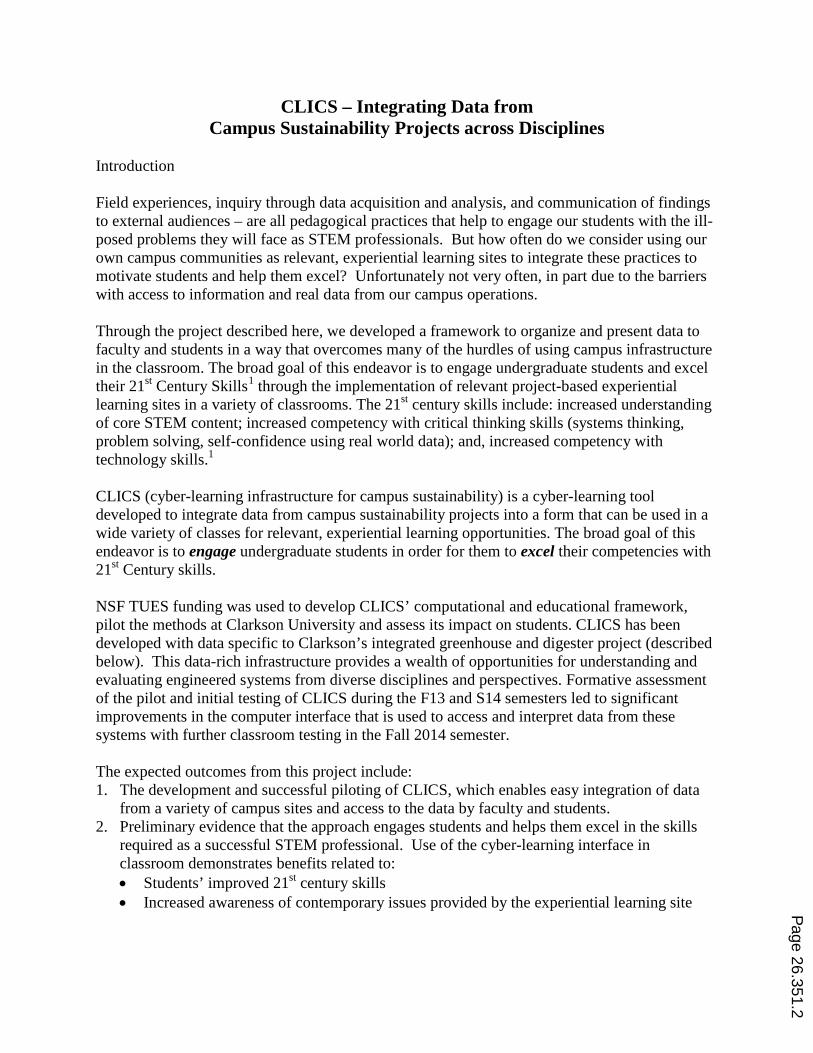
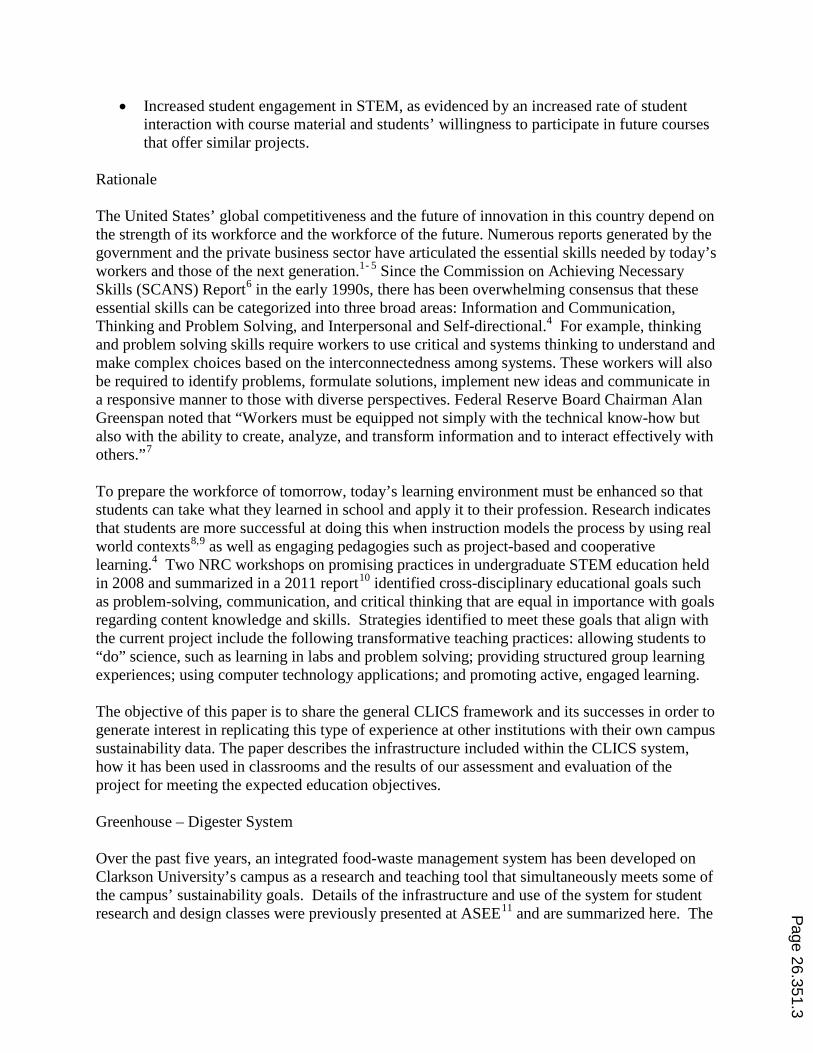
integrated system is illustrated in Figure 1. The cycling of material and heat flows follows the “no waste” tenets of green engineering and industrial ecology. The greenhouse serves as a model for a controlled environment high-rise farm (CEHRF), where plants are grown in vertically stacked aeroponic growing units in a climate-controlled space. The 650 sq. ft. pilot greenhouse (GH) utilizes innovative technologies and control systems for the year-round production of leafy green vegetables, herbs and tomatoes. The state-of-art aeroponic growing system (Figure 2) uses only a small fraction of the water and nutrient inputs required by traditional greenhouse growing operations. Because northern climates do not provide sufficient light for plant growth, artificial lighting is also needed. We use high efficiency LED lights that make the rooms glow pink (Figure 2). Plants reflect green light, but they absorb light in the red and blue wavelengths of the visible spectrum. Thus, we can reduce energy use by only providing the light spectra that the plants need. The lighting system is also made more efficient by only providing the light intensity and duration the plants need. Light is measured as the photosynthetic photon flux density (PPFD) to monitor daylight and a control system are used to turn light strips on and off so only enough lights are turned on to meet plant requirements. The anaerobic digester employs a biological process to convert (potentially) 300 kg (650 lb) of campus’ food waste (FW) each day into biogas, which is then used to produce electric power (20 kW capacity) and heat energy that is used in the system. The digester also provides nutrient-rich fertilizer that could be treated for use in the greenhouse to support plant growth. Projects are on-going to develop suitable treatment options to remove solids and oxidize nitrogen to nitrate. Figure 3 shows the trailer-housed digester system. The digester system consists of a grinder, ribbon blender and three neoprene-insulated 5-m3 reactors that can be operated in series,
Figure 1. Schematic of the closed-loop cycling of many energy and material flows through the integrated greenhouse-digester system.
Figure 2: Greenhouse system includes the aeroponic box with sprayers that provide nutrient solution as a fine mist intermittently and LED lighting that is controlled based on time and need.
Page 26.351.4
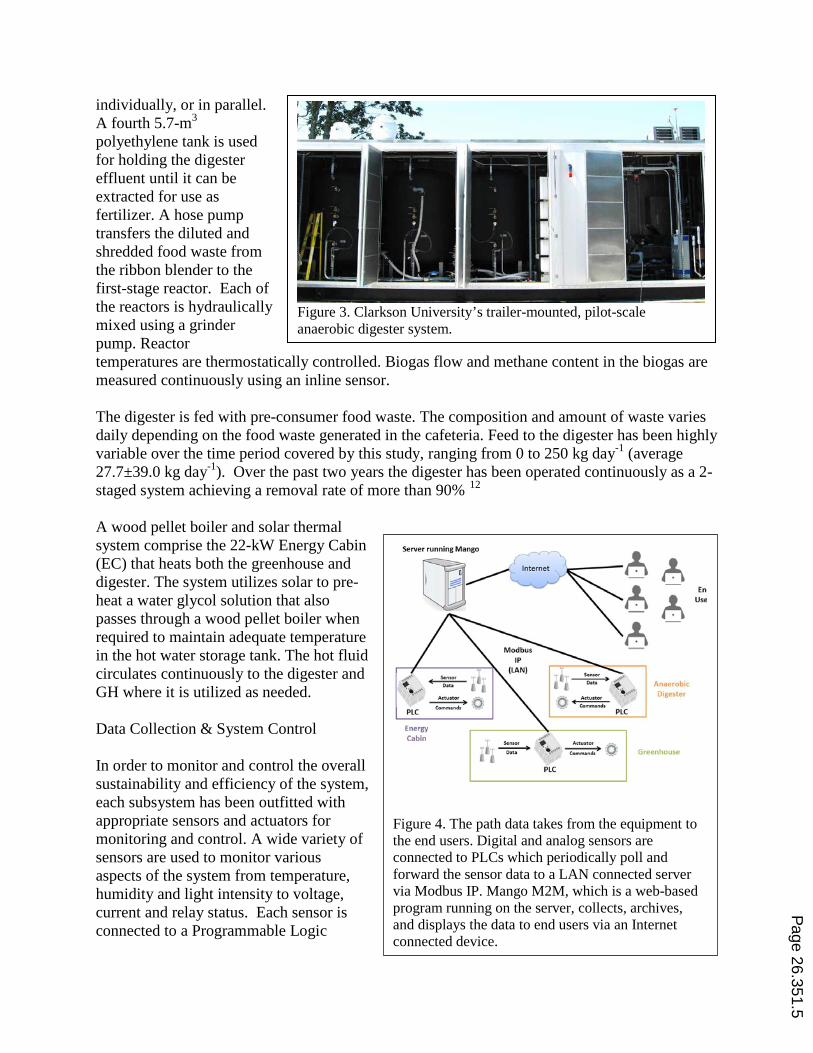
Figure 3. Clarkson University’s trailer-mounted, pilot-scale anaerobic digester system.
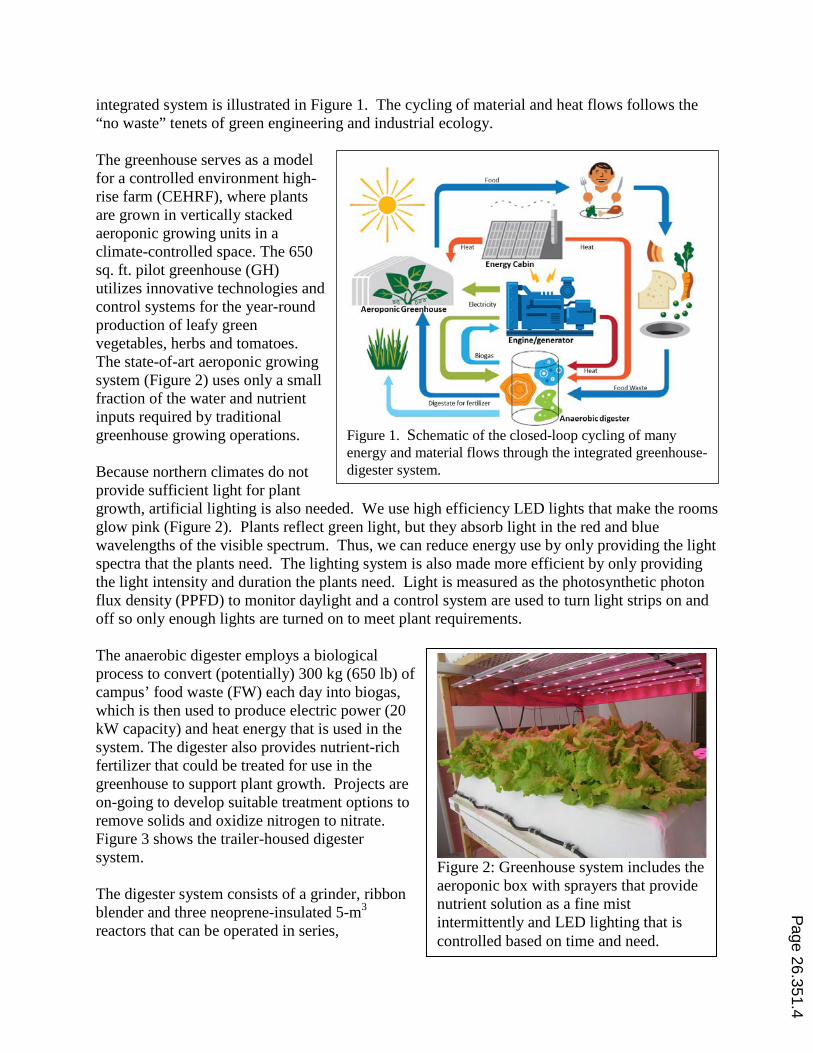
individually, or in parallel. A fourth 5.7-m3 polyethylene tank is used for holding the digester effluent until it can be extracted for use as fertilizer. A hose pump transfers the diluted and shredded food waste from the ribbon blender to the first-stage reactor. Each of the reactors is hydraulically mixed using a grinder pump. Reactor temperatures are thermostatically controlled. Biogas flow and methane content in the biogas are measured continuously using an inline sensor. The digester is fed with pre-consumer food waste. The composition and amount of waste varies daily depending on the food waste generated in the cafeteria. Feed to the digester has been highly variable over the time period covered by this study, ranging from 0 to 250 kg day-1 (average 27.7±39.0 kg day-1). Over the past two years the digester has been operated continuously as a 2-staged system achieving a removal rate of more than 90% 12 A wood pellet boiler and solar thermal system comprise the 22-kW Energy Cabin (EC) that heats both the greenhouse and digester. The system utilizes solar to pre-heat a water glycol solution that also passes through a wood pellet boiler when required to maintain adequate temperature in the hot water storage tank. The hot fluid circulates continuously to the digester and GH where it is utilized as needed. Data Collection & System Control In order to monitor and control the overall sustainability and efficiency of the system, each subsystem has been outfitted with appropriate sensors and actuators for monitoring and control. A wide variety of sensors are used to monitor various aspects of the system from temperature, humidity and light intensity to voltage, current and relay status. Each sensor is connected to a Programmable Logic
Figure 4. The path data takes from the equipment to the end users. Digital and analog sensors are connected to PLCs which periodically poll and forward the sensor data to a LAN connected server via Modbus IP. Mango M2M, which is a web-based program running on the server, collects, archives, and displays the data to end users via an Internet connected device.
Page 26.351.5
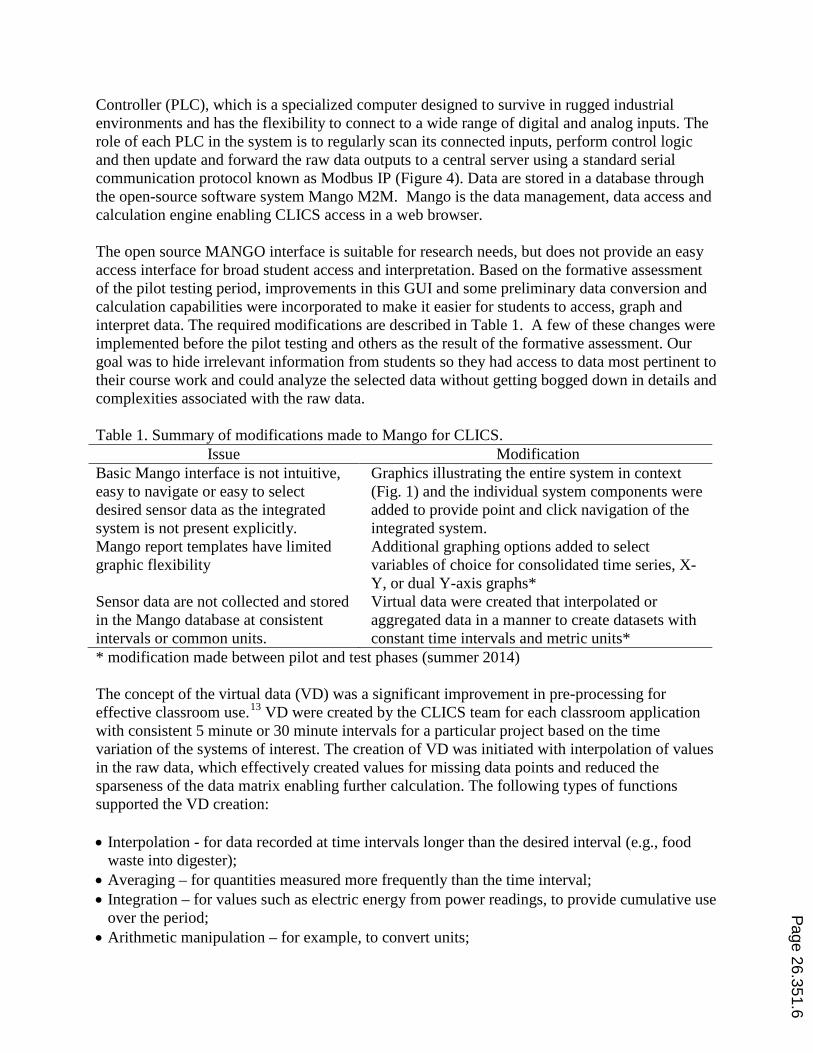
Controller (PLC), which is a specialized computer designed to survive in rugged industrial environments and has the flexibility to connect to a wide range of digital and analog inputs. The role of each PLC in the system is to regularly scan its connected inputs, perform control logic and then update and forward the raw data outputs to a central server using a standard serial communication protocol known as Modbus IP (Figure 4). Data are stored in a database through the open-source software system Mango M2M. Mango is the data management, data access and calculation engine enabling CLICS access in a web browser. The open source MANGO interface is suitable for research needs, but does not provide an easy access interface for broad student access and interpretation. Based on the formative assessment of the pilot testing period, improvements in this GUI and some preliminary data conversion and calculation capabilities were incorporated to make it easier for students to access, graph and interpret data. The required modifications are described in Table 1. A few of these changes were implemented before the pilot testing and others as the result of the formative assessment. Our goal was to hide irrelevant information from students so they had access to data most pertinent to their course work and could analyze the selected data without getting bogged down in details and complexities associated with the raw data. Table 1. Summary of modifications made to Mango for CLICS.
Issue Modification Basic Mango interface is not intuitive, easy to navigate or easy to select desired sensor data as the integrated system is not present explicitly.
Graphics illustrating the entire system in context (Fig. 1) and the individual system components were added to provide point and click navigation of the integrated system.
Mango report templates have limited graphic flexibility
Additional graphing options added to select variables of choice for consolidated time series, X-Y, or dual Y-axis graphs*
Sensor data are not collected and stored in the Mango database at consistent intervals or common units.
Virtual data were created that interpolated or aggregated data in a manner to create datasets with constant time intervals and metric units*
* modification made between pilot and test phases (summer 2014) The concept of the virtual data (VD) was a significant improvement in pre-processing for effective classroom use.13 VD were created by the CLICS team for each classroom application with consistent 5 minute or 30 minute intervals for a particular project based on the time variation of the systems of interest. The creation of VD was initiated with interpolation of values in the raw data, which effectively created values for missing data points and reduced the sparseness of the data matrix enabling further calculation. The following types of functions supported the VD creation: • Interpolation - for data recorded at time intervals longer than the desired interval (e.g., food
waste into digester); • Averaging – for quantities measured more frequently than the time interval; • Integration – for values such as electric energy from power readings, to provide cumulative use
over the period; • Arithmetic manipulation – for example, to convert units;
Page 26.351.6
• Logical/piecewise expressions that treat different values in the raw data set differently. For example – errors in initial temperature readings were one order of magnitude high. If/then statements were used to divide T by 10 when T>100°C.
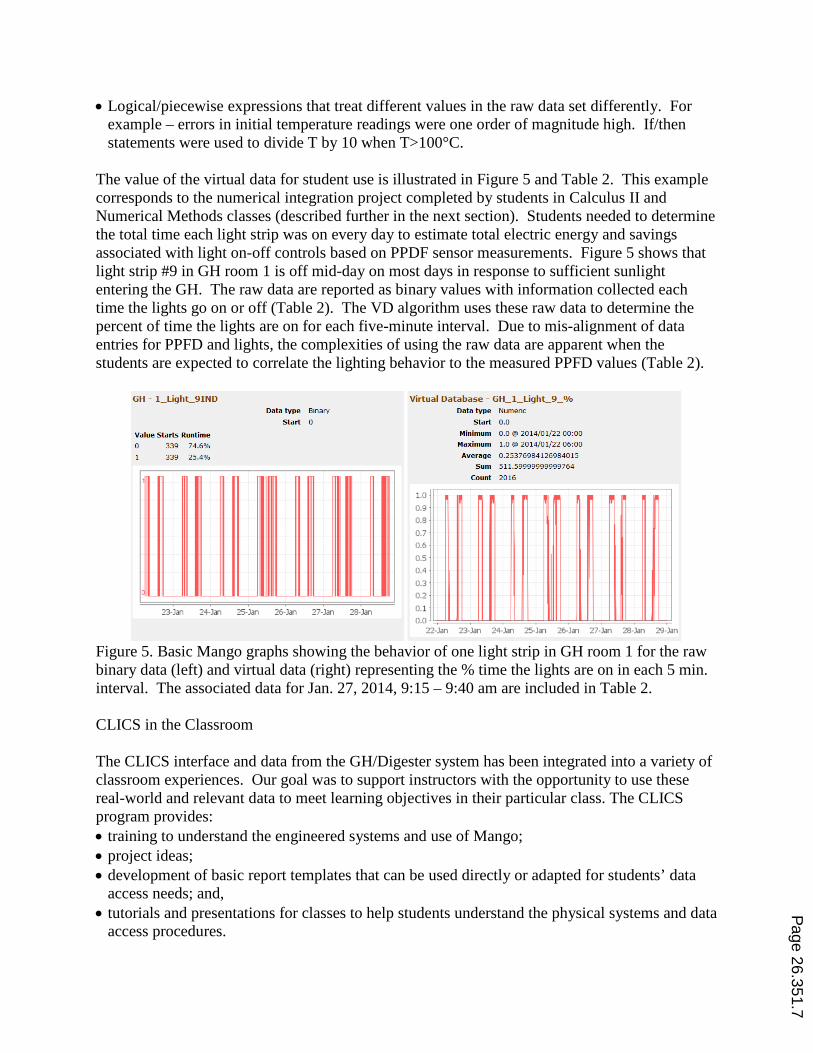
The value of the virtual data for student use is illustrated in Figure 5 and Table 2. This example corresponds to the numerical integration project completed by students in Calculus II and Numerical Methods classes (described further in the next section). Students needed to determine the total time each light strip was on every day to estimate total electric energy and savings associated with light on-off controls based on PPDF sensor measurements. Figure 5 shows that light strip #9 in GH room 1 is off mid-day on most days in response to sufficient sunlight entering the GH. The raw data are reported as binary values with information collected each time the lights go on or off (Table 2). The VD algorithm uses these raw data to determine the percent of time the lights are on for each five-minute interval. Due to mis-alignment of data entries for PPFD and lights, the complexities of using the raw data are apparent when the students are expected to correlate the lighting behavior to the measured PPFD values (Table 2).
Figure 5. Basic Mango graphs showing the behavior of one light strip in GH room 1 for the raw binary data (left) and virtual data (right) representing the % time the lights are on in each 5 min. interval. The associated data for Jan. 27, 2014, 9:15 – 9:40 am are included in Table 2. CLICS in the Classroom The CLICS interface and data from the GH/Digester system has been integrated into a variety of classroom experiences. Our goal was to support instructors with the opportunity to use these real-world and relevant data to meet learning objectives in their particular class. The CLICS program provides: • training to understand the engineered systems and use of Mango; • project ideas; • development of basic report templates that can be used directly or adapted for students’ data
access needs; and, • tutorials and presentations for classes to help students understand the physical systems and data
access procedures.
Page 26.351.7

Table 2. Data indicating status of lights (on or off) and photosynthetic photon flux density (PPFD) (umol/m2/s) in the raw data (left) and simpler (though approximate) virtual data at 5 minute intervals (right) (January 27, 2014)
Raw Data Virtual Data Time Light_9 PPFD Time Light9_% on PPFD
9:15:00 9:15:00 1.00 133.71 9:16:05 133.89 9:20:00 0.93 138.97 9:18:05 138.71 9:25:00 1.00 161.27 9:19:39 FALSE 9:30:00 0.37 166.70 9:19:49 TRUE 9:35:00 0.30 286.54 9:20:05 122.39 9:40:00 0.00 425.13 9:20:39 FALSE 9:20:49 TRUE 9:22:05 152.32 9:24:05 157.06 9:26:05 161.63 9:27:49 FALSE 9:28:05 161.78 9:30:05 152.13
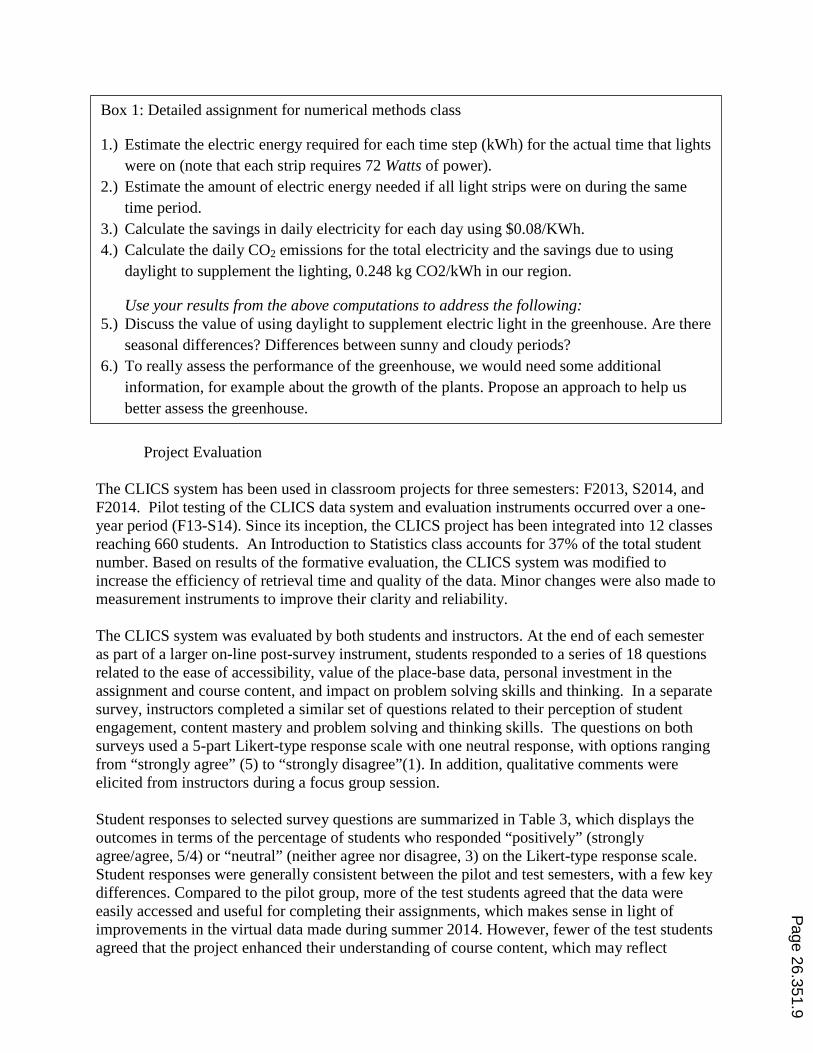
Ideally, CLICS is used by instructors in a range of disciplines for extended homework, laboratory experiences or projects. It is expected that these experiences require 21st century skills to complete rather than simple plug and chug applications. It is the higher-order critical thinking skills that are expected to be enhanced from using relevant, real-world data. In the Fall 2014 semester, several classes considered the use of LED lighting and daylighting controls to provide sufficient lighting in the GH while minimizing electric energy required to keep all lights on for 12 hours per day. The specific projects were pre-defined by the instructor. For example, the Numerical Methods class use the VD presented above for the light system (Figure 5). Students were provided with a lecture on the purpose and use of the greenhouse system, operation and control of the lighting system, an opportunity to tour the facility, and access to the Mango interface. The questions included in Box 1 provide the specific assignment for students in this class. A few other classes have required the students to select a specific question that can be evaluated and answered by the students. Managing this approach has been more difficult due to the limited understanding by the students in the class of the complexities of the physical systems and vast quantities of data available. Assessing the Value of CLICS The assessment plan for this project focuses on evaluating the feasibility and effectiveness of integrating place-based or real world data into course assignments by measuring three fundamental aspects: the accessibility and quality of the data; the impact of the project on participating students’ sustainability literacy, personal competencies and attributes, including critical thinking skills; and the students’ and instructors’ perceived value of the experience. The approach is quasi-experimental, using a combination of quantitative and qualitative methodologies.
Page 26.351.8
Project Evaluation
The CLICS system has been used in classroom projects for three semesters: F2013, S2014, and F2014. Pilot testing of the CLICS data system and evaluation instruments occurred over a one-year period (F13-S14). Since its inception, the CLICS project has been integrated into 12 classes reaching 660 students. An Introduction to Statistics class accounts for 37% of the total student number. Based on results of the formative evaluation, the CLICS system was modified to increase the efficiency of retrieval time and quality of the data. Minor changes were also made to measurement instruments to improve their clarity and reliability. The CLICS system was evaluated by both students and instructors. At the end of each semester as part of a larger on-line post-survey instrument, students responded to a series of 18 questions related to the ease of accessibility, value of the place-base data, personal investment in the assignment and course content, and impact on problem solving skills and thinking. In a separate survey, instructors completed a similar set of questions related to their perception of student engagement, content mastery and problem solving and thinking skills. The questions on both surveys used a 5-part Likert-type response scale with one neutral response, with options ranging from “strongly agree” (5) to “strongly disagree”(1). In addition, qualitative comments were elicited from instructors during a focus group session. Student responses to selected survey questions are summarized in Table 3, which displays the outcomes in terms of the percentage of students who responded “positively” (strongly agree/agree, 5/4) or “neutral” (neither agree nor disagree, 3) on the Likert-type response scale. Student responses were generally consistent between the pilot and test semesters, with a few key differences. Compared to the pilot group, more of the test students agreed that the data were easily accessed and useful for completing their assignments, which makes sense in light of improvements in the virtual data made during summer 2014. However, fewer of the test students agreed that the project enhanced their understanding of course content, which may reflect
Box 1: Detailed assignment for numerical methods class
1.) Estimate the electric energy required for each time step (kWh) for the actual time that lights were on (note that each strip requires 72 Watts of power).
2.) Estimate the amount of electric energy needed if all light strips were on during the same time period.
3.) Calculate the savings in daily electricity for each day using $0.08/KWh. 4.) Calculate the daily CO2 emissions for the total electricity and the savings due to using
daylight to supplement the lighting, 0.248 kg CO2/kWh in our region.
Use your results from the above computations to address the following: 5.) Discuss the value of using daylight to supplement electric light in the greenhouse. Are there
seasonal differences? Differences between sunny and cloudy periods? 6.) To really assess the performance of the greenhouse, we would need some additional
information, for example about the growth of the plants. Propose an approach to help us better assess the greenhouse.
Page 26.351.9
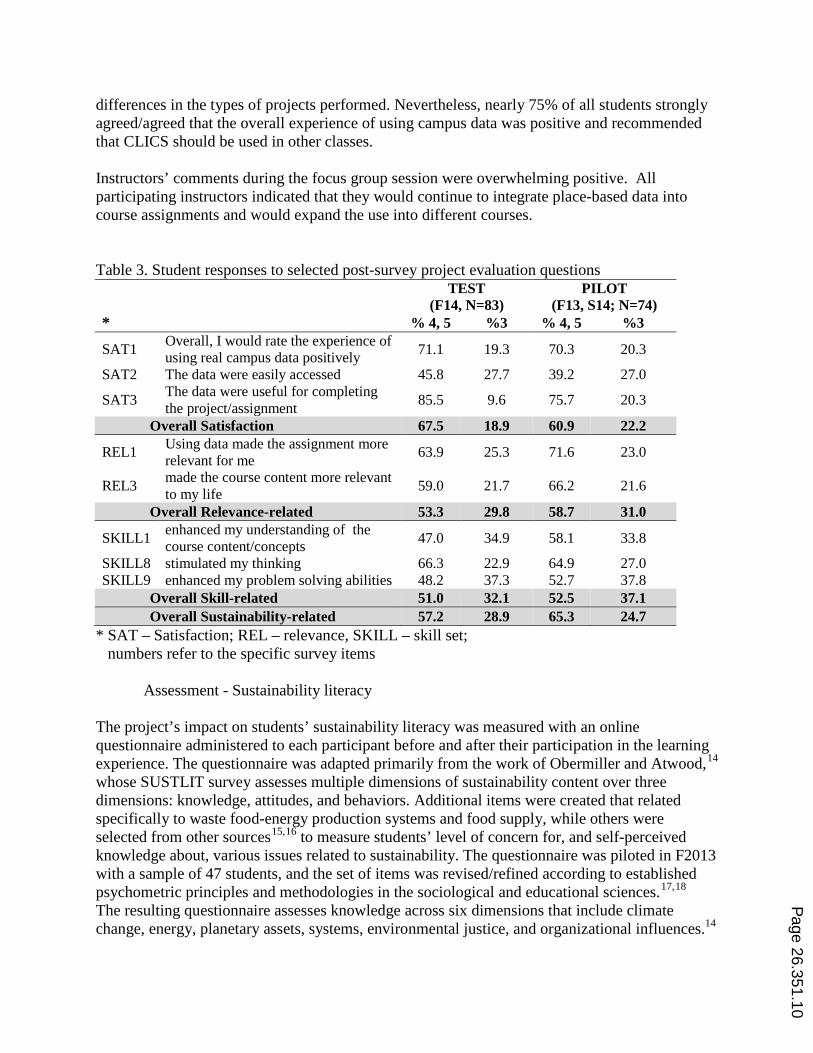
differences in the types of projects performed. Nevertheless, nearly 75% of all students strongly agreed/agreed that the overall experience of using campus data was positive and recommended that CLICS should be used in other classes. Instructors’ comments during the focus group session were overwhelming positive. All participating instructors indicated that they would continue to integrate place-based data into course assignments and would expand the use into different courses. Table 3. Student responses to selected post-survey project evaluation questions
TEST
(F14, N=83) PILOT
(F13, S14; N=74) * % 4, 5 %3 % 4, 5 %3 SAT1 Overall, I would rate the experience of
using real campus data positively 71.1 19.3 70.3 20.3 SAT2 The data were easily accessed 45.8 27.7 39.2 27.0 SAT3 The data were useful for completing
the project/assignment 85.5 9.6 75.7 20.3 Overall Satisfaction 67.5 18.9 60.9 22.2
REL1 Using data made the assignment more relevant for me 63.9 25.3 71.6 23.0
REL3 made the course content more relevant to my life 59.0 21.7 66.2 21.6
Overall Relevance-related 53.3 29.8 58.7 31.0 SKILL1 enhanced my understanding of the
course content/concepts 47.0 34.9 58.1 33.8 SKILL8 stimulated my thinking 66.3 22.9 64.9 27.0 SKILL9 enhanced my problem solving abilities 48.2 37.3 52.7 37.8
Overall Skill-related 51.0 32.1 52.5 37.1 Overall Sustainability-related 57.2 28.9 65.3 24.7
* SAT – Satisfaction; REL – relevance, SKILL – skill set; numbers refer to the specific survey items
Assessment - Sustainability literacy The project’s impact on students’ sustainability literacy was measured with an online questionnaire administered to each participant before and after their participation in the learning experience. The questionnaire was adapted primarily from the work of Obermiller and Atwood,14 whose SUSTLIT survey assesses multiple dimensions of sustainability content over three dimensions: knowledge, attitudes, and behaviors. Additional items were created that related specifically to waste food-energy production systems and food supply, while others were selected from other sources15,16 to measure students’ level of concern for, and self-perceived knowledge about, various issues related to sustainability. The questionnaire was piloted in F2013 with a sample of 47 students, and the set of items was revised/refined according to established psychometric principles and methodologies in the sociological and educational sciences.17,18 The resulting questionnaire assesses knowledge across six dimensions that include climate change, energy, planetary assets, systems, environmental justice, and organizational influences.14
Page 26.351.10
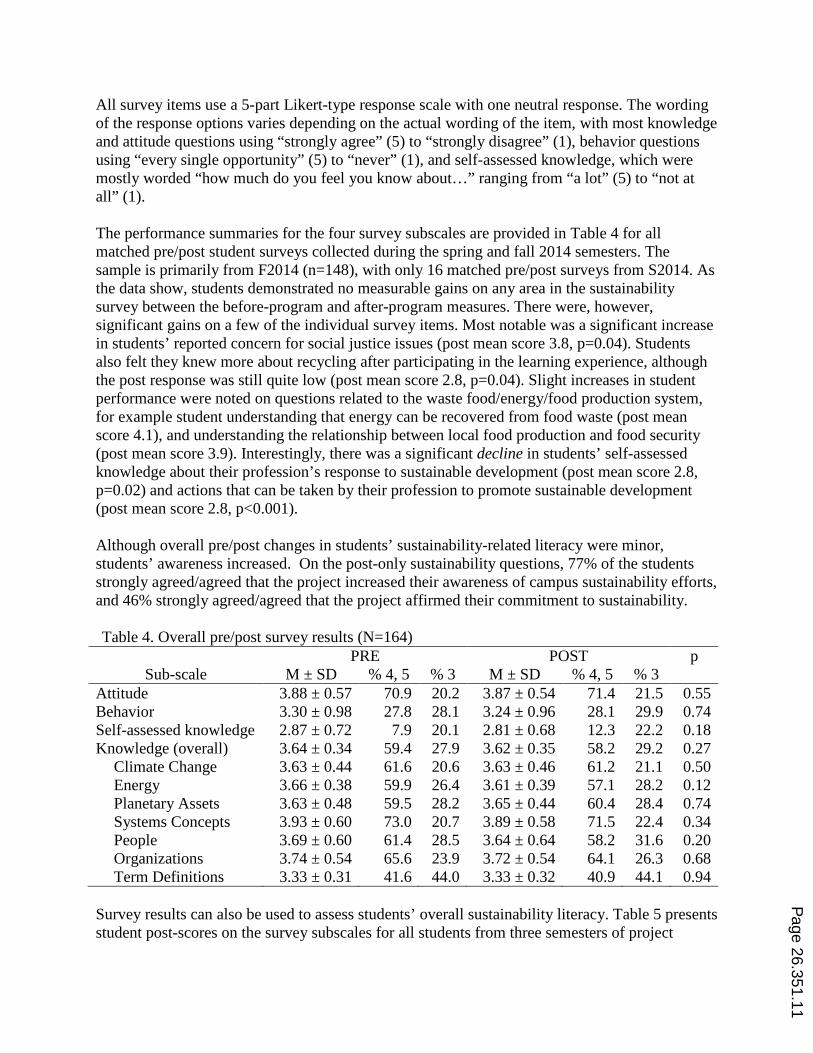
All survey items use a 5-part Likert-type response scale with one neutral response. The wording of the response options varies depending on the actual wording of the item, with most knowledge and attitude questions using “strongly agree” (5) to “strongly disagree” (1), behavior questions using “every single opportunity” (5) to “never” (1), and self-assessed knowledge, which were mostly worded “how much do you feel you know about…” ranging from “a lot” (5) to “not at all” (1). The performance summaries for the four survey subscales are provided in Table 4 for all matched pre/post student surveys collected during the spring and fall 2014 semesters. The sample is primarily from F2014 (n=148), with only 16 matched pre/post surveys from S2014. As the data show, students demonstrated no measurable gains on any area in the sustainability survey between the before-program and after-program measures. There were, however, significant gains on a few of the individual survey items. Most notable was a significant increase in students’ reported concern for social justice issues (post mean score 3.8, p=0.04). Students also felt they knew more about recycling after participating in the learning experience, although the post response was still quite low (post mean score 2.8, p=0.04). Slight increases in student performance were noted on questions related to the waste food/energy/food production system, for example student understanding that energy can be recovered from food waste (post mean score 4.1), and understanding the relationship between local food production and food security (post mean score 3.9). Interestingly, there was a significant decline in students’ self-assessed knowledge about their profession’s response to sustainable development (post mean score 2.8, p=0.02) and actions that can be taken by their profession to promote sustainable development (post mean score 2.8, p<0.001). Although overall pre/post changes in students’ sustainability-related literacy were minor, students’ awareness increased. On the post-only sustainability questions, 77% of the students strongly agreed/agreed that the project increased their awareness of campus sustainability efforts, and 46% strongly agreed/agreed that the project affirmed their commitment to sustainability. Table 4. Overall pre/post survey results (N=164)
PRE POST p
Sub-scale M ± SD % 4, 5 % 3 M ± SD % 4, 5 % 3 Attitude 3.88 ± 0.57 70.9 20.2 3.87 ± 0.54 71.4 21.5 0.55 Behavior 3.30 ± 0.98 27.8 28.1 3.24 ± 0.96 28.1 29.9 0.74 Self-assessed knowledge 2.87 ± 0.72 7.9 20.1 2.81 ± 0.68 12.3 22.2 0.18 Knowledge (overall) 3.64 ± 0.34 59.4 27.9 3.62 ± 0.35 58.2 29.2 0.27
Climate Change 3.63 ± 0.44 61.6 20.6 3.63 ± 0.46 61.2 21.1 0.50 Energy 3.66 ± 0.38 59.9 26.4 3.61 ± 0.39 57.1 28.2 0.12 Planetary Assets 3.63 ± 0.48 59.5 28.2 3.65 ± 0.44 60.4 28.4 0.74 Systems Concepts 3.93 ± 0.60 73.0 20.7 3.89 ± 0.58 71.5 22.4 0.34 People 3.69 ± 0.60 61.4 28.5 3.64 ± 0.64 58.2 31.6 0.20 Organizations 3.74 ± 0.54 65.6 23.9 3.72 ± 0.54 64.1 26.3 0.68 Term Definitions 3.33 ± 0.31 41.6 44.0 3.33 ± 0.32 40.9 44.1 0.94
Survey results can also be used to assess students’ overall sustainability literacy. Table 5 presents student post-scores on the survey subscales for all students from three semesters of project
Page 26.351.11
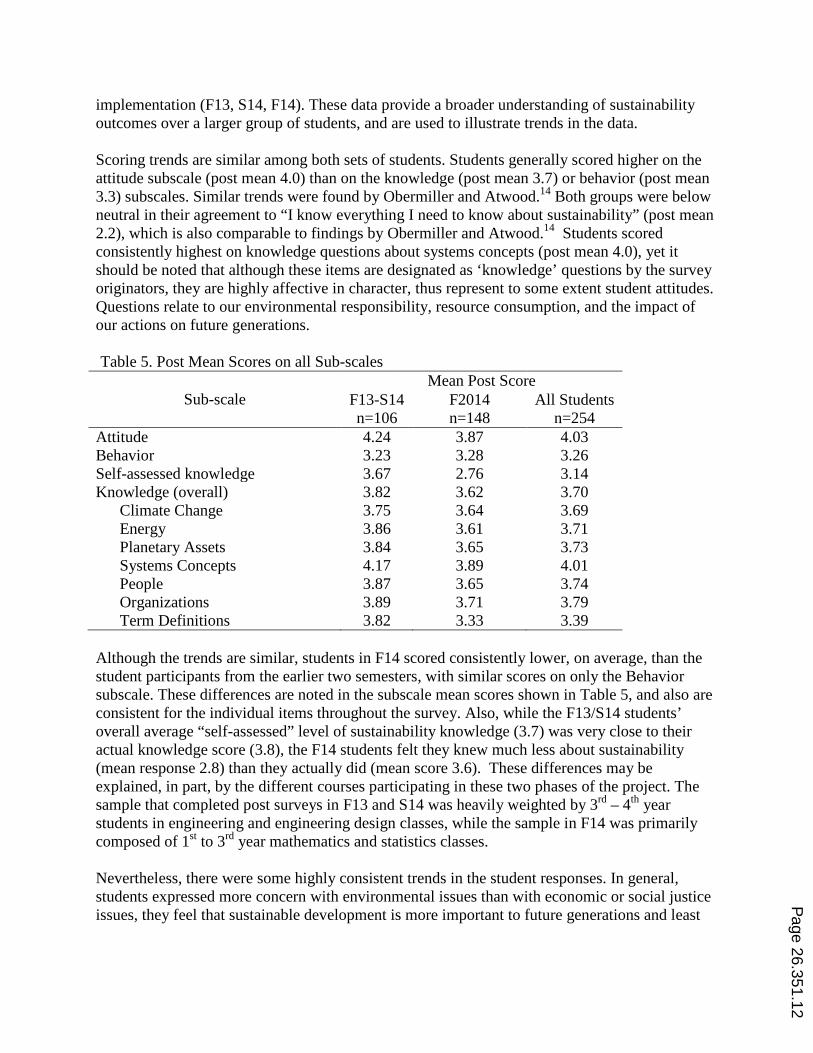
implementation (F13, S14, F14). These data provide a broader understanding of sustainability outcomes over a larger group of students, and are used to illustrate trends in the data. Scoring trends are similar among both sets of students. Students generally scored higher on the attitude subscale (post mean 4.0) than on the knowledge (post mean 3.7) or behavior (post mean 3.3) subscales. Similar trends were found by Obermiller and Atwood.14 Both groups were below neutral in their agreement to “I know everything I need to know about sustainability” (post mean 2.2), which is also comparable to findings by Obermiller and Atwood.14 Students scored consistently highest on knowledge questions about systems concepts (post mean 4.0), yet it should be noted that although these items are designated as ‘knowledge’ questions by the survey originators, they are highly affective in character, thus represent to some extent student attitudes. Questions relate to our environmental responsibility, resource consumption, and the impact of our actions on future generations. Table 5. Post Mean Scores on all Sub-scales
Sub-scale Mean Post Score
F13-S14 n=106
F2014 n=148
All Students n=254
Attitude 4.24 3.87 4.03 Behavior 3.23 3.28 3.26 Self-assessed knowledge 3.67 2.76 3.14 Knowledge (overall) 3.82 3.62 3.70
Climate Change 3.75 3.64 3.69 Energy 3.86 3.61 3.71 Planetary Assets 3.84 3.65 3.73 Systems Concepts 4.17 3.89 4.01 People 3.87 3.65 3.74 Organizations 3.89 3.71 3.79 Term Definitions 3.82 3.33 3.39
Although the trends are similar, students in F14 scored consistently lower, on average, than the student participants from the earlier two semesters, with similar scores on only the Behavior subscale. These differences are noted in the subscale mean scores shown in Table 5, and also are consistent for the individual items throughout the survey. Also, while the F13/S14 students’ overall average “self-assessed” level of sustainability knowledge (3.7) was very close to their actual knowledge score (3.8), the F14 students felt they knew much less about sustainability (mean response 2.8) than they actually did (mean score 3.6). These differences may be explained, in part, by the different courses participating in these two phases of the project. The sample that completed post surveys in F13 and S14 was heavily weighted by 3rd – 4th year students in engineering and engineering design classes, while the sample in F14 was primarily composed of 1st to 3rd year mathematics and statistics classes. Nevertheless, there were some highly consistent trends in the student responses. In general, students expressed more concern with environmental issues than with economic or social justice issues, they feel that sustainable development is more important to future generations and least
Page 26.351.12
important to them personally, and recycling/reusing is important to them. In fact the most frequent sustainable behavior noted was recycling waste. Within the knowledge subscale for the group overall, 14 questions received a mean score greater than 4.0 (considered ‘correct’) and only five were below 3.0 (considered ‘incorrect). The following questions received the three highest scores:
o What we do today affects the lifestyles of future generations. (91% correct) o Even when using renewable energy resources, it is important to improve the efficiency of
our energy use. (89% correct) o Coal is considered a ‘renewable’ energy resource (negatively scored). (87% correct)
Only five questions received a mean score below 3.0 (considered ‘incorrect’); following are the three lowest-scoring questions (note that all three are negatively scored):
o Atmospheric carbon dioxide concentrations have been steadily increasing over the past 100 years. (2% correct; 16% ‘I don’t know’)
o The major cause of coral bleaching – the death of coral reefs – is chemical spills in the ocean. (19% correct; 51% ‘I don’t know’)
o A business practices “triple bottom line” planning when it focuses on unit sales, dollar sales, and market share. (11% correct; 68% ‘I don’t know’)
Assessment - Critical Thinking
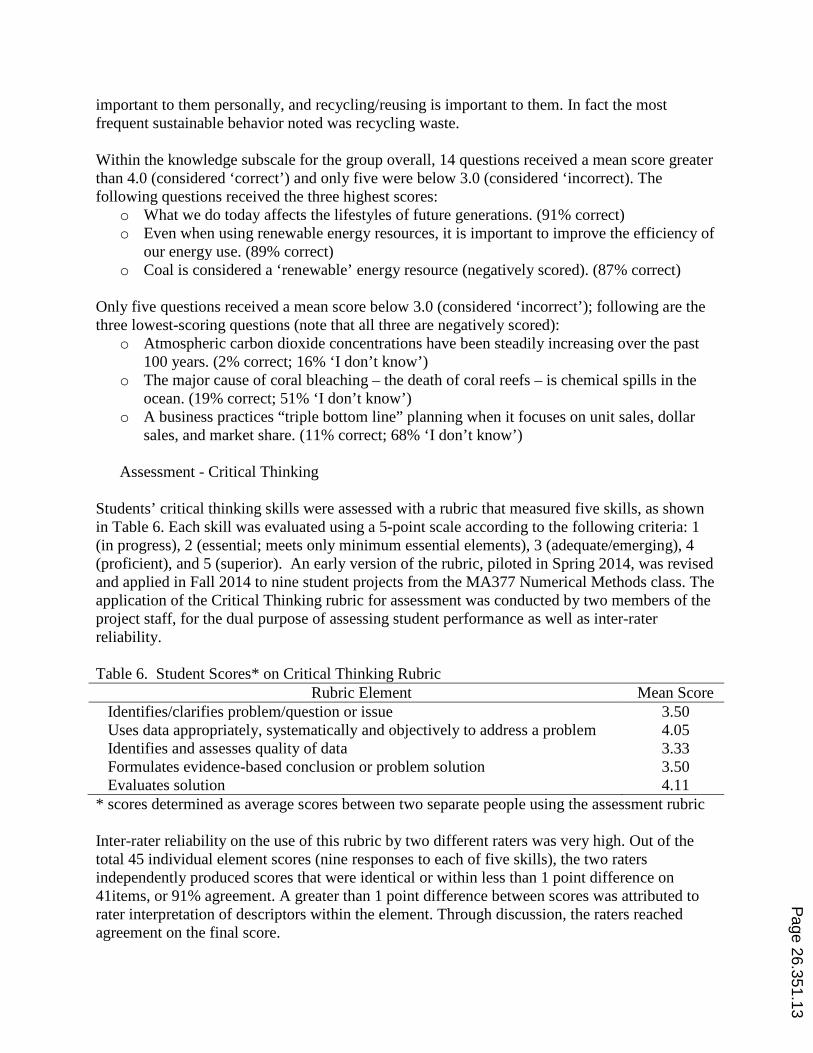
Students’ critical thinking skills were assessed with a rubric that measured five skills, as shown in Table 6. Each skill was evaluated using a 5-point scale according to the following criteria: 1 (in progress), 2 (essential; meets only minimum essential elements), 3 (adequate/emerging), 4 (proficient), and 5 (superior). An early version of the rubric, piloted in Spring 2014, was revised and applied in Fall 2014 to nine student projects from the MA377 Numerical Methods class. The application of the Critical Thinking rubric for assessment was conducted by two members of the project staff, for the dual purpose of assessing student performance as well as inter-rater reliability. Table 6. Student Scores* on Critical Thinking Rubric
Rubric Element Mean Score Identifies/clarifies problem/question or issue 3.50 Uses data appropriately, systematically and objectively to address a problem 4.05 Identifies and assesses quality of data 3.33 Formulates evidence-based conclusion or problem solution 3.50 Evaluates solution 4.11
* scores determined as average scores between two separate people using the assessment rubric Inter-rater reliability on the use of this rubric by two different raters was very high. Out of the total 45 individual element scores (nine responses to each of five skills), the two raters independently produced scores that were identical or within less than 1 point difference on 41items, or 91% agreement. A greater than 1 point difference between scores was attributed to rater interpretation of descriptors within the element. Through discussion, the raters reached agreement on the final score.
Page 26.351.13
Students could score a maximum of five points on each element, for a total maximum ‘critical thinking’ score of 25. Student scores ranged from 11 to 22.5, with overall mean and median scores of 22.5 and 21, respectively. Mean scores on each element ranged from 3.33 to 4.11, as shown in Table 6. These results are considered preliminary; further review of a larger number of completed works is on-going. Two of the rubric categories, Use of data to address a problem and Evaluates solution, were relative strengths for the students who were assessed, with mean scores in the Proficient sector (4.0 – 5.0). Student performance in the other elements fell within the Adequate sector (3.0 – 4.0). The results appear to indicate that, overall, students demonstrated satisfactory or above average complex thinking skills. It should be noted that 2 projects fell into the Essential sector with an overall mean score of 2.2. Given the small N, these low scores had a significant impact on the final means. Generally, students appear to possess complex thinking skills at an appropriate level to meet 21st century problem solving challenges. Discussion and Conclusions The CLICS cyber-learning tool to bring relevant real-world and place-based projects into a range of classrooms has been very well received by instructors and implemented in a range of classrooms. The impact on students and their response to the project has been variable. Overall, approximately 75% of the students ranked the project as a positive experience and recommend that CLICS be used in additional classes. While they valued the opportunity to use real-world data, the use of these data did not have an impact on their sustainability literacy. There are several variables that need to be investigated further. Most critically, the expectations within the project assignments for students to explore the nature of data collected and used for GH/digester operations, their interaction with the Mango interface and time and depth of the assignment varied substantially between projects. Analysis of pre-post differences within classes and the extent of these pre/post changes between classes should help to further define the specific types of classes and attributes of assignments that utilize CLICS most effectively. A long-term goal of this project is to develop and disseminate a process to support the implementation of this type of project for other sustainability systems and at other universities. The use of the open-source Mango M2M system will facilitate this transition. The addition of Mango modules to improve graphics and provide virtual data greatly reduced student frustration with the complex data structures and enabled them to focus more on the use of the data for interpretation and problem solving. These added modules can be made available to other users to reduce the time commitment for integrating a CLICs project for their own campus sustainability systems. P
age 26.351.14

References
1 Stuart, L., E. Dahm, 1999. 21st Century Skills for 21st Century Jobs. Federal Publications. Paper 151. <http://digitalcommons.ilr.cornell.edu/key_workplace/151> (accessed May 8, 2012).
2 The President’s Council of Advisors on Science and Technology (PCAST), 2012. Engage to Excel: Producing One Million Additional College Graduates with Degrees in Science, Technology, Engineering and Mathematics. <http://www.whitehouse.gov/sites/default/files/microsites/ostp/pcast-engage-to-excel-v11.pdf> (accessed 5/8/12).
3 The Information Technology Association of America (ITAA), 2000. Bridging the Gap: Information Technology Skills for a New Millennium, Ithaca NY: The Information Technology Association of America.
4 Partnership for 21st Century Skills. Learning for the 21st Century. <www.21stcenturyskills.org > (accessed 5/8/12).
5 21st Century Workforce Commission , U.S., 2000. "A Nation of Opportunity: Building America's 21st Century Workforce ". Federal Publications. Paper 21. <http://digitalcommons.ilr.cornell.edu/key_workplace/21>, (accessed May 8, 2012).
6 Secretary’s Commission on Achieving Necessary Skills (SCANS), 1991. What Work Requires of Schools. < <http://wdr.doleta.gov/SCANS/whatwork/whawork.html > (accessed 5/9/12)
7 Greenspan, A. 2000. “The Evolving Demand for Skills,” remarks to the U.S. Department of Labor National Skills Summit, April 11, 2000. <http://www.federalreserve.gov/boarddocs/speeches/2000/20000411.htm> (accessed 5/8/12).
8 Bransford, J.D, A.L. Brown, R.R. Cocking, (eds.) 2000. How People Learn: Brain, Mind, Experience, and School: Expanded Edition , Washington DC: The National Academies Press. <http://www.nap.edu/openbook.php?record_id=9853> (accessed 5/8/12)
9 McCain, T., 2005. Teaching for Tomorrow: Teaching Content and Problem-solving Skills. Thousand Oaks, CA: Corwin Press.
10 National Research Council, 2011. Promising Practices in Undergraduate Science, Technology, Engineering, and Mathematics Education: Summary of Two Workshops. Natalie Nielsen, Rapporteur. Planning Committee on Evidence on Selected Innovations in Undergraduate STEM Education. Board on Science Education, Division of Behavioral and Social Sciences and Education. Washington, DC: The National Academies Press. (http://www.nap.edu/catalog.php?record_id=13099) (accessed 5/10/12)
11 Powers, S.E., S.J. Grimberg, 2013. Cold-climate Greenhouse and Food Waste Digester Provide Education and Research Opportunities While Greening the Campus. In: Proceedings of the 120th Annual ASEE Conference & Exposition, Paper # 6151, Atlanta GA.
12 Grimberg, S.J., D. Hilderbrandt, M. Kinnunen, S .Rogers, 2015. Anaerobic digestion of Food Waste Through the Operation of a Mesophilic Two-Phase Pilot Scale Digester – Assessment of Variable Loadings on System Performance. J. Bioresource Technol., 178, 226-229. doi:10.1016/j.biortech.2014.09.001
13 Schultz, C., 2015. A Web-based Calculation Engine for Transforming Time Series Data. Master of Science Thesis, Department of Electrical and Computer Engineering, Potsdam NY: Clarkson University.
14 Obermiller, C., A. Atwood, 2014. Measuring Sustainability Literacy: Scale Development. Journal of Jesuit Business Education, 5(1): 105-128.
15 Horvath, N., M. Stewart, M. Shea, 2013. Toward instruments of assessing sustainability knowledge; Assessment development, process, and results from a pilot survey at the University of Maryland. Journal of Sustainability Education, 5: 27.
16 Azapagic, A., S. Perdan, D. Shallcross, 2005. How much do engineering students know about sustainable development ? The findings of an international survey and possible implications for the engineering curriculum. European Journal of Engineering Education, 30(1):1-19.
17 Benson, J., F. Clark, 1982. A guide for instrument development and validation. The American Journal of Occupational Therapy, 36(12): 789-800.
18 DeVellis, R.F., 2003. Scale development: Theory and applications (2nd ed.). Thousand Oaks, CA: Sage.
Page 26.351.15