click to edit master title style masterclass: data
TRANSCRIPT
Click to edit Master title style
1
Masterclass: Data Insights to drive your decisions and interventions
2:00pm – 3:30pm 3 December 2020
@SMCommission Social Mobility Commission @socialmobilitystories
#Socialmobility www.socialmobilityworks.org

Area Recommendation Current Status Next Steps Due
Date
DA
TA
ST
RA
TE
GY
Data foundations
Do you have D&I targets as a business?
Do you use national benchmarks?
Do you have socio-economic diversity targets?
Are you using the latest scorecard from the SMC to track your KPIs? (link)
Do you publish this data?
Do you connect with others in the sector to gain sector commitment to targets?
Data collection
Do you collect any form of D&I data?
Is this done through an annual survey?
Do you collect data at any other times of the year, or at employee points?
Do you collect socio-economic data at both the recruitment and existing employee
stages?
Do you use socio-economic questions recommended by SMC?
Are you aware of our latest guidance? (link)
Data communication
Do you make your employees aware of your socio-economic intentions?
Do you publicise this alongside your data collection survey?
Are people aware as to why you are asking the socio-economic questions that you are
asking?
Do you clearly communicate how the data will be used and stored?
Maximising response rate
Is management fully engaged with the data agenda?
Do you share with staff how questions are strategically connected and relevant?
Are diversity surveys mandatory? (always with the option ‘prefer not to say’)
Your data review and refine checklist (1/3)
www.socialmobilityworks.org 2
This document has been designed using the ideas that were generated in our masterclass. It will enable you to review and refine your data strategy and
focus on next steps. We would recommend that it be used alongside any internal documents you may have already in place.
Nothing/Not something you currently do
Do something in this space but limited
Actively do this

Area Recommendation Current
Influence their
Status
Next Steps Due
Date
PR
AC
TIC
AL E
LE
ME
NT
S
Analysis of results
Do you analyse socio-economic data at each grade level/job role (i.e. to assess
progression)?
Do you analyse socio-economic data against pay rewards and bonuses?
Do you analyse your training take up by socio-economic background?
Do you benchmark and contextualise against industry and national data?
Do you use data to inform change and evaluate progress?
Informing your inventions
Outreach
Do you collect and analyse outreach data to examine how participation converts to
desired outcomes, and how this varies between groups?
Do you use your outreach strategic plan to identify key impact metrics and measure
against these?
Recruitment
Do you compare applicant data with external benchmarks to assess how well they
reflect the eligible talent pool?
Do you monitor data during the application process to identify where diversity is low?
Do you evaluate the impact of various entry routes on SEB diversity?
Progression
Do you benchmark socio-economic background progression against time to progress
and job performance?
Do you consider intersectionality when measuring progression?
Do you assess outcomes on progression after apprenticeships are completed by
socio-economic background?
Your data review and refine checklist (2/3)
www.socialmobilityworks.org 3
This document has been designed using the ideas that were generated in our masterclass. It will enable you to review and refine your data strategy and
focus on next steps. We would recommend that it be used alongside any internal documents you may have already in place.
Nothing/Not something you currently do
Do something in this space but limited
Actively do this

Your data review and refine checklist (3/3)
www.socialmobilityworks.org 4
This document has been designed using the ideas that were generated in our collaborative workshop. It will enable you to review and refine your progression strategy and focus on next steps. We would recommend that it be used alongside any internal documents you may have already in place.
Area Recommendation Current Status Action Due
Date
LE
AD
ER
SH
IP A
ND
CU
LT
UR
E
Leadership and culture
Do leaders and managers support the analysis of data, to understand the
current situation, indicate opportunities for action and enable you to measure
change?
Is consistent collection and analysis of data in the context of your organisation
and against relevant external benchmarks a central element of your strategy,
underpinning all other aspects?
Do you use data to help inform your decisions about the rate of progression?
Do you use data to help inform you about performance outcomes?
Do you use this data to help inform your pay grades?
Do you use data to help inform your decisions about pay and reward?
Do you share data with managers to educate them about the disproportionate
rate of progression/pay/reward etc for people from lower socio-economic
backgrounds?
Advocacy
Do you share the data findings internally within the business?
Do you share the data findings externally?
Do you make a public commitment to publishing data annually and reporting
on trends?
Do you publish aggregate diversity data, together with the rationale for
collecting these and statements about your strategy in response?
This document has been designed using the ideas that were generated in our masterclass. It will enable you to review and refine your data strategy and
focus on next steps. We would recommend that it be used alongside any internal documents you may have already in place.
Nothing/Not something you currently do
Actively do this
Nothing/Notsomething you currently do
Do something in this space but limited

Your data review and refine checklist –next steps
www.socialmobilityworks.org 5
Follow up questions Answers Due
Date
How many did you get in each area; red/amber/green?
What are your quick wins?
Who do you need to speak with in your organisation
about each area?
Who are the decision makers to help you make this
change?
What will your project plan look like?
Now that you have had time to reflect on your current data strategy, what are your next steps?
Welcome to the community and enjoy driving a change in this space!

Section TitleWhat is social mobility?
6
Social mobility is the link
between a person’s
occupation or income and
the occupation or income
of their parents.
In other words, it's
about ensuring your
background
doesn't determine your
future.

Why we are changing our guidance….. and what did we do?
7
Fe
ed
ba
ck
Re
sp
on
se
• Difficulty collecting data
• Just 17% in the SMF’s index
asked the best question*
• Survey too long
• What about response
rates?
• What to do with the data?
Employers toolkit
launched in
February 2020
The Key Question:
What was the occupation of
your main household earner
when you were aged about
14?
We created one key
question to
measure socio-
economic diversity
most accurately and
simply
We consulted with:
• academic
experts
• think tanks
• charities
• employers
*Data from the Social Mobility Employer Index, produced by our partners at the Social Mobility Foundation
Endorsed by our partners:
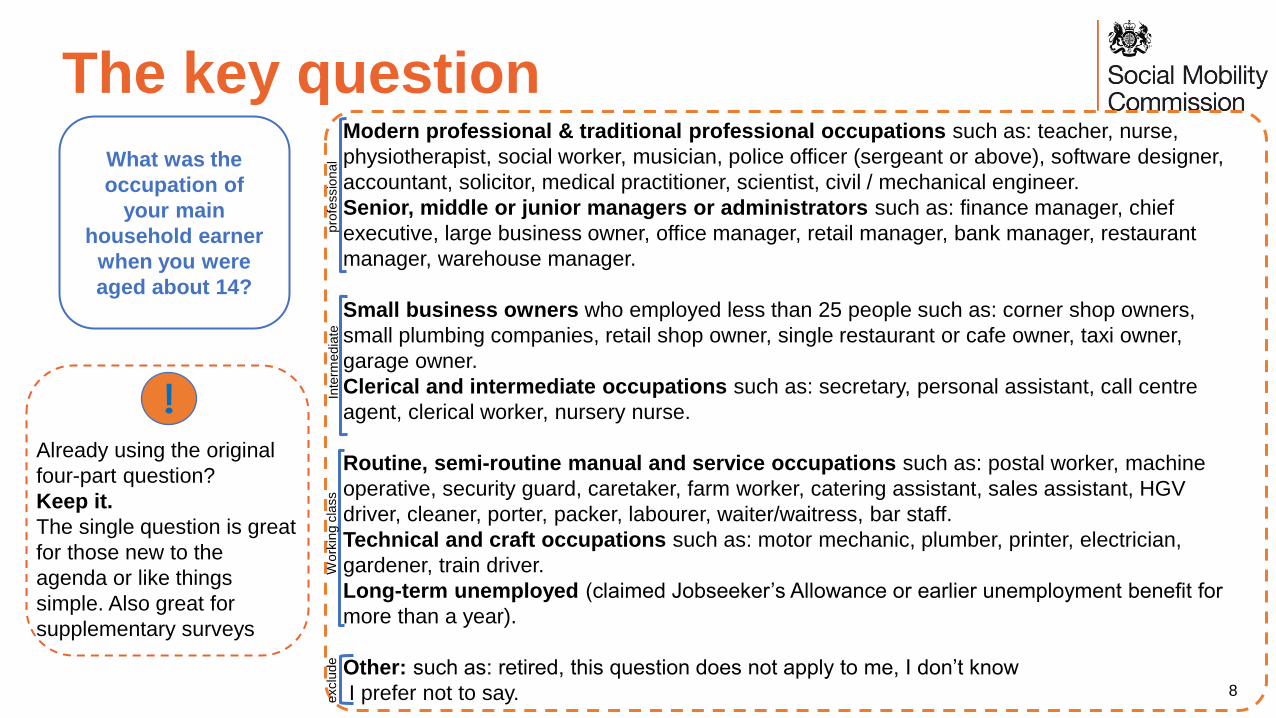
Modern professional & traditional professional occupations such as: teacher, nurse,
physiotherapist, social worker, musician, police officer (sergeant or above), software designer,
accountant, solicitor, medical practitioner, scientist, civil / mechanical engineer.
Senior, middle or junior managers or administrators such as: finance manager, chief
executive, large business owner, office manager, retail manager, bank manager, restaurant
manager, warehouse manager.
Small business owners who employed less than 25 people such as: corner shop owners,
small plumbing companies, retail shop owner, single restaurant or cafe owner, taxi owner,
garage owner.
Clerical and intermediate occupations such as: secretary, personal assistant, call centre
agent, clerical worker, nursery nurse.
Routine, semi-routine manual and service occupations such as: postal worker, machine
operative, security guard, caretaker, farm worker, catering assistant, sales assistant, HGV
driver, cleaner, porter, packer, labourer, waiter/waitress, bar staff.
Technical and craft occupations such as: motor mechanic, plumber, printer, electrician,
gardener, train driver.
Long-term unemployed (claimed Jobseeker’s Allowance or earlier unemployment benefit for
more than a year).
Other: such as: retired, this question does not apply to me, I don’t know
I prefer not to say.
The key question
8
What was the
occupation of
your main
household earner
when you were
aged about 14?
Already using the original
four-part question?
Keep it.
The single question is great
for those new to the
agenda or like things
simple. Also great for
supplementary surveys
pro
fessio
nal
Inte
rmedia
teW
ork
ing c
lass
exclu
de

Want to be among the best?
9
To optimise your practices
Ask two further questions to get to
the next level, alongside the key
question
Question 2
• Which type of school did you attend for the most
time between the ages of 11 and 16?
What has changed?
Added a new category for those who received a full
bursary to attend independent schools*.
Question 3
• If you finished school after 1980, were you
eligible for free school meals at any point during
your school years?
What has changed? – Nothing!
Question 4 is optional and is only for new graduate
hires
Did either of your parents attend university and gain a
degree (e.g. BA/BSc or equivalent) by the time you were
18?
*Visit www.socialmobilityworks.org/toolkit/measurement for the full text
Why ask?
This is a measure of extreme economic
disadvantage. It can help you target outreach
programmes. Why ask?
This measure shows extreme economic and cultural
advantage. Just 7% of people attend independent
schools and yet our research with our partners at
the Sutton Trust show how over-represented these
groups our in top jobs.

How do you drive up response rates?
1
0
The quality and value of the data
you collect depends on high
response rates
Eventually, make
responses to survey’s
compulsory but
always with ‘Prefer
not to say’ as an
option on the survey
Issues around data storage, use and confidentiality
are critically important. Be clear about this: who will
see data, how you will ensure anonymity, and how it
will be stored and used
Offer support and
encouragement to
managers,
especially where
response rates are
low
Set a clear and
transparent goal to
create a more socially
diverse and inclusive
workplace
Explain why this
information is important
and how it will drive
positive change
Use senior leaders to
act as role models
Applicants and
employees are more
likely to engage with
these questions if they
see them as part of an
integrated D&I strategy

Click to edit Master title styleYou have your data… now what?
11
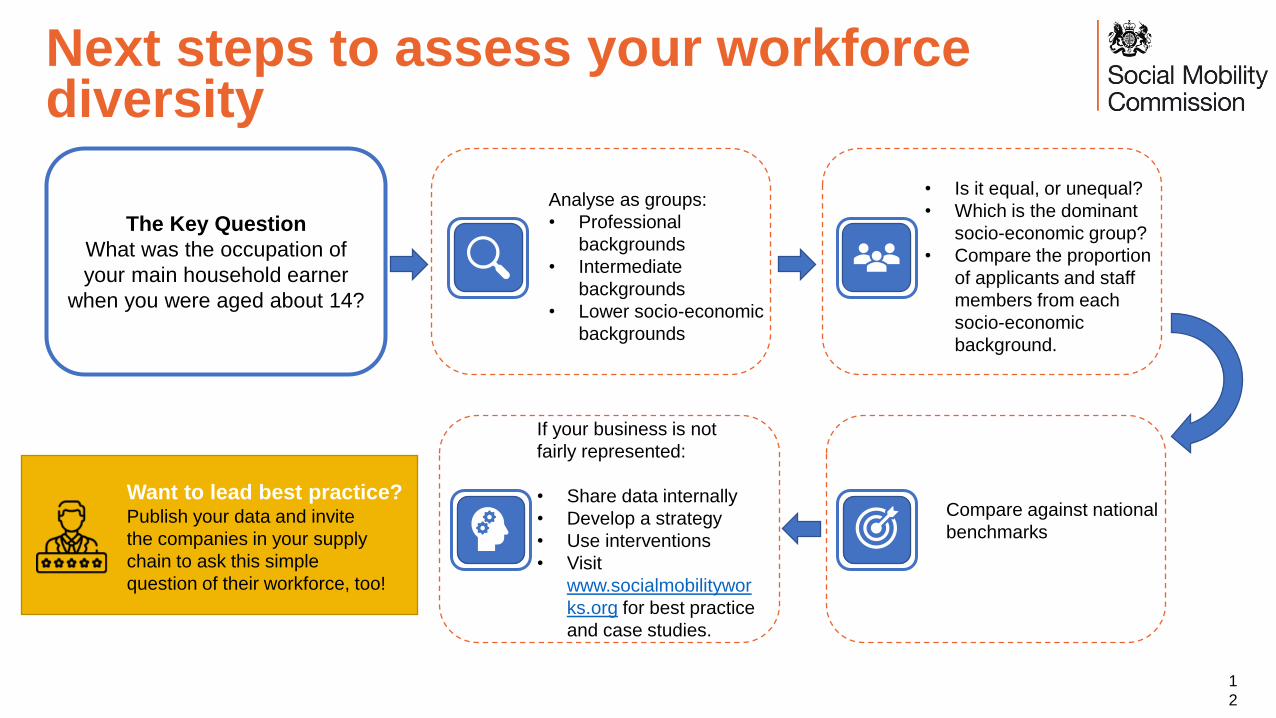
Next steps to assess your workforce diversity
1
2
The Key Question
What was the occupation of
your main household earner
when you were aged about 14?
Analyse as groups:
• Professional
backgrounds
• Intermediate
backgrounds
• Lower socio-economic
backgrounds
• Is it equal, or unequal?
• Which is the dominant
socio-economic group?
• Compare the proportion
of applicants and staff
members from each
socio-economic
background.
If your business is not
fairly represented:
• Share data internally
• Develop a strategy
• Use interventions
• Visit
www.socialmobilitywor
ks.org for best practice
and case studies.
Compare against national
benchmarks
Want to lead best practice?Publish your data and invite
the companies in your supply
chain to ask this simple
question of their workforce, too!

National benchmarks*
*Some industry benchmarks will also become available on our site as we release industry-specific toolkits
The key question – parental occupation at age 14

Using data to assess progression
14
Collect the data from question number one
Breakdown your current workforce: Split occupations in
your organisation by grade or seniority level (e.g. managing
director vs. associates etc.).
Analyse the data
Interpret the results
Understanding where those from lower
socio-economic backgrounds stop
progressing
Identify the barriers that are limiting upward mobility in your
organisation, and introduce measures to improve social
representation and inclusion across all levels of seniority.
Talented individuals from lower socio-economic backgrounds are often overlooked when it comes to moving up.
What percentage of people at each grade or seniority level
are in the three socio-economic background groups? Ensure
you consider anonymity – the ‘rule of thumb’ is not to analyse
results below 10, so group levels together if needed.
Is there equal or close to equal representation of socio-
economic backgrounds at each grade or seniority level?
Does your data have a ‘cliff edge’ effect, where those from lower
socio-economic backgrounds suddenly fall off, or a ‘pyramid’
effect, where they slowly fall off as you go higher in seniority?

Then use it to assess apprenticeships
15
.
Talented individuals from lower socio-economic backgrounds are often overlooked when it comes to moving up.
Analyse your overall apprenticeship and
training makeup as you would with your
workforce, using the key question.
Are there certain apprenticeships or training offers
that are over or under-represented by socio-
economic status?
Access by level
Look at the percentage of learners who have
completed apprenticeships by socio-economic
background.
Completion rates
Use your workforce data to look at who receives a
promotion or goes onto a higher level of apprenticeship
within a set period of time after they are done with their
training.
Progression
Get the overall picture

Click to edit Master title styleThe scorecardA new tool for mature organisations to track progress
16
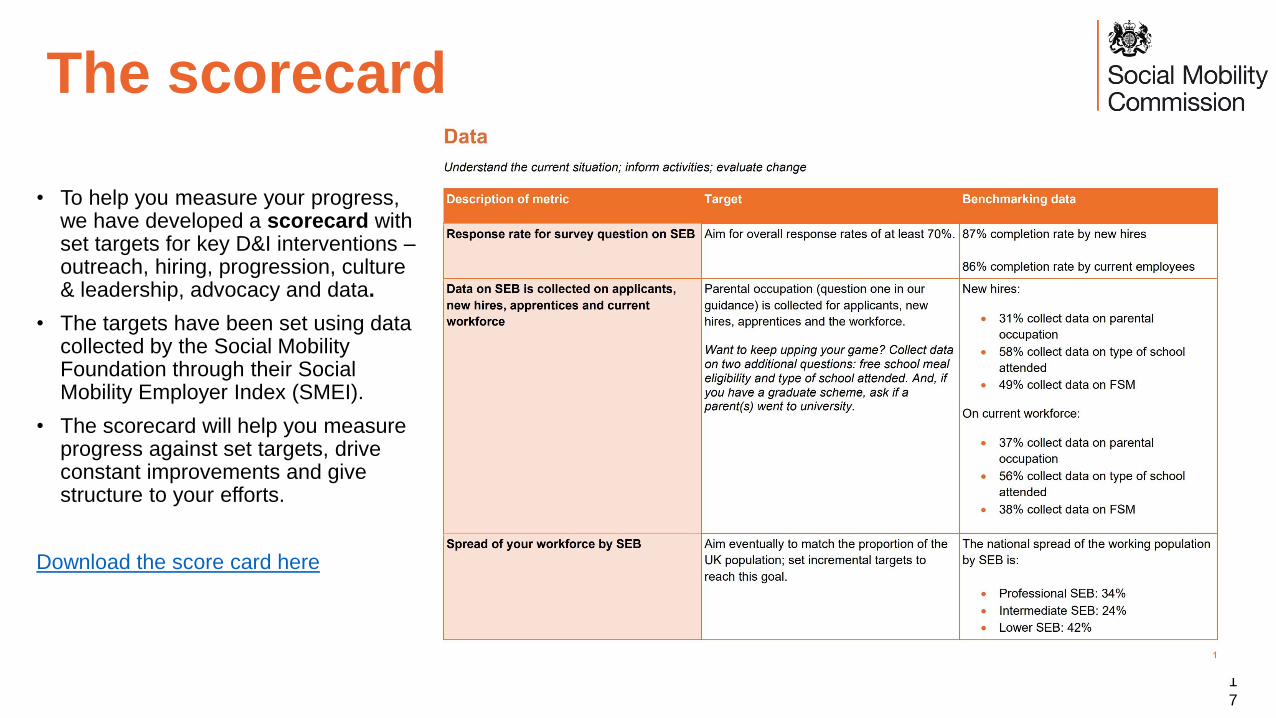
The scorecard
1
7
• To help you measure your progress, we have developed a scorecard with set targets for key D&I interventions –outreach, hiring, progression, culture & leadership, advocacy and data.
• The targets have been set using data collected by the Social Mobility Foundation through their Social Mobility Employer Index (SMEI).
• The scorecard will help you measure progress against set targets, drive constant improvements and give structure to your efforts.
Download the score card here

Click to edit Master title styleNow let’s hear from the guest speakers
18

Presenters
1
9
James King
Head of Reward &
Projects
Compass Group UK &
Ireland
Laura Yeates
Head of Graduate
Talent
Clifford Chance LLP
Andrew Young
Diversity Lead,
Workforce
BBC
Philip Wilson
Head of Assessment
and Diversity
Fast stream, Cabinet
Office
8
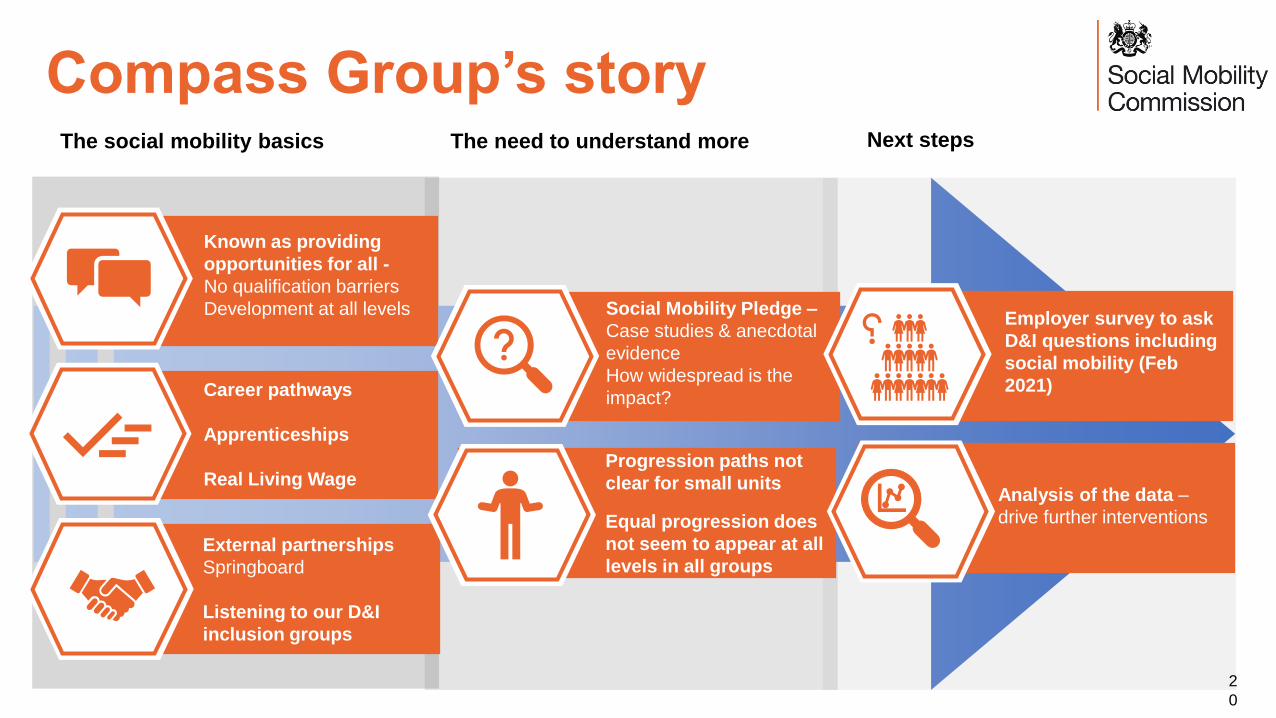
Compass Group’s story
2
0
Known as providing
opportunities for all -
No qualification barriers
Development at all levels
The social mobility basics
Career pathways
Apprenticeships
Real Living Wage
External partnerships
Springboard
Listening to our D&I
inclusion groups
Social Mobility Pledge –
Case studies & anecdotal
evidence
How widespread is the
impact?
Analysis of the data –
drive further interventions
Progression paths not
clear for small units
Equal progression does
not seem to appear at all
levels in all groups
The need to understand more Next steps
Employer survey to ask
D&I questions including
social mobility (Feb
2021)

BBC D&I Data journey
2
1
Initially Next Now Going Forward
Started collecting
socioeconomic dataAnalysing data
Informing interventions
Culture and behaviours
Data informs strategy
on D&I and social
mobility
Continue data
collection
Review questions
Culture and career
progression feature on
website
Next census January
2021Improving inclusion
Partnered with Bridge
Group
Early career
New ways of recruitingIntegrated qualitative
and quantitative data

Clifford Chance’s data usage
2
2
Collected Data
since 2014
Data has informed
interventions and helped
to test hypothesises
Data collection
supports the
business case for
interventions
External Data
Support
Identified
barriers in
recruitment
process and
progression
Two data sets;
Entry and
Progression
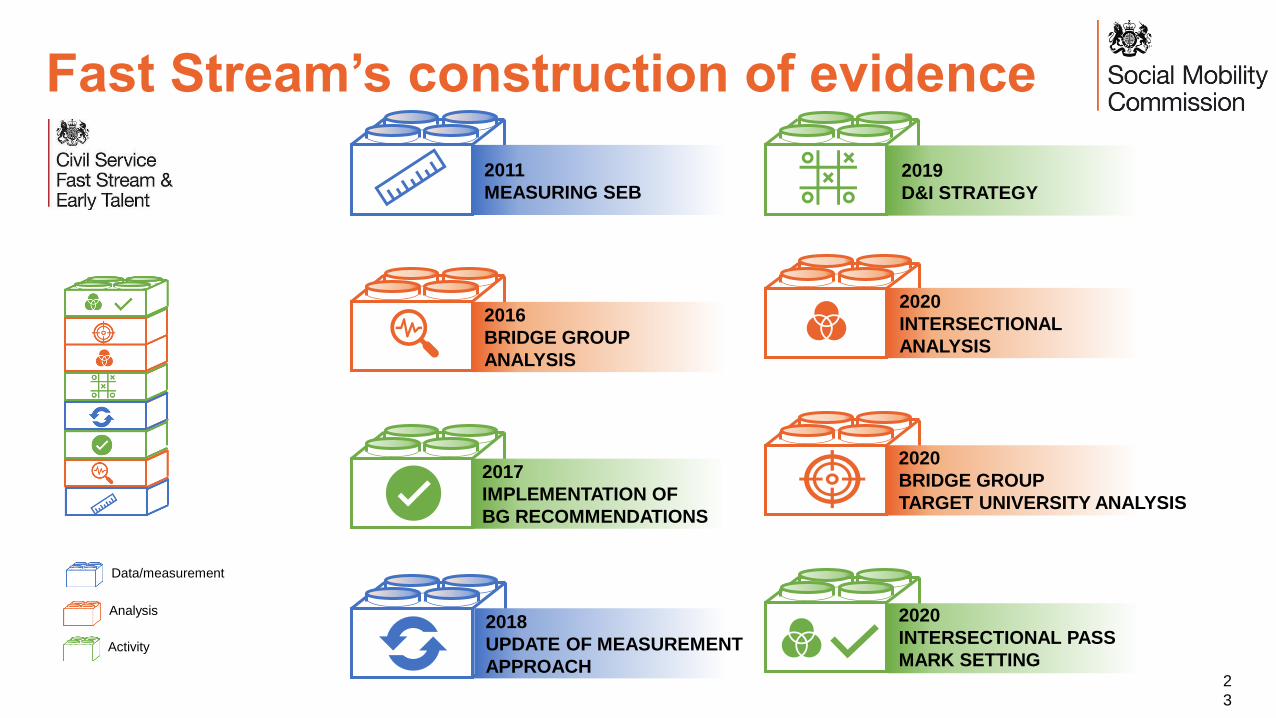
Fast Stream’s construction of evidence
2
3
Data/measurement
Analysis
Activity
2011
MEASURING SEB
2018
UPDATE OF MEASUREMENT
APPROACH
2016
BRIDGE GROUP
ANALYSIS
2020
INTERSECTIONAL
ANALYSIS
2020
BRIDGE GROUP
TARGET UNIVERSITY ANALYSIS
2017
IMPLEMENTATION OF
BG RECOMMENDATIONS
2020
INTERSECTIONAL PASS
MARK SETTING
2019
D&I STRATEGY

Data collection and manipulation
2
4
Nicholas Miller
Chief Executive
Bridge Group

Social Mobility Employers Masterclass Series:
Data
3 December 2020

What’s the point?
> To understand what is happening
> To inform action
> To benchmark progress
> To understand what is effective
> Bust some myths

Questions
> How diverse is our organisation by socio-economic background (SEB)?
> Horizontally (by area) > Vertically (by seniority)
Who gets
in?
Who
progresses
and how?
Who sticks
around?> Benchmarked against time and
other relevant datapoints
> All considered in the context of other diversity characteristics
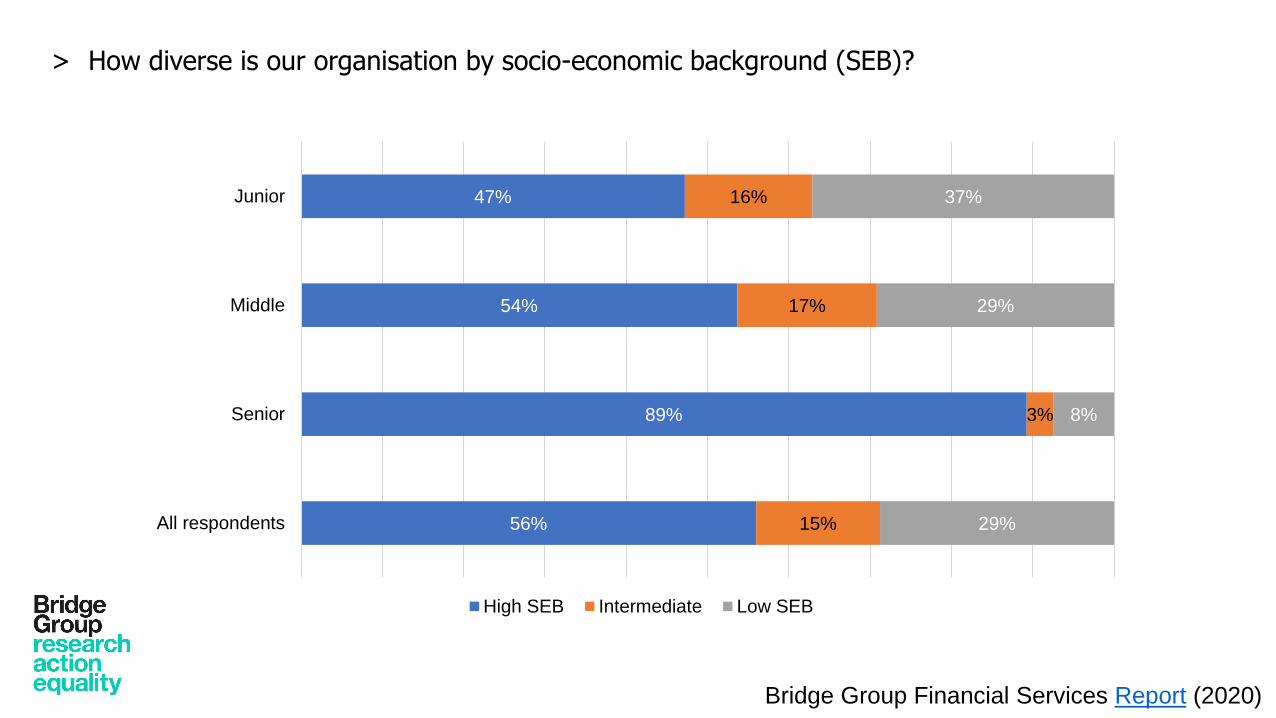
> How diverse is our organisation by socio-economic background (SEB)?
47%
54%
89%
56%
16%
17%
3%
15%
37%
29%
8%
29%
Junior
Middle
Senior
All respondents
High SEB Intermediate Low SEB
Bridge Group Financial Services Report (2020)
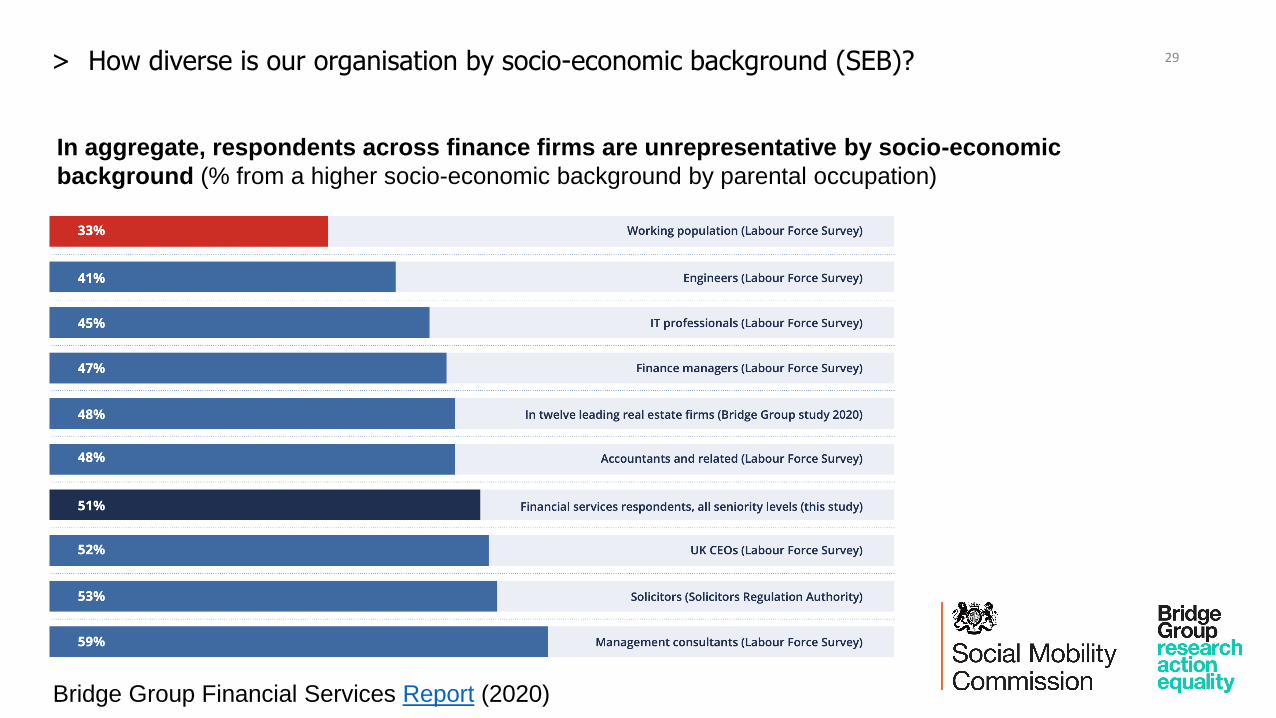
29
In aggregate, respondents across finance firms are unrepresentative by socio-economic
background (% from a higher socio-economic background by parental occupation)
> How diverse is our organisation by socio-economic background (SEB)?
Bridge Group Financial Services Report (2020)

30
These proportions vary significantly by organisation
(% from a higher socio-economic background by parental occupation)
> How diverse is our organisation by socio-economic background (SEB)?
Bridge Group Financial Services Report (2020)

> How diverse is our organisation by socio-economic background (SEB)?
23%
35%
21%
29% 29% 29%
17%
30%
16%
27%
18%
21%
16%
24%
13%
25%
NonLondon
London NonLondon
London NonLondon
London NonLondon
London NonLondon
London NonLondon
London NonLondon
London NonLondon
London
1 Partner 3 Director 4 Associate Director 5 Senior Manager 6 Manager 7 Assistant Manager 8 Executive 9 Associate
% from independent school
% from state school
Large accountancy firm (anonymous – 2019)
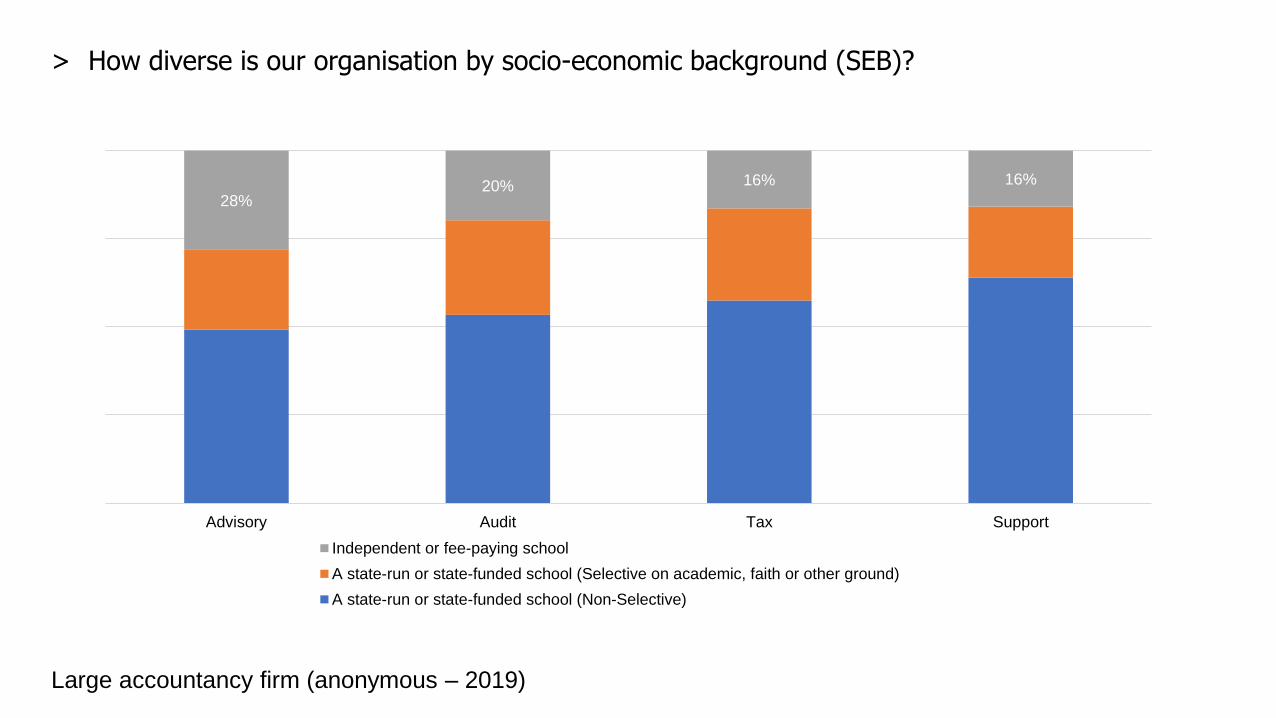
> How diverse is our organisation by socio-economic background (SEB)?
28%20% 16% 16%
Advisory Audit Tax Support
Independent or fee-paying school
A state-run or state-funded school (Selective on academic, faith or other ground)
A state-run or state-funded school (Non-Selective)
Large accountancy firm (anonymous – 2019)
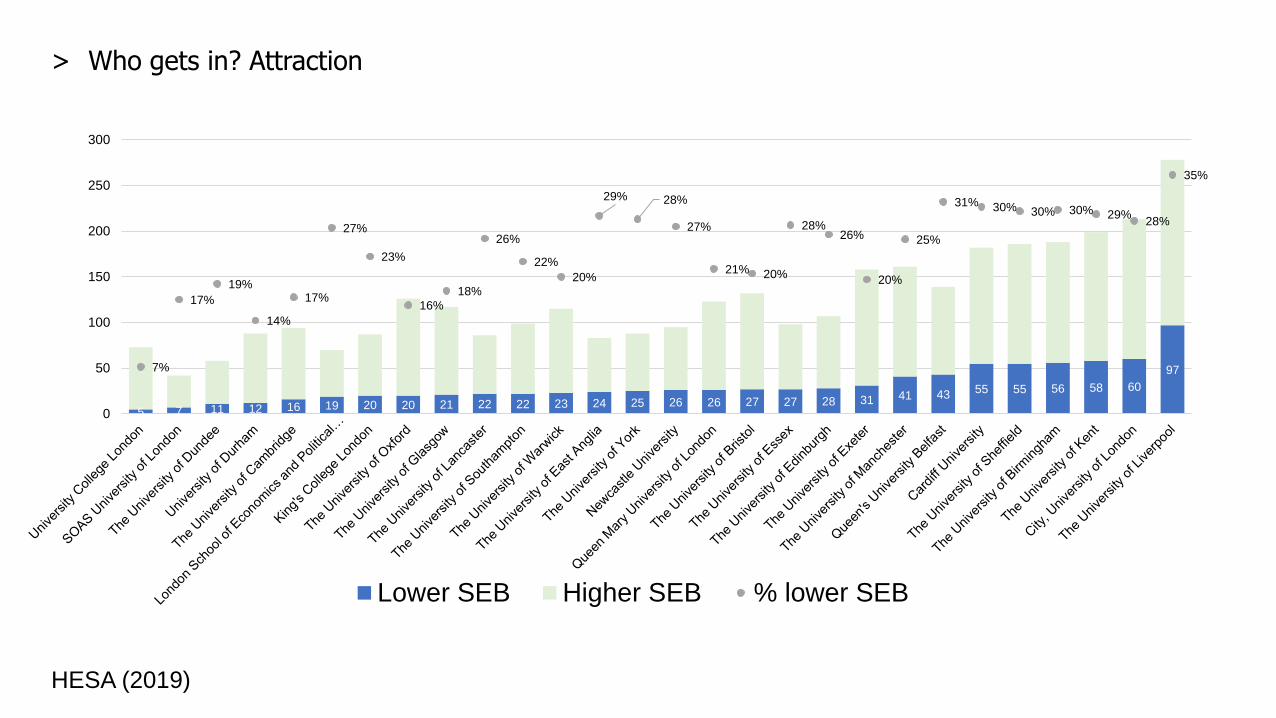
> Who gets in? Attraction
5 7 11 12 16 19 20 20 21 22 22 23 24 25 26 26 27 27 28 31 41 43 55 55 56 58 60
977%
17%
19%
14%
17%
27%
23%
16%
18%
26%
22%
20%
29% 28%
27%
21% 20%
28%26%
20%
25%
31% 30% 30% 30% 29%28%
35%
0%
40%
0
50
100
150
200
250
300
Lower SEB Higher SEB % lower SEB
HESA (2019)
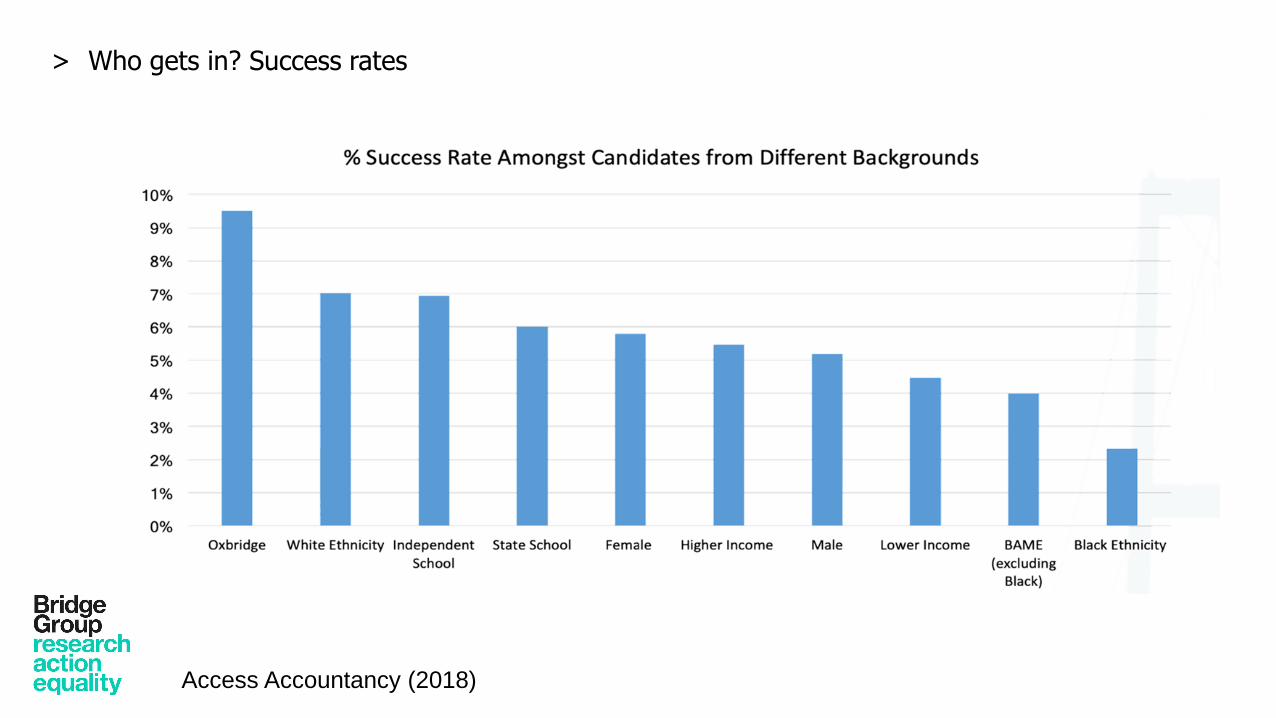
> Who gets in? Success rates
Access Accountancy (2018)

> Who gets in? Success rates
For example, this
bar shows us that at
Firm F, candidates
educated at
Independent
Schools are 34%
more likely to
succeed compared
to those educated in
state schools.
-31%
-1%
8%
9%
22%
34%
37%
37%
72%
Firm H
Firm B
Firm C
Firm I
Overall
Firm F
Firm E
Firm D
Firm G
Success Ratio by Firm : Independent vs State(Firm A removed because dataset too small or data not provided)
Access Accountancy (2018)
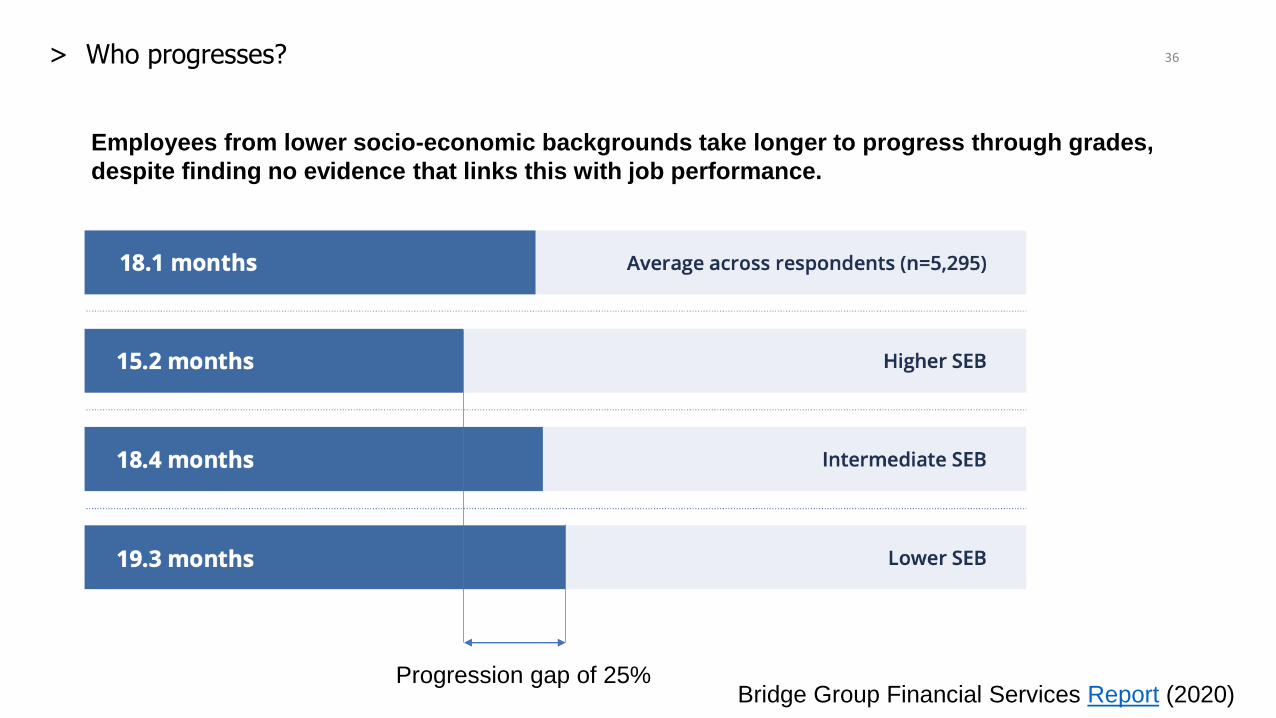
36
Employees from lower socio-economic backgrounds take longer to progress through grades,
despite finding no evidence that links this with job performance.
Progression gap of 25%
> Who progresses?
Bridge Group Financial Services Report (2020)

> What does good look like?
> Consistency of data types
> Capability to map datasets - often an infrastructural / IT matter
> Benchmark and contextualising – understand external data
> Ask the right questions of the data – focus and apply the right analysis
> Use the answers to inform change and evaluate progress – analysis to intelligence to action
> Transparency and collaboration

> Response rates
> What it will not be used for
> Strategically connected and relevant
> Continuous process, you can mandate it
> Engage middle / team managers
> Relevance of questions
39

Click to edit Master title style
40
Masterclass: Data Insights to drive your decisions and interventions
2:00pm – 3:30pm 3 December 2020
@SMCommission Social Mobility Commission @socialmobilitystories
#Socialmobility www.socialmobilityworks.org