click to edit master subtitle style june 2009neon pdr national ecological observatory network neon...
Post on 21-Dec-2015
217 views
TRANSCRIPT
Click to edit Master subtitle style
June 2009 NEON PDR
National Ecological Observatory Network
NEON Overview & Status
Michael Keller, David Schimel & NEON Project Team
NEON PDR June 2009 11

June 2009 NEON PDR
NEON GoalsThe overarching goal of NEON is to enable understanding
and forecasting of climate change, land use change, and invasive species on continental-scale ecology by
providing infrastructure to support research in these areas.
Information infrastructure: Consistent, continental, long-term, multi-scaled data-sets and data products that serve as a context for research and education.
Physical Infrastructure: A research platform for investigator-initiated sensors, observations, and experiments providing physical infrastructure, cyberinfrastructure, human resources, and expertise, and program management and coordination.
June 2009 NEON PDR 22

June 2009 NEON PDR
Click to edit Master subtitle style
June 2009 33 NEON PDR

A National Observatory:20 Eco-climatic Domains
June 2009 NEON PDR
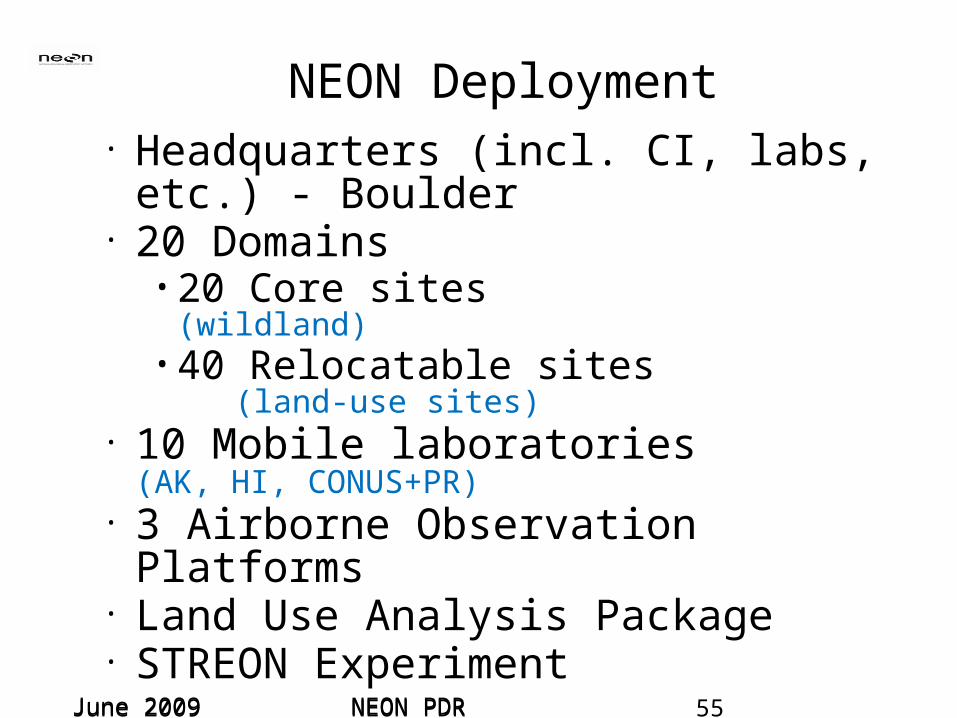
NEON Deployment• Headquarters (incl. CI, labs, etc.) -
Boulder• 20 Domains
• 20 Core sites (wildland)• 40 Relocatable sites (land-use
sites)• 10 Mobile laboratories (AK, HI,
CONUS+PR)• 3 Airborne Observation Platforms• Land Use Analysis Package• STREON Experiment
NEON PDR June 2009 55

June 2009 NEON PDR
Core(wildland)
Relocatable 1 (restored forest)
Relocatable 2 (managed forest)
NEON Inc. – Site Layout
Domain 3 - Southeast
June 2009 66 NEON PDR

June 2009 NEON PDR June 2009 77 NEON PDR
June 2009 NEON PDR
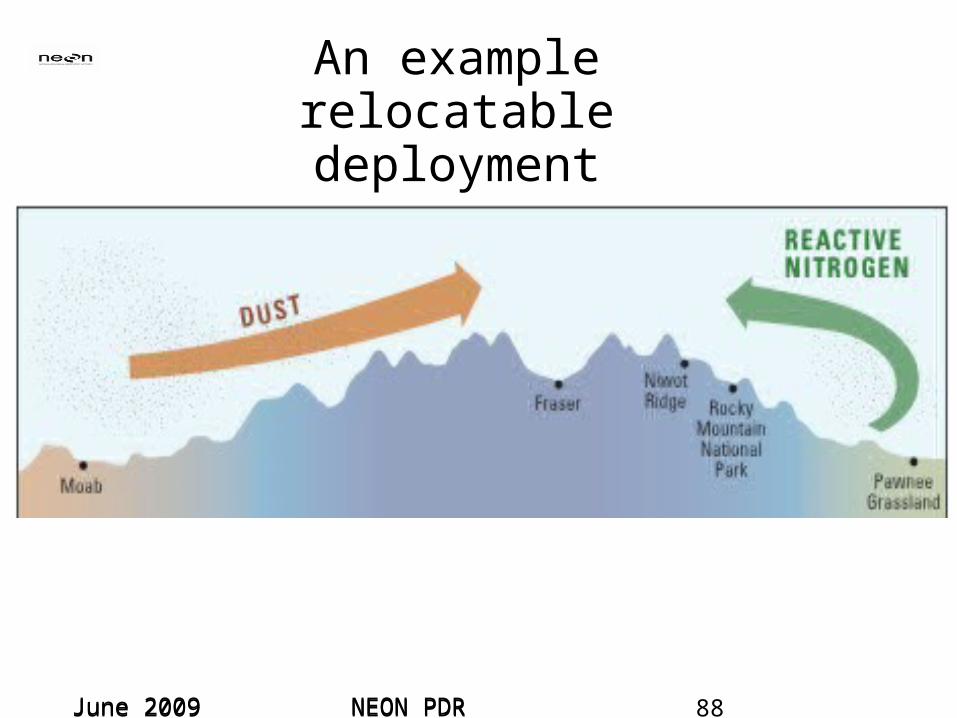
An example relocatable deployment
June 2009 NEON PDR 88
June 2009 NEON PDR
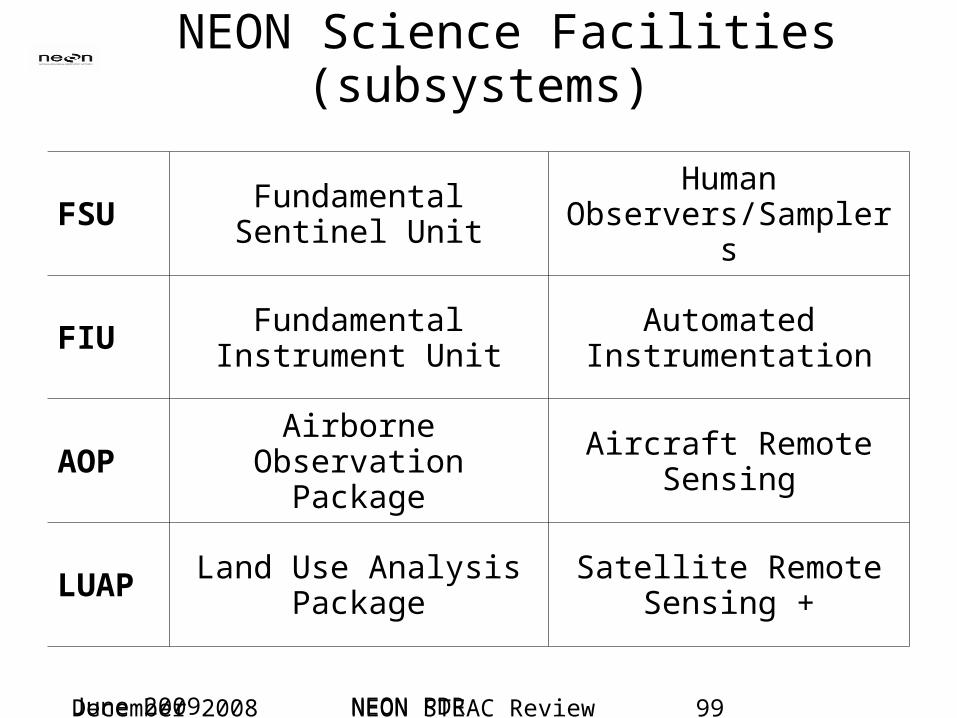
NEON Science Facilities (subsystems)
December 2008 NEON STEAC Review 99
FSU Fundamental Sentinel Unit
Human Observers/Samplers
FIU Fundamental Instrument Unit
Automated Instrumentation
AOP Airborne Observation Package
Aircraft Remote Sensing
LUAP Land Use Analysis Package
Satellite Remote Sensing +

Click to edit Master subtitle style
June 2009 NEON PDR
STREON DesignNEON
control reachI
I
XO
I
I
STREON treatment reach
Instrument station, water sampling site
Experimental units (baskets )
Basket incubation (e.g. streamside flume or in situ recirculation chamber)
Nutrient addition station
water flow
Consumer exclosure(electrified barriers )
XE
NEON PDR June 2009 1010

June 2009 NEON PDR
Airborne Remote Sensing
Spectroscopy Vegetation biochemical &
biophysical properties Cover type & fraction
LiDAR altimetry Vegetation Structure Sub-canopy topography biomass
High resolution imagery Land use & land cover
June 2009 NEON PDR
June 2009 NEON PDR
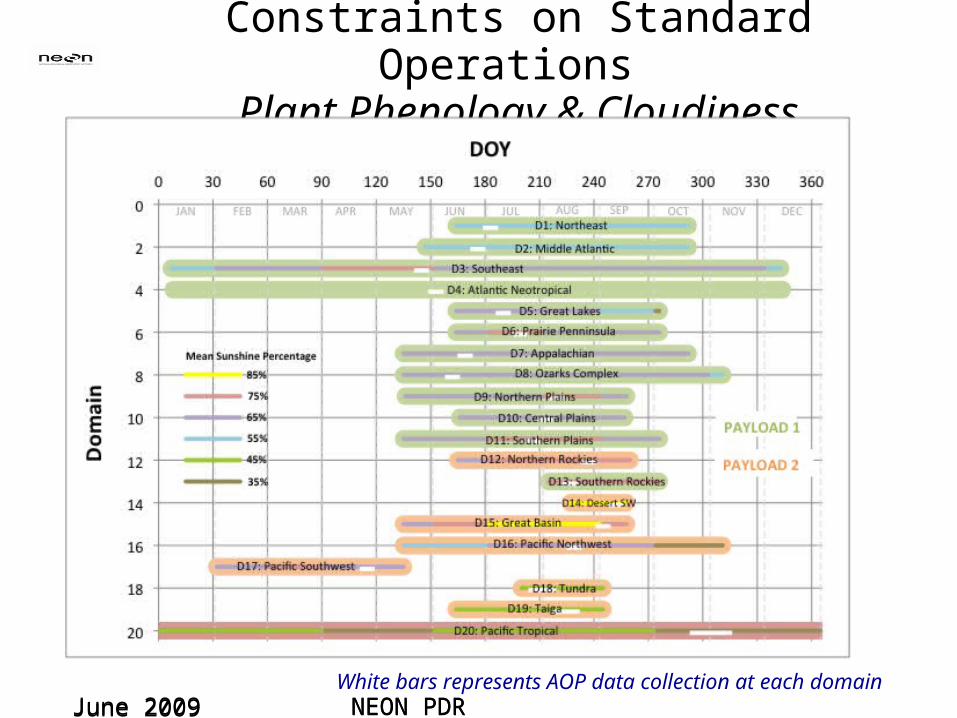
Constraints on Standard Operations Plant Phenology & Cloudiness
June 2009White bars represents AOP data collection at each domain NEON PDR

June 2009 NEON PDR
Timing of Targets of Opportunity (TOO)
White bars represents AOP data collection at each domain
June 2009
Time available for Targets of Opportunity: PI-driven Campaigns, Rapid Response, Additional NEON sites, etc.
Payload 1
Payload 2
Payload 3
Payload 3 season Could be extendedw/ PI-cost sharing
NEON PDR
June 2009 NEON PDR
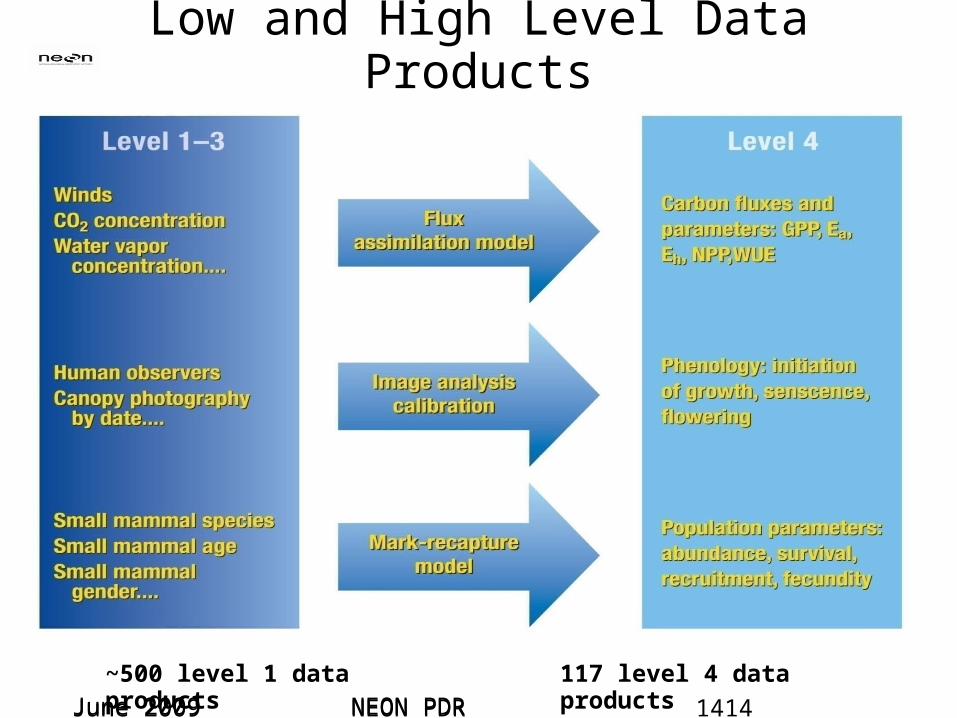
Low and High Level Data Products
~500 level 1 data products 117 level 4 data products June 2009 1414 NEON PDR
June 2009 NEON PDR
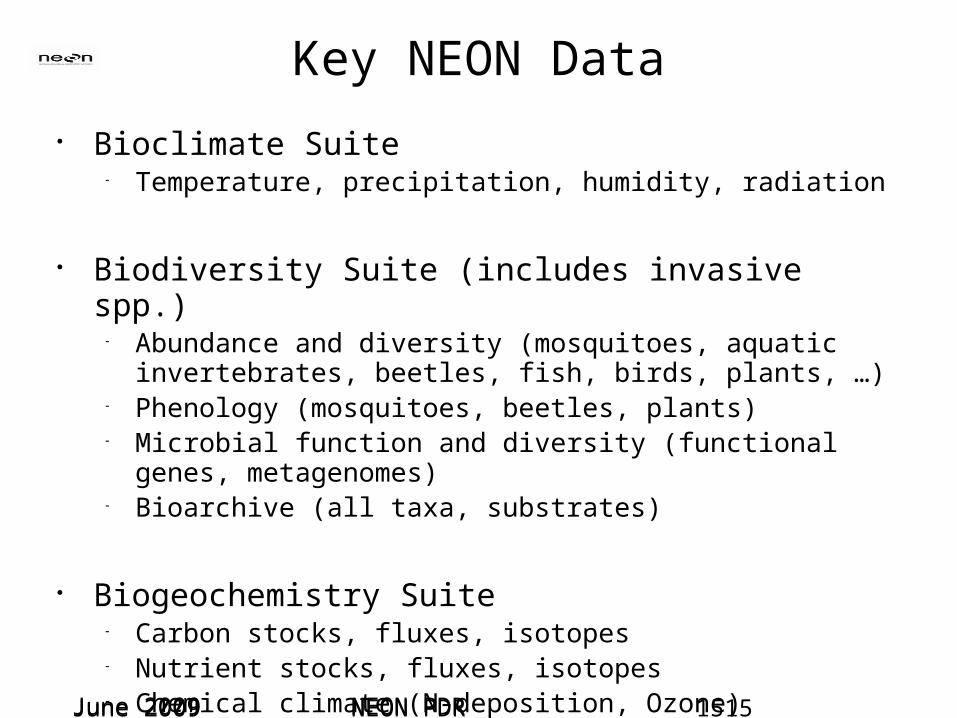
Key NEON Data
Bioclimate Suite Temperature, precipitation, humidity, radiation
Biodiversity Suite (includes invasive spp.) Abundance and diversity (mosquitoes, aquatic invertebrates,
beetles, fish, birds, plants, …) Phenology (mosquitoes, beetles, plants) Microbial function and diversity (functional genes,
metagenomes) Bioarchive (all taxa, substrates)
Biogeochemistry Suite Carbon stocks, fluxes, isotopes Nutrient stocks, fluxes, isotopes Chemical climate (N-deposition, Ozone)
June 2009 1515 NEON PDR
June 2009 NEON PDR
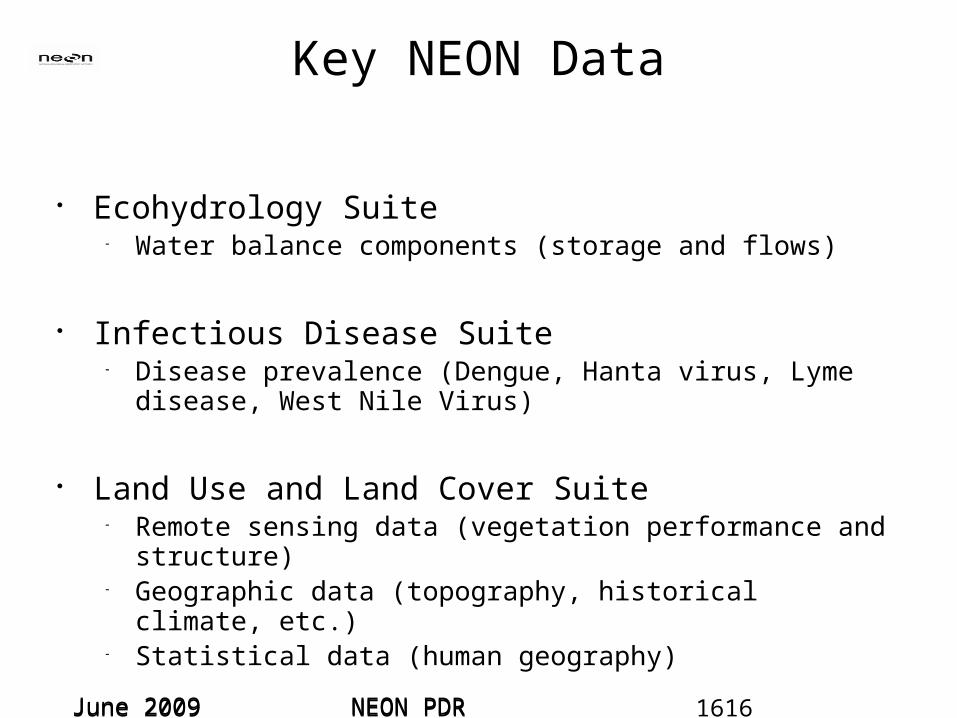
Key NEON Data
Ecohydrology Suite Water balance components (storage and flows)
Infectious Disease Suite Disease prevalence (Dengue, Hanta virus, Lyme disease, West
Nile Virus)
Land Use and Land Cover Suite Remote sensing data (vegetation performance and structure) Geographic data (topography, historical climate, etc.) Statistical data (human geography)
June 2009 1616 NEON PDR

June 2009 NEON PDR
The goal of NEON is to enable understanding and forecasting of the impacts of climate change, land use
change and invasive species on continental-scale ecology by providing
infrastructure to support research in these areas.
Ecological Forecasting1) What is the most likely future state of an ecological
system? 2) What-if: what is the most likely future state of a system
given a decision today?
June 2009 NEON PDR 1717

June 2009 NEON PDR
Why are ecological forecasting and observations so related?
1) The need for observations of the starting point (now) 2) The need for quantitative information about specific processes (temperature sensitivity, susceptibility to drought…)
June 2009 NEON PDR 1818

June 2009 NEON PDR
Data and Forecasting
Improvements in forecasts come from repeated comparison between data and forecasts
June 2009 NEON PDR 1919

June 2009 NEON PDR
NEON spatial data analysis
2020

June 2009 NEON PDR
Integration of NEON data to produce analyses and forecasts
December 2008 NEON STEAC Review 2121
June 2009 NEON PDR
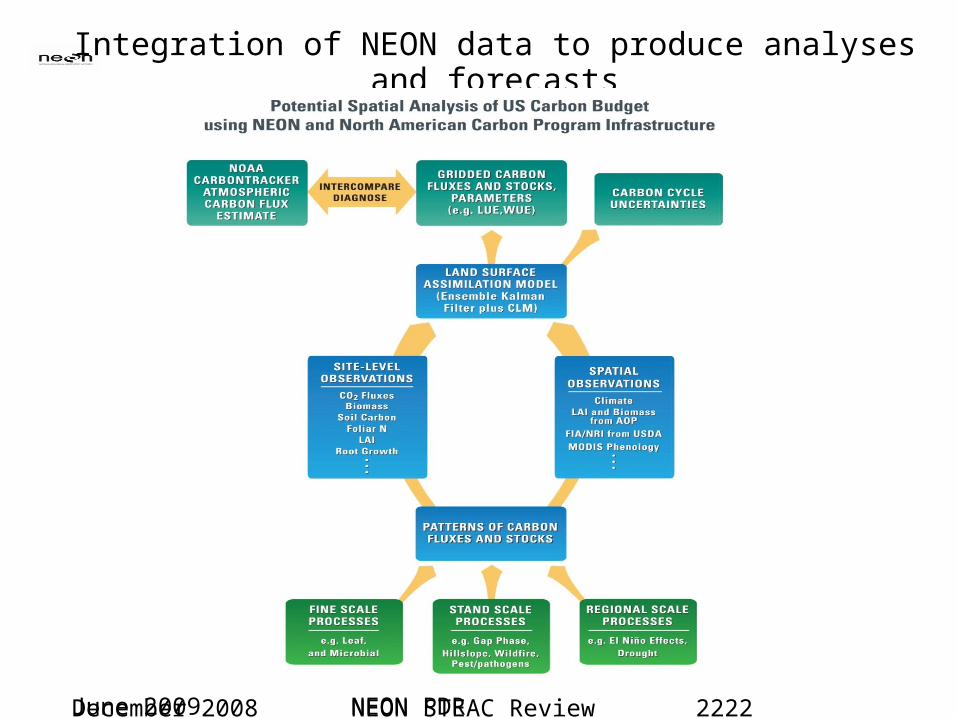
Integration of NEON data to produce analyses and forecasts
December 2008 NEON STEAC Review 2222

June 2009 NEON PDR
Requirements for ecological forecasting
Estimates of system state (FSU, FIU, AOP and LUAP) Information on process parameters (FSU, FIU) Experiments/process studies to elucidate unknown
processes (e.g. STREON) Observations collected systematically over time to
challenge iterative forecasts
A paradigm for ecological research?
December 2008 NEON STEAC Review 2323

June 2009 NEON PDR
Education Mission
NEON’s education mission is to enable society and the scientific community to use ecological information and forecasts to understand and effectively address critical ecological questions and issues.
June 2009 NEON PDR 2424
June 2009 NEON PDR
NEON Education: Goals Promote and facilitate public understanding of
ecological science (i.e., ecological literacy) Educate the next generation of environmental
scientists Enhance diversity of the environmental science
research community Provide tools for students, educators, decision
makers and the public to use NEON data to make informed decisions about ecological issues
June 2009 2525 NEON PDR

June 2009 NEON PDR
NEON Education: Guiding Framework NEON science, including data, shall be accessible to
and usable by a diversity of communities Maximize impact through partnerships – Serve as a model for transforming science to include
citizens Promote science education model that emphasizes the
process of science through “doing science” Reflect societal trends for learning through a
decentralized process and free-choice learning context
Serve as a catalyst to advance “science as a way of knowing”
June 2009 2626 NEON PDR
June 2009 NEON PDR June 2009 NEON PDR
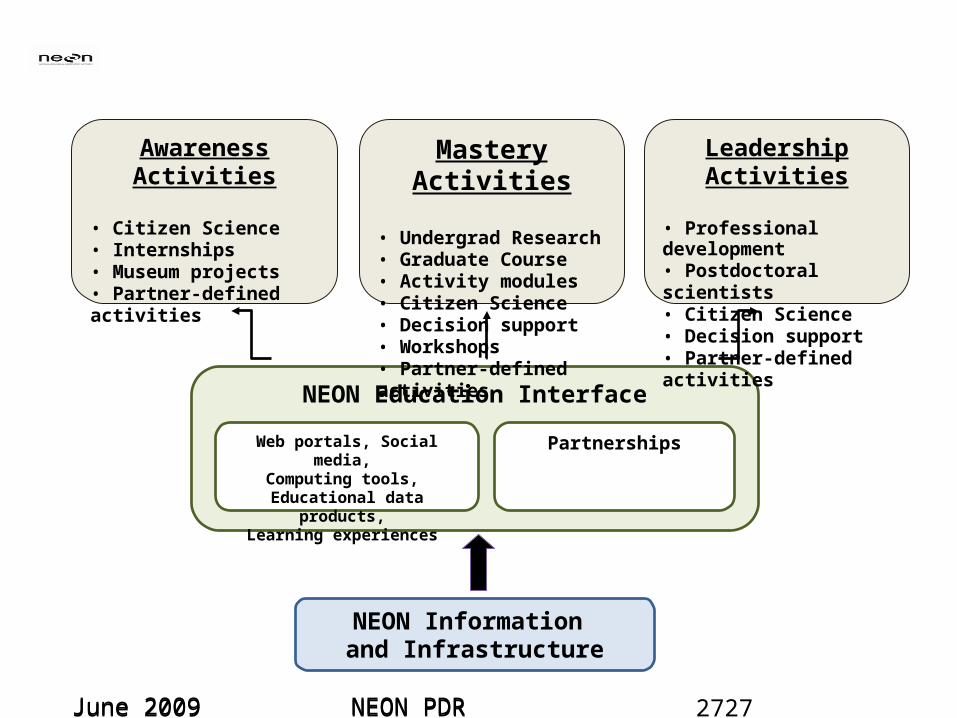
NEON Education Interface
NEON Information and Infrastructure
Web portals, Social media, Computing tools,
Educational data products, Learning experiences
Partnerships
Awareness Activities
• Citizen Science• Internships• Museum projects• Partner-defined activities
Mastery Activities
• Undergrad Research• Graduate Course• Activity modules• Citizen Science• Decision support• Workshops• Partner-defined activities
Leadership Activities
• Professional development• Postdoctoral scientists• Citizen Science• Decision support• Partner-defined activities
2727

June 2009 NEON PDR
NEON Opportunities for Scientists and Educators
Deployments: Mobile Deployment Platform Airborne Observing Platform
Data Products NEON will produce 584 Level 1 and 117 Level 4 data products. New data products will be developed based on community
inputs
Bioarchive ~130,000 samples per year (species and substrates)
Experiments Externally funded experiments using NEON sites and
infrastructure June 2009 NEON PDR 2828
June 2009 NEON PDR
The National Ecological Observatory Network is a project sponsored by the National Science Foundation and managed under cooperative agreement by NEON Inc.
June 2009 2929 NEON PDR
www.neoninc.org
June 2009 NEON PDR June 2009
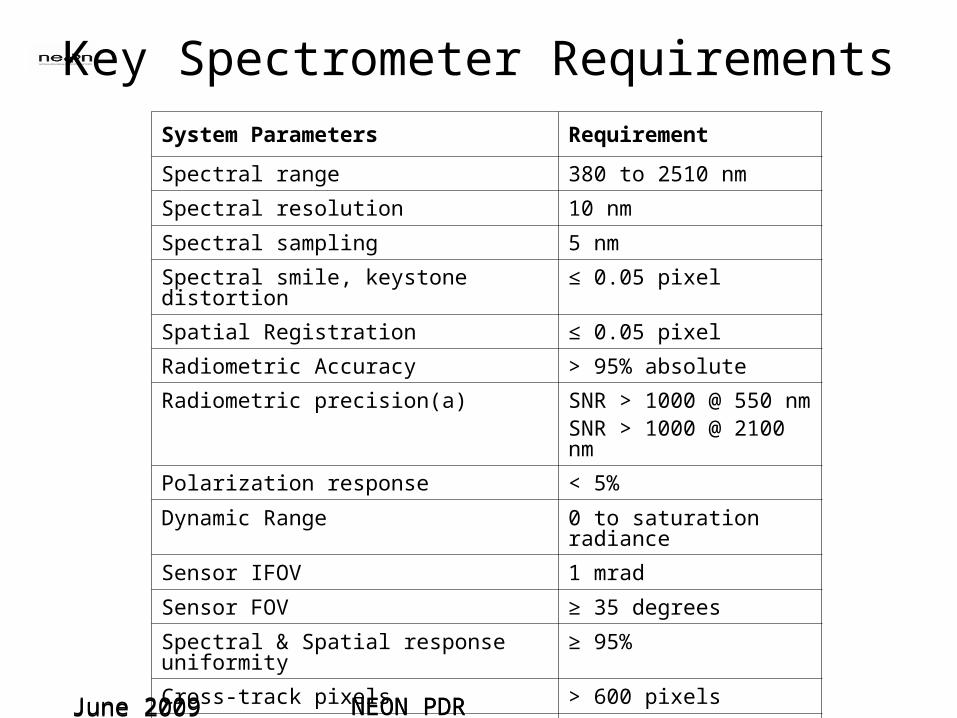
Key Spectrometer RequirementsSystem Parameters Requirement
Spectral range 380 to 2510 nm
Spectral resolution 10 nm
Spectral sampling 5 nm
Spectral smile, keystone distortion ≤ 0.05 pixel
Spatial Registration ≤ 0.05 pixel
Radiometric Accuracy > 95% absolute
Radiometric precision(a) SNR > 1000 @ 550 nmSNR > 1000 @ 2100 nm
Polarization response < 5%
Dynamic Range 0 to saturation radiance
Sensor IFOV 1 mrad
Sensor FOV ≥ 35 degrees
Spectral & Spatial response uniformity ≥ 95%
Cross-track pixels > 600 pixels
Cross-track swath 1.0 km @ 1000 altitude
NEON PDR

June 2009 NEON PDR
Key Flight Ops ParametersParameters Value
Flight Season 7 months
Total Flight Days 458 days
Total Fight Hours 1,093 hours
Required Flight Period(s): Continental Flights Puerto Rico Alaska / Hawaii
April to SeptemberJune/JulyOctober / March
Number of Domain/sites per year 20/60
Flight duration for data collection 4 hours (max.) per site + travel to/from local airport
Base of Science Operation Boulder, CO
Field operations Local airports at each domain
Flight altitudes for data collection 1,000 to 3,000 m AGL
Ground Speed for data collection 90 to 110 knots
Number of flight tracks over site ~ 20 (or less)
Time of day for science data 10 am to 2 pm (local time)
June 2009 NEON PDR
June 2009 NEON PDR
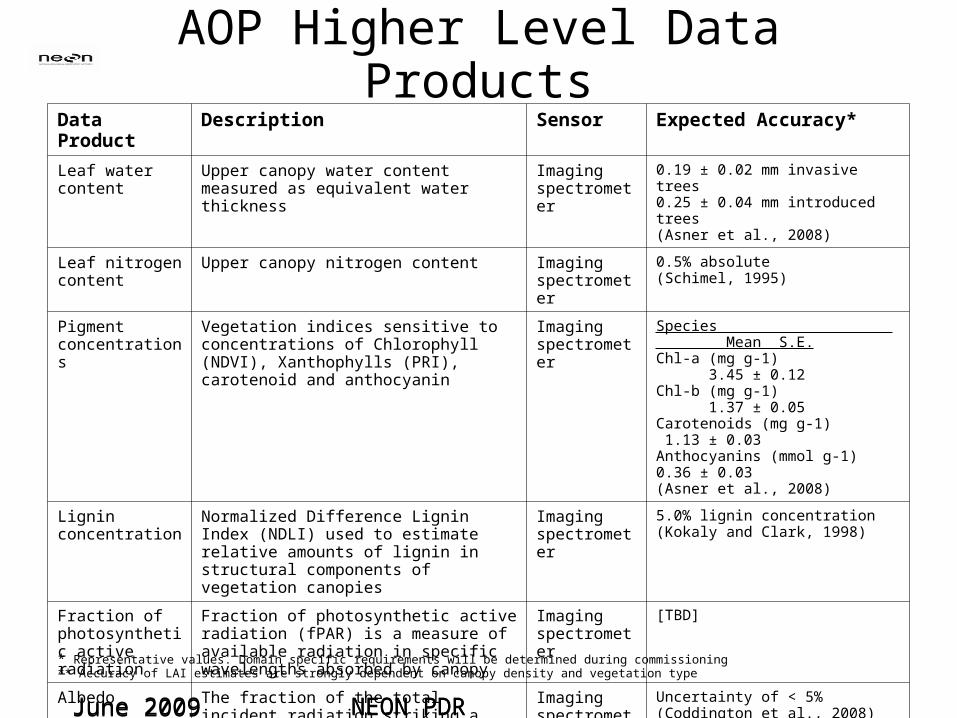
AOP Higher Level Data ProductsData Product Description Sensor Expected Accuracy*
Leaf water content
Upper canopy water content measured as equivalent water thickness
Imaging spectrometer
0.19 ± 0.02 mm invasive trees0.25 ± 0.04 mm introduced trees (Asner et al., 2008)
Leaf nitrogen content
Upper canopy nitrogen content Imaging spectrometer
0.5% absolute(Schimel, 1995)
Pigment concentrations
Vegetation indices sensitive to concentrations of Chlorophyll (NDVI), Xanthophylls (PRI), carotenoid and anthocyanin
Imaging spectrometer
Species Mean S.E.Chl-a (mg g-1) 3.45 ± 0.12Chl-b (mg g-1) 1.37 ± 0.05Carotenoids (mg g-1) 1.13 ± 0.03Anthocyanins (mmol g-1) 0.36 ± 0.03(Asner et al., 2008)
Lignin concentration
Normalized Difference Lignin Index (NDLI) used to estimate relative amounts of lignin in structural components of vegetation canopies
Imaging spectrometer
5.0% lignin concentration (Kokaly and Clark, 1998)
Fraction of photosynthetic active radiation
Fraction of photosynthetic active radiation (fPAR) is a measure of available radiation in specific wavelengths absorbed by canopy
Imaging spectrometer
[TBD]
Albedo The fraction of the total incident radiation striking a surface that is reflected by that surface
Imaging spectrometer
Uncertainty of < 5% (Coddington et al., 2008)
Leaf area index LAI defines as one-half the total green area of per unit ground surface area
Imaging spectrometer
20% relative uncertainty; 1.0 LAI absolute uncertainty (Fernandes et al., 2003)**
June 2009
* Representative values. Domain specific requirements will be determined during commissioning** Accuracy of LAI estimates are strongly dependent on canopy density and vegetation type
NEON PDR

June 2009 NEON PDR
AOP Higher Level Data ProductsData Product Description Sensor Expected Accuracy*
Digital Elevation Map
Bare earth elevation data (topographic information with vegetation and man-made structures removed)
Waveform-LiDAR < 1 m error(Asner et al., 2007)
Canopy Height Horizontal distribution of the height profile of canopy components measured as the distance between the canopy top and ground
Waveform-LiDAR < 1.0 m error (Asner et al., 2008)
Canopy Structure
Position, extent, quantity, volume and shape of above ground vegetation in both vertical and horizontal directions
Waveform-LiDAR [TBD]
Surface roughness
Calculated as the standard deviation of measured canopy heights
Waveform-LiDAR [TBD]
Cover fraction Relative amount of photosynthetic or green vegetation (GV) and non-photosynthetic vegetation (NPV) including bark, litter, branches, etc.
Waveform-LiDAR and Imaging Spectrometer
[TBD]
Leaf area index (LAI)
Total leaf surface area exposed to incoming light energy per unit area of total ground surface beneath the plant(s)
Waveform-LiDAR and/or Imaging Spectrometer
20% relative uncertainty; 1.0 LAI absolute uncertainty (Fernandes et al., 2003)**
June 2009
* Representative values. Domain specific requirements will be determined during commissioning** Accuracy of LAI estimates are strongly dependent on canopy density and vegetation type
NEON PDR
June 2009 NEON PDR
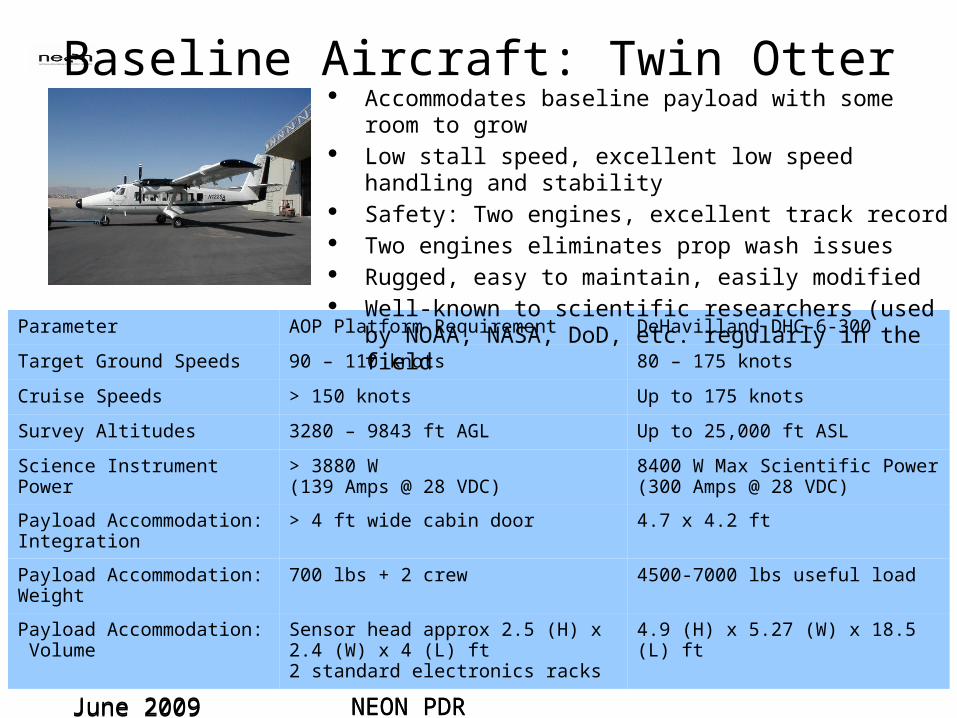
Baseline Aircraft: Twin Otter
Parameter AOP Platform Requirement DeHavilland DHC-6-300
Target Ground Speeds 90 – 110 knots 80 – 175 knots
Cruise Speeds > 150 knots Up to 175 knots
Survey Altitudes 3280 – 9843 ft AGL Up to 25,000 ft ASL
Science Instrument Power > 3880 W(139 Amps @ 28 VDC)
8400 W Max Scientific Power (300 Amps @ 28 VDC)
Payload Accommodation: Integration
> 4 ft wide cabin door 4.7 x 4.2 ft
Payload Accommodation: Weight
700 lbs + 2 crew 4500-7000 lbs useful load
Payload Accommodation: Volume
Sensor head approx 2.5 (H) x 2.4 (W) x 4 (L) ft2 standard electronics racks
4.9 (H) x 5.27 (W) x 18.5 (L) ft
June 2009
Accommodates baseline payload with some room to grow Low stall speed, excellent low speed handling and stability Safety: Two engines, excellent track record Two engines eliminates prop wash issues Rugged, easy to maintain, easily modified Well-known to scientific researchers (used by NOAA, NASA,
DoD, etc. regularly in the field
NEON PDR