click here full article translation and dispersion of...
TRANSCRIPT
Translation and dispersion of sediment
pulses in flume experiments simulating gravel
augmentation below dams
Leonard S. Sklar,1 Jessica Fadde,1,2 Jeremy G. Venditti,2,3,4 Peter Nelson,3
M. Aleksandra Wydzga,5 Yantao Cui,2 and William E. Dietrich3
Received 7 August 2008; revised 8 April 2009; accepted 2 June 2009; published 28 August 2009.
[1] The effectiveness of gravel augmentation as a river restoration strategy depends onthe extent and duration of the topographic and bed texture changes created by the pulse ofadded sediment. Previous work has emphasized the strong tendency for natural sedimentwaves to propagate primarily by dispersion; however, pulse translation may occur forgravel additions to armored channels downstream of dams where added sediments arefiner than the preexisting bed material. Here we report results of a laboratory investigationin which we created an immobile, armored bed and documented the spatial and temporalevolution of the bed topography and bed texture in response to gravel pulses ofvarious volumes and grain sizes. The introduced sediment waves evolved by acombination of translation and dispersion, with a significant translational component.Pulse translation and dispersion can be readily discerned on a graph of the time evolutionof the downstream cumulative distribution of elevation differences from the preexistingbed topography. Translation was most evident for smaller volumes of added sediment.Pulses of finer-grained gravel moved through the flume more rapidly, resulting in a largermagnitude but shorter duration of bed fining. More work is needed to understand theinfluence of bar-pool topography and flow magnitude and duration before the grain sizeand volume of gravel additions can be selected to achieve optimal patterns of pulsepropagation.
Citation: Sklar, L. S., J. Fadde, J. G. Venditti, P. Nelson, M. A. Wydzga, Y. Cui, and W. E. Dietrich (2009), Translation and
dispersion of sediment pulses in flume experiments simulating gravel augmentation below dams, Water Resour. Res., 45, W08439,
doi:10.1029/2008WR007346.
1. Introduction
[2] Aquatic ecosystems downstream of dams have beenwidely degraded by physical changes to channel conditionscaused by reductions in both the frequency and magnitudeof flood flows and the supply of coarse sediments [e.g.,Ligon et al., 1995; Schmidt and Wilcock, 2008]. Gravelaugmentation (or ‘‘replenishment’’), the artificial supply ofbed load–sized sediments to channels, is a common riverrestoration strategy intended to partially compensate for thetrapping of gravel in upstream reservoirs [e.g., Bunte, 2004;Merz and Ochikubo Chan, 2005; Elkins et al., 2007]. Thegoals of gravel augmentation projects include reducing (or‘‘fining’’) the size of bed material to improve spawning
habitat, increasing bed mobility to facilitate flushing of finesediment (i.e., sand and silt) from the surface and subsur-face, and rebuilding bar-pool topography to increase habitatdiversity [Pasternack et al., 2004; Sklar et al., 2005;Merz etal., 2006; B. Harvey et al., Key uncertainties in gravel aug-mentation: Geomorphological and biological research needsfor effective river restoration, 2005, CALFED Science Pro-gram, Sacramento, California, available at http://www.science.calwater.ca.gov/events/workshops/workshop_gravel.html,hereinafter referred to as Harvey et al., unpublished report,2005].[3] Effective design of gravel augmentation projects
requires accurate prediction of the temporal and spatialextent of beneficial changes to the channel bed and asso-ciated aquatic habitat characteristics for a given set ofdesign parameters [e.g., Wheaton et al., 2004a, 2004b].Project designers must select the volume of gravel to supplyto the channel, the grain size distribution of the sediments,the frequency and timing of augmentation, and the methodof delivery, such as placement in the channel bed or‘‘injection’’ from the channel margins [Bunte, 2004]. Proj-ect designs also need to take into account existing channelconditions such as channel geometry and slope, bed grainsize and degree of armoring, and upstream factors such asthe availability of flows capable of mobilizing bed sedi-ments and supply of both coarse and fine sediments
1Department of Geosciences, San Francisco State University, SanFrancisco, California, USA.
2Stillwater Sciences, Berkeley, California, USA.3Department of Earth and Planetary Sciences, University of California,
Berkeley, California, USA.4Now at Department of Geography, Simon Fraser University, Burnaby,
British Columbia, Canada.5Department of Earth Science, University of California, Santa Barbara,
California, USA.
Copyright 2009 by the American Geophysical Union.0043-1397/09/2008WR007346$09.00
W08439
WATER RESOURCES RESEARCH, VOL. 45, W08439, doi:10.1029/2008WR007346, 2009ClickHere
for
FullArticle
1 of 14
[Pasternack et al., 2004; Elkins et al., 2007]. At present,project designers tend to focus primarily on biologicalconsiderations and do not commonly make use of scientif-ically based analytical approaches [e.g., Pasternack et al.,2004; Wheaton et al., 2004a, 2004b] to make designchoices that optimize the use of limited budgets for pur-chasing and delivering gravel and can meet predeterminedgoals for habitat restoration [Harvey et al., unpublishedreport, 2005]. As a result, most gravel augmentation proj-ects are designed on the basis of qualitative conceptualmodels of channel dynamics and past experience with adhoc project designs. Despite some notable successes [e.g.,Merz and Setka, 2004; Elkins et al., 2007], postimplemen-tation monitoring often reveals that projects have per-formed poorly, with limited habitat restoration benefits[Lutrick, 2001; Kondolf et al., 1996; Wohl et al., 2005;Alexander and Allan, 2007].[4] Sediment supply is naturally episodic, varying across
a wide range of temporal and spatial scales. Channelsreceive pulses of sediment from many sources, includingbank failures, landslides, and debris and flood flows fromupstream tributaries. Gravel augmentation creates an artifi-cial pulse of locally enhanced sediment supply, which mightbe expected to evolve much the way natural sediment pulsesdo. Natural sediment pulses, sometimes referred to as sedi-ment waves, have received considerable attention in recentyears, including field studies [Madej, 2001; Sutherland et al.,2002; Kasai et al., 2004; Bartley and Rutherford, 2005;Hoffman and Gabet, 2007], flume experiments [Lisle et al.,1997; Cui et al., 2003a] and numerical modeling [Pickup etal., 1983;Benda andDunne, 1997a, 1997b; Lisle et al., 2001;Cui et al., 2003b; Cui and Parker, 2005; Greimann et al.,2006]. These studies have shown that sediment pulses tend todisperse in place and rarely form mobile sediment waves thattranslate downstream. Dispersion is favored over translationin particular when pulse volumes are large relative to thechannel dimensions. Large volumes of added sediment, asoccur in landslides [Sutherland et al., 2002] and debris flows[Hoffman and Gabet, 2007], tend to form temporary channel-spanning dams, ponding water upstream and steepening thewater surface downstream. This perturbation to the watersurface profile favors deposition of incoming sedimentupstream and enhanced sediment transport capacity down-stream, which together cause the topographic waveform onthe bed to remain fixed in place while being reduced inmagnitude [Cui et al., 2003a]. Dispersion of the sedimentpulse is also favored when the size distribution of addedsediment has a large spread and includes sediments coarserthan the preexisting bed, when the Froude number is high(�1), and where downstream fining occurs because ofselective transport and particle abrasion [Lisle et al., 2001].[5] Gravel augmentation pulses often do not share these
characteristics of natural sediment pulses, and thus may havea stronger tendency to evolve through translation as well asdispersion. The volumes of added sediments are typicallysmall relative to the channel dimensions and may not causesignificant change in the water surface topography. Gravelaugmentation pulses added to armored beds downstream ofdams are composed of sediments finer than the preexistingbed, and are likely to have a relatively narrow spread in thesize distribution [Harvey et al., unpublished report, 2005].Moreover, channels downstream of dams can differ in
important ways from natural conditions where sedimentpulses have been studied. For example, directly below dams,the supply of coarse sediment from upstream is negligible,and channels may lack the well-developed bar-pool topog-raphy that promotes pulse dispersion [Lisle et al., 1997,2001]. In addition, there may be many channel settingsdownstream of dams where added sediments are morecommonly mobilized under relatively low Froude numberconditions because of the combined effects of reduced floodfrequency and magnitude, reduction in channel slope, orincreased roughness from bed coarsening, vegetation en-croachment or other postdam morphologic adjustments[e.g., Williams and Wolman, 1984; Brandt, 2000].[6] Whether gravel augmentation pulses evolve by dis-
persing in place or by propagating downstream as a translat-ing wave (or some combination of the two), has significantimplications for predicting and achieving the intended aquatichabitat improvements. In contrast to the mostly negativedisturbances to the bed caused by large natural sedimentpulses [Lisle et al., 2001; Cui et al., 2003a; Bartley andRutherford, 2005], the bed fining and enhanced bed mobilitycreated by gravel augmentation is most beneficial when itpersists for a long time and affects a long reach of river[Bunte, 2004; Harvey et al., unpublished report, 2005]. Slowdispersion without significant translation may be preferableto avoid scour of salmonid redds and when unique localconditions limit the potential benefits of enhanced sedimentsupply downstream. Conversely, translation may be a desiredoutcomewhen access points for sediment delivery are limitedbut a long downstream reach could potentially benefit fromthe added gravel. In either case, the fundamental challenge isto predict the magnitude and temporal and spatial extent ofchanges to the bed for a specific set of gravel augmentationdesign parameters and preexisting channel conditions.[7] Here we report the results of a set of laboratory
experiments in which we explored the influence of pulsevolume and grain size on the evolution of bed topography andtexture during pulse propagation in a physical model of anarmored channel downstream of a dam. These experimentswere part of a larger program to investigate the response ofgravel bedded channels to episodic sediment supply. In thispaper we focus on the case of a planar, immobile armored bedsubjected to pulses of finer gravel under constant flowconditions. We present a new metric for quantifying pulsetranslation and dispersion and document significant pulsetranslation, particularly for small pulse volumes. We thendiscuss potential implications of these experimental resultsfor design of gravel augmentation projects and the challengesin scaling up from the laboratory to the field.
2. Experimental Methods
[8] The gravel augmentation experiments were conductedin a 28 m long, 0.86 m wide, 0.8 m deep flume, located at theUniversity of California, Berkeley, Richmond Field Station.Water is recirculated in the flume while sediment is fed at theupstream end by three separate motor-driven auger feeders.Sediments exit the flume into a tipping bucket-type bed loadtrap suspended from a load cell that measures the weight ofaccumulated submerged bed load material; the flux out of theflume is calculated from the rate of change of sediment massover time. At regular intervals, sediments are tipped into a
2 of 14
W08439 SKLAR ET AL.: TRANSLATION AND DISPERSION OF SEDIMENT PULSES W08439
submerged hopper and pumped out to a dumpster, and are notrecirculated. The flume bottom has a slope of 1%, but forthese experiments was filled with a gravel wedge to create aninitial bed slope of 0.5%. The bed was composed of aunimodal, lognormally distributed gravel mixture with amedian size of 8 mm, a geometric standard deviation of 2,and was truncated at 2 and 32 mm. In the experiments, thebed slope was allowed to evolve through differential erosionand deposition.[9] The experiments were designed to focus on the influ-
ence of sediment supply and grain-to-grain interactions ongravel augmentation pulse evolution and bed texture re-sponse. We used a low width-to-depth ratio (�4) to suppressbar development and maintain an approximately planar bedon which pulse evolution could occur. We maintained aconstant discharge (0.205 m3/s) to focus on the effect ofspatial and temporal variations in sediment supply withoutthe complications introduced by hydrographs. The Froudenumber was within the subcritical regime (0.6 to 0.7), and theflowwas fully turbulent in terms of the Reynolds number andhydraulically rough. The hydraulic conditions were selectedto maintain approximately 1:4 Froude scaling with prototypefield channels.[10] We began the experiments by recreating the sequence
of bed texture changes that typically follow dam construc-tion, by shifting from active bed load transport to an immo-bile armored bed solely by eliminating the sediment supply.This required a shear stress well in excess of the threshold ofmotion for the active bed, and a wide grain size distribution toprovide sufficient coarse grains to form the immobile armor.We first established an equilibrium active bed by feedingthe initial size distribution at 120 kg/h for 16 h, and thensequentially reduced the sediment supply to the channel infour steps, to feed rates of 80, 47, and finally 0 kg/h. At eachfeed rate, the supply was held constant until the flux at thedownstream end of the flume matched the upstream supplyrate and we observed no further changes in the bed slope orbed texture. With the elimination of sediment supply, sedi-ment flux exiting the channel dropped to 1–2 kg/h, and thebed slope declined to 0.4%. The median grain size of thearmored bed was �12.5 mm, creating an armoring ratio of�1.6, which is comparable to some field settings with dam-impaired sediment supply [e.g., Lisle et al., 2000]. Detailedanalysis of the response of the bed surface to the steppedreduction of sediment supply is reported by Nelson et al.[2009].[11] Once the immobile armored bed was established,
we simulated a sequence of gravel augmentation pulses toinvestigate the influence of pulse grain size and volume onpulse evolution and bed texture response. Here we focus onfour single-pulse runs in which we varied grain size andvolume independently. To explore the effect of variations inpulse volume we used two volumes that differed by a factorof 4. Larger pulses corresponded to the volume required tocover the entire flume bed with a layer of sediment one bedmaterial D50 diameter thick, for the 8 mm median diameterof the predam equilibrium sediment supply. This corre-sponded to a pulse mass of 270 kg. The smaller pulse volumehad a mass of 68 kg. These two pulse volumes are referred tohereafter as the ‘‘large’’ and ‘‘small’’ pulses, respectively.[12] To investigate the effect of the grain size of added
sediments on pulse evolution, we used two well-sorted size
distributions, with median diameters that differed by a factorof about 3. The ‘‘coarse’’ distribution had a median diam-eter of 8 mm, the same as the D50 of the predam equilibriumfeed distribution and representative of the intended targetdistribution for restored spawning conditions. The ‘‘fine’’distribution had a median diameter of 2.8 mm, which wasselected to test the hypothesis that additions of fine gravelcan mobilize static armor [Venditti et al., 2005]. For eachpulse, we ran the flume for a time sufficient to allow thepulse mass to move completely through the flume, and forthe bed to return to an immobile armored state where theflux out at the downstream end was reduced to a negligiblevalue.[13] Table 1 lists the experimental conditions for each
run, encompassing the four combinations of pulse volumeand grain size. Note that we report results taken from tworeplicate small-volume, fine-grained pulses (runs 9 and 21d),because the frequency of successful topographic scans forrun 9 was not sufficient to capture the pulse evolution. Notealso that we have retained the original run numbers forconsistency with papers where results of other concurrentexperiments will be reported; those runs focused on effect ofsupply on bed texture during armoring [Nelson et al., 2009],lateral sorting and patch development [Nelson et al., 2008],and infiltration and flushing of fine sediment [Wydzga etal., 2006].[14] Each pulse of added gravel was painted a different
color to facilitate documentation of the pulse movementand to distinguish added sediments from the preexistingbed material in samples of the bed surface and the flux outthe downstream end of the flume. The acrylic paint andsediments were tumbled together in a cement mixer untildry to prevent grains from sticking together. Sedimentsused to create the initial bed were supplied to the flume bythe motorized sediment feeders, but for the gravel aug-mentation pulses we fed the sediments by hand at 160 kg/h,at a location 5 m downstream of the flume entrance toavoid the zone of flow acceleration.[15] The flume is equipped with a computer-controlled,
motorized instrument cart, which moves along horizontalrails supported by an independent frame. We measured theevolution of the bed and water surface topography duringactive flow with an echo sounder and an ultrasonic distancemeter, respectively. Both devices have a vertical precisionof ±1 mm in this application. Topographic scans of the bedand water surface were made as frequently as possible; acomplete scan took 8 min however most scans were spacedabout 50 min apart. Sediment flux out of the flume wasmonitored continuously during the experiments at 0.1 Hz[Venditti et al., 2005]. We also hand mapped the position ofthe leading edge and the tail of the pulse of painted grainsthrough time.[16] We used two techniques to measure the bed surface
grain size distribution during the experiments. First, wehand collected samples of bed material at five locationsalong the flume (5, 10, 15, 20 and 25 m downstream of flumeentrance) at the beginning and end of each experimental run.To make sure we collected all grains exposed at the surface,we placed a piece of cardboard with a 25 by 25 cm squareopening cut out in the center of the flume. We then lightlyspray painted the grains and removed each partially paintedgrain by hand and with an adhesive coated cloth. The grains
W08439 SKLAR ET AL.: TRANSLATION AND DISPERSION OF SEDIMENT PULSES
3 of 14
W08439
removed were rinsed to remove any adhesive, dried andsieved to obtain an area-by-weight grain size distribution,which was converted to a volume-by-weight using themethod of Kellerhals and Bray [1971]. Second, to avoiddisturbing the bed and potentially affecting the experimen-tal outcome, grain size distributions were measured frompoint counts on digital photographs taken during theexperimental runs. The camera was mounted on the instru-ment cart and each photo was taken at the same elevationabove the bed, which we controlled using a laser distancescanner. All photos were calibrated using the distancebetween the flume walls. Point counts of grain diameterswere made using a 100-point grid superimposed on thecenter 75 cm of each image. We estimated radial distortionin the images to be insignificant, on the order of 1 mmacross the measurement area. These point counts are similarto aWolman count, which produces a grain size distributionsimilar to a volume by weight [Kellerhals and Bray, 1971;Bunte and Abt, 2001]. Comparisons between photo resultsand the volume-by-weight converted hand samples showedagreement within detection limits [Fadde, 2007]. Replicatepoint counts on seven photos by three different individualsshowed that the 95% confidence interval around the mediandiameter was less than 0.2 mm.
3. Conceptual Framework for Pulse Evolution
[17] Sediment waves in the field can be difficult toidentify, much less quantify [e.g., Lisle et al., 2001], in partbecause prepulse conditions are rarely known well andbecause small topographic and grain size disturbances aredifficult to measure reliably. Laboratory experiments allowcontrol over initial and boundary conditions and facilitatemore detailed and frequent measurements, and are morereadily compared to numerical simulations [Lisle et al.,1997; Cui et al., 2003a]. Lisle et al. [1997] providedgraphical illustrations of translation, dispersion and a mixof both, in sediment waves with an upstream supply, andshowed that a downstream progression of bed elevation riseand fall is not diagnostic of pulse translation or dispersion.With field data, they quantified pulse evolution using the
ratio of the height to length of the topographic deviationfrom preexisting conditions, and showed that in nearly allcases the wave aspect ratio declines over time. Here wedefine translation as the downstream migration of both thecenter and trailing edge of the pulse volume and quantifythe extent of pulse translation and dispersion by comparingthe relative time rates of change of the location of the centerof the pulse and the longitudinal spread of the topographicwave form.[18] Figure 1a shows a hypothetical pulse that evolves
purely by translation. The pulse waveform was generatedusing a gamma function for the spatial distribution of bedelevation [Walpole and Myers, 1978]. Figure 1b shows thedownstream-cumulative distribution of bed elevationchanges from the prepulse bed topography, for the case ofpure translation depicted in Figure 1a. Figures 1a and 1bshow a translational pulse that marches downstream at aconstant speed and exits the flume. Because the waveformitself is not altered by downstream translation, the slope ofthe curve in the cumulative plot (Figure 1b) does notchange. This can be considered diagnostic of pure transla-tional pulse evolution. Note that because there is no upstreamsediment supply, and we assume in this illustration that thereis no erosion of the underlying prepulse bed, the total areaunder the curve remains constant until the pulse begins to exitthe flume.[19] In contrast, Figure 1c shows a dominantly dispersive
wave, again generated with a gamma function. The pulseappears stationary and gradually fades away as sediment istransported downstream and out of the flume. Figure 1d showsthe cumulative distribution of the elevation for this dispersivepulse. Unlike the case of pure translation (Figure 1b) thecumulative curve for the dispersive case rotates clockwiseand fades as the pulse exits the flume. This rotation of thecumulative curve can be considered diagnostic of dispersion-dominated pulse evolution.[20] Most sediment pulses have both translational and
dispersive properties [Lisle et al., 2001]. Figure 1e shows anexample of a pulse that evolves with simultaneous transla-tion and dispersion, with the cumulative distribution shownin Figure 1f. Combining the diagnostic properties of the two
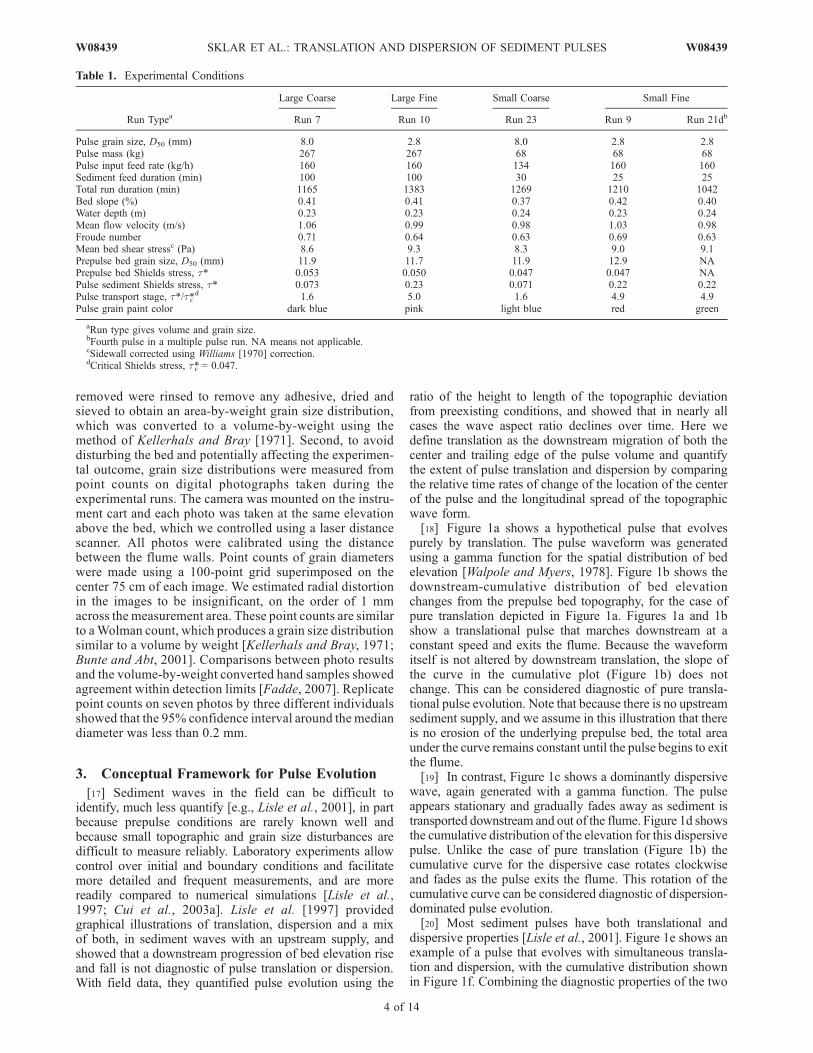
Table 1. Experimental Conditions
Run Typea
Large Coarse Large Fine Small Coarse Small Fine
Run 7 Run 10 Run 23 Run 9 Run 21db
Pulse grain size, D50 (mm) 8.0 2.8 8.0 2.8 2.8Pulse mass (kg) 267 267 68 68 68Pulse input feed rate (kg/h) 160 160 134 160 160Sediment feed duration (min) 100 100 30 25 25Total run duration (min) 1165 1383 1269 1210 1042Bed slope (%) 0.41 0.41 0.37 0.42 0.40Water depth (m) 0.23 0.23 0.24 0.23 0.24Mean flow velocity (m/s) 1.06 0.99 0.98 1.03 0.98Froude number 0.71 0.64 0.63 0.69 0.63Mean bed shear stressc (Pa) 8.6 9.3 8.3 9.0 9.1Prepulse bed grain size, D50 (mm) 11.9 11.7 11.9 12.9 NAPrepulse bed Shields stress, t* 0.053 0.050 0.047 0.047 NAPulse sediment Shields stress, t* 0.073 0.23 0.071 0.22 0.22Pulse transport stage, t*/t*c
d 1.6 5.0 1.6 4.9 4.9Pulse grain paint color dark blue pink light blue red green
aRun type gives volume and grain size.bFourth pulse in a multiple pulse run. NA means not applicable.cSidewall corrected using Williams [1970] correction.dCritical Shields stress, t*c = 0.047.
4 of 14
W08439 SKLAR ET AL.: TRANSLATION AND DISPERSION OF SEDIMENT PULSES W08439
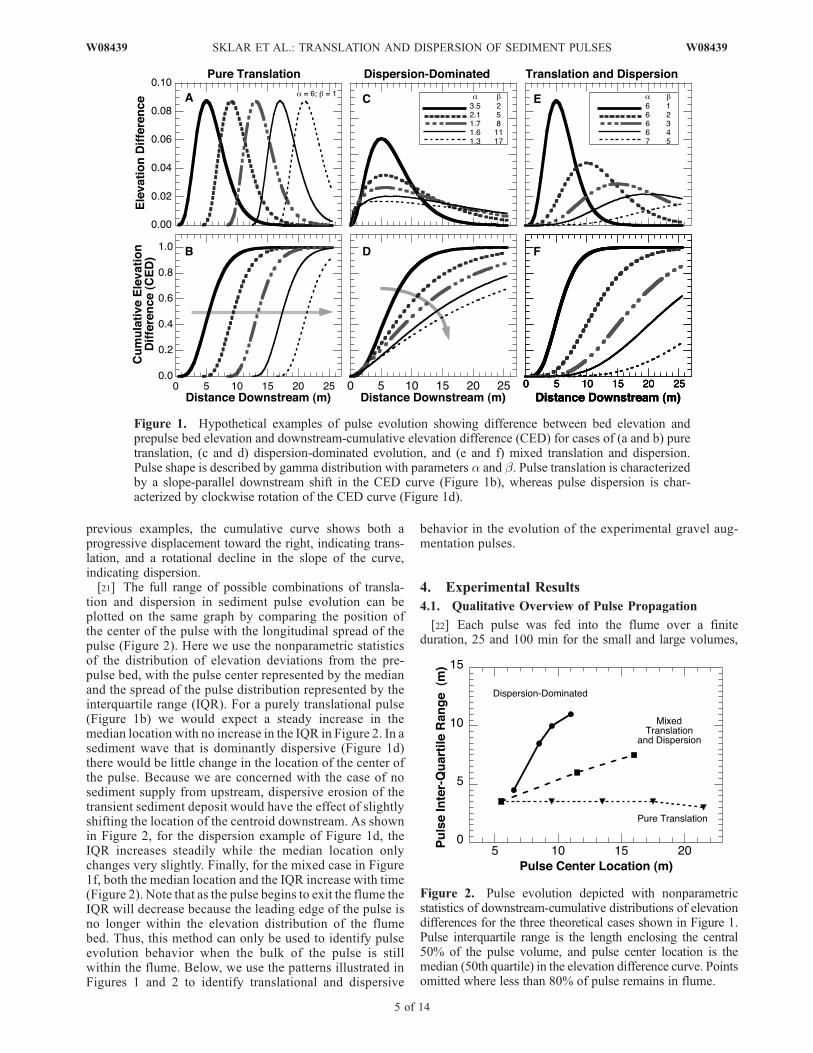
previous examples, the cumulative curve shows both aprogressive displacement toward the right, indicating trans-lation, and a rotational decline in the slope of the curve,indicating dispersion.[21] The full range of possible combinations of transla-
tion and dispersion in sediment pulse evolution can beplotted on the same graph by comparing the position ofthe center of the pulse with the longitudinal spread of thepulse (Figure 2). Here we use the nonparametric statisticsof the distribution of elevation deviations from the pre-pulse bed, with the pulse center represented by the medianand the spread of the pulse distribution represented by theinterquartile range (IQR). For a purely translational pulse(Figure 1b) we would expect a steady increase in themedian location with no increase in the IQR in Figure 2. In asediment wave that is dominantly dispersive (Figure 1d)there would be little change in the location of the center ofthe pulse. Because we are concerned with the case of nosediment supply from upstream, dispersive erosion of thetransient sediment deposit would have the effect of slightlyshifting the location of the centroid downstream. As shownin Figure 2, for the dispersion example of Figure 1d, theIQR increases steadily while the median location onlychanges very slightly. Finally, for the mixed case in Figure1f, both the median location and the IQR increase with time(Figure 2). Note that as the pulse begins to exit the flume theIQR will decrease because the leading edge of the pulse isno longer within the elevation distribution of the flumebed. Thus, this method can only be used to identify pulseevolution behavior when the bulk of the pulse is stillwithin the flume. Below, we use the patterns illustrated inFigures 1 and 2 to identify translational and dispersive
behavior in the evolution of the experimental gravel aug-mentation pulses.
4. Experimental Results
4.1. Qualitative Overview of Pulse Propagation
[22] Each pulse was fed into the flume over a finiteduration, 25 and 100 min for the small and large volumes,
Figure 1. Hypothetical examples of pulse evolution showing difference between bed elevation andprepulse bed elevation and downstream-cumulative elevation difference (CED) for cases of (a and b) puretranslation, (c and d) dispersion-dominated evolution, and (e and f) mixed translation and dispersion.Pulse shape is described by gamma distribution with parameters a and b. Pulse translation is characterizedby a slope-parallel downstream shift in the CED curve (Figure 1b), whereas pulse dispersion is char-acterized by clockwise rotation of the CED curve (Figure 1d).
Figure 2. Pulse evolution depicted with nonparametricstatistics of downstream-cumulative distributions of elevationdifferences for the three theoretical cases shown in Figure 1.Pulse interquartile range is the length enclosing the central50% of the pulse volume, and pulse center location is themedian (50th quartile) in the elevation difference curve. Pointsomitted where less than 80% of pulse remains in flume.
W08439 SKLAR ET AL.: TRANSLATION AND DISPERSION OF SEDIMENT PULSES
5 of 14
W08439
respectively (Table 1). A clearly visible leading edge of thepulse of painted grains began migrating downstream imme-diately after the feed began. Although the added sedimentswere spread evenly across the flume width during the feed,the leading edge advanced most rapidly along the centerlineof the flume, forming a convex downstream facing front ofaltered bed color, texture and topography. The pulse spreadacross the width of the flume, more completely for theslower moving coarse (8 mm) gravel than for the fine(2.8 mm) gravel. After the sediment feed was complete,transport of material from the input location thinned theaccumulated deposit of painted gravel, eventually reexpos-ing the preexisting coarse armor. The tail of the pulse thenvisibly migrated downstream, distinguishable as the
upstreammost zone with active transport of the paintedadded gravel. The added gravel caused mobilization of thepreviously static armor, resulting in scour of the armor layerand net degradation of the bed upstream of the pulse tail[Venditti et al., 2005]. Eventually, each of the pulse com-ponents, the leading edge, the central portion of the pulsemass, and the pulse tail, exited the flume. Sediment trans-port continued at a declining rate until returning to anegligible level at the conclusion of the run.[23] In the following sections, we provide a detailed
quantitative description of the pulse dynamics, focusing firston the topographic evolution of the bed, as revealed by theecho sounder scans, then on the celerity of the leading edgeand tails of the pulses, and finally on the pattern of changes ingrain size distribution of the bed surface material.
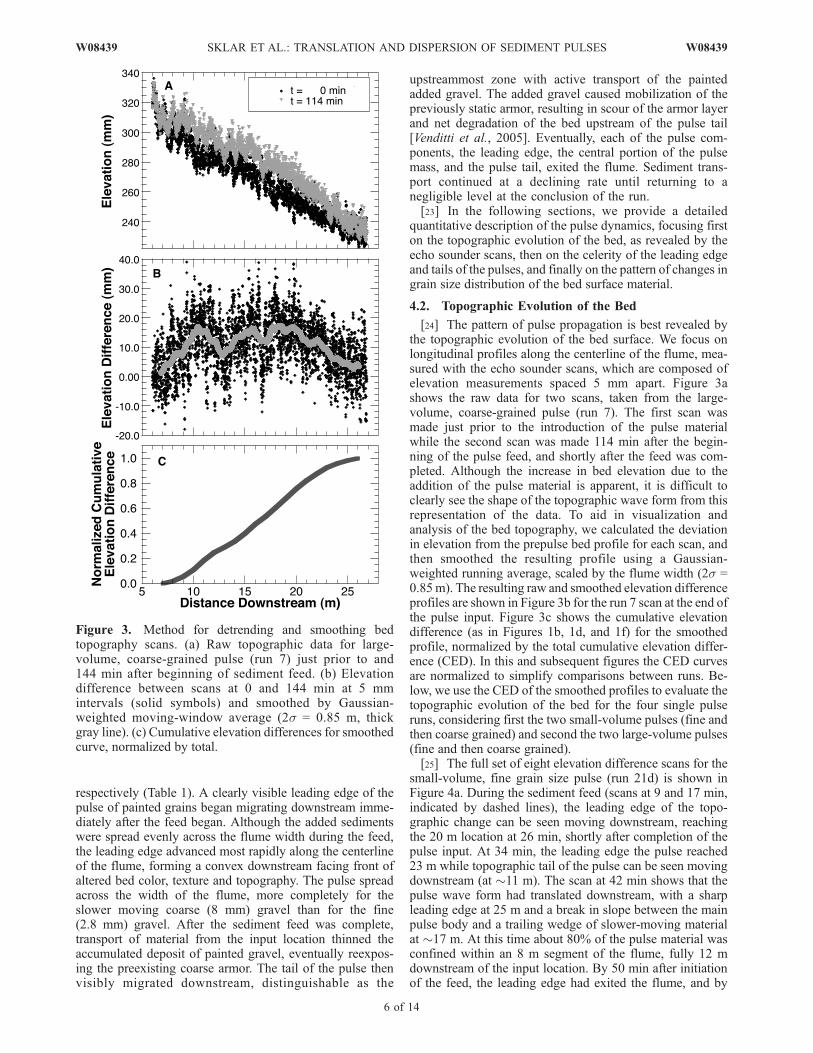
4.2. Topographic Evolution of the Bed
[24] The pattern of pulse propagation is best revealed bythe topographic evolution of the bed surface. We focus onlongitudinal profiles along the centerline of the flume, mea-sured with the echo sounder scans, which are composed ofelevation measurements spaced 5 mm apart. Figure 3ashows the raw data for two scans, taken from the large-volume, coarse-grained pulse (run 7). The first scan wasmade just prior to the introduction of the pulse materialwhile the second scan was made 114 min after the begin-ning of the pulse feed, and shortly after the feed was com-pleted. Although the increase in bed elevation due to theaddition of the pulse material is apparent, it is difficult toclearly see the shape of the topographic wave form from thisrepresentation of the data. To aid in visualization andanalysis of the bed topography, we calculated the deviationin elevation from the prepulse bed profile for each scan, andthen smoothed the resulting profile using a Gaussian-weighted running average, scaled by the flume width (2s =0.85m). The resulting raw and smoothed elevation differenceprofiles are shown in Figure 3b for the run 7 scan at the end ofthe pulse input. Figure 3c shows the cumulative elevationdifference (as in Figures 1b, 1d, and 1f) for the smoothedprofile, normalized by the total cumulative elevation differ-ence (CED). In this and subsequent figures the CED curvesare normalized to simplify comparisons between runs. Be-low, we use the CED of the smoothed profiles to evaluate thetopographic evolution of the bed for the four single pulseruns, considering first the two small-volume pulses (fine andthen coarse grained) and second the two large-volume pulses(fine and then coarse grained).[25] The full set of eight elevation difference scans for the
small-volume, fine grain size pulse (run 21d) is shown inFigure 4a. During the sediment feed (scans at 9 and 17 min,indicated by dashed lines), the leading edge of the topo-graphic change can be seen moving downstream, reachingthe 20 m location at 26 min, shortly after completion of thepulse input. At 34 min, the leading edge the pulse reached23 m while topographic tail of the pulse can be seen movingdownstream (at �11 m). The scan at 42 min shows that thepulse wave form had translated downstream, with a sharpleading edge at 25 m and a break in slope between the mainpulse body and a trailing wedge of slower-moving materialat �17 m. At this time about 80% of the pulse material wasconfined within an 8 m segment of the flume, fully 12 mdownstream of the input location. By 50 min after initiationof the feed, the leading edge had exited the flume, and by
Figure 3. Method for detrending and smoothing bedtopography scans. (a) Raw topographic data for large-volume, coarse-grained pulse (run 7) just prior to and144 min after beginning of sediment feed. (b) Elevationdifference between scans at 0 and 144 min at 5 mmintervals (solid symbols) and smoothed by Gaussian-weighted moving-window average (2s = 0.85 m, thickgray line). (c) Cumulative elevation differences for smoothedcurve, normalized by total.
6 of 14
W08439 SKLAR ET AL.: TRANSLATION AND DISPERSION OF SEDIMENT PULSES W08439
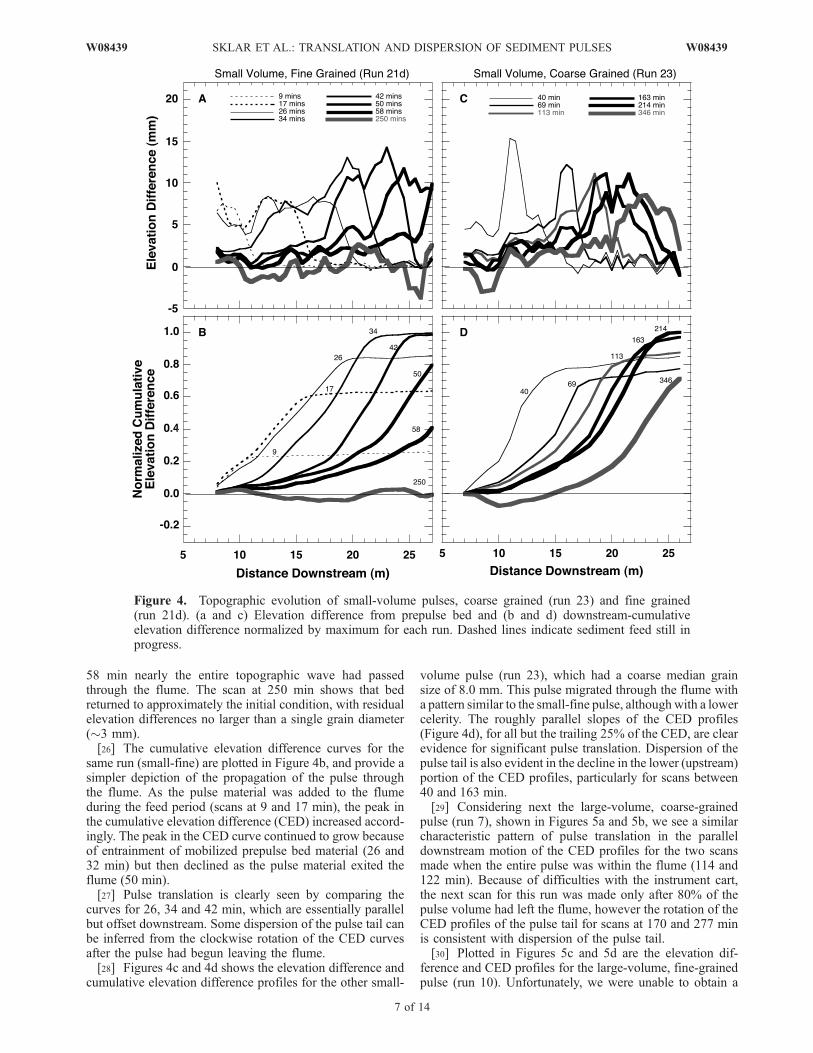
58 min nearly the entire topographic wave had passedthrough the flume. The scan at 250 min shows that bedreturned to approximately the initial condition, with residualelevation differences no larger than a single grain diameter(�3 mm).[26] The cumulative elevation difference curves for the
same run (small-fine) are plotted in Figure 4b, and provide asimpler depiction of the propagation of the pulse throughthe flume. As the pulse material was added to the flumeduring the feed period (scans at 9 and 17 min), the peak inthe cumulative elevation difference (CED) increased accord-ingly. The peak in the CED curve continued to grow becauseof entrainment of mobilized prepulse bed material (26 and32 min) but then declined as the pulse material exited theflume (50 min).[27] Pulse translation is clearly seen by comparing the
curves for 26, 34 and 42 min, which are essentially parallelbut offset downstream. Some dispersion of the pulse tail canbe inferred from the clockwise rotation of the CED curvesafter the pulse had begun leaving the flume.[28] Figures 4c and 4d shows the elevation difference and
cumulative elevation difference profiles for the other small-
volume pulse (run 23), which had a coarse median grainsize of 8.0 mm. This pulse migrated through the flume witha pattern similar to the small-fine pulse, althoughwith a lowercelerity. The roughly parallel slopes of the CED profiles(Figure 4d), for all but the trailing 25% of the CED, are clearevidence for significant pulse translation. Dispersion of thepulse tail is also evident in the decline in the lower (upstream)portion of the CED profiles, particularly for scans between40 and 163 min.[29] Considering next the large-volume, coarse-grained
pulse (run 7), shown in Figures 5a and 5b, we see a similarcharacteristic pattern of pulse translation in the paralleldownstream motion of the CED profiles for the two scansmade when the entire pulse was within the flume (114 and122 min). Because of difficulties with the instrument cart,the next scan for this run was made only after 80% of thepulse volume had left the flume, however the rotation of theCED profiles of the pulse tail for scans at 170 and 277 minis consistent with dispersion of the pulse tail.[30] Plotted in Figures 5c and 5d are the elevation dif-
ference and CED profiles for the large-volume, fine-grainedpulse (run 10). Unfortunately, we were unable to obtain a
Figure 4. Topographic evolution of small-volume pulses, coarse grained (run 23) and fine grained(run 21d). (a and c) Elevation difference from prepulse bed and (b and d) downstream-cumulativeelevation difference normalized by maximum for each run. Dashed lines indicate sediment feed still inprogress.
W08439 SKLAR ET AL.: TRANSLATION AND DISPERSION OF SEDIMENT PULSES
7 of 14
W08439
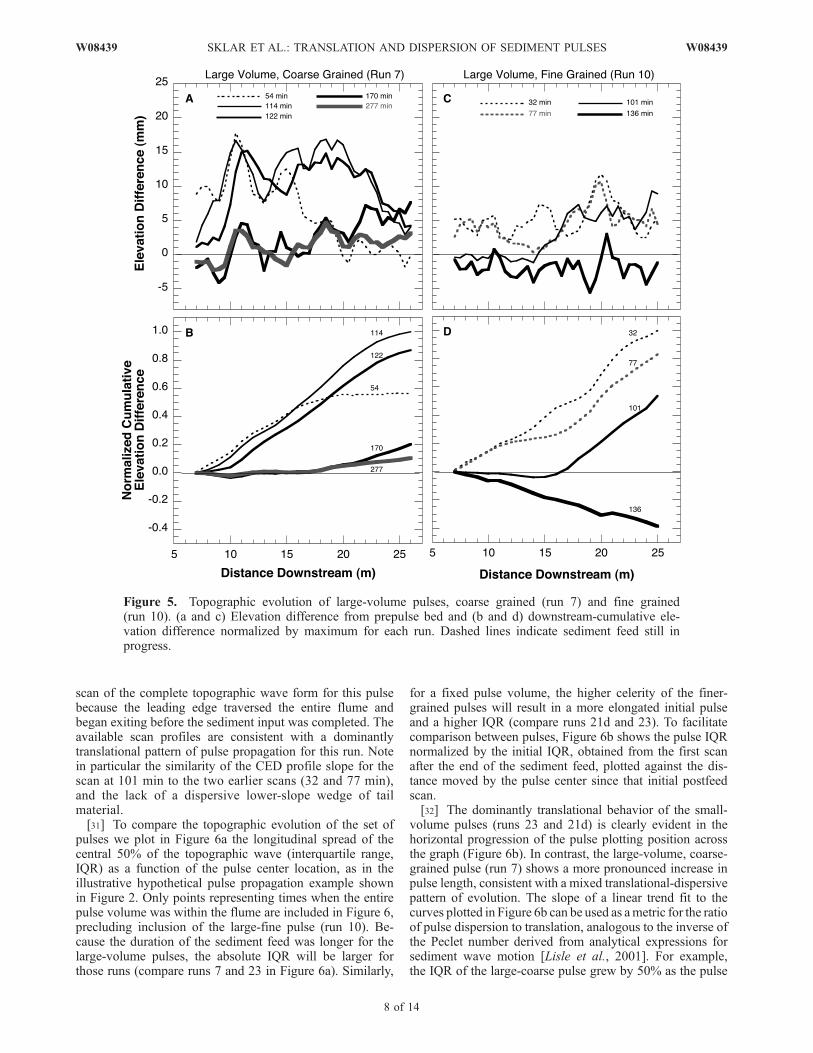
scan of the complete topographic wave form for this pulsebecause the leading edge traversed the entire flume andbegan exiting before the sediment input was completed. Theavailable scan profiles are consistent with a dominantlytranslational pattern of pulse propagation for this run. Notein particular the similarity of the CED profile slope for thescan at 101 min to the two earlier scans (32 and 77 min),and the lack of a dispersive lower-slope wedge of tailmaterial.[31] To compare the topographic evolution of the set of
pulses we plot in Figure 6a the longitudinal spread of thecentral 50% of the topographic wave (interquartile range,IQR) as a function of the pulse center location, as in theillustrative hypothetical pulse propagation example shownin Figure 2. Only points representing times when the entirepulse volume was within the flume are included in Figure 6,precluding inclusion of the large-fine pulse (run 10). Be-cause the duration of the sediment feed was longer for thelarge-volume pulses, the absolute IQR will be larger forthose runs (compare runs 7 and 23 in Figure 6a). Similarly,
for a fixed pulse volume, the higher celerity of the finer-grained pulses will result in a more elongated initial pulseand a higher IQR (compare runs 21d and 23). To facilitatecomparison between pulses, Figure 6b shows the pulse IQRnormalized by the initial IQR, obtained from the first scanafter the end of the sediment feed, plotted against the dis-tance moved by the pulse center since that initial postfeedscan.[32] The dominantly translational behavior of the small-
volume pulses (runs 23 and 21d) is clearly evident in thehorizontal progression of the pulse plotting position acrossthe graph (Figure 6b). In contrast, the large-volume, coarse-grained pulse (run 7) shows a more pronounced increase inpulse length, consistent with a mixed translational-dispersivepattern of evolution. The slope of a linear trend fit to thecurves plotted in Figure 6b can be used as ametric for the ratioof pulse dispersion to translation, analogous to the inverse ofthe Peclet number derived from analytical expressions forsediment wave motion [Lisle et al., 2001]. For example,the IQR of the large-coarse pulse grew by 50% as the pulse
Figure 5. Topographic evolution of large-volume pulses, coarse grained (run 7) and fine grained(run 10). (a and c) Elevation difference from prepulse bed and (b and d) downstream-cumulative ele-vation difference normalized by maximum for each run. Dashed lines indicate sediment feed still inprogress.
8 of 14
W08439 SKLAR ET AL.: TRANSLATION AND DISPERSION OF SEDIMENT PULSES W08439
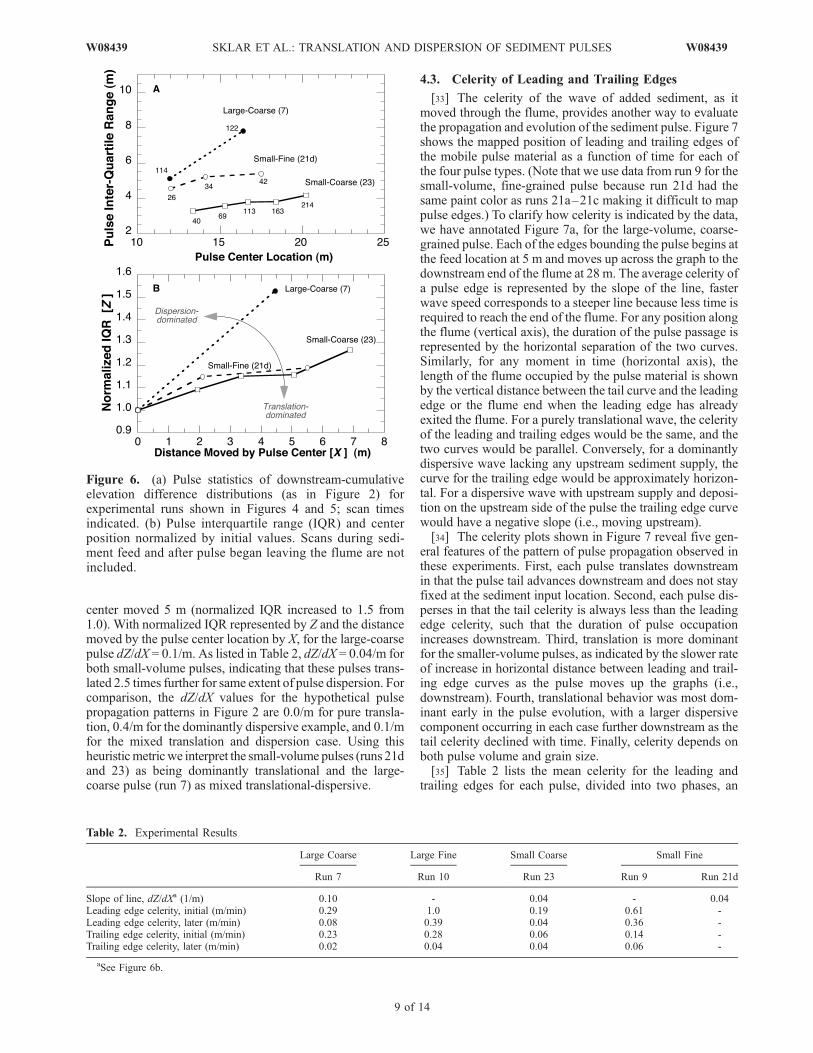
center moved 5 m (normalized IQR increased to 1.5 from1.0). With normalized IQR represented by Z and the distancemoved by the pulse center location by X, for the large-coarsepulse dZ/dX = 0.1/m. As listed in Table 2, dZ/dX = 0.04/m forboth small-volume pulses, indicating that these pulses trans-lated 2.5 times further for same extent of pulse dispersion. Forcomparison, the dZ/dX values for the hypothetical pulsepropagation patterns in Figure 2 are 0.0/m for pure transla-tion, 0.4/m for the dominantly dispersive example, and 0.1/mfor the mixed translation and dispersion case. Using thisheuristicmetricwe interpret the small-volume pulses (runs 21dand 23) as being dominantly translational and the large-coarse pulse (run 7) as mixed translational-dispersive.
4.3. Celerity of Leading and Trailing Edges
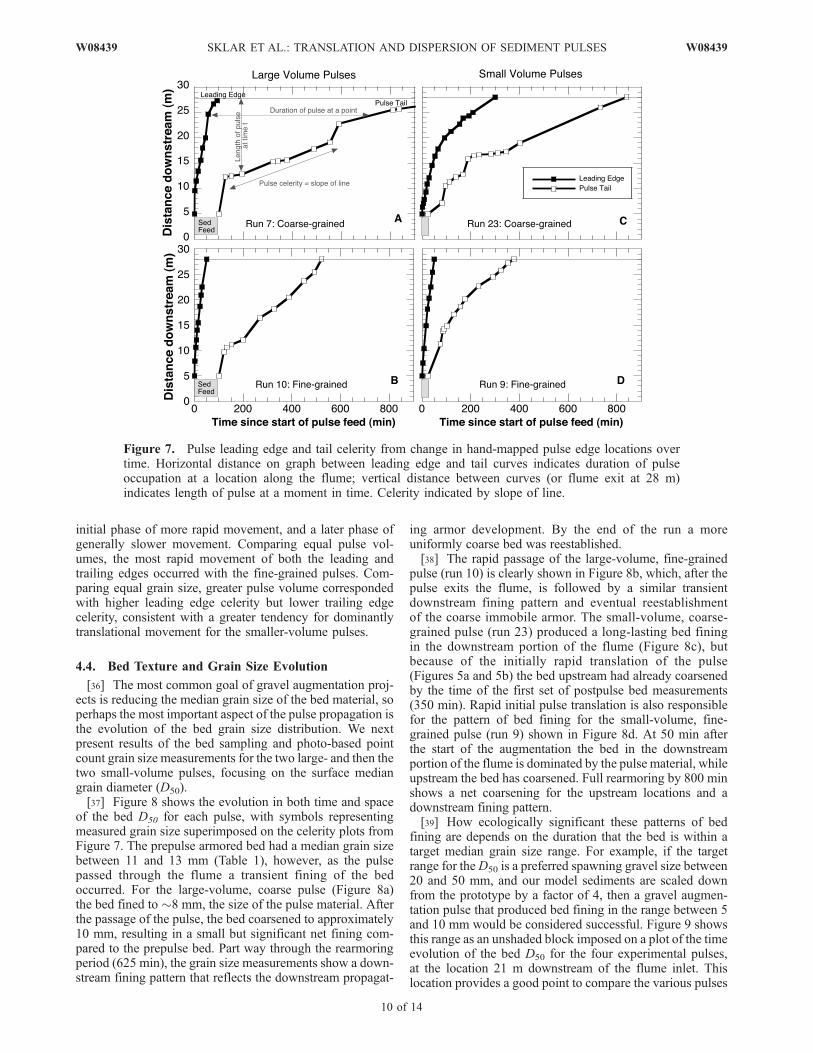
[33] The celerity of the wave of added sediment, as itmoved through the flume, provides another way to evaluatethe propagation and evolution of the sediment pulse. Figure 7shows the mapped position of leading and trailing edges ofthe mobile pulse material as a function of time for each ofthe four pulse types. (Note that we use data from run 9 for thesmall-volume, fine-grained pulse because run 21d had thesame paint color as runs 21a–21c making it difficult to mappulse edges.) To clarify how celerity is indicated by the data,we have annotated Figure 7a, for the large-volume, coarse-grained pulse. Each of the edges bounding the pulse begins atthe feed location at 5 m and moves up across the graph to thedownstream end of the flume at 28 m. The average celerity ofa pulse edge is represented by the slope of the line, fasterwave speed corresponds to a steeper line because less time isrequired to reach the end of the flume. For any position alongthe flume (vertical axis), the duration of the pulse passage isrepresented by the horizontal separation of the two curves.Similarly, for any moment in time (horizontal axis), thelength of the flume occupied by the pulse material is shownby the vertical distance between the tail curve and the leadingedge or the flume end when the leading edge has alreadyexited the flume. For a purely translational wave, the celerityof the leading and trailing edges would be the same, and thetwo curves would be parallel. Conversely, for a dominantlydispersive wave lacking any upstream sediment supply, thecurve for the trailing edge would be approximately horizon-tal. For a dispersive wave with upstream supply and deposi-tion on the upstream side of the pulse the trailing edge curvewould have a negative slope (i.e., moving upstream).[34] The celerity plots shown in Figure 7 reveal five gen-
eral features of the pattern of pulse propagation observed inthese experiments. First, each pulse translates downstreamin that the pulse tail advances downstream and does not stayfixed at the sediment input location. Second, each pulse dis-perses in that the tail celerity is always less than the leadingedge celerity, such that the duration of pulse occupationincreases downstream. Third, translation is more dominantfor the smaller-volume pulses, as indicated by the slower rateof increase in horizontal distance between leading and trail-ing edge curves as the pulse moves up the graphs (i.e.,downstream). Fourth, translational behavior was most dom-inant early in the pulse evolution, with a larger dispersivecomponent occurring in each case further downstream as thetail celerity declined with time. Finally, celerity depends onboth pulse volume and grain size.[35] Table 2 lists the mean celerity for the leading and
trailing edges for each pulse, divided into two phases, an
Figure 6. (a) Pulse statistics of downstream-cumulativeelevation difference distributions (as in Figure 2) forexperimental runs shown in Figures 4 and 5; scan timesindicated. (b) Pulse interquartile range (IQR) and centerposition normalized by initial values. Scans during sedi-ment feed and after pulse began leaving the flume are notincluded.
Table 2. Experimental Results
Large Coarse Large Fine Small Coarse Small Fine
Run 7 Run 10 Run 23 Run 9 Run 21d
Slope of line, dZ/dXa (1/m) 0.10 - 0.04 - 0.04Leading edge celerity, initial (m/min) 0.29 1.0 0.19 0.61 -Leading edge celerity, later (m/min) 0.08 0.39 0.04 0.36 -Trailing edge celerity, initial (m/min) 0.23 0.28 0.06 0.14 -Trailing edge celerity, later (m/min) 0.02 0.04 0.04 0.06 -
aSee Figure 6b.
W08439 SKLAR ET AL.: TRANSLATION AND DISPERSION OF SEDIMENT PULSES
9 of 14
W08439
initial phase of more rapid movement, and a later phase ofgenerally slower movement. Comparing equal pulse vol-umes, the most rapid movement of both the leading andtrailing edges occurred with the fine-grained pulses. Com-paring equal grain size, greater pulse volume correspondedwith higher leading edge celerity but lower trailing edgecelerity, consistent with a greater tendency for dominantlytranslational movement for the smaller-volume pulses.
4.4. Bed Texture and Grain Size Evolution
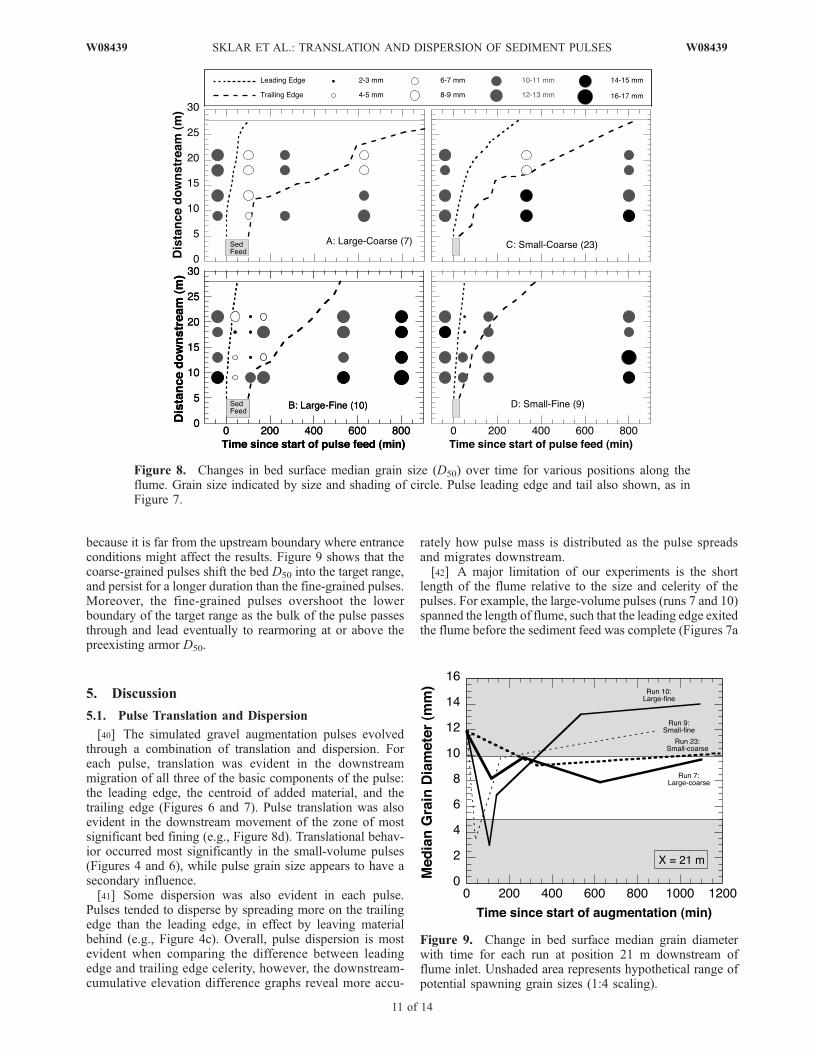
[36] The most common goal of gravel augmentation proj-ects is reducing the median grain size of the bed material, soperhaps the most important aspect of the pulse propagation isthe evolution of the bed grain size distribution. We nextpresent results of the bed sampling and photo-based pointcount grain size measurements for the two large- and then thetwo small-volume pulses, focusing on the surface mediangrain diameter (D50).[37] Figure 8 shows the evolution in both time and space
of the bed D50 for each pulse, with symbols representingmeasured grain size superimposed on the celerity plots fromFigure 7. The prepulse armored bed had a median grain sizebetween 11 and 13 mm (Table 1), however, as the pulsepassed through the flume a transient fining of the bedoccurred. For the large-volume, coarse pulse (Figure 8a)the bed fined to �8 mm, the size of the pulse material. Afterthe passage of the pulse, the bed coarsened to approximately10 mm, resulting in a small but significant net fining com-pared to the prepulse bed. Part way through the rearmoringperiod (625 min), the grain size measurements show a down-stream fining pattern that reflects the downstream propagat-
ing armor development. By the end of the run a moreuniformly coarse bed was reestablished.[38] The rapid passage of the large-volume, fine-grained
pulse (run 10) is clearly shown in Figure 8b, which, after thepulse exits the flume, is followed by a similar transientdownstream fining pattern and eventual reestablishmentof the coarse immobile armor. The small-volume, coarse-grained pulse (run 23) produced a long-lasting bed finingin the downstream portion of the flume (Figure 8c), butbecause of the initially rapid translation of the pulse(Figures 5a and 5b) the bed upstream had already coarsenedby the time of the first set of postpulse bed measurements(350 min). Rapid initial pulse translation is also responsiblefor the pattern of bed fining for the small-volume, fine-grained pulse (run 9) shown in Figure 8d. At 50 min afterthe start of the augmentation the bed in the downstreamportion of the flume is dominated by the pulse material, whileupstream the bed has coarsened. Full rearmoring by 800 minshows a net coarsening for the upstream locations and adownstream fining pattern.[39] How ecologically significant these patterns of bed
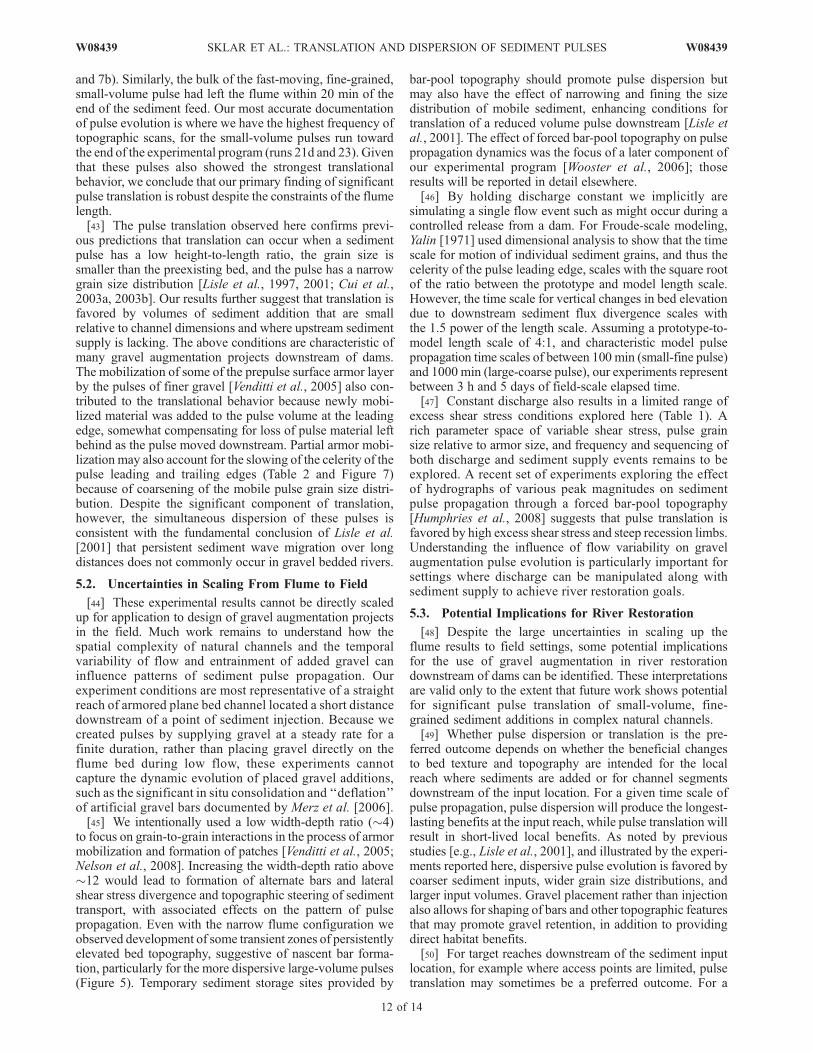
fining are depends on the duration that the bed is within atarget median grain size range. For example, if the targetrange for theD50 is a preferred spawning gravel size between20 and 50 mm, and our model sediments are scaled downfrom the prototype by a factor of 4, then a gravel augmen-tation pulse that produced bed fining in the range between 5and 10 mm would be considered successful. Figure 9 showsthis range as an unshaded block imposed on a plot of the timeevolution of the bed D50 for the four experimental pulses,at the location 21 m downstream of the flume inlet. Thislocation provides a good point to compare the various pulses
Figure 7. Pulse leading edge and tail celerity from change in hand-mapped pulse edge locations overtime. Horizontal distance on graph between leading edge and tail curves indicates duration of pulseoccupation at a location along the flume; vertical distance between curves (or flume exit at 28 m)indicates length of pulse at a moment in time. Celerity indicated by slope of line.
10 of 14
W08439 SKLAR ET AL.: TRANSLATION AND DISPERSION OF SEDIMENT PULSES W08439
because it is far from the upstream boundary where entranceconditions might affect the results. Figure 9 shows that thecoarse-grained pulses shift the bed D50 into the target range,and persist for a longer duration than the fine-grained pulses.Moreover, the fine-grained pulses overshoot the lowerboundary of the target range as the bulk of the pulse passesthrough and lead eventually to rearmoring at or above thepreexisting armor D50.
5. Discussion
5.1. Pulse Translation and Dispersion
[40] The simulated gravel augmentation pulses evolvedthrough a combination of translation and dispersion. Foreach pulse, translation was evident in the downstreammigration of all three of the basic components of the pulse:the leading edge, the centroid of added material, and thetrailing edge (Figures 6 and 7). Pulse translation was alsoevident in the downstream movement of the zone of mostsignificant bed fining (e.g., Figure 8d). Translational behav-ior occurred most significantly in the small-volume pulses(Figures 4 and 6), while pulse grain size appears to have asecondary influence.[41] Some dispersion was also evident in each pulse.
Pulses tended to disperse by spreading more on the trailingedge than the leading edge, in effect by leaving materialbehind (e.g., Figure 4c). Overall, pulse dispersion is mostevident when comparing the difference between leadingedge and trailing edge celerity, however, the downstream-cumulative elevation difference graphs reveal more accu-
rately how pulse mass is distributed as the pulse spreadsand migrates downstream.[42] A major limitation of our experiments is the short
length of the flume relative to the size and celerity of thepulses. For example, the large-volume pulses (runs 7 and 10)spanned the length of flume, such that the leading edge exitedthe flume before the sediment feed was complete (Figures 7a
Figure 8. Changes in bed surface median grain size (D50) over time for various positions along theflume. Grain size indicated by size and shading of circle. Pulse leading edge and tail also shown, as inFigure 7.
Figure 9. Change in bed surface median grain diameterwith time for each run at position 21 m downstream offlume inlet. Unshaded area represents hypothetical range ofpotential spawning grain sizes (1:4 scaling).
W08439 SKLAR ET AL.: TRANSLATION AND DISPERSION OF SEDIMENT PULSES
11 of 14
W08439
and 7b). Similarly, the bulk of the fast-moving, fine-grained,small-volume pulse had left the flume within 20 min of theend of the sediment feed. Our most accurate documentationof pulse evolution is where we have the highest frequency oftopographic scans, for the small-volume pulses run towardthe end of the experimental program (runs 21d and 23). Giventhat these pulses also showed the strongest translationalbehavior, we conclude that our primary finding of significantpulse translation is robust despite the constraints of the flumelength.[43] The pulse translation observed here confirms previ-
ous predictions that translation can occur when a sedimentpulse has a low height-to-length ratio, the grain size issmaller than the preexisting bed, and the pulse has a narrowgrain size distribution [Lisle et al., 1997, 2001; Cui et al.,2003a, 2003b]. Our results further suggest that translation isfavored by volumes of sediment addition that are smallrelative to channel dimensions and where upstream sedimentsupply is lacking. The above conditions are characteristic ofmany gravel augmentation projects downstream of dams.The mobilization of some of the prepulse surface armor layerby the pulses of finer gravel [Venditti et al., 2005] also con-tributed to the translational behavior because newly mobi-lized material was added to the pulse volume at the leadingedge, somewhat compensating for loss of pulse material leftbehind as the pulse moved downstream. Partial armor mobi-lization may also account for the slowing of the celerity of thepulse leading and trailing edges (Table 2 and Figure 7)because of coarsening of the mobile pulse grain size distri-bution. Despite the significant component of translation,however, the simultaneous dispersion of these pulses isconsistent with the fundamental conclusion of Lisle et al.[2001] that persistent sediment wave migration over longdistances does not commonly occur in gravel bedded rivers.
5.2. Uncertainties in Scaling From Flume to Field
[44] These experimental results cannot be directly scaledup for application to design of gravel augmentation projectsin the field. Much work remains to understand how thespatial complexity of natural channels and the temporalvariability of flow and entrainment of added gravel caninfluence patterns of sediment pulse propagation. Ourexperiment conditions are most representative of a straightreach of armored plane bed channel located a short distancedownstream of a point of sediment injection. Because wecreated pulses by supplying gravel at a steady rate for afinite duration, rather than placing gravel directly on theflume bed during low flow, these experiments cannotcapture the dynamic evolution of placed gravel additions,such as the significant in situ consolidation and ‘‘deflation’’of artificial gravel bars documented by Merz et al. [2006].[45] We intentionally used a low width-depth ratio (�4)
to focus on grain-to-grain interactions in the process of armormobilization and formation of patches [Venditti et al., 2005;Nelson et al., 2008]. Increasing the width-depth ratio above�12 would lead to formation of alternate bars and lateralshear stress divergence and topographic steering of sedimenttransport, with associated effects on the pattern of pulsepropagation. Even with the narrow flume configuration weobserved development of some transient zones of persistentlyelevated bed topography, suggestive of nascent bar forma-tion, particularly for the more dispersive large-volume pulses(Figure 5). Temporary sediment storage sites provided by
bar-pool topography should promote pulse dispersion butmay also have the effect of narrowing and fining the sizedistribution of mobile sediment, enhancing conditions fortranslation of a reduced volume pulse downstream [Lisle etal., 2001]. The effect of forced bar-pool topography on pulsepropagation dynamics was the focus of a later component ofour experimental program [Wooster et al., 2006]; thoseresults will be reported in detail elsewhere.[46] By holding discharge constant we implicitly are
simulating a single flow event such as might occur during acontrolled release from a dam. For Froude-scale modeling,Yalin [1971] used dimensional analysis to show that the timescale for motion of individual sediment grains, and thus thecelerity of the pulse leading edge, scales with the square rootof the ratio between the prototype and model length scale.However, the time scale for vertical changes in bed elevationdue to downstream sediment flux divergence scales withthe 1.5 power of the length scale. Assuming a prototype-to-model length scale of 4:1, and characteristic model pulsepropagation time scales of between 100 min (small-fine pulse)and 1000 min (large-coarse pulse), our experiments representbetween 3 h and 5 days of field-scale elapsed time.[47] Constant discharge also results in a limited range of
excess shear stress conditions explored here (Table 1). Arich parameter space of variable shear stress, pulse grainsize relative to armor size, and frequency and sequencing ofboth discharge and sediment supply events remains to beexplored. A recent set of experiments exploring the effectof hydrographs of various peak magnitudes on sedimentpulse propagation through a forced bar-pool topography[Humphries et al., 2008] suggests that pulse translation isfavored by high excess shear stress and steep recession limbs.Understanding the influence of flow variability on gravelaugmentation pulse evolution is particularly important forsettings where discharge can be manipulated along withsediment supply to achieve river restoration goals.
5.3. Potential Implications for River Restoration
[48] Despite the large uncertainties in scaling up theflume results to field settings, some potential implicationsfor the use of gravel augmentation in river restorationdownstream of dams can be identified. These interpretationsare valid only to the extent that future work shows potentialfor significant pulse translation of small-volume, fine-grained sediment additions in complex natural channels.[49] Whether pulse dispersion or translation is the pre-
ferred outcome depends on whether the beneficial changesto bed texture and topography are intended for the localreach where sediments are added or for channel segmentsdownstream of the input location. For a given time scale ofpulse propagation, pulse dispersion will produce the longest-lasting benefits at the input reach, while pulse translation willresult in short-lived local benefits. As noted by previousstudies [e.g., Lisle et al., 2001], and illustrated by the experi-ments reported here, dispersive pulse evolution is favored bycoarser sediment inputs, wider grain size distributions, andlarger input volumes. Gravel placement rather than injectionalso allows for shaping of bars and other topographic featuresthat may promote gravel retention, in addition to providingdirect habitat benefits.[50] For target reaches downstream of the sediment input
location, for example where access points are limited, pulsetranslation may sometimes be a preferred outcome. For a
12 of 14
W08439 SKLAR ET AL.: TRANSLATION AND DISPERSION OF SEDIMENT PULSES W08439
given volume of input gravel, sediments will arrive at thetarget downstream reach at a higher rate if the pulse retains amore compact form because of a more translational patternof evolution. In contrast, a dominantly dispersive pattern,where the pulse evolves by elongation and thinning, willresult in lower rates of sediment delivery to downstreamreaches, spread over a longer time period. These differinginfluences on downstream reaches are illustrated schemat-ically in Figure 7a, which shows the tradeoff between thespatial concentration of added sediment and duration of pulseoccupation at a given location. The differences in magnitudeand duration of effect, between dominantly translationalversus dispersive pulses, will be more pronounced withincreasing distance downstream. There are other tradeoffsbetween the conditions that favor pulse translation andpotential restoration effectiveness. Smaller input volumes,which our experiments suggest favor pulse translation, mayarrive at downstream reaches as discrete sediment waves, butmay not be of sufficient magnitude to create biologicallymeaningful changes to channel conditions. Similarly, gravelpulses composed of smaller grain sizes, and thus more likelyto have a significant translational pattern of propagation, willmove downstream with greater celerity, arriving at, but alsopassing through, downstream reaches more quickly. Where afine gravel pulse is primarily intended to cause mobilizationof static armor, rapid and far-reaching translation may be themost effective outcome, although entrainment of coarser bedmaterials should tend to suppress the tendency for furtherpulse translation. One ideal outcome of pulse translationwould be supply from upstream of finer gravel to a down-stream target reach, whereupon the pulse propagation patternshifts to dominantly dispersive, allowing both large-magnitudeand long-duration beneficial changes to occur.[51] The experimental results also suggest tradeoffs be-
tween the potential spatial and temporal benefits of usingfine- or coarse-grained sediment inputs. The high celerity ofthe fine-grained pulses means that more frequent augmen-tations would be required to achieve the same duration ofbed fining as a slower-moving, coarser-grained pulse. Fine-grained pulses, however, produced a larger-magnitudechange in median grain size (14 mm to 3 mm), and weremore effective at mobilizing the prepulse armor [Venditti etal., 2005]. As Figure 9 illustrates, it is possible to overshootthe ecologically beneficial grain size range by augmentingwith finer-grained gravel [e.g., Kondolf and Wolman, 1993;Phillips et al., 1975]. Moreover, the coarse-grained pulsesproduced a net fining, comparing the prepulse and postpulsemedian grain size, while the fine-grained pulses resulting inno net fining and even net coarsening, as has been observedin the field following large-volume fine sediment pulses[Meade, 1985; Roberts and Church, 1986; Miller andBenda, 2000]. More work is needed to explore the effectof alternating fine- and coarse-grained gravel additions, orusing a distribution intermediate between the two end-members we tested in these experiments.
6. Conclusions
[52] We conducted a series of flume experiments simu-lating gravel augmentation in a plane bed, armored channeldownstream of a dam, to explore the influence of the volumeand grain size of added material on the style and rate ofevolution of the resulting sediment wave. Patterns of pulse
propagation can be determined from a time series graph of thedownstream-cumulative elevation differences (CED) fromthe prepulse bed topography. We quantify the extent of pulsetranslation versus dispersion from the rate of change in theinterquartile range of the CED for a unit distance of traveldownstream by the pulse center of mass. All experimentalgravel augmentation pulses evolved through a combinationof translation and dispersion, with a significant translationalcomponent, particularly for small augmentation volumes.These results are consistent with previous predictions [e.g.,Lisle et al., 2001] that translation is favored for sedimentadditions finer than the preexisting bed, and suggest thatsome component of pulse translation may be a commonoutcome for gravel augmentation pulses in armored channelsbelow dams.[53] Bed texture response to gravel augmentation pulses
depends on the grain size of the preexisting bed, the grainsize of the added gravel, the volume of added material, andthe spatial and temporal pattern of pulse evolution. Largeaugmentation volumes created longer-lasting improvementsin bed texture compared to smaller augmentation volumes.Augmentation with finer gravel led to greater decreases inmedian bed grain size but shorter durations of bed fining dueto the higher celerity of fine-grained augmentation pulses.Use of gravel finer than the lower bound of the spawning sizerange for static armor mobilization can delay the develop-ment of a bed size distribution in the spawnable range bytemporarily overshooting the intended magnitude of bedtexture fining. More research is needed to understand howthe spatial complexity of natural channels and the temporalvariability of discharge can influence patterns of propagationof small-volume pulses of finer-grained gravel in armoredchannels.
[54] Acknowledgments. We are grateful to Skye Corbett, StuartFoster, John Potter, Kurt Yaeger, and Neto Santana for laboratory assistance;Chris Ellis, Jim Mullin, Brett Otteson, and Chris Paola of the University ofMinnesota Saint Anthony Falls Laboratory for instrument cart development;Peter Downs, Scott Dusterhoff, Craig Fixler, and Frank Ligon of StillwaterSciences for project leadership and management; and the project scientificadvisory panel members Tom Lisle, Scott McBain, Gary Parker, KrisVyverberg, and Peter Wilcock for insightful discussions. We also extendour thanks to Greg Pasternack and three anonymous reviewers for thoughtfuland detailed comments on a previous version of the manuscript. Funding forthis research was provided by CALFED Ecosystem Restoration Program(grant ERP-02D-P55) and by the STC program of the National ScienceFoundation (NSF) via the National Center for Earth Surface Dynamics(NCED) under agreement EAR-0120914.
ReferencesAlexander, G. G., and J. D. Allan (2007), Ecological success in streamrestoration: Case studies from the Midwestern United States, Environ.Manage. N. Y., 40(2), 245–255, doi:10.1007/s00267-006-0064-6.
Bartley, R., and I. Rutherford (2005), Re-evaluation of the wave model as atool for quantifying the geomorphic recovery potential of streams dis-turbed by sediment slugs, Geomorphology, 64, 221–242, doi:10.1016/j.geomorph.2004.07.005.
Benda, L., and T. Dunne (1997a), Stochastic forcing of sediment supply tochannel networks from landsliding and debris flow, Water Resour. Res.,33(12), 2849–2863, doi:10.1029/97WR02388.
Benda, L., and T. Dunne (1997b), Stochastic forcing of sediment routingand storage in channel networks, Water Resour. Res., 33(12), 2865–2880, doi:10.1029/97WR02387.
Brandt, S. A. (2000), Classification of geomorphic effects downstream ofdams, Catena, 40, 375–401, doi:10.1016/S0341-8162(00)00093-X.
Bunte, K. (2004), Gravel mitigation and augmentation below hydroelectricdams: A geomorphological perspective, 144 pp., Stream Syst. Technol.Cent., Rocky Mt. Res. Stn., For. Serv., U.S. Dep. of Agric., Fort Collins,Colo.
W08439 SKLAR ET AL.: TRANSLATION AND DISPERSION OF SEDIMENT PULSES
13 of 14
W08439
Bunte, K., and S. R. Abt (2001), Sampling surface and subsurface particle-size distributions in wadable gravel-and cobble-bed streams for analysisin sediment transport, hydraulics, and streambed monitoring, Gen. Tech.Rep. RMRS-GTR-74, 428 pp., Rocky Mt. Res. Stn., For. Serv., U.S. Dep.of Agric., Fort Collins, Colo.
Cui, Y., and G. Parker (2005), Numerical model of sediment pulses andsupply disturbances in mountain rivers, J. Hydraul. Eng., 131, 646–656,doi:10.1061/(ASCE)0733-9429(2005)131:8(646).
Cui, Y., G. Parker, T. E. Lisle, J. Gott, M. E. Hansler-Ball, J. E. Pizzuto,N. E. Allmendinger, and J. M. Reed (2003a), Sediment pulses in moun-tain rivers: 1. Experiments,Water Resour. Res., 39(9), 1239, doi:10.1029/2002WR001803.
Cui, Y., G. Parker, J. Pizzuto, and T. E. Lisle (2003b), Sediment pulses inmountain rivers: 2. Comparison between experiments and numerical pre-dictions, Water Resour. Res., 39(9), 1240, doi:10.1029/2002WR001805.
Elkins, E. M., G. B. Pasternack, and J. E. Merz (2007), Use of slopecreation for rehabilitating incised, regulated, gravel bed rivers, WaterResour. Res., 43, W05432, doi:10.1029/2006WR005159.
Fadde, J. (2007), Temporal and spatial effects of gravel augmentation onrivers downstream of dams, M.S. thesis, 76 pp., Dep. of Geosci., SanFrancisco State Univ., San Francisco, Calif.
Greimann, B., T. Randle, and J. Huang (2006), Movement of finite ampli-tude sediment accumulations, J. Hydraul. Eng., 132(7), 731 –736,doi:10.1061/(ASCE)0733-9429(2006)132:7(731).
Hoffman, D. F., and E. J. Gabet (2007), Effects of sediment pulses onchannel morphology in a gravel-bed river, Geol. Soc. Am. Bull., 119,116–125, doi:10.1130/B25982.1.
Humphries, R. P., J. G. Venditti, and L. S. Sklar (2008), The role ofhydrographs in sediment pulse dynamics, Eos Trans. AGU, 89(53), FallMeet. Suppl., Abstract H44A-03.
Kasai, M., T. Marutani, and G. J. Brierley (2004), Patterns of sediment slugtranslation and dispersion following typhoon-induced disturbance, OyabuCreek, Kyushu, Japan, Earth Surf. Processes Landforms, 29, 59 –76,doi:10.1002/esp.1013.
Kellerhals, R., and D. I. Bray (1971), Sampling procedures for coarsefluvial sediments, J. Hydraul. Div. Am. Soc. Civ. Eng., 97, 1165–1179.
Kondolf, G. M., and M. G. Wolman (1993), The sizes of salmonid spawn-ing gravels, Water Resour. Res., 29, 2275 – 2285, doi:10.1029/93WR00402.
Kondolf, G. M., J. C. Vick, and T. M. Ramirez (1996), Salmon spawninghabitat rehabilitation on the Merced River, California: An evaluation ofproject planning and performance, Trans. Am. Fish. Soc., 125, 899–912,doi:10.1577/1548-8659(1996)125<0899:SSHROT>2.3.CO;2.
Ligon, F. K., W. E. Dietrich, and W. J. Trush (1995), Downstream ecologicaleffects of Dams: A geomorphic perspective, BioScience, 45(3), 183–192,doi:10.2307/1312557.
Lisle, T. E., J. E. Pizzuto, H. Ikeda, F. Iseya, and Y. Kodama (1997),Evolution of a sediment wave in an experimental channel, Water Resour.Res., 33(8), 1971–1981, doi:10.1029/97WR01180.
Lisle, T. E., J. M. Nelson, J. Pitlick, M. A. Madej, and B. L. Barkett (2000),Variability of bed mobility in natural, gravel-bed channels and adjust-ments to sediment load at local and reach scales, Water Resour. Res.,36(12), 3743–3755, doi:10.1029/2000WR900238.
Lisle, T. E., Y. Cui, G. Parker, J. E. Pizzuto, and A. M. Dodd (2001), Thedominance of dispersion in the evolution of bed material waves in gravel-bed rivers, Earth Surf. Processes Landforms, 26, 1409 – 1420,doi:10.1002/esp.300.
Lutrick, E. (2001), A Review of gravel addition projects on Clear Creek,the Tuolumne River and the Stanislaus River, California: Implications forCALFED Bay-Delta program project management, M.S. thesis, 64 pp.,Dep. of Landscape Archit. and Environ. Plann., Univ. of Calif., Berkeley.
Madej, M. A. (2001), Development of channel organization and roughnessfollowing sediment pulses in single-thread, gravel bed rivers, WaterResour. Res., 37(8), 2259–2272, doi:10.1029/2001WR000229.
Meade, R. H. (1985), Wavelike movement of bedload sediment, East ForkRiver, Wyoming, Environ. Geol. Water Sci., 7, 215–225, doi:10.1007/BF02509922.
Merz, J. E., and L. K. Ochikubo Chan (2005), Effects of gravel augmenta-tion on macroinvertebrate assemblages in a regulated California river,River Res. Appl., 21, 61–74, doi:10.1002/rra.819.
Merz, J. E., and J. D. Setka (2004), Evaluation of a spawning habitatenhancement site for chinook salmon in a regulated California river,N. Am. J. Fish. Manage., 24, 397–407, doi:10.1577/M03-038.1.
Merz, J. E., G. B. Pasternack, and J. M. Wheaton (2006), Sediment budgetfor salmonid spawning habitat rehabilitation in a regulated river, Geo-morphology, 76, 207–228, doi:10.1016/j.geomorph.2005.11.004.
Miller, D. J., and L. E. Benda (2000), Effects of punctuated sediment
supply on valley-floor landforms and sediment transport, Geol. Soc.Am. Bull., 112, 1814–1824, doi:10.1130/0016-7606(2000)112<1814:EOPSSO>2.0.CO;2.
Nelson, P. A., W. E. Dietrich, and J. G. Venditti (2008), Bed topographyand the development of forced surface patches, Eos Trans. AGU, 89(53),Fall Meet. Suppl., Abstract H52C-04.
Nelson, P. A., J. G. Venditti, W. E. Dietrich, J. W. Kirchner, H. Ikeda,F. Iseya, and L. S. Sklar (2009), Response of bed surface patchiness toreductions in sediment supply, J. Geophys. Res., 114, F02005,doi:10.1029/2008JF001144.
Pasternack, G. B., C. L. Wang, and J. E. Merz (2004), Application of a 2Dhydrodynamic model to design of reach-scale spawning gravel replen-ishment on the Mokelumne River, California, River Res. Appl., 20, 205–225, doi:10.1002/rra.748.
Phillips, R. W., R. L. Lantz, E. W. Claire, and J. R. Moring (1975), Someeffects of gravel mixtures on emergence of coho salmon and steelheadtrout fry, Trans. Am. Fish. Soc., 104, 461–466, doi:10.1577/1548-8659(1975)104<461:SEOGMO>2.0.CO;2.
Pickup, G., R. J. Higgins, and I. Grant (1983), Modeling sediment transportas a moving wave—The transfer and deposition of mining waste,J. Hydrol., 60, 281–301, doi:10.1016/0022-1694(83)90027-6.
Roberts, R. G., and M. Church (1986), The sediment budget in severelydisturbed watersheds, Queen Charlotte Ranges, British Columbia, Can.J. For. Res., 16, 1092–1106, doi:10.1139/x86-189.
Schmidt, J. C., and P. R. Wilcock (2008), Metrics for assessing the down-stream effects of dams, Water Resour. Res., 44, W04404, doi:10.1029/2006WR005092.
Sklar, L. S., B. Harvey, R. Lave, S. McBain, D. Reiser, and L. Rempel(2005), Key research needs in gravel augmentation, GSA CordilleranSection Annual Meeting, Geol. Soc. Am. Abstr. Programs, 37(4), 89.
Sutherland, D. G., M. Hansler Ball, S. J. Hilton, and T. E. Lisle (2002),Evolution of a landslide-induced sediment wave in the Navarro River,California, Geol. Soc. Am. Bull., 114, 1036–1048, doi:10.1130/0016-7606(2002)114<1036:EOALIS>2.0.CO;2.
Venditti, J. G., W. E. Dietrich, P. A. Nelson, M. A. Wydzga, J. Fadde, andL. S. Sklar (2005), Can coarse surface layers in gravel-bedded rivers bemobilized by finer gravel bedload?, Eos Trans. AGU, 86(52), Fall Meet.Suppl., Abstract H51H-05.
Walpole, R. E., and R. H. Myers (1978), Probability and Statistics forEngineers and Scientists, 2nd ed., 580 pp., MacMillan, New York.
Wheaton, J. M., G. B. Pasternack, and J. E. Merz (2004a), Spawninghabitat rehabilitation-I. Conceptual approach and methods, Int. J. RiverBasin Manage., 1(4), 1–18.
Wheaton, J. M., G. B. Pasternack, and J. E. Merz (2004b), Spawninghabitat rehabilitation-II. Using hypothesis development and testing in de-sign, Mokelumne River, California, U.S.A, Int. J. River Basin Manage.,1(4), 1–17.
Williams, G. P. (1970), Flume width and water depth effects in sedimenttransport experiments, U.S. Geol. Surv. Prof. Pap., 562-H, 37 pp.
Williams, G. P., and M. G. Wolman (1984), Downstream effects of dams onalluvial rivers, U.S. Geol. Surv. Prof. Pap., 1286.
Wohl, E., P. L. Angermeier, B. Bledsoe, G. M. Kondolf, L. MacDonnell,D. M. Merritt, M. A. Palmer, N. L. Poff, and D. Tarboton (2005), Riverrestoration, Water Resour. Res. , 41 , W10301, doi:10.1029/2005WR003985.
Wooster, J. K., J. G. Venditti, J. T. Minear, Y. Cui, S. Dusterhoff,R. Humphries, P. Nelson, W. E. Dietrich, and L. S. Sklar (2006), Investi-gations of sediment pulse morphodynamics in a flume with fixed bars, EosTrans. AGU, 87(52), Fall Meet. Suppl., Abstract H51G-0584.
Wydzga, M. A., J. G. Venditti, and T. Dunne (2006), Can mobilization ofthe coarse surface layer release fine sediment trapped beneath the surface?,Eos Trans. AGU, 87(52), Fall Meet. Suppl., Abstract H41C-0423.
Yalin, M. S. (1971), Theory of Hydraulic Models, 266 pp., MacMillan,London.
����������������������������Y. Cui, Stillwater Sciences, 2855 Telegraph Avenue, Suite 400, Berkeley,
CA 94705, USA.W. E. Dietrich and P. Nelson, Department of Earth and Planetary
Sciences, University of California, Berkeley, CA 94702, USA.
J. Fadde and L. S. Sklar, Department of Geosciences, San FranciscoState University, San Francisco, CA 94132, USA. ([email protected])
J. G. Venditti, Department of Geography, Simon Fraser University,Burnaby, BC V5A 1S6, Canada.
M. A. Wydzga, Department of Earth Science, University of California,Santa Barbara, CA 93106, USA.
14 of 14
W08439 SKLAR ET AL.: TRANSLATION AND DISPERSION OF SEDIMENT PULSES W08439