click for instructions!
TRANSCRIPT

KZN285 Mthonjaneni
Contact details: Technical enquiries to the MFMA Helpline at:[email protected] Data submission enquiries:Elsabé Rossouw National Treasury Tel: (012) 315-5534 Electronic documents: [email protected] on formats: [email protected]
Click for Instructions!

Contact details:
Technical enquiries to the MFMA Helpline at: [email protected]
Data submission enquiries: Elsabé Rossouw National Treasury
5534 Electronic documents: [email protected] Queries on formats: [email protected]
Version 2.3

2020
Name Votes & Sub
Preparation Instructions
Municipality Name:
MTREF: Budget Year:
Does this municipality have Entities?
If YES: Identify type of report:
CFO Name:
Tel:
E-Mail:
Fax:
Reporting period:
Printing Instructions
Showing / Hiding Columns
Showing / Clearing Highlights
Importants documents whichprovide essential assistance
MFMA Budget Circular 2011
MFMA Circular 48
MFMA Circular 51
MFMA Return Forms
MBRR Budget Formats Guide
MIKE BOWMAN
035 4502082
Hide Reference columns on all sheets
Hide Pre-audit columns on all sheets
Clear Highlights on all sheets
Name Votes & Sub-Votes
Budget Year:
Fax:
Importants documents which provide essential assistance
MFMA Budget Circular 2011/12
MFMA Return Forms
MBRR Budget Formats Guide
Click to view
Click to view
Click to view
Click to view
Click to view
MIKE BOWMAN
035 4502056
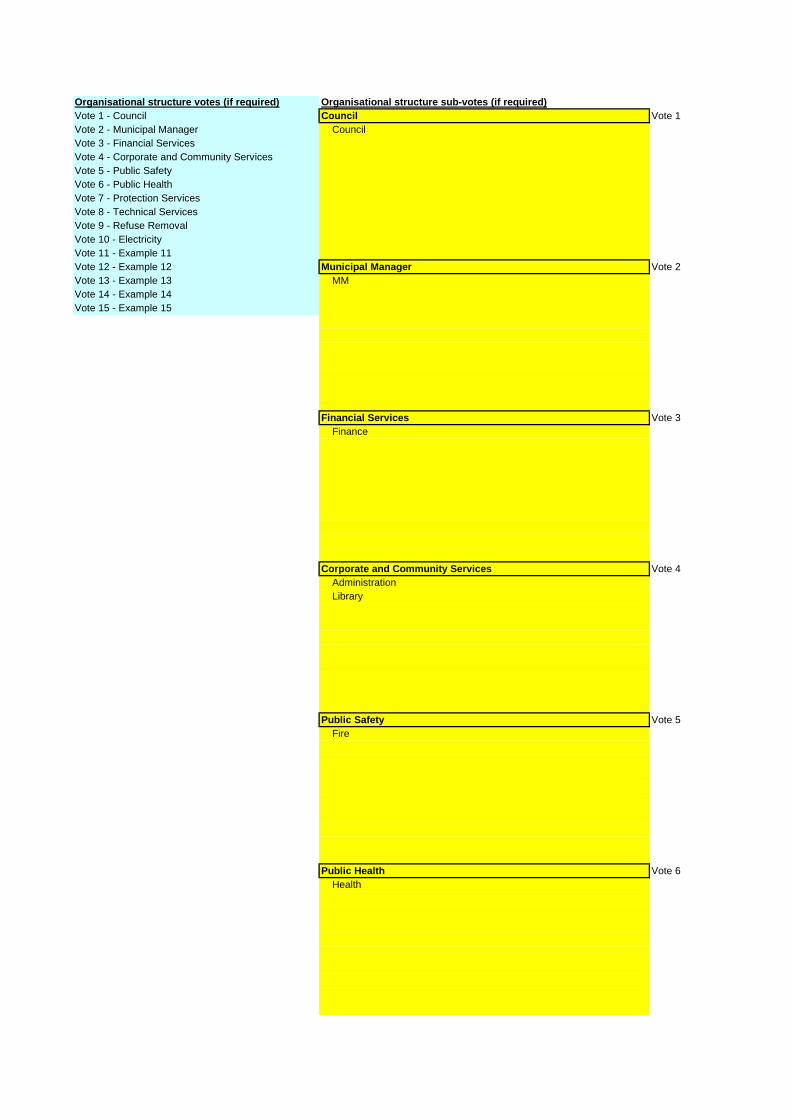
Organisational structure votes (if required) Organisational structure sub-votes (if required)
Vote 1 - Council Council Vote 1
Vote 2 - Municipal Manager Council
Vote 3 - Financial Services
Vote 4 - Corporate and Community Services
Vote 5 - Public Safety
Vote 6 - Public Health
Vote 7 - Protection Services
Vote 8 - Technical Services
Vote 9 - Refuse Removal
Vote 10 - Electricity
Vote 11 - Example 11
Vote 12 - Example 12 Municipal Manager Vote 2
Vote 13 - Example 13 MM
Vote 14 - Example 14
Vote 15 - Example 15
Financial Services Vote 3
Finance
Corporate and Community Services Vote 4
Administration
Library
Public Safety Vote 5
Fire
Public Health Vote 6
Health
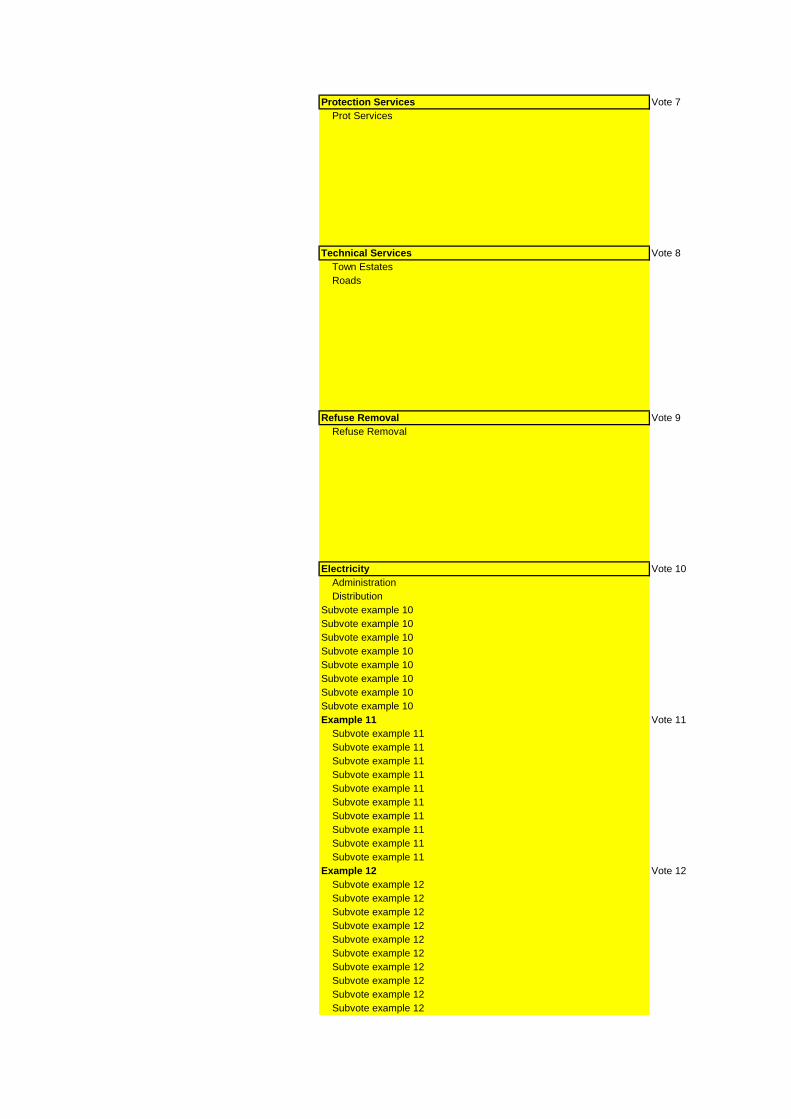
Protection Services Vote 7
Prot Services
Technical Services Vote 8
Town Estates
Roads
Refuse Removal Vote 9
Refuse Removal
Electricity Vote 10
Administration
Distribution
Subvote example 10
Subvote example 10
Subvote example 10
Subvote example 10
Subvote example 10
Subvote example 10
Subvote example 10
Subvote example 10
Example 11 Vote 11
Subvote example 11
Subvote example 11
Subvote example 11
Subvote example 11
Subvote example 11
Subvote example 11
Subvote example 11
Subvote example 11
Subvote example 11
Subvote example 11
Example 12 Vote 12
Subvote example 12
Subvote example 12
Subvote example 12
Subvote example 12
Subvote example 12
Subvote example 12
Subvote example 12
Subvote example 12
Subvote example 12
Subvote example 12

Example 13 Vote 13
Subvote example 13
Subvote example 13
Subvote example 13
Subvote example 13
Subvote example 13
Subvote example 13
Subvote example 13
Subvote example 13
Subvote example 13
Subvote example 13
Example 14 Vote 14
Subvote example 14
Subvote example 14
Subvote example 14
Subvote example 14
Subvote example 14
Subvote example 14
Subvote example 14
Subvote example 14
Subvote example 14
Subvote example 14
Example 15 Vote 15
Subvote example 15
Subvote example 15
Subvote example 15
Subvote example 15
Subvote example 15
Subvote example 15
Subvote example 15
Subvote example 15
Subvote example 15
Subvote example 15

KZN285 Mthonjaneni - Contact Information
A. GENERAL INFORMATION
Municipality KZN285 Mthonjaneni Set name on 'Instructions' sheet
Grade 1 Grade in terms of the Remuneration of Public Office Bearers Act.
Province KZN KWAZULU-NATAL
Web Address www.mthonjaneni.org.za
e-mail Address [email protected]
Postal address:
P.O. Box 11
City / Town MELMOTH
Postal Code 3835
Street address
Building
Street No. & Name 21 Reinhold Street
City / Town MELMOTH
Postal Code 3835
General Contacts
Telephone number (035) 4502082
Fax number (035) 4503224
Speaker:
Name Ms N.A. Jiyane Name Ms L.K. Makhiwane
Telephone number 035 450 2082 Telephone number 035 450 2082
Cell number Cell number
Fax number 035 450 3224 Fax number 035 450 3224
E-mail address [email protected] E-mail address [email protected]
Name Ms M. Ndlangamandla Name Ms L.K. Makhiwane
Telephone number 035 450 2082 Telephone number 035 450 2082
Cell number Cell number
Fax number 035 450 3224 Fax number 035 450 3224
E-mail address [email protected] E-mail address [email protected]
Name Mr G. Gumede Name Ms L.K. Makhiwane
Telephone number 035 450 2082 Telephone number 035 450 2082
Cell number Cell number
Fax number 035 450 3224 Fax number 035 450 3224
E-mail address [email protected] E-mail address [email protected]
Municipal Manager:
Name Mr F.A. Els Name Ms N. Mtshali
Telephone number 035 450 2082 Telephone number 035 450 2082
Cell number Cell number
Fax number 035 450 3224 Fax number 035 450 3224
E-mail address [email protected] E-mail address [email protected]
Chief Financial Officer
Name MIKE BOWMAN Name Mr N.M. Biyela
Telephone number 035 4502082 Telephone number 035 450 2082
Cell number Cell number
Fax number 035 4502056 Fax number 035 450 2056
E-mail address [email protected] E-mail address [email protected]
Name
Telephone number
Cell number
Fax number
E-mail address
Name
Telephone number
Secretary/PA to the Mayor/Executive Mayor:
Deputy Mayor/Executive Mayor: Secretary/PA to the Deputy Mayor/Executive Mayor:
Secretary/PA to the Municipal Manager:
Secretary/PA to the Chief Financial Officer
Official responsible for submitting financial information
Official responsible for submitting financial information
B. CONTACT INFORMATION
D. MANAGEMENT LEADERSHIP
C. POLITICAL LEADERSHIP
Secretary/PA to the Speaker:
Mayor/Executive Mayor:

KZN285 Mthonjaneni - Table C1 Monthly Budget Statement Summary - M06 December
2010/11
Audited
Outcome
Original
Budget
Adjusted
Budget
Monthly
actualYearTD actual
YearTD
budget
YTD
variance
YTD
variance
Full Year
Forecast
R thousands %
Financial Performance
Property rates 6,190 6,100 – 579 4,334 3,050 1,284 42% –
Service charges 12,000 13,920 – 1,061 7,205 12,821 (5,616) -44% –
Investment revenue 2,341 1,900 – 632 1,102 950 152 16% –
Transfers recognised - operational 22,651 21,470 – 1,418 19,995 27,471 (7,477) -27% –
Other own revenue 3,788 6,731 – 321 4,463 3,406 1,057 31% –
Total Revenue (excluding capital transfers and
contributions)
46,971 50,121 – 4,013 37,099 47,698 (10,599) -22% –
Employee costs 13,916 16,008 – 1,134 7,273 7,933 (659) -8% –
Remuneration of Councillors 2,346 2,567 – 203 1,220 1,283 (63) -5% –
Depreciation & asset impairment 2,996 3,300 – – – 1,650 (1,650) -100% –
Finance charges – – – – – – – –
Materials and bulk purchases 8,863 11,000 – 851 6,659 5,667 992 18% –
Transfers and grants 3,828 2,574 – 517 1,829 10,011 (8,182) –
Other expenditure 9,980 8,909 – 464 3,872 3,619 253 7% –
Total Expenditure 41,928 44,358 – 3,170 20,854 30,164 (9,310) -31% –
Surplus/(Deficit) 5,043 5,763 – 843 16,245 17,535 (1,289) -7% –
Transfers recognised - capital 15,336 28,261 – – 3,133 5,652 (2,520) -45% –
Contributions & Contributed assets – – – – – – – –
Surplus/(Deficit) after capital transfers &
contributions
20,379 34,024 – 843 19,378 23,187 (3,809) -16% –
Share of surplus/ (deficit) of associate – – – – – – – –
Surplus/ (Deficit) for the year 20,379 34,024 – 843 19,378 23,187 (3,809) -16% –
Capital expenditure & funds sources
Capital expenditure 19,864 31,998 32,097 710 3,842 16,948 (13,106) -77% –
Capital transfers recognised 19,336 28,261 28,360 45 835 911 (75) -8% –
Public contributions & donations – – – – – – – –
Borrowing – – – – – – – –
Internally generated funds 527 3,737 3,737 665 3,007 16,037 (13,030) -81% –
Total sources of capital funds 19,864 31,998 32,097 710 3,842 16,948 (13,106) -77% –
Financial position
Total current assets 40,476 41,535 – 70,049 –
Total non current assets 75,946 111,398 – 75,970 –
Total current liabilities 6,880 6,250 – 24,640 –
Total non current liabilities 1,975 1,424 – 1,914 –
Community wealth/Equity 107,568 145,260 – 119,465 –
Cash flows
Net cash from (used) operating 15,496 36,624 – (17,737) 23,772 4,161 19,611 471% –
Net cash from (used) investing (19,585) (31,998) – (710) (3,842) (16,948) 13,106 -77% –
Net cash from (used) financing (52) – – 8 8 8 – –
Cash/cash equivalents at the month/year end 34,710 39,336 – – 66,867 21,931 44,936 205% 46,930
Debtors & creditors analysis 0-30 Days 31-60 Days 61-90 Days 91-120 Days 121-150 Dys 151-180 Dys181 Dys-1
YrOver 1Yr Total
Debtors Age Analysis
Total By Revenue Source 1,397 741 297 265 244 3,739 – – 6,683
Creditors Age Analysis
Total Creditors 56 – – – – – – – 56
Description
Budget Year 2011/12

2010/11 Budget Year 2011/12
Audited
Outcome
Original
Budget
Adjusted
Budget
Monthly
actualYearTD actual
YearTD
budget
YTD
variance
YTD
variance
Full Year
Forecast
R thousands 1 %
Revenue - Standard
Governance and administration 24,409 25,323 – 1,636 18,065 21,391 (3,326) -16% –
Executive and council 2,600 2,000 – – 2,000 1,000 1,000 100% –
Budget and treasury office 21,749 23,263 – 1,636 16,005 20,361 (4,356) -21% –
Corporate services 60 60 – – 60 30 30 100% –
Community and public safety 6,524 10,650 – 212 8,251 5,325 2,926 55% –
Community and social services 4,731 8,440 – 29 7,262 4,220 3,042 72% –
Sport and recreation – – – – – – – –
Public safety 910 910 – – 805 455 350 77% –
Housing – – – – – – – –
Health 883 1,300 – 184 184 650 (466) -72% –
Economic and environmental services 12,236 17,489 – 1,103 2,782 7,911 (5,129) -65% –
Planning and development – – – – – – – –
Road transport 12,236 17,489 – 1,103 2,782 7,911 (5,129) -65% –
Environmental protection – – – – – – – –
Trading services 19,019 24,920 – 1,061 8,001 13,071 (5,070) -39% –
Electricity 17,541 23,490 – 983 7,532 12,356 (4,824) -39% –
Water – – – – – – – –
Waste water management – – – – – – – –
Waste management 1,477 1,430 – 78 469 715 (246) -34% –
Other 4 – – – – – – – –
Total Revenue - Standard 2 62,188 78,382 – 4,013 37,099 47,698 (10,599) -22% –
Expenditure - Standard
Governance and administration 16,048 15,197 – 1,363 7,618 15,603 (7,985) -51% –
Executive and council 3,577 3,972 – 403 2,359 1,986 373 19% –
Budget and treasury office 9,245 7,481 – 716 3,515 11,745 (8,230) -70% –
Corporate services 3,226 3,744 – 244 1,744 1,872 (128) -7% –
Community and public safety 9,356 10,760 – 467 3,455 5,380 (1,925) -36% –
Community and social services 7,451 8,071 – 301 2,229 4,035 (1,807) -45% –
Sport and recreation – – – – – – – –
Public safety 866 1,485 – 99 711 743 (31) -4% –
Housing – – – – – – – –
Health 1,040 1,204 – 67 515 602 (87) -14% –
Economic and environmental services 3,312 3,558 – 412 1,794 1,779 15 1% –
Planning and development – – – – – – – –
Road transport 3,312 3,558 – 412 1,794 1,779 15 1% –
Environmental protection – – – – – – – –
Trading services 13,093 14,843 – 927 7,986 7,401 585 8% –
Electricity 11,934 13,631 – 922 7,518 6,795 722 11% –
Water – – – – – – – –
Waste water management – – – – – – – –
Waste management 1,160 1,212 – 5 469 606 (137) -23% –
Other – – – – – – – –
Total Expenditure - Standard 3 41,809 44,358 – 3,170 20,854 30,164 (9,310) -31% –
Surplus/ (Deficit) for the year 20,379 34,024 – 843 16,245 17,535 (1,289) -7% –
RefDescription
KZN285 Mthonjaneni - Table C2 Monthly Budget Statement - Financial Performance (standard classification) - M06 December

2010/11 Budget Year 2011/12
Audited
Outcome
Original
Budget
Adjusted
BudgetMonthly actual YearTD actual YearTD budget YTD variance YTD variance
Full Year
Forecast
R thousands 1 %
Revenue - Standard
Municipal governance and administration 24,409 25,323 – 1,636 18,065 21,391 (3,326) -16% –
Executive and council 2,600 2,000 – – 2,000 1,000 1,000 0 –
Mayor and Council – – – – – –
Municipal Manager 2,600 2,000 – 2,000 1,000 1,000 0
Budget and treasury office 21,749 23,263 1,636 16,005 20,361 (4,356) (0)
Corporate services 60 60 – – 60 30 30 0 –
Human Resources –
Information Technology –
Property Services –
Other Admin 60 60 – 60 30 30 0
Community and public safety 6,524 10,650 – 212 8,251 5,325 2,926 0 –
Community and social services 4,731 8,440 – 29 7,262 4,220 3,042 0 –
Libraries and Archives 13 10 2 10 5 5 0
Museums & Art Galleries etc –
Community halls and Facilities 4,718 8,430 27 7,253 4,215 3,038 0
Cemeteries & Crematoriums –
Child Care –
Aged Care –
Other Community –
Other Social –
Sport and recreation –
Public safety 910 910 – – 805 455 350 0 –
Police –
Fire 910 910 – 805 455 350 0
Civil Defence –
Street Lighting –
Other –
Housing –
Health 883 1,300 – 184 184 650 (466) (0) –
Clinics 883 1,300 184 184 650 (466) (0)
Ambulance –
Other –
Economic and environmental services 12,236 17,489 – 1,103 2,782 7,911 (5,129) (0) –
Planning and development – – – – – – – –
Economic Development/Planning –
Town Planning/Building
enforcement –
Licensing & Regulation –
Road transport 12,236 17,489 – 1,103 2,782 7,911 (5,129) (0) –
Roads 9,630 14,711 814 1,172 6,522 (5,350) (0)
Public Buses –
Parking Garages –
Vehicle Licensing and Testing 2,606 2,778 289 1,610 1,389 221 0
Other –
Environmental protection – – – – – – – –
Pollution Control –
Biodiversity & Landscape –
Other –
Trading services 19,019 24,920 – 1,061 8,001 13,071 (5,070) (0) –
Electricity 17,541 23,490 – 983 7,532 12,356 (4,824) (0) –
Electricity Distribution 17,541 23,490 983 7,532 12,356 (4,824) (0)
Electricity Generation –
Water – – – – – – – –
Water Distribution –
Water Storage –
Waste water management – – – – – – – –
Sewerage –
Storm Water Management –
Public Toilets –
Waste management 1,477 1,430 – 78 469 715 (246) (0) –
Solid Waste 1,477 1,430 78 469 715 (246) (0)
Other – – – – – – – –
Air Transport –
Abattoirs –
Tourism –
KZN285 Mthonjaneni - Table C2 Monthly Budget Statement - Financial Performance (standard classification) - M06 December
Description Ref

Forestry –
Markets –
Total Revenue - Standard 2 62,188 78,382 – 4,013 37,099 47,698 (10,599) (0) –
Expenditure - Standard
Municipal governance and administration 16,048 15,197 – 1,363 7,618 15,603 (7,985) (0) –
Executive and council 3,577 3,972 – 403 2,359 1,986 373 0 –
Mayor and Council 2,492 2,742 270 1,631 1,371 260 0
Municipal Manager 1,085 1,230 133 728 615 113 0
Budget and treasury office 9,245 7,481 716 3,515 11,745 (8,230) (0)
Corporate services 3,226 3,744 – 244 1,744 1,872 (128) (0) –
Human Resources –
Information Technology –
Property Services –
Other Admin 3,226 3,744 244 1,744 1,872 (128) (0)
Community and public safety 9,356 10,760 – 467 3,455 5,380 (1,925) (0) –
Community and social services 7,451 8,071 – 301 2,229 4,035 (1,807) (0) –
Libraries and Archives 394 461 9 42 230 (189) (0)
Museums & Art Galleries etc –
Community halls and Facilities 7,057 7,610 292 2,187 3,805 (1,618) (0)
Cemeteries & Crematoriums –
Child Care –
Aged Care –
Other Community –
Other Social –
Sport and recreation –
Public safety 866 1,485 – 99 711 743 (31) (0) –
Police –
Fire 866 1,485 99 711 743 (31) (0)
Civil Defence –
Street Lighting –
Other –
Housing –
Health 1,040 1,204 – 67 515 602 (87) (0) –
Clinics 1,040 1,204 67 515 602 (87) (0)
Ambulance –
Other –
Economic and environmental services 3,312 3,558 – 412 1,794 1,779 15 0 –
Planning and development – – – – – – – –
Economic Development/Planning –
Town Planning/Building
enforcement –
Licensing & Regulation –
Road transport 3,312 3,558 – 412 1,794 1,779 15 0 –
Roads 541 338 167 170 169 1 0
Public Buses –
Parking Garages –
Vehicle Licensing and Testing 2,770 3,220 245 1,624 1,610 14 0
Other –
Environmental protection – – – – – – – –
Pollution Control –
Biodiversity & Landscape –
Other –
Trading services 13,093 14,843 – 927 7,986 7,401 585 0 –
Electricity 11,934 13,631 – 922 7,518 6,795 722 0 –
Electricity Distribution 11,934 13,631 922 7,518 6,795 722 0
Electricity Generation –
Water – – – – – – – –
Water Distribution –
Water Storage –
Waste water management – – – – – – – –
Sewerage –
Storm Water Management –
Public Toilets –
Waste management 1,160 1,212 – 5 469 606 (137) (0) –
Solid Waste 1,160 1,212 5 469 606 (137) (0)
Other – – – – – – – –
Air Transport –
Abattoirs –
Tourism –
Forestry –
Markets –
Total Expenditure - Standard 3 41,809 44,358 – 3,170 20,854 30,164 (9,310) (0) –
Surplus/ (Deficit) for the year 20,379 34,024 – 843 16,245 17,535 (1,289) (0) –
References
1. Government Finance Statistics Functions and Sub-functions are standardised to assist national and international accounts and comparison
2. Total Revenue by Standard Classification must reconcile to total operating revenue shown in Financial Performance (revenue and expenditure)
3. Total Expenditure by Standard Classification must reconcile to total operating expenditure shown in Financial Performance (revenue and expenditure)
check oprev balance 62,187,838 - - - - - - -
check opexp balance - - - - - - - -
4. All amounts must be classified under a Standard (modified GFS) classification. The GFS function 'Other' is only for Abbatoirs, Air Transport, Markets and Tourism - and if used must be supported by footnotes.
Nothing else may be placed under 'Other'. Assign associate share to relevant classification
Vote Description 2010/11
[Insert departmental structure etc 3.]
Audited
Outcome
Original
Budget
Adjusted
Budget
Monthly
actualYearTD actual
YearTD
budget
YTD
variance
YTD
variance
Full Year
Forecast
R thousands %
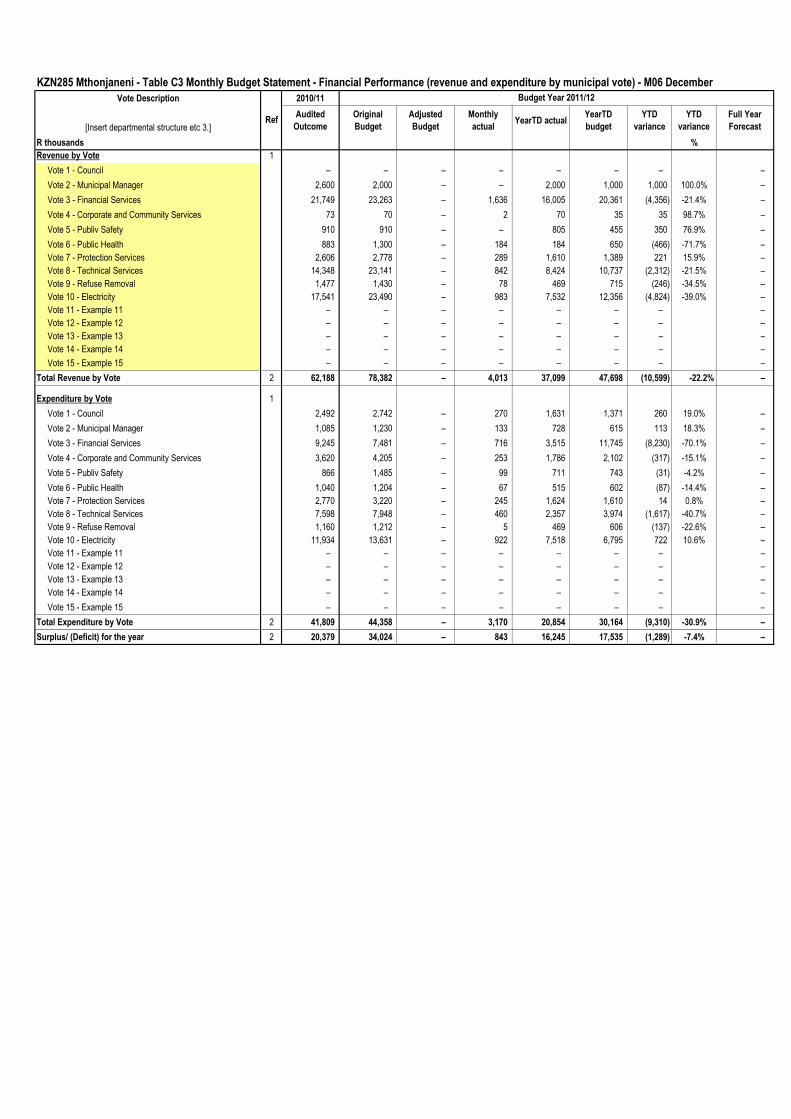
Revenue by Vote 1
Vote 1 - Council – – – – – – – –
Vote 2 - Municipal Manager 2,600 2,000 – – 2,000 1,000 1,000 100.0% –
Vote 3 - Financial Services 21,749 23,263 – 1,636 16,005 20,361 (4,356) -21.4% –
Vote 4 - Corporate and Community Services 73 70 – 2 70 35 35 98.7% –
Vote 5 - Publiv Safety 910 910 – – 805 455 350 76.9% –
Vote 6 - Public Health 883 1,300 – 184 184 650 (466) -71.7% –
Vote 7 - Protection Services 2,606 2,778 – 289 1,610 1,389 221 15.9% –
Vote 8 - Technical Services 14,348 23,141 – 842 8,424 10,737 (2,312) -21.5% –
Vote 9 - Refuse Removal 1,477 1,430 – 78 469 715 (246) -34.5% –
Vote 10 - Electricity 17,541 23,490 – 983 7,532 12,356 (4,824) -39.0% –
Vote 11 - Example 11 – – – – – – – –
Vote 12 - Example 12 – – – – – – – –
Vote 13 - Example 13 – – – – – – – –
Vote 14 - Example 14 – – – – – – – –
Vote 15 - Example 15 – – – – – – – –
Total Revenue by Vote 2 62,188 78,382 – 4,013 37,099 47,698 (10,599) -22.2% –
Expenditure by Vote 1
Vote 1 - Council 2,492 2,742 – 270 1,631 1,371 260 19.0% –
Vote 2 - Municipal Manager 1,085 1,230 – 133 728 615 113 18.3% –
Vote 3 - Financial Services 9,245 7,481 – 716 3,515 11,745 (8,230) -70.1% –
Vote 4 - Corporate and Community Services 3,620 4,205 – 253 1,786 2,102 (317) -15.1% –
Vote 5 - Publiv Safety 866 1,485 – 99 711 743 (31) -4.2% –
Vote 6 - Public Health 1,040 1,204 – 67 515 602 (87) -14.4% –
Vote 7 - Protection Services 2,770 3,220 – 245 1,624 1,610 14 0.8% –
Vote 8 - Technical Services 7,598 7,948 – 460 2,357 3,974 (1,617) -40.7% –
Vote 9 - Refuse Removal 1,160 1,212 – 5 469 606 (137) -22.6% –
Vote 10 - Electricity 11,934 13,631 – 922 7,518 6,795 722 10.6% –
Vote 11 - Example 11 – – – – – – – –
Vote 12 - Example 12 – – – – – – – –
Vote 13 - Example 13 – – – – – – – –
Vote 14 - Example 14 – – – – – – – –
Vote 15 - Example 15 – – – – – – – –
Total Expenditure by Vote 2 41,809 44,358 – 3,170 20,854 30,164 (9,310) -30.9% –
Surplus/ (Deficit) for the year 2 20,379 34,024 – 843 16,245 17,535 (1,289) -7.4% –
KZN285 Mthonjaneni - Table C3 Monthly Budget Statement - Financial Performance (revenue and expenditure by municipal vote) - M06 December
Ref
Budget Year 2011/12
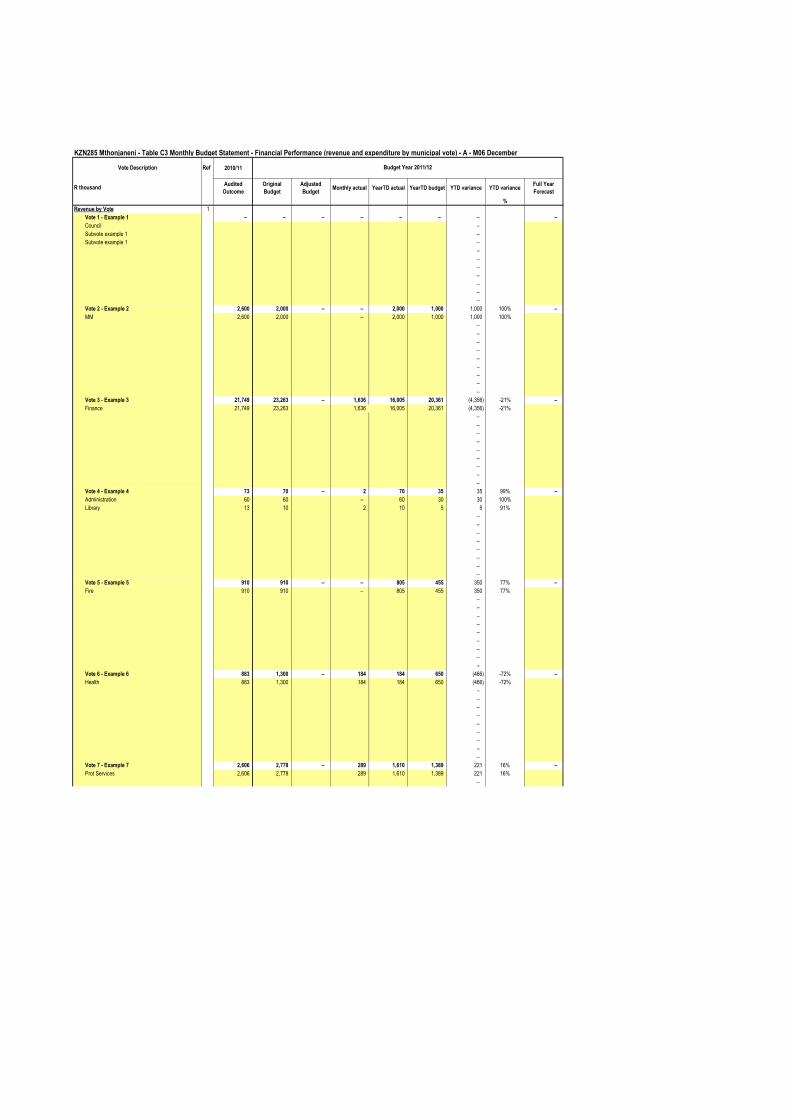
KZN285 Mthonjaneni - Table C3 Monthly Budget Statement - Financial Performance (revenue and expenditure by municipal vote) - A - M06 December
Vote Description Ref 2010/11
R thousandAudited
Outcome
Original
Budget
Adjusted
BudgetMonthly actual YearTD actual YearTD budget YTD variance YTD variance
Full Year
Forecast
%
Revenue by Vote 1
Vote 1 - Example 1 – – – – – – – –
Council –
Subvote example 1 –
Subvote example 1 –
–
–
–
–
–
–
–
Vote 2 - Example 2 2,600 2,000 – – 2,000 1,000 1,000 100% –
MM 2,600 2,000 – 2,000 1,000 1,000 100%
–
–
–
–
–
–
–
–
–
Vote 3 - Example 3 21,749 23,263 – 1,636 16,005 20,361 (4,356) -21% –
Finance 21,749 23,263 1,636 16,005 20,361 (4,356) -21%
–
–
–
–
–
–
–
–
–
Vote 4 - Example 4 73 70 – 2 70 35 35 99% –
Administration 60 60 – 60 30 30 100%
Library 13 10 2 10 5 5 91%
–
–
–
–
–
–
–
–
Vote 5 - Example 5 910 910 – – 805 455 350 77% –
Fire 910 910 – 805 455 350 77%
–
–
–
–
–
–
–
–
–
Vote 6 - Example 6 883 1,300 – 184 184 650 (466) -72% –
Health 883 1,300 184 184 650 (466) -72%
–
–
–
–
–
–
–
–
–
Vote 7 - Example 7 2,606 2,778 – 289 1,610 1,389 221 16% –
Prot Services 2,606 2,778 289 1,610 1,389 221 16%
–
Budget Year 2011/12
–
–
–
–
–
–
–
–
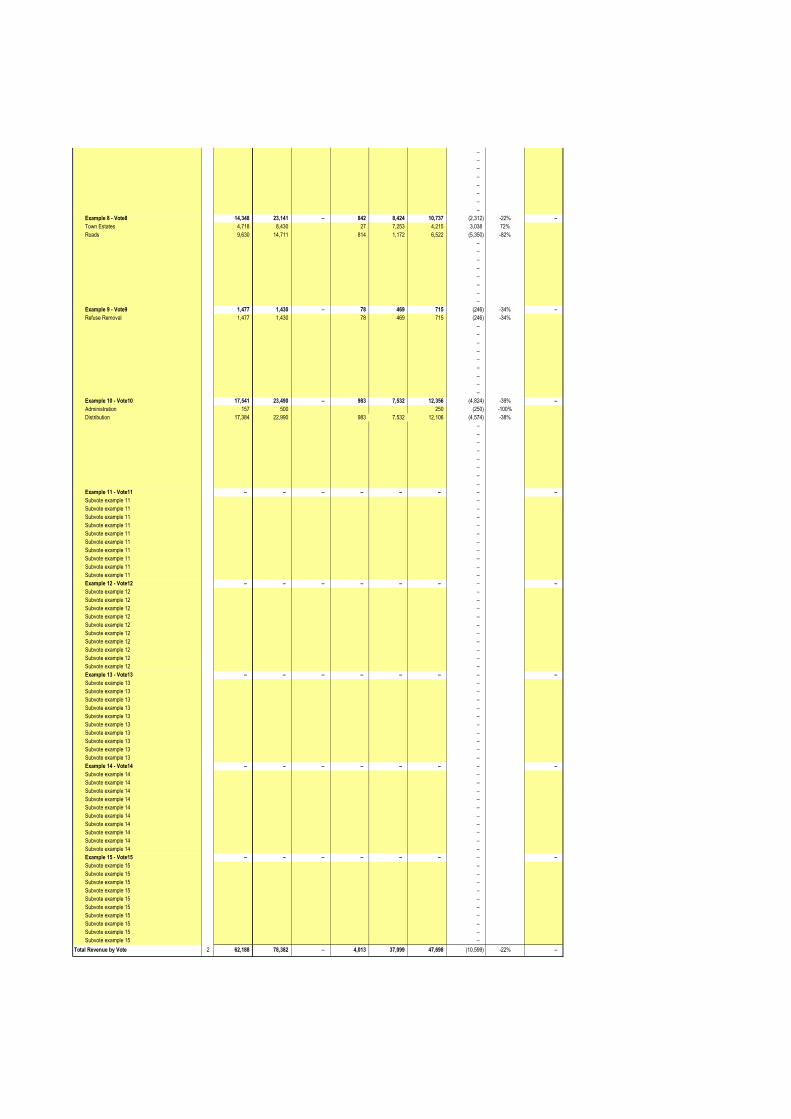
Example 8 - Vote8 14,348 23,141 – 842 8,424 10,737 (2,312) -22% –
Town Estates 4,718 8,430 27 7,253 4,215 3,038 72%
Roads 9,630 14,711 814 1,172 6,522 (5,350) -82%
–
–
–
–
–
–
–
–
Example 9 - Vote9 1,477 1,430 – 78 469 715 (246) -34% –
Refuse Removal 1,477 1,430 78 469 715 (246) -34%
–
–
–
–
–
–
–
–
–
Example 10 - Vote10 17,541 23,490 – 983 7,532 12,356 (4,824) -39% –
Administration 157 500 250 (250) -100%
Distribution 17,384 22,990 983 7,532 12,106 (4,574) -38%
–
–
–
–
–
–
–
–
Example 11 - Vote11 – – – – – – – –
Subvote example 11 –
Subvote example 11 –
Subvote example 11 –
Subvote example 11 –
Subvote example 11 –
Subvote example 11 –
Subvote example 11 –
Subvote example 11 –
Subvote example 11 –
Subvote example 11 –
Example 12 - Vote12 – – – – – – – –
Subvote example 12 –
Subvote example 12 –
Subvote example 12 –
Subvote example 12 –
Subvote example 12 –
Subvote example 12 –
Subvote example 12 –
Subvote example 12 –
Subvote example 12 –
Subvote example 12 –
Example 13 - Vote13 – – – – – – – –
Subvote example 13 –
Subvote example 13 –
Subvote example 13 –
Subvote example 13 –
Subvote example 13 –
Subvote example 13 –
Subvote example 13 –
Subvote example 13 –
Subvote example 13 –
Subvote example 13 –
Example 14 - Vote14 – – – – – – – –
Subvote example 14 –
Subvote example 14 –
Subvote example 14 –
Subvote example 14 –
Subvote example 14 –
Subvote example 14 –
Subvote example 14 –
Subvote example 14 –
Subvote example 14 –
Subvote example 14 –
Example 15 - Vote15 – – – – – – – –
Subvote example 15 –
Subvote example 15 –
Subvote example 15 –
Subvote example 15 –
Subvote example 15 –
Subvote example 15 –
Subvote example 15 –
Subvote example 15 –
Subvote example 15 –
Subvote example 15 –
Total Revenue by Vote 2 62,188 78,382 – 4,013 37,099 47,698 (10,599) -22% – –
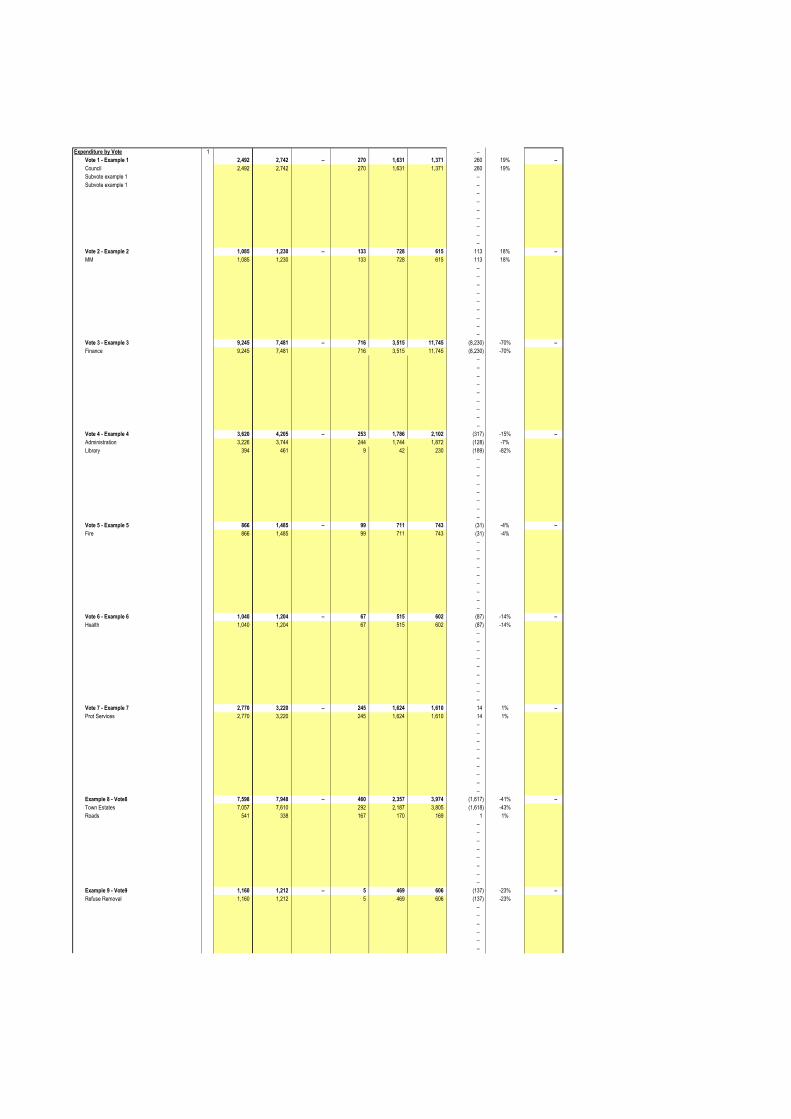
Expenditure by Vote 1 –
Vote 1 - Example 1 2,492 2,742 – 270 1,631 1,371 260 19% –
Council 2,492 2,742 270 1,631 1,371 260 19%
Subvote example 1 –
Subvote example 1 –
–
–
–
–
–
–
–
Vote 2 - Example 2 1,085 1,230 – 133 728 615 113 18% –
MM 1,085 1,230 133 728 615 113 18%
–
–
–
–
–
–
–
–
–
Vote 3 - Example 3 9,245 7,481 – 716 3,515 11,745 (8,230) -70% –
Finance 9,245 7,481 716 3,515 11,745 (8,230) -70%
–
–
–
–
–
–
–
–
–
Vote 4 - Example 4 3,620 4,205 – 253 1,786 2,102 (317) -15% –
Administration 3,226 3,744 244 1,744 1,872 (128) -7%
Library 394 461 9 42 230 (189) -82%
–
–
–
–
–
–
–
–
Vote 5 - Example 5 866 1,485 – 99 711 743 (31) -4% –
Fire 866 1,485 99 711 743 (31) -4%
–
–
–
–
–
–
–
–
–
Vote 6 - Example 6 1,040 1,204 – 67 515 602 (87) -14% –
Health 1,040 1,204 67 515 602 (87) -14%
–
–
–
–
–
–
–
–
–
Vote 7 - Example 7 2,770 3,220 – 245 1,624 1,610 14 1% –
Prot Services 2,770 3,220 245 1,624 1,610 14 1%
–
–
–
–
–
–
–
–
–
Example 8 - Vote8 7,598 7,948 – 460 2,357 3,974 (1,617) -41% –
Town Estates 7,057 7,610 292 2,187 3,805 (1,618) -43%
Roads 541 338 167 170 169 1 1%
–
–
–
–
–
–
–
–
Example 9 - Vote9 1,160 1,212 – 5 469 606 (137) -23% –
Refuse Removal 1,160 1,212 5 469 606 (137) -23%
–
–
–
–
–
–

–
–
–
Example 10 - Vote10 11,934 13,631 – 922 7,518 6,795 722 11% –
Administration 10,171 12,342 822 6,859 6,171 688 11%
Distribution 1,762 1,289 100 658 624 34 5%
–
–
–
–
–
–
–
–
Example 11 - Vote11 – – – – – – – –
Subvote example 11 –
Subvote example 11 –
Subvote example 11 –
Subvote example 11 –
Subvote example 11 –
Subvote example 11 –
Subvote example 11 –
Subvote example 11 –
Subvote example 11 –
Subvote example 11 –
Example 12 - Vote12 – – – – – – – –
Subvote example 12 –
Subvote example 12 –
Subvote example 12 –
Subvote example 12 –
Subvote example 12 –
Subvote example 12 –
Subvote example 12 –
Subvote example 12 –
Subvote example 12 –
Subvote example 12 –
Example 13 - Vote13 – – – – – – – –
Subvote example 13 –
Subvote example 13 –
Subvote example 13 –
Subvote example 13 –
Subvote example 13 –
Subvote example 13 –
Subvote example 13 –
Subvote example 13 –
Subvote example 13 –
Subvote example 13 –
Example 14 - Vote14 – – – – – – – –
Subvote example 14 –
Subvote example 14 –
Subvote example 14 –
Subvote example 14 –
Subvote example 14 –
Subvote example 14 –
Subvote example 14 –
Subvote example 14 –
Subvote example 14 –
Subvote example 14 –
Example 15 - Vote15 – – – – – – – –
Subvote example 15 –
Subvote example 15 –
Subvote example 15 –
Subvote example 15 –
Subvote example 15 –
Subvote example 15 –
Subvote example 15 –
Subvote example 15 –
Subvote example 15 –
Subvote example 15 –
Total Expenditure by Vote 2 41,809 44,358 – 3,170 20,854 30,164 (9,310) (0) – –
Surplus/ (Deficit) for the year 2 20,379 34,024 – 843 16,245 17,535 (1,289) (0) –
References
1. Insert 'Vote'; e.g. Department, if different to standard structure
2. Must reconcile to Financial Performance ('Revenue and Expenditure by Standard Classification' and 'Revenue and Expenditure')
3. Assign share in 'associate' to relevant Vote
check revenue
check expenditure

2010/11
Audited
Outcome
Original
Budget
Adjusted
Budget
Monthly
actualYearTD actual
YearTD
budget
YTD
variance
YTD
variance
Full Year
Forecast
R thousands %
Revenue By Source
Property rates 5,695 5,800 528 4,016 2,900 1,116 38%
Property rates - penalties & collection charges 495 300 51 318 150 168 112%
Service charges - electricity revenue 11,023 12,990 983 6,736 12,106 (5,370) -44%
Service charges - water revenue – –
Service charges - sanitation revenue – –
Service charges - refuse revenue 977 930 78 469 715 (246) -34%
Service charges - other –
Rental of facilities and equipment 394 357 25 100 85 15 18%
Interest earned - external investments 2,341 1,900 632 1,102 950 152 16%
Interest earned - outstanding debtors –
Dividends received –
Fines 19 52 103 247 25 222 888%
Licences and permits 2,587 2,728 186 1,363 1,364 (1) 0%
Agency services –
Transfers recognised - operational 22,651 21,470 1,418 19,995 27,471 (7,477) -27%
Other revenue 788 3,594 8 2,753 1,932 821 42%
Gains on disposal of PPE –
Total Revenue (excluding capital transfers and contributions)
46,971 50,121 – 4,013 37,099 47,698 (10,599) -22% –
Expenditure By Type
Employee related costs 13,916 16,008 1,134 7,273 7,933 (659) -8%
Remuneration of councillors 2,346 2,567 203 1,220 1,283 (63) -5%
Debt impairment 1,795 1,500 –
Depreciation & asset impairment 2,996 3,300 – – 1,650 (1,650) -100%
Finance charges –
Bulk purchases 8,863 11,000 851 6,659 5,667 992 18%
Other materials – –
Contracted services 658 1,929 62 337 365 (27) -8%
Transfers and grants 3,828 2,574 517 1,829 10,011 (8,182) -82%
Other expenditure 7,407 5,480 403 3,535 3,255 280 9%
Loss on disposal of PPE 120 –
Total Expenditure 41,928 44,358 – 3,170 20,854 30,164 (9,310) -31% –
Surplus/(Deficit) 5,043 5,763 – 843 16,245 17,535 (1,289) (0) –
Transfers recognised - capital 15,336 28,261 3,133 5,652 (2,520) (0)
Contributions recognised - capital –
Contributed assets –
Surplus/(Deficit) after capital transfers & contributions 20,379 34,024 – 843 19,378 23,187 –
Taxation –
Surplus/(Deficit) after taxation 20,379 34,024 – 843 19,378 23,187 –
Attributable to minorities
Surplus/(Deficit) attributable to municipality 20,379 34,024 – 843 19,378 23,187 –
Share of surplus/ (deficit) of associate
Surplus/ (Deficit) for the year 20,379 34,024 – 843 19,378 23,187 –
References
1. Material variances to be explained on Table SC1
Total Revenue (excluding capital transfers and contributions) including capital transfers/contributions etc62,307 78,382 4,013 40,231 53,350
Description Ref
Budget Year 2011/12
KZN285 Mthonjaneni - Table C4 Monthly Budget Statement - Financial Performance (revenue and expenditure) - M06 December

2010/11 Budget Year 2011/12
Audited
Outcome
Original
Budget
Adjusted
Budget
Monthly
actualYearTD actual
YearTD
budget
YTD
variance
YTD
variance
Full Year
Forecast
R thousands 1 %
Multi-Year expenditure appropriation 2
Vote 1 - Council 81 – 50 (4) 45 23 22 98% –
Vote 2 - Municipal Manager 6 – – – – – – –
Vote 3 - Financial Services 29 60 60 – 11 33 (22) -66% –
Vote 4 - Corporate and Community Services 430 – – (0) 3 2 1 76% –
Vote 5 - Publiv Safety – – – – – – – –
Vote 6 - Public Health 15 – – – – – – –
Vote 7 - Protection Services 22 155 155 – 88 77 10 13% –
Vote 8 - Technical Services 12,158 20,433 20,242 646 2,496 10,412 (7,915) -76% –
Vote 9 - Refuse Removal – – – – – – – –
Vote 10 - Electricity 7,123 11,350 11,590 68 1,199 6,401 (5,202) -81% –
Vote 11 - Example 11 – – – – – – – –
Vote 12 - Example 12 – – – – – – – –
Vote 13 - Example 13 – – – – – – – –
Vote 14 - Example 14 – – – – – – – –
Vote 15 - Example 15 – – – – – – – –
Total Capital Multi-year expenditure 4,7 19,864 31,998 32,097 710 3,842 16,948 (13,106) -77% –
Single Year expenditure appropriation 2
Vote 1 - Council – – – – – – – –
Vote 2 - Municipal Manager – – – – – – – –
Vote 3 - Financial Services – – – – – – – –
Vote 4 - Corporate and Community Services – – – – – – – –
Vote 5 - Publiv Safety – – – – – – – –
Vote 6 - Public Health – – – – – – – –
Vote 7 - Protection Services – – – – – – – –
Vote 8 - Technical Services – – – – – – – –
Vote 9 - Refuse Removal – – – – – – – –
Vote 10 - Electricity – – – – – – – –
Vote 11 - Example 11 – – – – – – – –
Vote 12 - Example 12 – – – – – – – –
Vote 13 - Example 13 – – – – – – – –
Vote 14 - Example 14 – – – – – – – –
Vote 15 - Example 15 – – – – – – – –
Total Capital single-year expenditure 4 – – – – – – – –
Total Capital Expenditure 19,864 31,998 32,097 710 3,842 16,948 (13,106) -77% –
Capital Expenditure - Standard Classification
Governance and administration 546 60 110 (4) 56 56 0 0% –
Executive and council 87 – 50 (4) 45 23 22 98%
Budget and treasury office 29 60 60 – 11 33 (22) -66%
Corporate services 430 – –
Community and public safety 3,456 6,606 8,476 360 1,063 4,317 (3,255) -75% –
Community and social services 3,441 6,606 8,476 360 1,063 4,317 (3,255) -75%
Sport and recreation –
Public safety –
Housing –
Health 15 – –
Economic and environmental services 8,739 13,982 11,921 286 1,524 6,174 (4,649) -75% –
Planning and development –
Road transport 8,739 13,982 11,921 286 1,524 6,174 (4,649) -75%
Environmental protection –
Trading services 7,123 11,350 11,590 68 1,199 6,401 (5,202) -81% –
Electricity 7,123 11,350 11,590 68 1,199 6,401 (5,202) -81%
Water –
Waste water management –
Waste management – –
Other –
Total Capital Expenditure - Standard Classification 3 19,864 31,998 32,097 710 3,842 16,948 (13,106) -77% –
Funded by:
National Government 19,336 28,261 28,360 45 835 911 (75) -8%
Provincial Government –
District Municipality –
Other transfers and grants –
Transfers recognised - capital 19,336 28,261 28,360 45 835 911 (75) -8% –
Public contributions & donations 5 –
Borrowing 6 –
Internally generated funds 527 3,737 3,737 665 3,007 16,037 (13,030) -81%
Total Capital Funding 19,864 31,998 32,097 710 3,842 16,948 (13,106) -77% –
References
1. Municipalities may choose to appropriate for capital expenditure for three years or for one year (if one year appropriation projected expenditure required for yr2 and yr3).
5. Must reconcile to Monthly Budget Statement Financial Performance (revenue and expenditure)
6. Include finance leases and PPP capital funding component of unitary payment - total borrowing/repayments to reconcile to changes in Table SA17
KZN285 Mthonjaneni - Table C5 Monthly Budget Statement - Capital Expenditure (municipal vote, standard classification and funding) - M06 December
2. Include capital component of PPP unitary payment
4. Include expenditure on investment property, intangible and biological assets
3. Capital expenditure by standard classification must reconcile to the total of multi-year and single year appropriations
Vote Description Ref

Vote Description Ref 2010/11
R thousandAudited
Outcome
Original
Budget
Adjusted
BudgetMonthly actual YearTD actual YearTD budget YTD variance YTD variance
Full Year
Forecast
%
Capital expenditure - Municipal Vote
Expenditure of multi-year capital appropriation 1
Vote 1 - Council 81 – 50 (4) 45 23 22 98% –
Council 81 50 (4) 45 23 22 98%
Subvote example 1 –
Subvote example 1 –
–
–
–
–
–
–
–
Example 2 - Vote2 6 – – – – – – –
MM 6 –
–
–
–
–
–
–
–
–
–
Example 3 - Vote3 29 60 60 – 11 33 (22) -66% –
Finance 29 60 60 – 11 33 (22) -66%
–
–
–
–
–
–
–
–
–
Example 4 - Vote4 430 – – (0) 3 2 1 76% –
Administration 430 –
Library (0) 3 2 1 76%
–
–
–
–
–
–
–
–
Example 5 - Vote5 – – – – – – – –
Fire –
–
–
–
–
–
–
–
–
–
Example 6 - Vote6 15 – – – – – – –
Health 15 –
–
–
–
–
–
–
–
–
–
Example 7 - Vote7 22 155 155 – 88 77 10 13% –
Prot Services 22 155 155 – 88 77 10 13%
–
–
–
–
–
–
–
–
Budget Year 2011/12
KZN285 Mthonjaneni - Table C5 Monthly Budget Statement - Capital Expenditure (municipal vote, standard classification and funding) - A - M06 December

–
Example 8 - Vote8 12,158 20,433 20,242 646 2,496 10,412 (7,915) -76% –
Town Estates 3,441 6,606 8,476 361 972 4,238 (3,266) -77%
Roads 8,717 13,827 11,766 286 1,524 6,174 (4,649) -75%
–
–
–
–
–
–
–
–
Example 9 - Vote9 – – – – – – – –
Refuse Removal –
–
–
–
–
–
–
–
–
–
Example 10 - Vote10 7,123 11,350 11,590 68 1,199 6,401 (5,202) -81% –
Administration –
Distribution 7,123 11,350 11,590 68 1,199 6,401 (5,202) -81%
–
–
–
–
–
–
–
–
Example 11 - Vote11 – – – – – – – –
Subvote example 11 –
Subvote example 11 –
Subvote example 11 –
Subvote example 11 –
Subvote example 11 –
Subvote example 11 –
Subvote example 11 –
Subvote example 11 –
Subvote example 11 –
Subvote example 11 –
Example 12 - Vote12 – – – – – – – –
Subvote example 12 –
Subvote example 12 –
Subvote example 12 –
Subvote example 12 –
Subvote example 12 –
Subvote example 12 –
Subvote example 12 –
Subvote example 12 –
Subvote example 12 –
Subvote example 12 –
Example 13 - Vote13 – – – – – – – –
Subvote example 13 –
Subvote example 13 –
Subvote example 13 –
Subvote example 13 –
Subvote example 13 –
Subvote example 13 –
Subvote example 13 –
Subvote example 13 –
Subvote example 13 –
Subvote example 13 –
Example 14 - Vote14 – – – – – – – –
Subvote example 14 –
Subvote example 14 –
Subvote example 14 –
Subvote example 14 –
Subvote example 14 –
Subvote example 14 –
Subvote example 14 –
Subvote example 14 –
Subvote example 14 –
Subvote example 14 –
Example 15 - Vote15 – – – – – – – –
Subvote example 15 –
Subvote example 15 –
Subvote example 15 –
Subvote example 15 –
Subvote example 15 –
Subvote example 15 –
Subvote example 15 –
Subvote example 15 –
Subvote example 15 –
Subvote example 15 –
Total multi-year capital expenditure 19,864 31,998 32,097 710 3,842 16,948 (13,106) -77% –

–
Capital expenditure - Municipal Vote
Expenditue of single-year capital appropriation 1 –
Vote 1 - Council – – – – – – – –
Council –
Subvote example 1 –
Subvote example 1 –
–
–
–
–
–
–
–
Example 2 - Vote2 – – – – – – – –
MM –
–
–
–
–
–
–
–
–
–
Example 3 - Vote3 – – – – – – – –
Finance –
–
–
–
–
–
–
–
–
–
Example 4 - Vote4 – – – – – – – –
Administration –
Library –
–
–
–
–
–
–
–
–
Example 5 - Vote5 – – – – – – – –
Fire –
–
–
–
–
–
–
–
–
–
Example 6 - Vote6 – – – – – – – –
Health –
–
–
–
–
–
–
–
–
–
Example 7 - Vote7 – – – – – – – –
Prot Services –
–
–
–
–
–
–
–
–
–
Example 8 - Vote8 – – – – – – – –
Town Estates –
Roads –
–
–
–
–
–
–
–
–
Example 9 - Vote9 – – – – – – – –
Refuse Removal –
–
–
–
–
–
–
–
–
–
Example 10 - Vote10 – – – – – – – –
Administration –
Distribution –
–
–
–
–
–
–
–
–
Example 11 - Vote11 – – – – – – – –
Subvote example 11 –
Subvote example 11 –
Subvote example 11 –
Subvote example 11 –
Subvote example 11 –
Subvote example 11 –
Subvote example 11 –
Subvote example 11 –
Subvote example 11 –
Subvote example 11 –
Example 12 - Vote12 – – – – – – – –
Subvote example 12 –
Subvote example 12 –
Subvote example 12 –
Subvote example 12 –
Subvote example 12 –
Subvote example 12 –
Subvote example 12 –
Subvote example 12 –
Subvote example 12 –
Subvote example 12 –
Example 13 - Vote13 – – – – – – – –
Subvote example 13 –
Subvote example 13 –
Subvote example 13 –
Subvote example 13 –
Subvote example 13 –
Subvote example 13 –
Subvote example 13 –
Subvote example 13 –
Subvote example 13 –
Subvote example 13 –
Example 14 - Vote14 – – – – – – – –
Subvote example 14 –
Subvote example 14 –
Subvote example 14 –
Subvote example 14 –
Subvote example 14 –
Subvote example 14 –
Subvote example 14 –
Subvote example 14 –
Subvote example 14 –
Subvote example 14 –
Example 15 - Vote15 – – – – – – – –
Subvote example 15 –
Subvote example 15 –
Subvote example 15 –
Subvote example 15 –
Subvote example 15 –
Subvote example 15 –
Subvote example 15 –
Subvote example 15 –
Subvote example 15 –
Subvote example 15 –
Total single-year capital expenditure – – – – – – – – –
Total Capital Expenditure 19,864 31,998 32,097 710 3,842 16,948 (13,106) (0) –
References
1. Insert 'Vote'; e.g. Department, if different to standard structure

2010/11 Budget Year 2011/12
Audited
Outcome
Original
Budget
Adjusted
BudgetYearTD actual
Full Year
Forecast
R thousands 1
ASSETS
Current assets
Cash 4,670 8,244 18,850
Call investment deposits 30,040 30,040 45,040
Consumer debtors 3,702 2,786 5,260
Other debtors 1,789 200 591
Current portion of long-term receivables
Inventory 274 265 309
Total current assets 40,476 41,535 – 70,049 –
Non current assets
Long-term receivables
Investments
Investment property
Investments in Associate
Property, plant and equipment 70,757 106,262 70,834
Agricultural
Biological assets 5,136 5,136 5,136
Intangible assets 53
Other non-current assets
Total non current assets 75,946 111,398 – 75,970 –
TOTAL ASSETS 116,423 152,933 – 146,019 –
LIABILITIES
Current liabilities
Bank overdraft
Borrowing –
Consumer deposits 490 400 552
Trade and other payables 5,976 5,500 23,806
Provisions 413 350 283
Total current liabilities 6,880 6,250 – 24,640 –
Non current liabilities
Borrowing
Provisions 1,975 1,424 1,914
Total non current liabilities 1,975 1,424 – 1,914 –
TOTAL LIABILITIES 8,854 7,674 – 26,554 –
NET ASSETS 2 107,568 145,260 – 119,465 –
COMMUNITY WEALTH/EQUITY
Accumulated Surplus/(Deficit) 107,568 145,260 119,465
Reserves
TOTAL COMMUNITY WEALTH/EQUITY 2 107,568 145,260 – 119,465 –
Description Ref
KZN285 Mthonjaneni - Table C6 Monthly Budget Statement - Financial Position - M06 December

2010/11 Budget Year 2011/12
Audited
Outcome
Original
Budget
Adjusted
Budget
Monthly
actualYearTD actual
YearTD
budget
YTD
variance
YTD
variance
Full Year
Forecast
R thousands 1 %
CASH FLOW FROM OPERATING ACTIVITIES
Receipts
Ratepayers and other 15,046 24,551 1,273 7,969 6,138 1,831 30%
Government - operating 18,651 21,470 – 21,680 4,294 17,386 405%
Government - capital 19,336 28,261 – 4,000 9,420 (5,420) -58%
Interest 2,341 1,900 569 990 792 198 25%
Dividends –
Payments
Suppliers and employees (39,878) (39,558) (19,580) (10,868) (16,483) (5,615) 34%
Finance charges –
Transfers and Grants –
NET CASH FROM/(USED) OPERATING ACTIVITIES 15,496 36,624 – (17,737) 23,772 4,161 19,611 471% –
CASH FLOWS FROM INVESTING ACTIVITIES
Receipts
Proceeds on disposal of PPE 279 –
Decrease (Increase) in non-current debtors –
Decrease (increase) other non-current receivables –
Decrease (increase) in non-current investments –
Payments
Capital assets (19,864) (31,998) (710) (3,842) (16,948) (13,106) 77%
NET CASH FROM/(USED) INVESTING ACTIVITIES (19,585) (31,998) – (710) (3,842) (16,948) (13,106) 77% –
CASH FLOWS FROM FINANCING ACTIVITIES
Receipts
Short term loans –
Borrowing long term/refinancing –
Increase (decrease) in consumer deposits (52) 8 8 8 –
Payments
Repayment of borrowing –
NET CASH FROM/(USED) FINANCING ACTIVITIES (52) – – 8 8 8 – –
NET INCREASE/ (DECREASE) IN CASH HELD (4,141) 4,626 – (18,439) 19,937 (12,779) –
Cash/cash equivalents at beginning: 38,851 34,710 46,930 34,710 46,930
Cash/cash equivalents at month/year end: 34,710 39,336 – 66,867 21,931 46,930
Description Ref
KZN285 Mthonjaneni - Table C7 Monthly Budget Statement - Cash Flow - M06 December
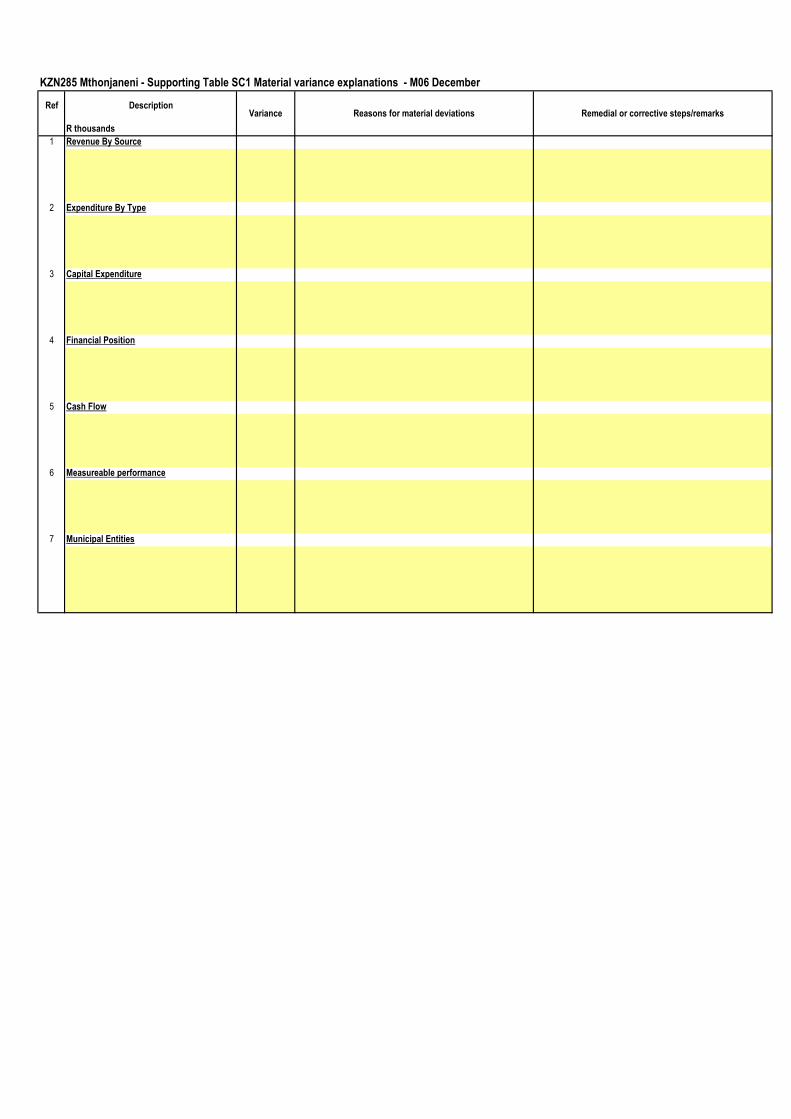
Variance Reasons for material deviations Remedial or corrective steps/remarks
R thousands
1 Revenue By Source
2 Expenditure By Type
3 Capital Expenditure
4 Financial Position
5 Cash Flow
6 Measureable performance
7 Municipal Entities
Ref Description
KZN285 Mthonjaneni - Supporting Table SC1 Material variance explanations - M06 December

2010/11 Budget Year 2011/12
Audited
Outcome
Original
Budget
Adjusted
BudgetYearTD actual
Full Year
Forecast
Percentage
Borrowing Management
Borrowing to Asset Ratio Total Long-term Borrowing/ Total Assets 0.0% 0.0% 0.0% 0.0% 0.0%
Capital Charges to Operating Expenditure Interest & principal paid/Operating Expenditure 7.1% 7.4% 0.0% 0.0% 0.0%
Borrowed funding of capital expenditure Borrowings/Capital expenditure excl. transfers and grants 0.0% 0.0% 0.0% 0.0% 0.0%
Safety of Capital
Debt to Equity Loans, Accounts Payable, Overdraft & Tax Provision/
Funds & Reserves
5.6% 3.8% 0.0% 19.9% 0.0%
Gearing Long Term Borrowing/ Funds & Reserves 0.0% 0.0% 0.0% 0.0% 0.0%
Liquidity
Current Ratio 1 Current assets/current liabilities 1 588.3% 664.6% 0.0% 284.3% 0.0%
Liquidity Ratio Monetary Assets/Current Liabilities 504.5% 612.5% 0.0% 259.3% 0.0%
Revenue Management
Annual Debtors Collection Rate
(Payment Level %)
Last 12 Mths Receipts/ Last 12 Mths Billing
Outstanding Debtors to Revenue Total Outstanding Debtors to Annual Revenue 11.7% 6.0% 0.0% 15.8% 0.0%
Longstanding Debtors Reduction Due To Recovery Debtors > 12 Mths Recovered/Total Debtors >
12 Months Old
0.0% 0.0% 0.0% 0.0% 0.0%
Creditors Management
Creditors System Efficiency % of Creditors Paid Within Terms (within MFMA s 65(e))
Funding of Provisions
Percentage Of Provisions Not Funded Unfunded Provisions/Total Provisions
Other Indicators
Electricity Distribution Losses % Volume (units purchased and generated less units
sold)/units purchased and generated
2
Water Distribution Losses % Volume (units purchased and own source less units
sold)/Total units purchased and own source
2
Employee costs Employee costs/Total Revenue - capital revenue 29.6% 31.9% 0.0% 19.6% 0.0%
Repairs & Maintenance R&M/Total Revenue - capital revenue 0.0% 4.0% 0.0% 1.4% 0.0%
Interest & Depreciation I&D/Total Revenue - capital revenue 6.4% 6.6% 0.0% 0.0% 0.0%
IDP regulation financial viability indicators
i. Debt coverage (Total Operating Revenue - Operating Grants)/Debt
service payments due within financial year)
ii. O/S Service Debtors to Revenue Total outstanding service debtors/annual revenue
received for services
iii. Cost coverage (Available cash + Investments)/monthly fixed operational
expenditure
Description of financial indicator Basis of calculation Ref
KZN285 Mthonjaneni - Supporting Table SC2 Monthly Budget Statement - performance indicators - M06 December

Description Budget Year 2011/12
0-30 Days 31-60 Days 61-90 Days 91-120 Days 121-150 Dys 151-180 Dys 181 Dys-1 Yr Over 1Yr
R thousands
Debtors Age Analysis By Revenue Source
Rates 1200 410 333 261 231 221 3,280 – 4,735 –
Electricity 1300 904 355 21 23 15 313 – 1,632
Water 1400 –
Sewerage / Sanitation 1500 –
Refuse Removal 1600 83 53 15 11 8 146 – 317
Housing (Rental Revenue) 1700 –
Other 1900 –
Total By Revenue Source 2000 1,397 741 297 265 244 3,739 – – 6,683 –
2010/11 - totals only 1,327 704 282 252 232 3,552 – – 6,349
Debtors Age Analysis By Customer Category
Government 2200 264 175 143 136 136 2,015 – 2,869
Business 2300 25 20 19 14 13 335 – 425
Households 2400 1,114 544 136 115 95 1,390 – 3,394
Other 2500 (7) 2 (5)
Total By Customer Category 2600 1,397 741 297 265 244 3,739 – – 6,683 –
KZN285 Mthonjaneni - Supporting Table SC3 Monthly Budget Statement - aged debtors - M06 December
Bad
Debts
NT
CodeTotal

Budget Year 2011/12
R thousands
Creditors Age Analysis By Customer Type
Bulk Electricity 0100 –
Bulk Water 0200 –
PAYE deductions 0300 –
VAT (output less input) 0400 –
Pensions / Retirement deductions 0500 –
Loan repayments 0600 –
Trade Creditors 0700 56 56
Auditor General 0800 –
Other 0900 –
Total By Customer Type 2600 56 – – – – – – – 56
0 -
30 Days
31 -
60 Days
KZN285 Mthonjaneni - Supporting Table SC4 Monthly Budget Statement - aged creditors - M06 December
181 Days -
1 Year
Over 1
Year
Total61 -
90 Days
91 -
120 Days
121 -
150 Days
151 -
180 Days
Description NT
Code

Investments by maturity
Name of institution & investment ID
Period of
Investment
R thousands Yrs/Months
Municipality
FNB 12M fixed deposit 10 May 2012 1,540 1,540
FNB call 500 500
ABSA 12M fixed deposit 03 December 2012 9,000 9,000
FNB 3M fixed deposit 27 January 2012 % 9,000 9,000
Nedbank 12M fixed deposit 08 March 2012 25,000 25,000
Municipality sub-total – 45,040 – 45,040
Entities
Entities sub-total – – – –
TOTAL INVESTMENTS AND INTEREST 2 – 45,040 – 45,040
KZN285 Mthonjaneni - Supporting Table SC5 Monthly Budget Statement - investment portfolio - M06 December
Ref
Type of
Investment
Expiry date of
investment
Market value
at end of the
month
Accrued
interest for
the month
Yield for the
month 1
(%)
Market value
at beginning
of the month
Change in
market value

2010/11 Budget Year 2011/12
Audited
Outcome
Original
Budget
Adjusted
Budget
Monthly
actualYearTD actual
YearTD
budget
YTD
variance
YTD
variance
Full Year
Forecast
R thousands %
RECEIPTS: 1,2
Operating Transfers and Grants
National Government: 15,843 19,836 – – 14,252 9,270 3,719 40.1% –
Local Government Equitable Share 13,893 17,596 – 12,012 8,293 3,719 44.8%
Finance Management 1,200 1,450 – 1,450 609
Municipal Systems Improvement 750 790 – 790 368
3 –
–
–
–
–
Other transfers and grants [insert description] –
Provincial Government: 979 1,735 – 219 363 8,832 (8,469) -95.9% –
Health 883 1,300 184 184 650 (466) -71.7%
LUMS
SMALL TOWN REHABILITION – 3 6,667 (6,664) -100.0%
NDUNDULU STALLS 4 1,333 (1,333) -100.0%
MAP –
Library 96 435 – 35 176 182 (6) -3.2%
District Municipality: – – – – – – – –
UTHUNGULU –
–
Other grant providers: – – – – – – – –
[insert description] –
–
Total Operating Transfers and Grants 5 16,822 21,571 – 219 14,615 18,102 (4,750) -26.2% –
Capital Transfers and Grants
National Government: 12,964 25,261 – 814 1,968 12,778 (4,875) -38.2% –
Municipal Infrastructure Grant (MIG) 8,664 10,761 814 1,172 6,047 (4,875) -80.6%
Other capital transfers/grants E/Share 4,300 4,500 1,125
INEP 10,000 – 796 5,606
–
–
–
–
Other capital transfers [insert description] –
Provincial Government: – – – – – – – –
[insert description] –
–
District Municipality: – – – – – – – –
[insert description] –
–
Other grant providers: – – – – – – – –
[insert description] –
–
Total Capital Transfers and Grants 5 12,964 25,261 – 814 1,968 12,778 (4,875) -38.2% –
TOTAL RECEIPTS OF TRANSFERS & GRANTS 5 29,786 46,832 – 1,033 16,583 30,880 (9,625) -31.2% –
Description Ref
KZN285 Mthonjaneni - Supporting Table SC6 Monthly Budget Statement - transfers and grant receipts - M06 December
2010/11 Budget Year 2011/12
Audited
Outcome
Original
Budget
Adjusted
Budget
Monthly
actualYearTD actual
YearTD
budget
YTD
variance
YTD
variance
Full Year
Forecast
R thousands %
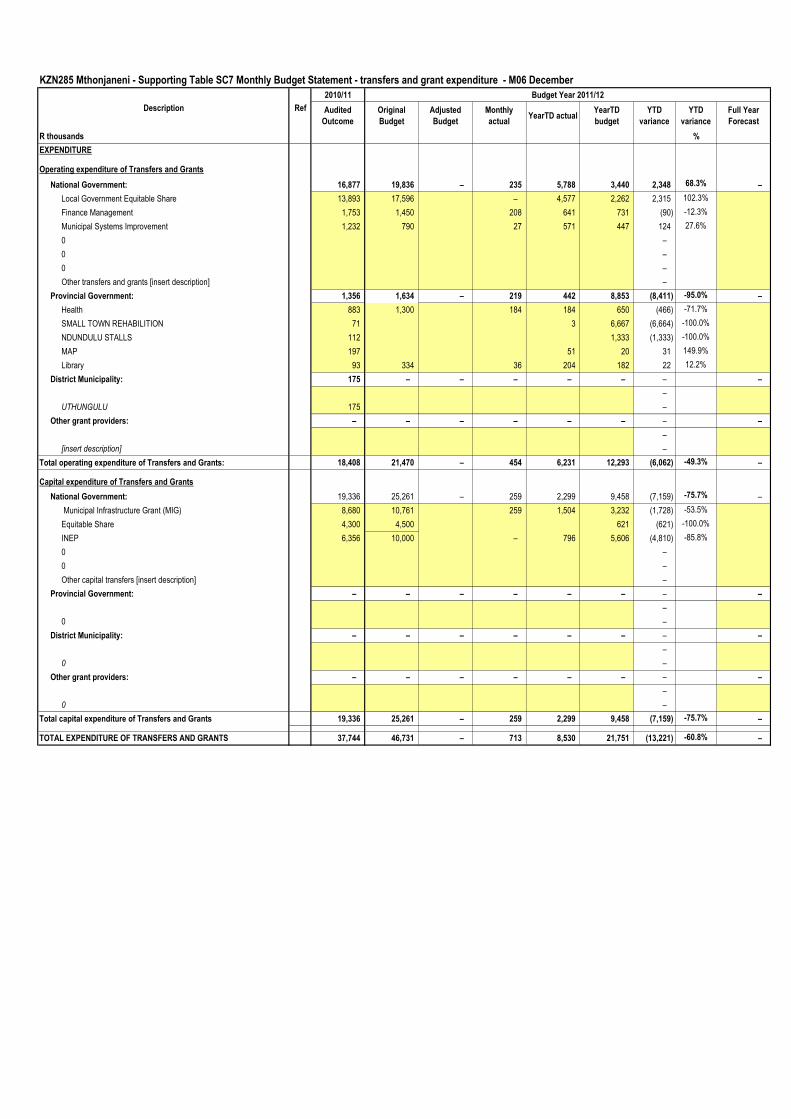
EXPENDITURE
Operating expenditure of Transfers and Grants
National Government: 16,877 19,836 – 235 5,788 3,440 2,348 68.3% –
Local Government Equitable Share 13,893 17,596 – 4,577 2,262 2,315 102.3%
Finance Management 1,753 1,450 208 641 731 (90) -12.3%
Municipal Systems Improvement 1,232 790 27 571 447 124 27.6%
0 –
0 –
0 –
Other transfers and grants [insert description] –
Provincial Government: 1,356 1,634 – 219 442 8,853 (8,411) -95.0% –
Health 883 1,300 184 184 650 (466) -71.7%
SMALL TOWN REHABILITION 71 3 6,667 (6,664) -100.0%
NDUNDULU STALLS 112 1,333 (1,333) -100.0%
MAP 197 51 20 31 149.9%
Library 93 334 36 204 182 22 12.2%
District Municipality: 175 – – – – – – –
–
UTHUNGULU 175 –
Other grant providers: – – – – – – – –
–
[insert description] –
Total operating expenditure of Transfers and Grants: 18,408 21,470 – 454 6,231 12,293 (6,062) -49.3% –
Capital expenditure of Transfers and Grants
National Government: 19,336 25,261 – 259 2,299 9,458 (7,159) -75.7% –
Municipal Infrastructure Grant (MIG) 8,680 10,761 259 1,504 3,232 (1,728) -53.5%
Equitable Share 4,300 4,500 621 (621) -100.0%
INEP 6,356 10,000 – 796 5,606 (4,810) -85.8%
0 –
0 –
Other capital transfers [insert description] –
Provincial Government: – – – – – – – –
–
0 –
District Municipality: – – – – – – – –
–
0 –
Other grant providers: – – – – – – – –
–
0 –
Total capital expenditure of Transfers and Grants 19,336 25,261 – 259 2,299 9,458 (7,159) -75.7% –
TOTAL EXPENDITURE OF TRANSFERS AND GRANTS 37,744 46,731 – 713 8,530 21,751 (13,221) -60.8% –
Description Ref
KZN285 Mthonjaneni - Supporting Table SC7 Monthly Budget Statement - transfers and grant expenditure - M06 December

2010/11 Budget Year 2011/12
Audited
Outcome
Original
Budget
Adjusted
Budget
Monthly
actualYearTD actual
YearTD
budget
YTD
variance
YTD
variance
Full Year
Forecast
R thousands %
1 A B C D
Councillors (Political Office Bearers plus Other)
Salary 1,431 1,557 128 768 779 (10) -1%
Pension Contributions 198 233 17 100 116 (16) -14%
Medical Aid Contributions 29 37 – 3 18 (16) -84%
Motor vehicle allowance 572 609 12 87 30 57 189%
Cell phone and other allowances 116 131 58 349 370
Housing allowance –
Sub Total - Councillors 2,346 2,567 – 215 1,307 1,313 (7) -1% –
% increase 4 9.4%
Senior Managers of the Municipality 3
Salary 1,847 1,945 138 622 641 (19) -3%
Pension Contributions –
Medical Aid Contributions –
Motor vehicle and cell phone –
Housing allowance –
Performance Bonus 238 272 176 176 136 40 29%
Other benefits or allowances – –
In-kind benefits 2 –
Sub Total - Senior Managers of Municipality 2,085 2,217 – 314 798 777 21 3% –
% increase 4 6.3%
Other Municipal Staff
Basic Salaries and Wages 9,469 11,345 803 6,260 6,583 (324) -5%
Pension Contributions 943 1,271 89 488 635 (147) -23%
Medical Aid Contributions 440 750 45 247 375 (128) -34%
Motor vehicle and cell phone –
Housing allowance –
Overtime –
Performance Bonus – –
Other benefits or allowances – –
In-kind benefits 2 227 225 22 103 165 (62) -38%
Sub Total - Other Municipal Staff 11,080 13,591 – 959 7,098 7,759 (661) -9% –
% increase 4 22.7%
Total Parent Municipality 15,511 18,375 – 1,488 9,202 9,849 (647) -7% –
18.5%Unpaid salary, allowances & benefits in arrears:
Board Members of Entities
Salary –
Pension Contributions –
Medical Aid Contributions –
Cell phone and other allowances –
Cell phone and other allowances
Housing allowance –
Board Fees –
In-kind benefits –
Sub Total - Board Members of Entities 2 – – – – – – – –
% increase 4
Senior Managers of Entities
Salary –
Pension Contributions –
Medical Aid Contributions –
Motor vehicle and cell phone –
Housing allowance –
Performance Bonus –
Other benefits or allowances –
In-kind benefits 2 –
Sub Total - Senior Managers of Entities – – – – – – – –
% increase 4
Other Staff of Entities
Basic Salaries and Wages –
Pension Contributions –
Medical Aid Contributions –
Motor vehicle and cell phone –
Housing allowance –
Overtime –
Performance Bonus –
Other benefits or allowances –
In-kind benefits 2 –
Sub Total - Other Staff of Entities – – – – – – – –
% increase 4
Total Municipal Entities – – – – – – – –
TOTAL SALARY, ALLOWANCES & BENEFITS 15,511 18,375 – 1,488 9,202 9,849 (647) -7% –
% increase 4 18.5%
TOTAL MANAGERS AND STAFF 13,165 15,808 – 1,272 7,895 8,536 –
Summary of Employee and Councillor remuneration Ref
KZN285 Mthonjaneni - Supporting Table SC8 Monthly Budget Statement - counillor and staff benefits - M06 December

KZN285 Mthonjaneni - Supporting Table SC9 Monthly Budget Statement - actuals and revised targets for cash receipts - M06 December
July August Sept October Nov Dec January Feb March April May June
R thousands 1 Outcome Outcome Outcome Outcome Outcome Outcome Budget Budget Budget Budget Budget Budget
Cash Receipts By Source
Property rates 1,378 528 528 528 526 528 580 580 580 580 (536) 5,800
Property rates - penalties & collection charges 48 51 52 58 58 51 25 25 25 25 25 (143) 300
Service charges - electricity revenue 1,279 1,270 1,102 1,076 1,017 827 1,080 1,080 1,080 1,080 1,080 1,018 12,990
Service charges - water revenue – –
Service charges - sanitation revenue – –
Service charges - refuse 78 77 80 78 78 78 80 80 80 80 80 61 930
Service charges - other – –
Rental of facilities and equipment 272 19 17 9 19 25 30 30 30 30 30 (153) 357
Interest earned - external investments 42 58 177 64 127 632 155 155 155 155 155 23 1,900
Interest earned - outstanding debtors – –
Dividends received – –
Fines 23 0 13 14 94 103 4 4 4 4 4 (215) 52
Licences and permits 253 196 225 232 260 186 225 225 225 225 225 251 2,728
Agency services – –
Transfer receipts - operating 11,447 233 220 786 8,125 1,418 7,470 (8,229) 21,470
Other revenue 2,205 4 12 181 42 164 0 0 0 0 0 984 3,594
Cash Receipts by Source 17,024 2,436 2,427 3,027 10,346 4,013 2,179 2,179 9,649 2,179 1,599 (6,939) 50,121 – – –
Other Cash Flows by Source –
Transfer receipts - capital 3,932 4,000 9,261 11,068 28,261
Contributions & Contributed assets –
Proceeds on disposal of PPE –
Short term loans –
Borrowing long term/refinancing –
Increase in consumer deposits –
Receipt of non-current debtors –
Receipt of non-current receivables –
Change in non-current investments –
Total Cash Receipts by Source 20,956 2,436 2,427 3,027 14,346 4,013 2,179 2,179 18,910 2,179 1,599 4,129 78,382 – – – –
Cash Payments by Type –
Employee related costs 1,006 1,059 1,099 1,106 1,869 1,134 1,300 1,300 1,300 1,300 1,300 2,235 16,008
Remuneration of councillors 213 203 203 203 219 203 203 203 203 203 203 307 2,567
Interest paid – –
Bulk purchases - Electricity 1,170 1,525 1,335 862 865 851 1,525 1,525 1,525 1,525 1,525 (3,234) 11,000
Bulk purchases - Water & Sewer – –
Other materials 0 – – – – – – – – – – (0) –
Contracted services 28 58 66 60 63 62 165 165 165 165 165 767 1,929
Grants and subsidies paid - other municipalities – – – – – – – – – – – – –
Grants and subsidies paid - other 177 220 305 576 373 517 210 210 210 210 210 (644) 2,574
General expenses 310 607 496 787 641 403 470 470 470 470 470 (114) 5,480
Cash Payments by Type 2,904 3,672 3,504 3,595 4,030 3,170 3,873 3,873 3,873 3,873 3,873 (683) 39,558 – – –
Other Cash Flows/Payments by Type
Capital assets 141 201 780 739 1,272 710 2,325 2,325 2,325 2,325 2,325 16,531 31,998
Repayment of borrowing –
Other Cash Flows/Payments –
Total Cash Payments by Type 3,045 3,873 4,284 4,334 5,302 3,879 6,198 6,198 6,198 6,198 6,198 15,848 71,556 – – –
NET INCREASE/(DECREASE) IN CASH HELD 17,911 (1,437) (1,857) (1,306) 9,044 134 (4,019) (4,019) 12,712 (4,019) (4,599) (11,719) 6,826 – –
Cash/cash equivalents at the month/year beginning: 4,669 22,580 21,143 19,285 17,979 27,023 27,157 23,138 19,119 31,832 27,813 23,214 4,669 11,495 11,495
Cash/cash equivalents at the month/year end: 22,580 21,143 19,285 17,979 27,023 27,157 23,138 19,119 31,832 27,813 23,214 11,495 11,495 11,495 11,495
Budget Year
+1 2012/13
Budget Year
+2 2013/14
Description
Budget Year
2011/12
RefBudget Year 2011/12
2011/12 Medium Term Revenue &
Expenditure Framework

2010/11 Budget Year 2011/12
Audited
Outcome
Original
Budget
Adjusted
Budget
Monthly
actualYearTD actual
YearTD
budget
YTD
variance
YTD
variance
Full Year
Forecast
R thousands 1 %
Revenue By Source
Property rates –
Property rates - penalties & collection charges –
Service charges - electricity revenue –
Service charges - water revenue –
Service charges - sanitation revenue –
Service charges - refuse revenue –
Service charges - other –
Rental of facilities and equipment –
Interest earned - external investments –
Interest earned - outstanding debtors –
Dividends received –
Fines –
Licences and permits –
Agency services –
Transfers recognised - operational –
Other revenue –
Gains on disposal of PPE –
Total Revenue (excluding capital transfers and contributions) – – – – – – – –
Expenditure By Type
Employee related costs –
Remuneration of councillors –
Debt impairment –
Depreciation & asset impairment –
Finance charges –
Bulk purchases –
Other materials –
Contracted services –
Transfers and grants –
Other expenditure –
Loss on disposal of PPE –
Total Expenditure – – – – – – – – –
Surplus/(Deficit) – – – – – – – –
Transfers recognised - capital –
Contributions recognised - capital –
Contributed assets –
Surplus/(Deficit) after capital transfers & contributions – – – – – – – –
Taxation –
Surplus/(Deficit) after taxation – – – – – – – –
Description Ref
KZN285 Mthonjaneni - NOT REQUIRED - municipality does not have entities or this is the parent municipality's budget - M06 December

2010/11
Audited
Outcome
Original
Budget
Adjusted
Budget
Monthly
actualYearTD actual
YearTD
budget
YTD
variance
YTD
variance
Full Year
Forecast
R thousands %
Revenue By Municipal Entity
Insert name of municipal entity –
–
–
–
–
–
–
–
–
–
Total Operating Revenue 1 – – – – – – – –
Expenditure By Municipal Entity
Insert name of municipal entity –
–
–
–
–
–
–
–
–
–
Total Operating Expenditure 2 – – – – – – – –
Surplus/ (Deficit) for the yr/period – – – – – – – –
Capital Expenditure By Municipal Entity
Insert name of municipal entity –
–
–
–
–
–
–
–
–
Total Capital Expenditure 3 – – – – – – – –
Description Ref
KZN285 Mthonjaneni - NOT REQUIRED - municipality does not have entities or this is the parent municipality's budget - M06 December
Budget Year 2011/12
2010/11
Audited
Outcome
Original
Budget
Adjusted
Budget
Monthly
actualYearTD actual
YearTD
budget
YTD
variance
YTD
variance
% spend of
Original
Budget
R thousands %
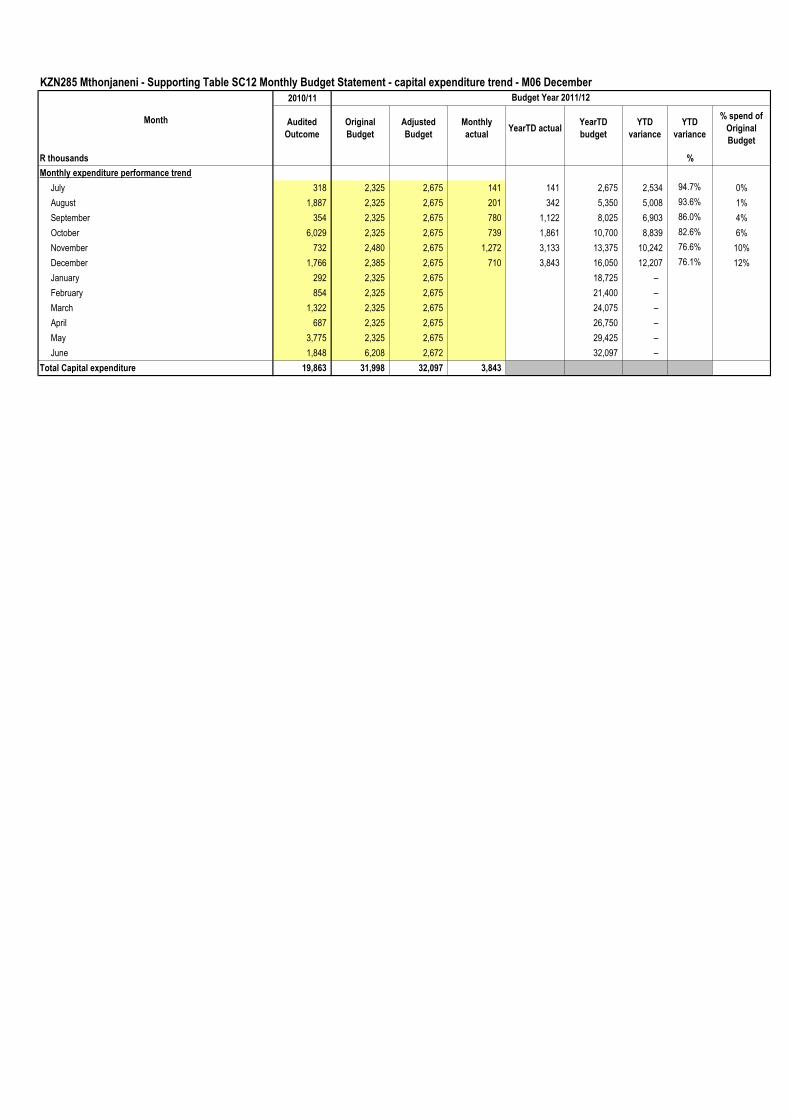
Monthly expenditure performance trend
July 318 2,325 2,675 141 141 2,675 2,534 94.7% 0%
August 1,887 2,325 2,675 201 342 5,350 5,008 93.6% 1%
September 354 2,325 2,675 780 1,122 8,025 6,903 86.0% 4%
October 6,029 2,325 2,675 739 1,861 10,700 8,839 82.6% 6%
November 732 2,480 2,675 1,272 3,133 13,375 10,242 76.6% 10%
December 1,766 2,385 2,675 710 3,843 16,050 12,207 76.1% 12%
January 292 2,325 2,675 18,725 –
February 854 2,325 2,675 21,400 –
March 1,322 2,325 2,675 24,075 –
April 687 2,325 2,675 26,750 –
May 3,775 2,325 2,675 29,425 –
June 1,848 6,208 2,672 32,097 –
Total Capital expenditure 19,863 31,998 32,097 3,843
Month
KZN285 Mthonjaneni - Supporting Table SC12 Monthly Budget Statement - capital expenditure trend - M06 December
Budget Year 2011/12

2010/11 Budget Year 2011/12
Audited
Outcome
Original
Budget
Adjusted
Budget
Monthly
actualYearTD actual
YearTD
budget
YTD
variance
YTD
variance
Full Year
Forecast
R thousands 1 %
Capital expenditure on new assets by Asset Class/Sub-class
Infrastructure 711 1,350 1,590 23 364 795 431 54.2% –
Infrastructure - Road transport – – – – – – – –
Roads, Pavements & Bridges –
Storm water –
Infrastructure - Electricity 711 1,350 1,590 23 364 795 431 54.2% –
Generation –
Transmission & Reticulation 711 1,350 1,590 23 364 795 431 54.2%
Street Lighting –
Infrastructure - Water – – – – – – – –
Dams & Reservoirs –
Water purification –
Reticulation –
Infrastructure - Sanitation – – – – – – – –
Reticulation –
Sewerage purification –
Infrastructure - Other – – – – – – – –
Waste Management –
Transportation –
Gas –
Other –
Community 7,775 4,800 6,670 356 1,000 3,335 2,335 70.0% –
Parks & gardens –
Sportsfields & stadia –
Swimming pools –
Community halls –
Libraries –
Recreational facilities 7,775 4,800 6,670 356 1,000 3,335 2,335 70.0%
Fire, safety & emergency –
Security and policing –
Buses –
Clinics –
Museums & Art Galleries –
Cemeteries –
Social rental housing –
Other –
Heritage assets – – – – – – – –
Buildings –
Other – –
Investment properties – – – – – – – –
Housing development –
Other –
Other assets 647 2,087 2,137 (0) 119 1,038 920 88.6% –
General vehicles 233 250 250 125 125 100.0%
Specialised vehicles –
Plant & equipment 123 161 161 (0) 65 52 (13) -25.1%
Computers - hardware/equipment 120 76 76 – 19 28 9 33.0%
Furniture and other office equipment 171 50 100 – 34 58 23 40.6%
Abattoirs –
Markets –
Civic Land and Buildings –
Other Buildings –
Other Land 1,550 1,550 – – 775 775 100.0%
Surplus Assets - (Investment or Inventory) –
Other –
Agricultural assets – – – – – – – –
List sub-class –
–
Biological assets – – – – – – – –
List sub-class –
–
Intangibles 53 – – – – – – –
Computers - software & programming 53 –
Other –
Total Capital Expenditure on new assets 1 9,185 8,237 10,397 379 1,482 5,168 3,686 71.3% –
Description Ref
KZN285 Mthonjaneni - Supporting Table SC13a Monthly Budget Statement - capital expenditure on new assets by asset class - M06 December
2010/11 Budget Year 2011/12
Audited
Outcome
Original
Budget
Adjusted
Budget
Monthly
actualYearTD actual
YearTD
budget
YTD
variance
YTD
variance
Full Year
Forecast
R thousands 1 %
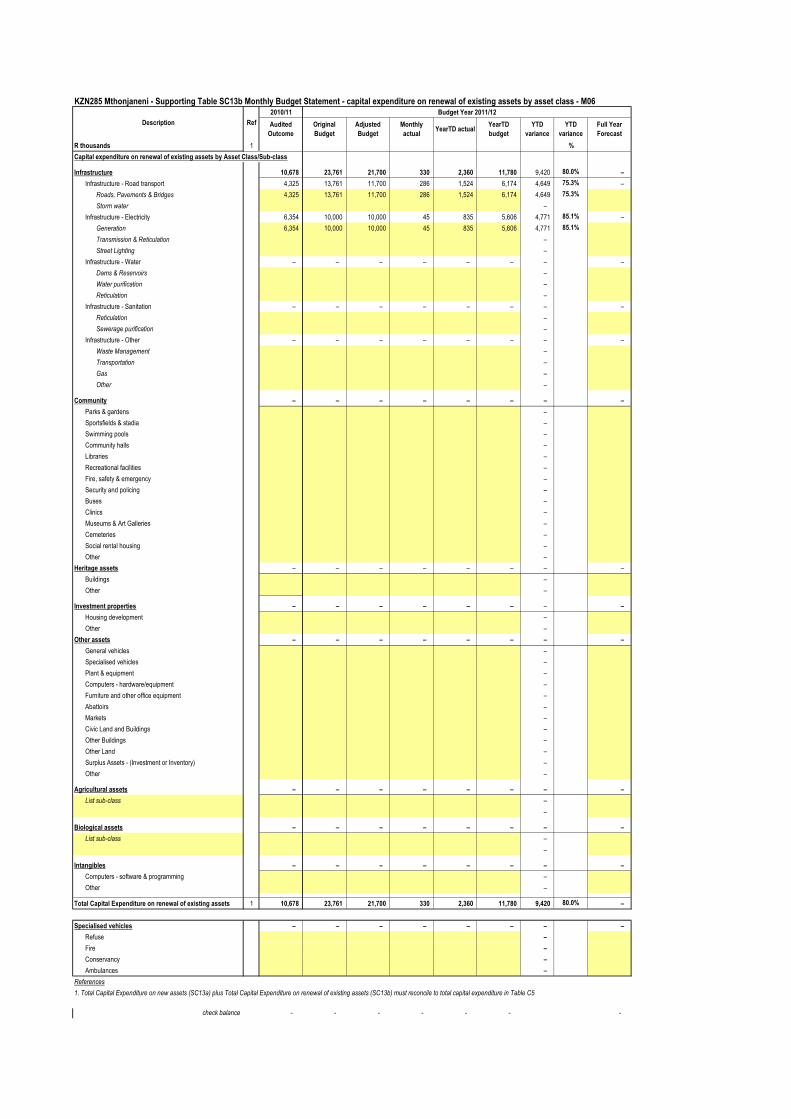
Capital expenditure on renewal of existing assets by Asset Class/Sub-class
Infrastructure 10,678 23,761 21,700 330 2,360 11,780 9,420 80.0% –
Infrastructure - Road transport 4,325 13,761 11,700 286 1,524 6,174 4,649 75.3% –
Roads, Pavements & Bridges 4,325 13,761 11,700 286 1,524 6,174 4,649 75.3%
Storm water –
Infrastructure - Electricity 6,354 10,000 10,000 45 835 5,606 4,771 85.1% –
Generation 6,354 10,000 10,000 45 835 5,606 4,771 85.1%
Transmission & Reticulation –
Street Lighting –
Infrastructure - Water – – – – – – – –
Dams & Reservoirs –
Water purification –
Reticulation –
Infrastructure - Sanitation – – – – – – – –
Reticulation –
Sewerage purification –
Infrastructure - Other – – – – – – – –
Waste Management –
Transportation –
Gas –
Other –
Community – – – – – – – –
Parks & gardens –
Sportsfields & stadia –
Swimming pools –
Community halls –
Libraries –
Recreational facilities –
Fire, safety & emergency –
Security and policing –
Buses –
Clinics –
Museums & Art Galleries –
Cemeteries –
Social rental housing –
Other –
Heritage assets – – – – – – – –
Buildings –
Other – –
Investment properties – – – – – – – –
Housing development –
Other –
Other assets – – – – – – – –
General vehicles –
Specialised vehicles –
Plant & equipment –
Computers - hardware/equipment –
Furniture and other office equipment –
Abattoirs –
Markets –
Civic Land and Buildings –
Other Buildings –
Other Land –
Surplus Assets - (Investment or Inventory) –
Other –
Agricultural assets – – – – – – – –
List sub-class –
–
Biological assets – – – – – – – –
List sub-class –
–
Intangibles – – – – – – – –
Computers - software & programming –
Other –
Total Capital Expenditure on renewal of existing assets 1 10,678 23,761 21,700 330 2,360 11,780 9,420 80.0% –
Specialised vehicles – – – – – – – –
Refuse –
Fire –
Conservancy –
Ambulances –
References
1. Total Capital Expenditure on new assets (SC13a) plus Total Capital Expenditure on renewal of existing assets (SC13b) must reconcile to total capital expenditure in Table C5
check balance - - - - - - -
KZN285 Mthonjaneni - Supporting Table SC13b Monthly Budget Statement - capital expenditure on renewal of existing assets by asset class - M06
Description Ref

2010/11 Budget Year 2011/12
Audited
Outcome
Original
Budget
Adjusted
Budget
Monthly
actualYearTD actual
YearTD
budget
YTD
variance
YTD
variance
Full Year
Forecast
R thousands 1 %
Repairs and maintenance expenditure by Asset Class/Sub-class
Infrastructure 681 940 – 4 154 325 171 52.6% –
Infrastructure - Road transport 241 250 – – 95 125 30 23.9% –
Roads, Pavements & Bridges 241 250 – 95 125 30 23.9%
Storm water –
Infrastructure - Electricity 354 290 – – – – – –
Generation –
Transmission & Reticulation 354 290 –
Street Lighting –
Infrastructure - Water – – – – – – – –
Dams & Reservoirs –
Water purification –
Reticulation –
Infrastructure - Sanitation – – – – – – – –
Reticulation –
Sewerage purification –
Infrastructure - Other 86 400 – 4 59 200 141 70.6% –
Waste Management 86 400 4 59 200 141 70.6%
Transportation –
Gas –
Other –
Community 20 80 – – – 40 40 100.0% –
Parks & gardens 20 80 40 40 100.0%
Sportsfields & stadia –
Swimming pools –
Community halls –
Libraries –
Recreational facilities –
Fire, safety & emergency –
Security and policing –
Buses –
Clinics –
Museums & Art Galleries –
Cemeteries –
Social rental housing –
Other –
Heritage assets – – – – – – – –
Buildings –
Other – –
Investment properties – – – – – – – –
Housing development –
Other –
Other assets 927 1,006 – 43 353 741 388 52.4% –
General vehicles 291 358 9 159 179 20 11.1%
Specialised vehicles –
Plant & equipment 133 244 16 146 266 120 45.3%
Computers - hardware/equipment 7 75 37 37 100.0%
Furniture and other office equipment –
Abattoirs –
Markets –
Civic Land and Buildings 496 329 17 48 259 211 81.4%
Other Buildings –
Other Land –
Surplus Assets - (Investment or Inventory) –
Other –
Agricultural assets – – – – – – – –
List sub-class –
–
Biological assets – – – – – – – –
List sub-class –
–
Intangibles – – – – – – – –
Computers - software & programming –
Other –
Total Repairs and Maintenance Expenditure 1,628 2,026 – 46 507 1,106 599 54.2% –
KZN285 Mthonjaneni - Supporting Table SC13c Monthly Budget Statement - expenditure on repairs and maintenance by asset class - M06 December
Description Ref
Specialised vehicles – – – – – – – –
Refuse –
Fire –
Conservancy –
Ambulances –
References
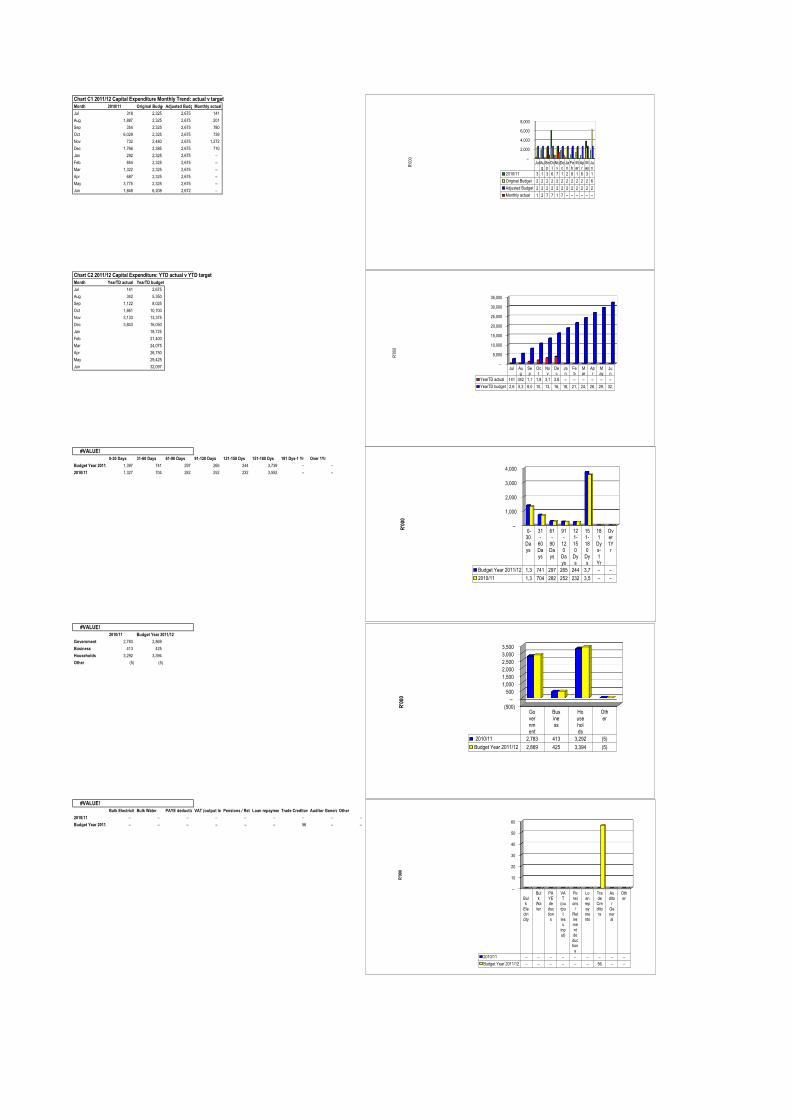
Chart C1 2011/12 Capital Expenditure Monthly Trend: actual v target
Month 2010/11 Original BudgetAdjusted BudgetMonthly actual
Jul 318 2,325 2,675 141
Aug 1,887 2,325 2,675 201
Sep 354 2,325 2,675 780
Oct 6,029 2,325 2,675 739
Nov 732 2,480 2,675 1,272
Dec 1,766 2,385 2,675 710
Jan 292 2,325 2,675 –
Feb 854 2,325 2,675 –
Mar 1,322 2,325 2,675 –
Apr 687 2,325 2,675 –
May 3,775 2,325 2,675 –
Jun 1,848 6,208 2,672 –
Chart C2 2011/12 Capital Expenditure: YTD actual v YTD target
Month YearTD actual YearTD budget
Jul 141 2,675
Aug 342 5,350
Sep 1,122 8,025
Oct 1,861 10,700
Nov 3,133 13,375
Dec 3,843 16,050
Jan 18,725
Feb 21,400
Mar 24,075
Apr 26,750
May 29,425
Jun 32,097
#VALUE!
0-30 Days 31-60 Days 61-90 Days 91-120 Days 121-150 Dys 151-180 Dys 181 Dys-1 Yr Over 1Yr
Budget Year 2011/12 1,397 741 297 265 244 3,739 – –
2010/11 1,327 704 282 252 232 3,552 – –
#VALUE!
2010/11 Budget Year 2011/12
Government 2,783 2,869
Business 413 425
Households 3,292 3,394
Other (5) (5)
#VALUE!
Bulk ElectricityBulk Water PAYE deductionsVAT (output less input)Pensions / Retirement deductionsLoan repaymentsTrade CreditorsAuditor GeneralOther
2010/11 – – – – – – – – –
Budget Year 2011/12 – – – – – – 56 – –
–
1,000
2,000
3,000
4,000
0-30Days
31-
60Days
61-
90Days
91-
120
Days
121-150
Dys
151-180
Dys
181
Dys-1Yr
Over1Yr
Budget Year 2011/12 1,3 741 297 265 244 3,7 – –
2010/11 1,3 704 282 252 232 3,5 – –
R'0
00
(500)
–
500
1,000
1,500
2,000
2,500
3,000
3,500
Government
Business
Households
Other
2010/11 2,783 413 3,292 (5)
Budget Year 2011/12 2,869 425 3,394 (5)
R'0
00
–
10
20
30
40
50
60
Bulk
Electricity
Bulk
Water
PAYEdeductions
VAT
(output
less
input)
Pensions
/Retirementdeductions
Loanrepayments
TradeCreditors
Audito
rGeneral
Other
2010/11 – – – – – – – – –
Budget Year 2011/12 – – – – – – 56 – –
R'0
00
–
2,000
4,000
6,000
8,000
JulAug
Sep
Oct
Nov
Dec
Jan
Feb
Mar
Apr
May
Jun
2010/11 3 1 3 6 7 1 2 8 1 6 3 1
Original Budget 2 2 2 2 2 2 2 2 2 2 2 6
Adjusted Budget 2 2 2 2 2 2 2 2 2 2 2 2
Monthly actual 1 2 7 7 1 7 – – – – – –
R'0
00
–
5,000
10,000
15,000
20,000
25,000
30,000
35,000
Jul Aug
Sep
Oct
Nov
Dec
Jan
Feb
Mar
Apr
May
Jun
YearTD actual 141 342 1,1 1,8 3,1 3,8 – – – – – –
YearTD budget 2,6 5,3 8,0 10, 13, 16, 18, 21, 24, 26, 29, 32,
R'0
00