clearesult: maximizing the return of metering and interval data
TRANSCRIPT
Maximizing the return of metering & interval data
Bill Younger, CEMVice President – Energy Performance Services

© 2015 CLEAResult. All rights reserved. 2
A New Way of Doing Business
Silence is not always golden; energy waste is often hidden.
If no one complains, then everything must be working properly.
Focusing on preventative maintenance without checking operation only addresses part of the problem.
We have a preventative maintenance program, so everything must be working properly.
Business as Usual Paradigm Shift
Let's find and fix the problem before we can see, feel or hear it.
If it ain't broke don't fix it.

© 2015 CLEAResult. All rights reserved. 3
It’s Not Just Metering Anymore…
Meter
Energy Management
Energy Auditing
Measurement & Verification
Rate Analysis
Billing Validation
System Monitoring
…its information!!

© 2015 CLEAResult. All rights reserved. 4
Metering Options
• Data loggers– Applications– Examples– Spot Measurement
• Sub-meters– Key Elements– Strategies– Continuous Commissioning
• Building/Utility Meters– Communication– Capabilities– Building Monitoring
Building Meter
Sub-Meter
Data Loggers

© 2015 CLEAResult. All rights reserved. 5
Data Loggers
• Single Channel vs. Multi-Channel
• Analog Input– Temperature– CO2– Voltage – Relative Humidity– Equipment Amperage– Demand/Energy/PF– Lighting Levels
• “State” or “on-off”– Lighting Hours– Motor Runtime
© 2015 CLEAResult. All rights reserved. 6
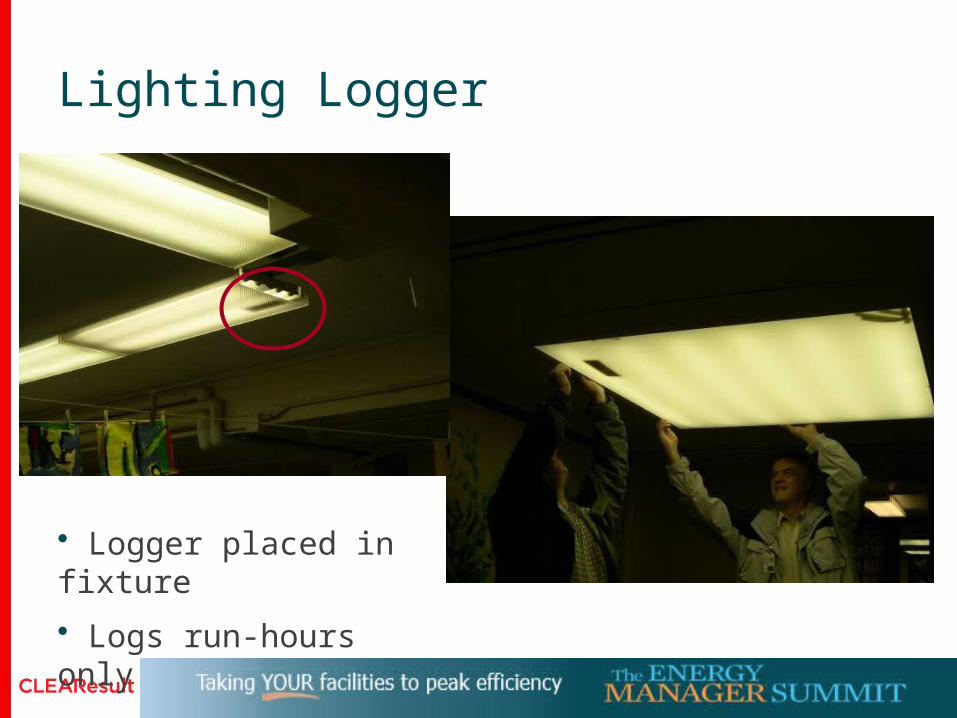
Lighting Logger
• Logger placed in fixture
• Logs run-hours only

© 2015 CLEAResult. All rights reserved. 7
Case Study - Office Building
Combined Data Logging Results General Office Bldg
0
10
20
30
40
50
60
70
80
90
FR
I
SA
SU
MO
TU W TH
FR
I
SA Su
MO
TU
Tem
per
atu
re / L
igh
tin
g L
evel
0
100
200
300
400
500
600
700
Lighting Temperature CO2
© 2015 CLEAResult. All rights reserved. 8
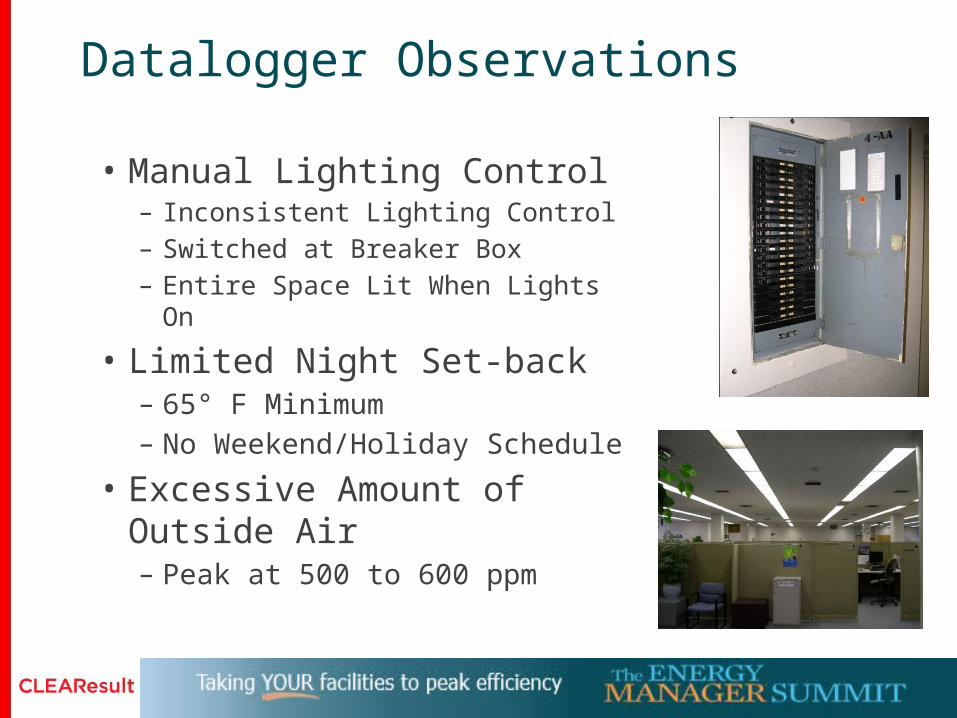
Datalogger Observations
• Manual Lighting Control– Inconsistent Lighting Control– Switched at Breaker Box– Entire Space Lit When Lights On
• Limited Night Set-back– 65° F Minimum– No Weekend/Holiday Schedule
• Excessive Amount of Outside Air– Peak at 500 to 600 ppm
© 2015 CLEAResult. All rights reserved. 9
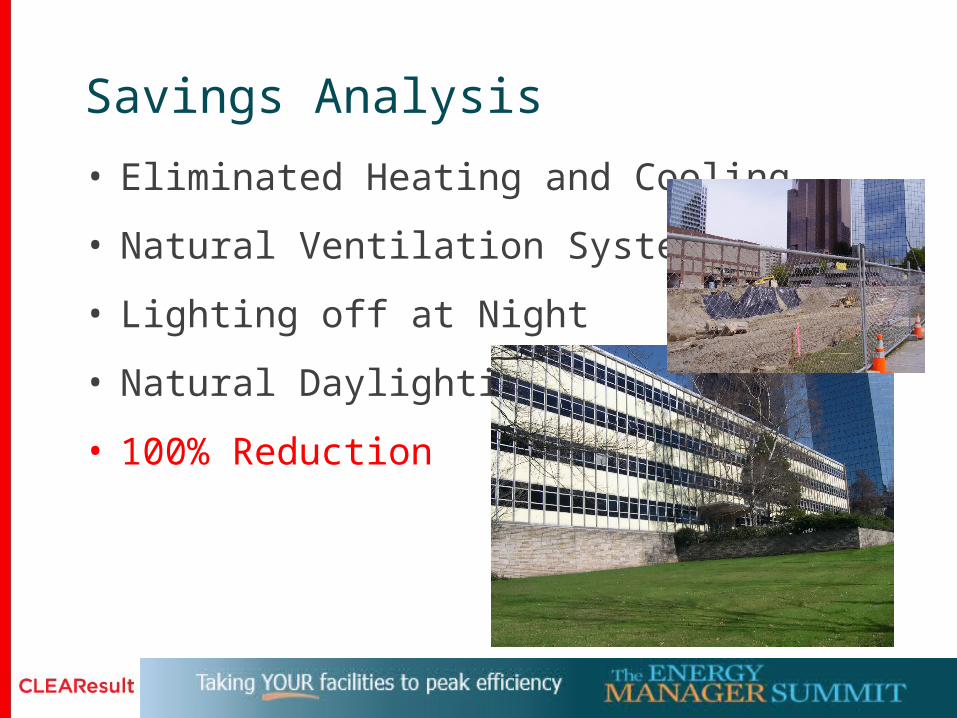
Savings Analysis
• Eliminated Heating and Cooling
• Natural Ventilation System
• Lighting off at Night
• Natural Daylighting
• 100% Reduction in Energy Use!

© 2015 CLEAResult. All rights reserved. 10
Datalogger Benefits• Relatively Inexpensive and Easy to Use
• Short Term Monitoring
• Efficiency Measure Development Tool
• Operational Profile
• Convenient Data Format and Analysis
• Energy and Cost Savings Calculations
• System Troubleshooting Tool
• Time Stamp of Events
• Documentation of Conditions
• Reduce Time in Identifying Problems
• Immediate Feedback on Solutions

© 2015 CLEAResult. All rights reserved. 11
Submetering Systems
• Monitoring of All Utilities • Focus on Consumption and Demand• Allocate Costs for Specific Tenants, Building or Processes • Identify and Analyze Areas of Potential Energy Savings • Implement and Monitor Energy Saving Measures• Demand Response Capability

© 2015 CLEAResult. All rights reserved. 12
Key Elements to Submetering
Meters and Sensors
Data Acquisition and Communications
Data Acquisition Server Building Automation System Power Monitoring System
Electricity Gas, Water Steam, BTU
Database and User Interface
Cost Allocation Operations Tenant Billing

© 2015 CLEAResult. All rights reserved. 13
Meters
• Electricity• Gas• Water• Steam• BTU
© 2015 CLEAResult. All rights reserved. 14
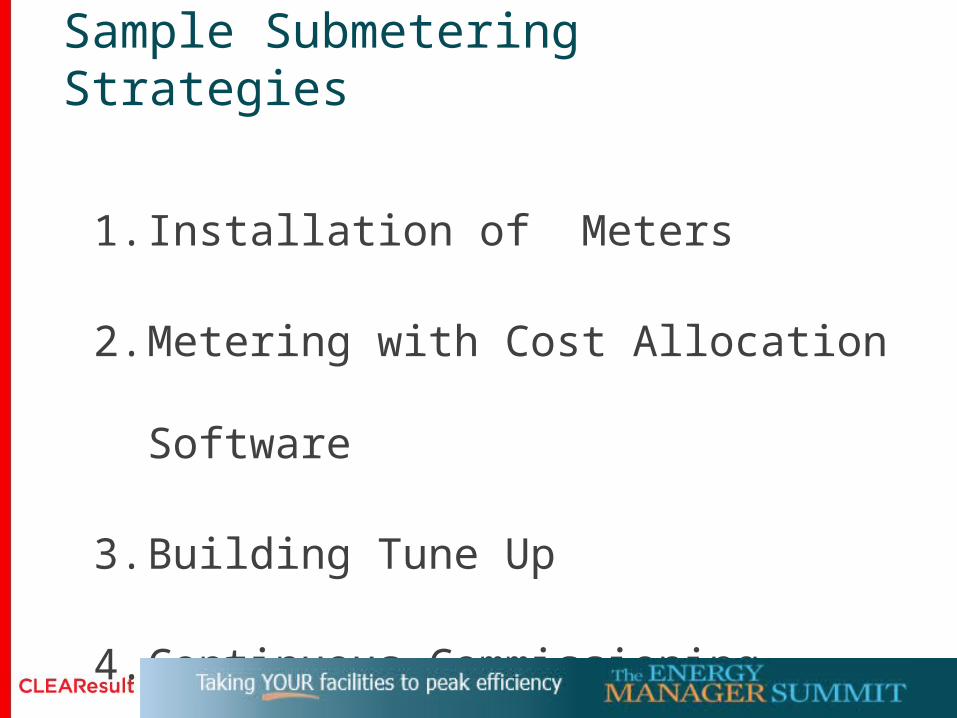
Sample Submetering Strategies
1. Installation of Meters
2. Metering with Cost Allocation Software
3. Building Tune Up
4. Continuous Commissioning
© 2015 CLEAResult. All rights reserved. 15
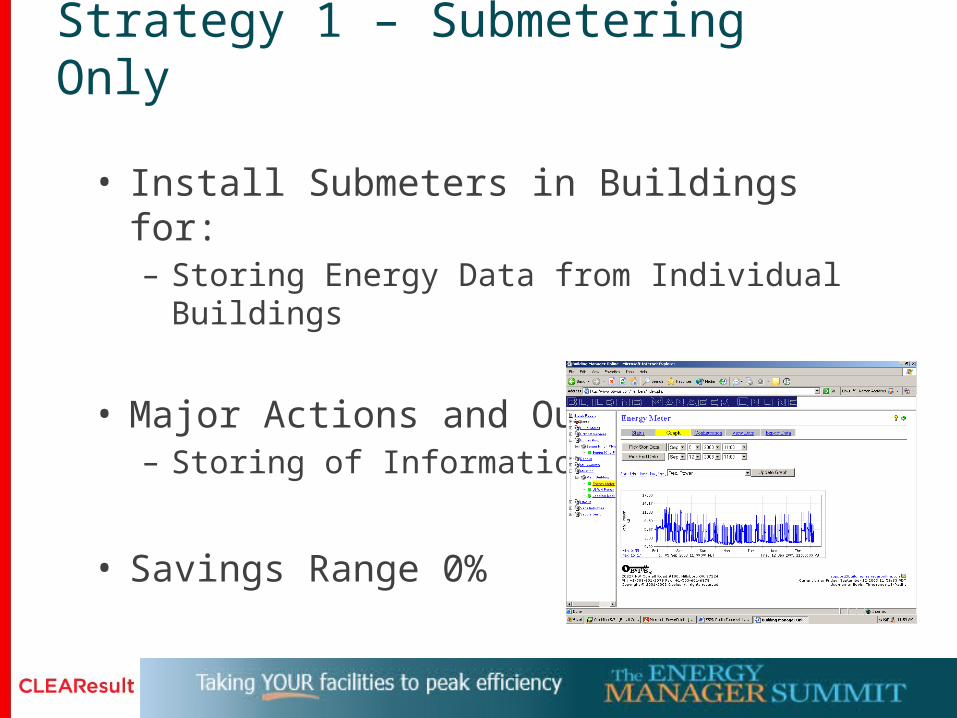
Strategy 1 – Submetering Only
• Install Submeters in Buildings for:– Storing Energy Data from Individual Buildings
• Major Actions and Outputs:– Storing of Information
• Savings Range 0%

© 2015 CLEAResult. All rights reserved. 16
Strategy 2 – Cost Allocation
• Install Submeters in Buildings for:– Cost Allocation to Departments and Tenants– Accountability for Meeting Conservation Goals
• Major Actions and Outputs:– Monthly Bills to Tenants– Monthly Reports
for all Departments
• Savings Range 2 to 5%

© 2015 CLEAResult. All rights reserved. 17
Strategy 3 - Building Tune-up• Install Submeters in Buildings for:
– Cost Allocation to Departments and Tenants
– Accountability for Meeting Conservation Goals
– Identification of Inefficient Operations
– Fine-tuning of Building Controls
• Major Actions and Outputs:
– Monthly Bills to Tenants
– Monthly Reports for all Departments
– Internal Review and Adjustment of Building Operations (time schedules, etc,)
– Savings Range 5 to 15%

© 2015 CLEAResult. All rights reserved. 18
Load Profile Example
• Lighting Retrofit at Retail Store• Chart for 1 of 12 Identical Circuits• Broken Contactor in Lighting Panel
© 2015 CLEAResult. All rights reserved. 19
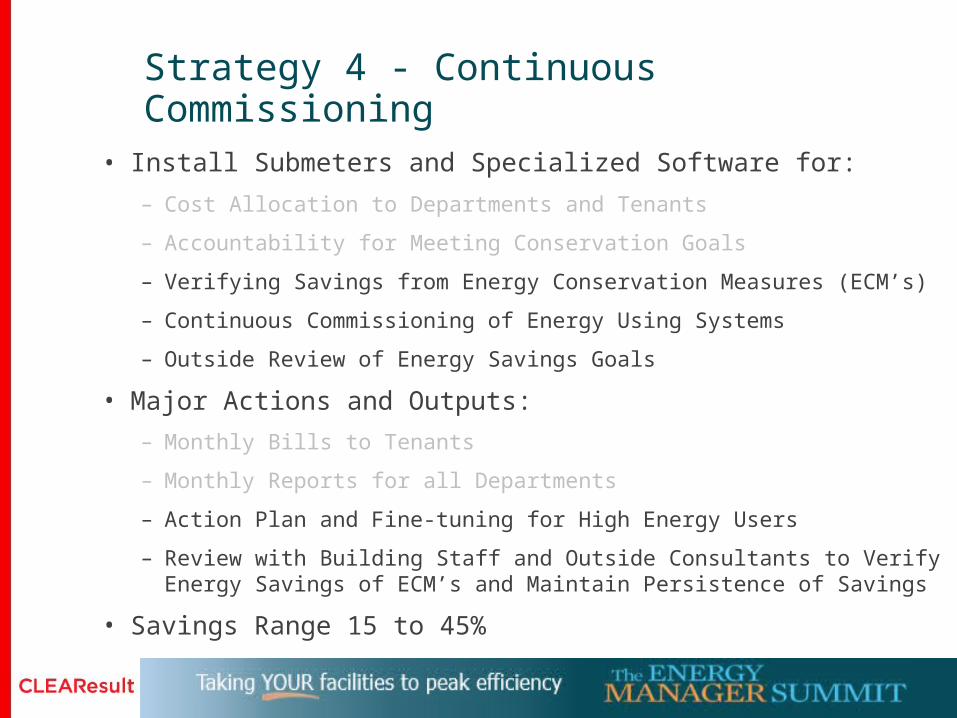
Strategy 4 - Continuous Commissioning
• Install Submeters and Specialized Software for:
– Cost Allocation to Departments and Tenants
– Accountability for Meeting Conservation Goals
– Verifying Savings from Energy Conservation Measures (ECM’s)
– Continuous Commissioning of Energy Using Systems
– Outside Review of Energy Savings Goals
• Major Actions and Outputs:
– Monthly Bills to Tenants
– Monthly Reports for all Departments
– Action Plan and Fine-tuning for High Energy Users
– Review with Building Staff and Outside Consultants to Verify Energy Savings of ECM’s and Maintain Persistence of Savings
• Savings Range 15 to 45%
© 2015 CLEAResult. All rights reserved. 20
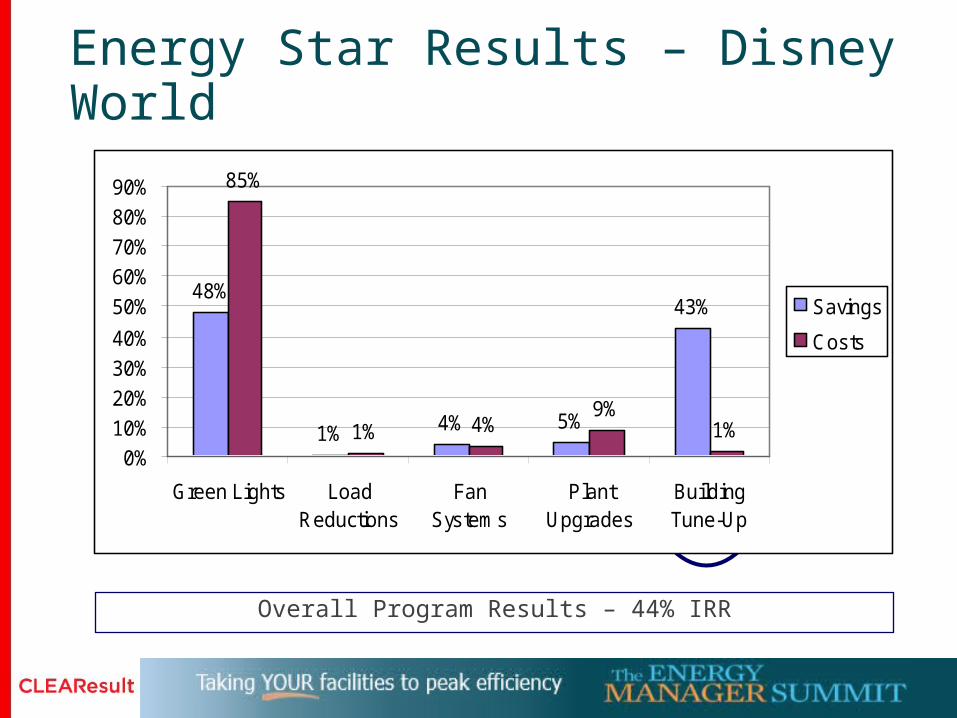
Energy Star Results – Disney World
Overall Program Results – 44% IRR
48%
1% 4% 5%
43%
85%
1% 4%9%
1%0%
10%
20%
30%
40%
50%
60%
70%
80%
90%
Green Lights LoadReductions
FanSystems
PlantUpgrades
BuildingTune-Up
Savings
Costs
© 2015 CLEAResult. All rights reserved. 21
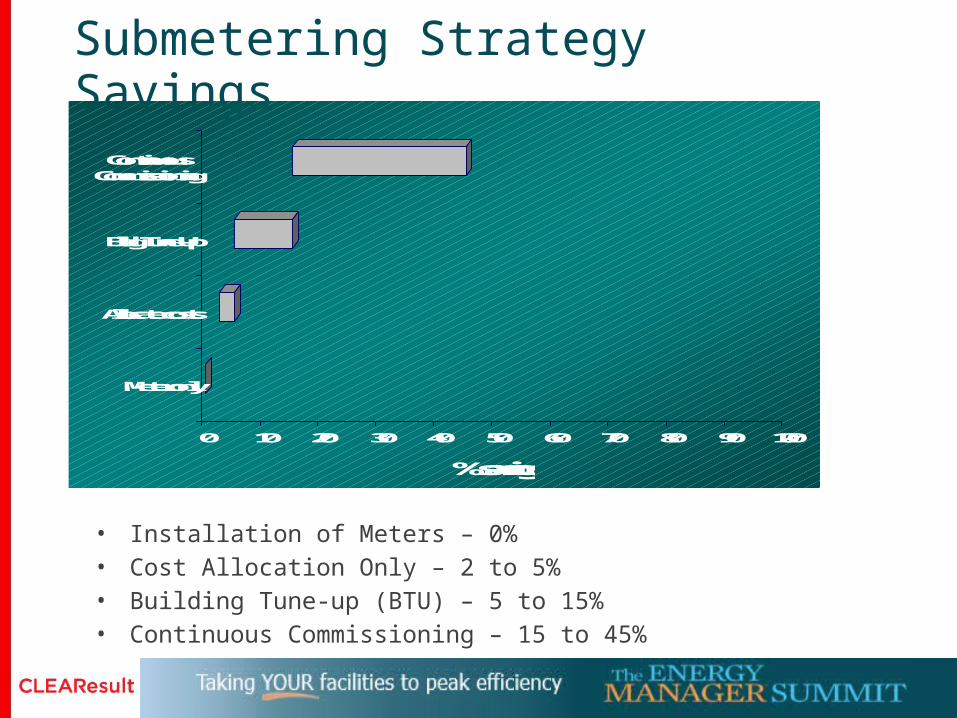
Submetering Strategy Savings
• Installation of Meters – 0%• Cost Allocation Only – 2 to 5%• Building Tune-up (BTU) – 5 to 15%• Continuous Commissioning – 15 to 45%
0 10 20 30 40 50 60 70 80 90 100
% savings
Meter only
Allocate costs
Bldg Tune-Up
ContinuousCommissioning
Meters
Meters + Allocation software
Meters + Allocation software + fine-tuning
Meters + Allocation software + fine-tuning+specialized software and expertise

© 2015 CLEAResult. All rights reserved. 22
Building Level Utility Metering
Wireless System
Dial Up Meters
Manual Reads
Ethernet System
Meter Data Warehouse
Energy Information
Server
Client
Internet
Validation & Billing
Load Research Engineering Operations
Trading Rates
Usage Data is “Raw Data” Collected From Meters Data Usually Loaded Nightly for Next-Day Viewing Cost Information is Calculated Using Raw Data and Rate Engine Not a Real-Time System

© 2015 CLEAResult. All rights reserved. 23
Energy Management
• Monitor Energy Use and System Performance
• Evaluate Usage Trends
• Facility Use Comparisons
• Facility Cost Comparisons
• Load Duration and Load Factor
• Demand Control Strategies
• Weather Impact on Consumption
• Operation and Maintenance
© 2015 CLEAResult. All rights reserved. 24
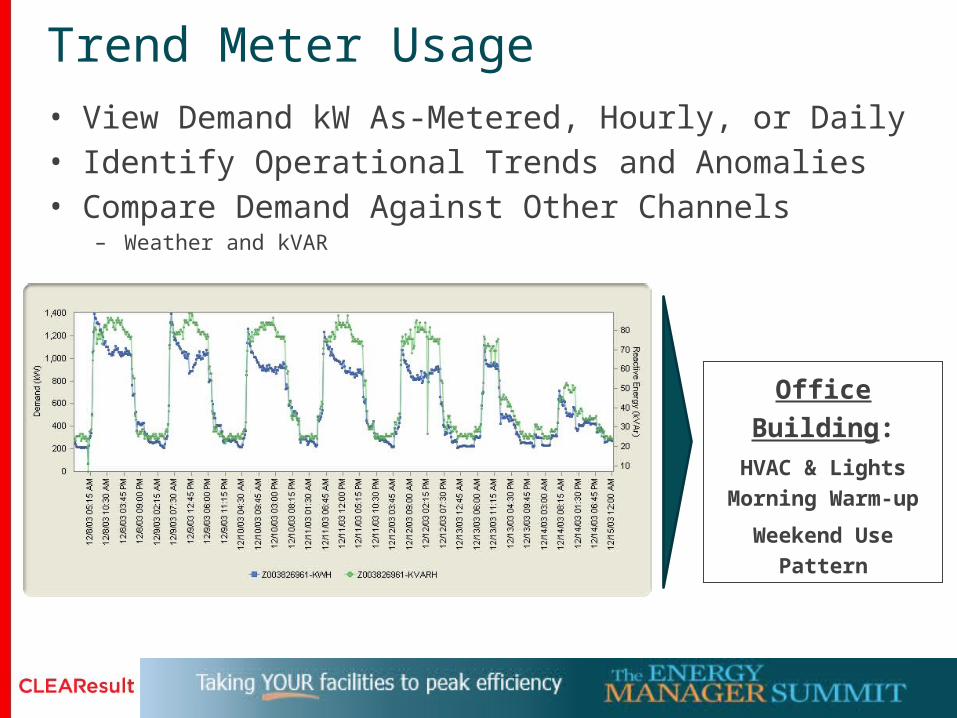
Trend Meter Usage• View Demand kW As-Metered, Hourly, or Daily• Identify Operational Trends and Anomalies• Compare Demand Against Other Channels
– Weather and kVAR
Office Building:
HVAC & Lights
Morning Warm-up
Weekend Use Pattern

© 2015 CLEAResult. All rights reserved. 25
Supermarket – 87%Hospital – 73%Office – 55%School – 38%
Load Duration and Load Factor
• Load Factor = Average Demand / Peak Demand• Indication of Potential for Demand Management

© 2015 CLEAResult. All rights reserved. 26
Monitor Facility Usage• Sudden Increase in Baseload• Increased Night-time Use of Resistance Heating
© 2015 CLEAResult. All rights reserved. 27
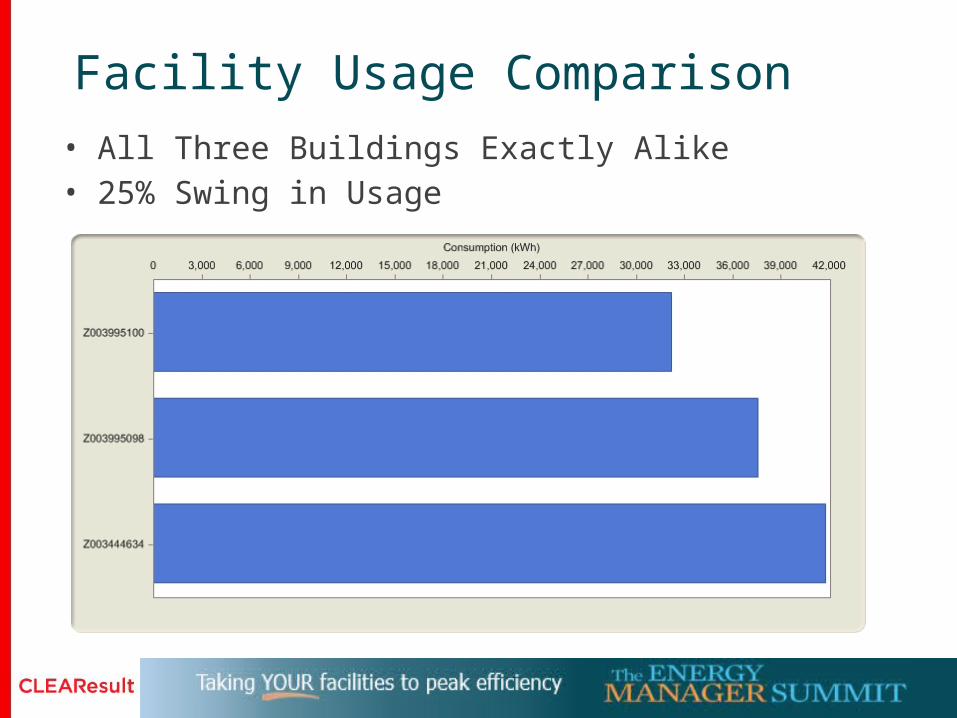
Facility Usage Comparison
• All Three Buildings Exactly Alike• 25% Swing in Usage

© 2015 CLEAResult. All rights reserved. 28
Facility Cost Comparison
• Demand Issue on First Meter • Lowest Usage/Highest Cost

© 2015 CLEAResult. All rights reserved. 29
Evaluate Weather Impacts
• Equipment Left On• Weather Related?• Quantify Impact
– 20 kW x 9 hours
© 2015 CLEAResult. All rights reserved. 30
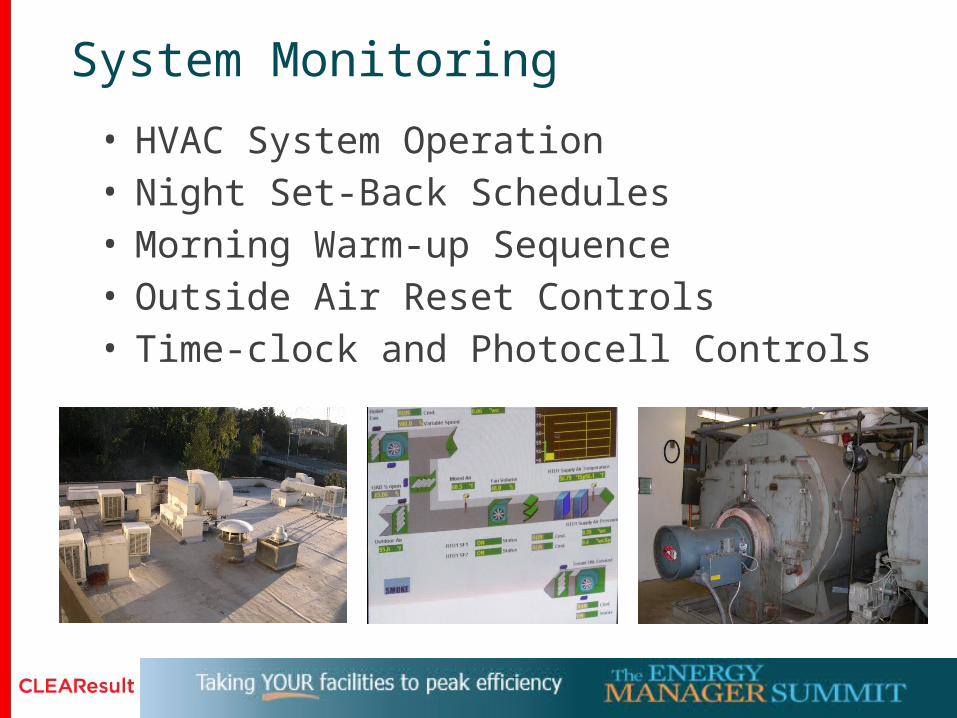
System Monitoring
• HVAC System Operation• Night Set-Back Schedules• Morning Warm-up Sequence• Outside Air Reset Controls• Time-clock and Photocell Controls

© 2015 CLEAResult. All rights reserved. 31
Verify System Performance
• Validate Performance• Calculate Energy and
Cost Savings• Graphically Display
Results
School Buildings: Verify Boiler Operation Schedule
- Night Set-back & Holiday Schedule
Junior High School Gas Meter
- Work Completed on Reset Control
- Night Setback Not Functioning

© 2015 CLEAResult. All rights reserved. 32
Daily Load Profiles
• View Demand kW for 15 minute or Hourly• Filter by Day Types for Actual kW or Averages
– Day of week, weekends, weekdays, average & peak– Tabular results can be sorted to show top peak days
• Control Malfunction Identified and Corrected
AfterBefore

© 2015 CLEAResult. All rights reserved. 33
School Electric Meter
• Ground Source Heat Pump Back-up Boiler• 500 kW of Unnecessary Heating
Comparison period Comparison total cost Current period Current total cost Variance % Variance
02/01-02/29/04 10,510.64 02/01-02/28/05 8,104.88 -2,405.76 -22.89
Savings = $2400

© 2015 CLEAResult. All rights reserved. 34
School Gas Meter• High Bill Inquiry – 4 Times Use of Similar School• Heat Pump Loop Temperature Setting at 85°F • EMCS and Local Control Conflict • Cooling Tower Operating Above 80°F

© 2015 CLEAResult. All rights reserved. 35
Development of Efficiency Measures
• Determine Peak kW Periods• Demand Savings Evaluation• Development of Occupancy Profiles• Equipment Loads and Trends
– Daily– Weekly– Monthly– Annual

© 2015 CLEAResult. All rights reserved. 36
Building Schedule
• HVAC and Lights• Time-clock vs. Occupancy and Temperature
Savings Opportunities
© 2015 CLEAResult. All rights reserved. 37
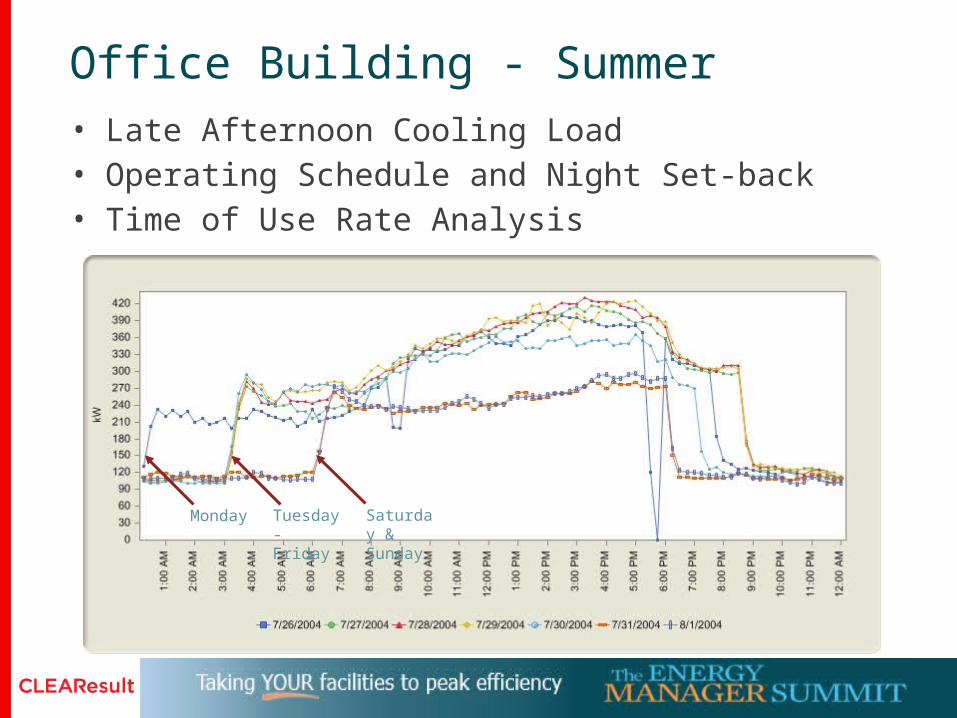
Office Building - Summer• Late Afternoon Cooling Load• Operating Schedule and Night Set-back• Time of Use Rate Analysis
Monday Saturday & Sunday
Tuesday - Friday

© 2015 CLEAResult. All rights reserved. 38
Energy Auditing• Evaluate with Occupancy Profiles• Identify Operational Opportunities • Set Off-Hour Targets
Occupied PeriodWarm-up After-Hours UseNight
16.5 kW Set-back
Target
- Schools - .5 watts/sq.ft.

© 2015 CLEAResult. All rights reserved. 39
Demand Control Strategies
• Small Manufacturing• Intermittent Spikes• 500 HP Motor • Load Factor 57%
© 2015 CLEAResult. All rights reserved. 40
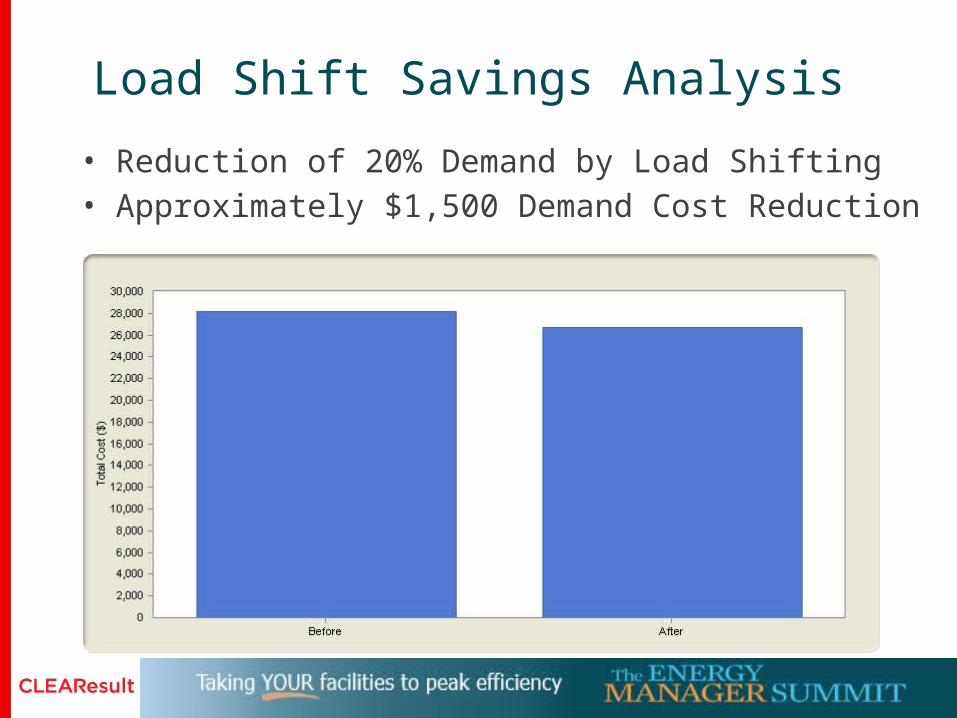
Load Shift Savings Analysis
• Reduction of 20% Demand by Load Shifting• Approximately $1,500 Demand Cost Reduction

© 2015 CLEAResult. All rights reserved. 41
Measurement and Verification
• Verify Measure Performance• Calculate Energy and Cost
Savings• Graphically Display Results
Office Building: Parking Garage Meter
CO2 Sensor with VAV Installed
Rooftop Mechanical Meter
24 Hour Trading Floor Operation
Four 50 hp Fans Required
Dedicated System Installed

© 2015 CLEAResult. All rights reserved. 42
Calculate Billing Charges
• Calculate Billing
Determinates from kW
• Estimate Monthly Bill
• User Defined Tax Rate
• Calendar Months or
User Defined Periods
Meter description: Z003826303
Rate name: Elec RS 26 - Secondary > 350 kW
Fixed Charges
Name Currency9/1 -
9/30/2004
Customer Charge $ 29.10
Total fixed charges $ 29.10
Demand Charges
Name Currency9/1 -
9/30/2004
Demand Charge $ 3,398.22
Total demand charges $ 3,398.22
Energy Charges
Name Currency9/1 -
9/30/2004Electricity Conservation Service Rider
$ 130.27
Energy Charge $ 10,326.59
Reactive Power Charge $ 175.86
Total energy charges $ 10,632.72
Tax Charges
Name Currency9/1 -
9/30/2004
Sales Tax Charge $ 0.00
Total maximum charges $ 0.00
Total $ 14,060.04
Bill Determinants
Name 9/1 - 9/30/2004
PSE - KVARH - Annual All Hours 158,429.40
PSE - KW - Summer All Hours 730.80
PSE - KW - Winter (Oct - Mar) All Hours 0.00
PSE - KWH - Annual All Hours 206,771.70
Name 9/1 - 9/30/2004
- KVARH - Annual All Hours 158,429.40
- KW - Summer All Hours 730.80
- KW - Winter (Oct - Mar) All Hours 0.00
- KWH - Annual All Hours 206,771.70

© 2015 CLEAResult. All rights reserved. 43
What-If Rate Analysis - Electric• Compare Rate Options Using Interval Data• 9.67% Savings by Purchasing Transformer
Rate Options:
Secondary Metering
vs.
Primary Metering
Alternative Rate name Rate description Detail options Cost ($) % Savings Average Cost ($/kWh)
Default PSE - Elec RS 26 - Secondary > 350 kW Custom 14,060.04 0.00 0.0680
Alternative1 PSE - Elec RS 31 - Primary metered Limited availability Custom 12,700.42 9.67 0.0614
© 2015 CLEAResult. All rights reserved. 44
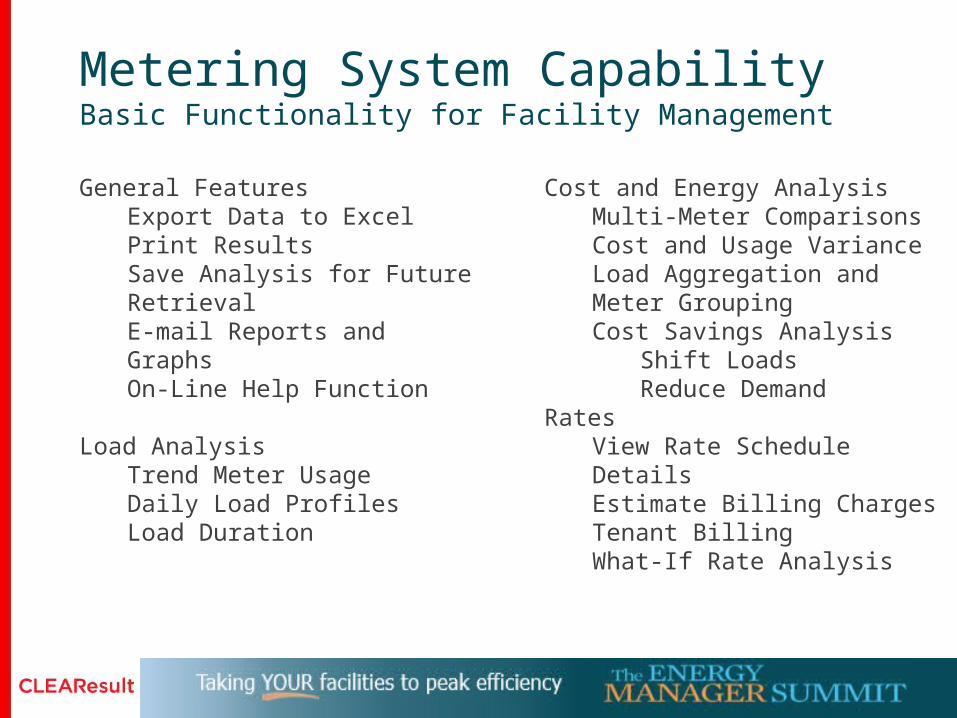
Metering System CapabilityBasic Functionality for Facility Management
General FeaturesExport Data to ExcelPrint ResultsSave Analysis for Future RetrievalE-mail Reports and GraphsOn-Line Help Function
Load AnalysisTrend Meter UsageDaily Load ProfilesLoad Duration
Cost and Energy AnalysisMulti-Meter ComparisonsCost and Usage VarianceLoad Aggregation and Meter GroupingCost Savings Analysis
Shift LoadsReduce Demand
RatesView Rate Schedule DetailsEstimate Billing ChargesTenant BillingWhat-If Rate Analysis
© 2015 CLEAResult. All rights reserved. 45
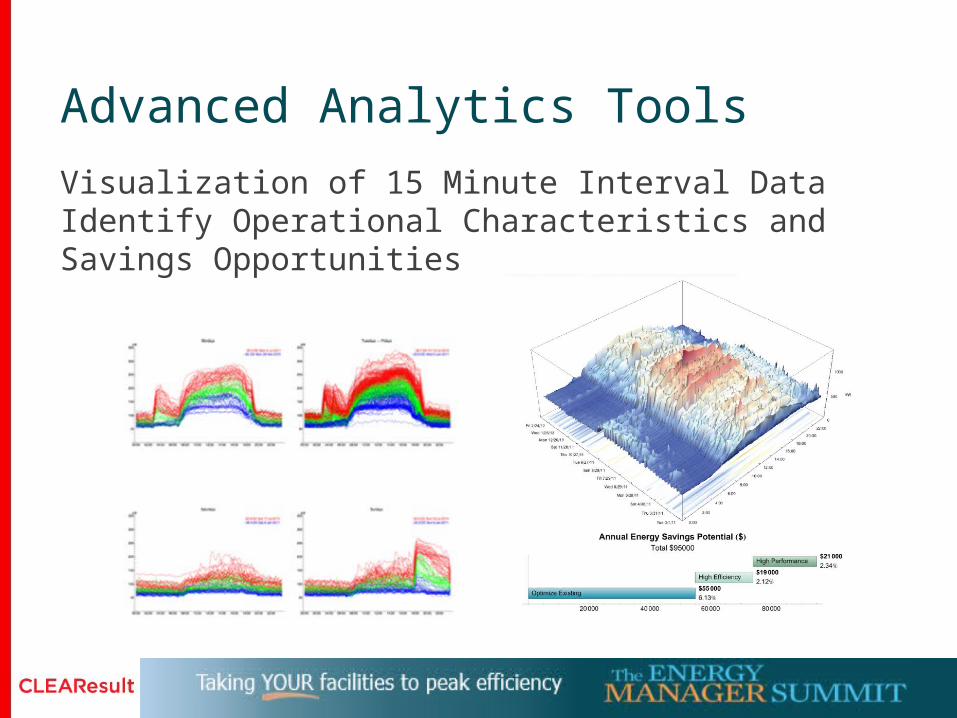
Advanced Analytics Tools
Visualization of 15 Minute Interval DataIdentify Operational Characteristics and Savings Opportunities

© 2015 CLEAResult. All rights reserved. 46
Advanced Analytics Tools
46
Advanced analytics can turn 35,000 data points into deep insights for
opportunities – including ones we often miss

© 2015 CLEAResult. All rights reserved. 47
Engage Customers for Persistence

© 2015 CLEAResult. All rights reserved. 48
Develop a Metering Plan
• Formalize Metering Objectives and Goals
• Establish Short, Mid, and Long Term Goals
• Identify Data and Equipment Needs
• Determine Analysis Methodology and Staff
• Evaluate Economics – Cost/Benefit Analysis
• Develop an Implementation Timeline
• Plan for Maintenance, Calibration, Updates
• Start Small and Build on Successes
• Maintain Visibility
© 2015 CLEAResult. All rights reserved. 49
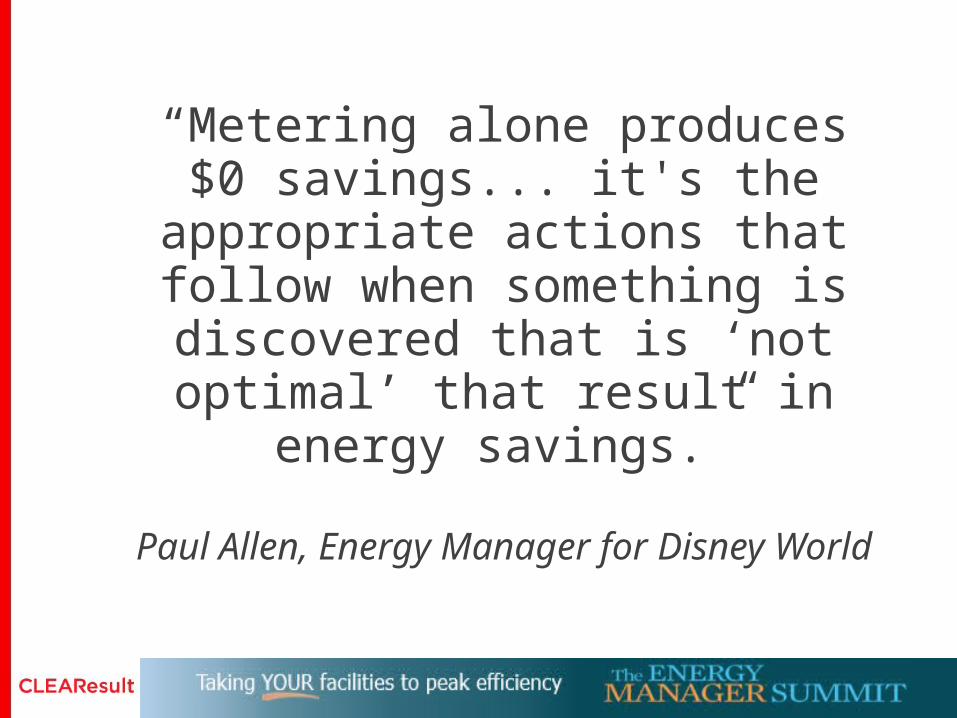
“Metering alone produces $0 savings... it's the appropriate
actions that follow when something is discovered that is ‘not optimal’
that result in energy savings.”
Paul Allen, Energy Manager for Disney World

© 2015 CLEAResult. All rights reserved. 50
Thank You!
BILL YOUNGER, CEMVice President, Energy Performance Services
512.416.5976