clear represent budgetary - ed
TRANSCRIPT
60
AUTHORTITLE
SPONS,AGENCY
BUREAU NOPUB. DATENOTE
ROES PRICEVESCRIPTIS
ABSTRACT
DOCOIMW IES
Duggan, Jerome L.; An EthersAdvanced Experimilmts Nuclear Science,Advanced Nuclear 'Physics and ChemistryExperiments.National Science Foundation,Texas State Univ., Denton.NSF-SED-74-2028617 ?)258p.; Contains Occasicna
Washington, L.C., North
and broken type
HP-$0..8;5 Plus Postage. HC, Not Available fxo EDChemistry; College Science; *Giadmate StaCy; HEducation; Instructional Haterials; LaboratoryProcedures; *N clear Ehysics; Physics; ScienceEducation; *Science Fxpeciaerts
The experiments in this anual representstate-of-the-art techniques which should Le within the budgetary_constraints Of a college 'physics or chewistry department. There arefourteen experiments divided into five modules. The modules are onX-ray fluorescence, charged particle detection, neutron activationanalysis, X-ray attenuation, and accelerator experiments.' Each modulecontains an introduction, a guide to the types cf experimentscontained, learning objectivcs,and a list of- prerequisite skills.Each experiment contains objectives, ar introduction, a'list ofequipment, .data accumulation and analysis procedures, discussion ofresults; post-test questions, computer programs, o'ticnal work, andreferences. (Author/BB)
******Re prod
* * *
***, **** ** *** **
upplied by EDES are the best thatfrom the original document.
***** *** * * * * * * * * *a * * * * * * * * * **
**CEE
* ****** *to made
*-** * *

AdvaticedEiperiments Iii
Nuclear Science
Vokorne I
T
Advanced Nuclear:PhysicsAnd Chemistry Experiments
oronr L. Duggan, Floyd D. McDaniel,and Jack G. itehn
This Projett IS:Supported Jointly ByThe Nation4 Science Foundation
And1+ rtl Tias State University
Denton, Texas 76203

INTRODUcTiO1
Many colleges and'universities throughout the-United States have
#recognized the iMpo- nee of the study of nuclear science-and radio-
isotopes in the undqrgraduate curriculum. The reasons for this reali-.
nation are twofold: First, tomorrow's citizen is without
to live in a woFld hat is much more dependent ,on-nuclear'
energy and technology thah most.ofus realize at this time. Many
us think that the only practical and economical solution to the energy
crisis is through nuclear energy at least until well after the year
2000. The ultimate energy needs-of the United States will most likely
be provided by a combination of numerous types f'energy sources:
nuclear fission and fusion, breeder reactors, solar and geotherMal.
energy, as well as fossil fuels.
A second reason for studying radioisotopes lies in their applica-
tion to certain analytical problems in chemistry, physics, biology,
medicine and environmental science. As an exam ale, neutron activation
analysis is for many elements one of the-:Ost sensitive analytical
techniques known. With the proper selection of pre and post chemical
preparation techniques, sensitivities of the order of one nanogram may
be obtained by this technique for many elements. X -ray fluorescence is
another good example of a strong quantitative and qualitative technique
that has recently been employed quite extensively for trace element
analysis of environmental, geological, and biological samples. These
techniques have been applied quite successfully not only to.the areas
of physics and che istiy but alge-,to the areas of biology, geolOgy,
environmental science -, and medicine. It is clear that today's science
student needs a worki.plq-k ledge of these "state of the art" tech-
niques. This is the first of a series of manuals to be published in the.
areas of physics and che try, biology, geology, and environmental
science.
The experiments tht are included in this Manual for the most,
part reresent "state of the art" techniques which should be Within.:
the'budgetary d6nstraints o a single physics or chemistry_departme0t,
--Far smaller colleges or UT1 tis-= it may perhaps be 'advantagebu"
for a consortium of departments.tia share equipment costs.
meats presented n the manual would probably be
The expe-
termed advanced; however
many of these experiments have been performed successfully by under--
graduates at various institutions inaugurating this text. A :umber%of
other fine texts and laboratory manuals have been written- on what might.
be termed basic radiation,measurements. For your convenience, we have
listed a number of th se r the general bibliography, Appendix VIII.
The
of which consists of one or more related or similar experiments. The
Jmodular approach allows one to present theoretical or introductory
material in much greater detail for a collection of related experiments.
In general, each module will contain a one or two page introduction
laboratory manual contains a collectionof five module._-, each
concerning the usefulness of the experiments and techniques to be studied
and a guide to the different types of experiments to be encountered in
the module; broad learning objectives of the module; and,a prerequisites
section which will contain a list of those necessary skills which every
student should have before attempting the experiments in the module.
-The necessary prerequisites are given in the form of pretest questions
.with answers to be fodnd in the back of the module. Each module also
contains 'a theoretical section which presents broad discussions of
topics which are common to all of-the experiments in the module.
Following this introductory material are :,number of similar experiments.

.EaCh-experiment c h ains,specific objectives, an introdUCtion,
list of necessary. a d optional equipMent, experimental data acpaulatl n
iii
:and analysis pro&dures, discussion of results, post-test questions
evaluate the students comprehension, computer programs availablt,
optional work which may be done as an extension o:f the -periment'; and
additional references which may be used by-'the student t 'cievelOp the
.experiment into a senior search project.
Following the collection of related expeill;en_s are the
solutions to the pre-test and post-test 'questions for all-of the.exper41,
h';ents.
'One should not necessarily expect a student to perform all of the
ex erimen,ts in a particular module but rather to do those experiments
consistent with the goals of the institution's advanced laboratory
course and the equipment available. The experiments are generally
designed for a. 3-4.hour laboratory period for student groups of' 2 or 3..
For Some experiments, more than one laboratory period may be required.
The authors wish to acknowledge the valuable assistance received
from the many consultants that have made this project possible. We
also wish to tank the fifty or so reviewers of the earlier version
of this manual-for their valuable time and effort in evaluating these
experiments:
While we have at emptedto correct all errors in typing and
procedures, some, invariably will occur. We assume complet respons
bility for any and all such errors and hope that fAure reader of this
manual will inform us of them.
Jerome Duggan
loud McDaniel
Jack G. Henn

TABLE OF CONTENT-
Introduction
MODULE ONE: X-RAY FLUORESCENCE.
Expekiment 1: Basic Source Excited X-Ray FluoilescenceWith a Lithium Drifted Silicon Detector.
Page No
1
Experiment 2: X-Ray Fluorescence With a Lithium DriftedGe'manium Detector (Source Excited) =. 27
Experiment 3: X-Ray Fluorescence Using a Gas,FilledProportional Counter 39
SourCkExcited X-Ray Fluorescence asApplied to Environmental and GeochemicalSamples (Si(Li)- detector)--
Experiment
\Experiment :5: Heavy Element Analysis of PollutionSamples by X-Ray Fluorescence- with aGel(Li) Detector 69
51r
IExperiment 6: Tube xcited X-Ray Fluorescence= 77
MODULE TWO: CHARGED PARTICLE DETECTION 95
Expprimen_ 1: The-Use of Solid State Charged ParticleDetectors, for Alpha Particle Studies . . .101
Experiment 2: The Study of K and L Shell BindingEnergies .... .114
',Experiment An AlphaParticle Time-of-FlightExperiment .122
MODULE THREE: NEUTRON ACTIVATION ANALYSIS . .137
Experiment 1: The Study of Thermal Neutrons byActivation Techniques . . 141
Experiment 2: The Study of Fast Neutron ActivationTechniques 144
Experiment 3: Identification of 4n known by NeutronActivation Analysis 156
MODULE FOUR: X-RAY ATTENUATION 167
MODULE FIVE: ACCELERATOR EXPERIMENTt 181
Experiment 1: Thin Film measurements by Elastic IonBeam Scattering With a Low VoltageAccelerator 183
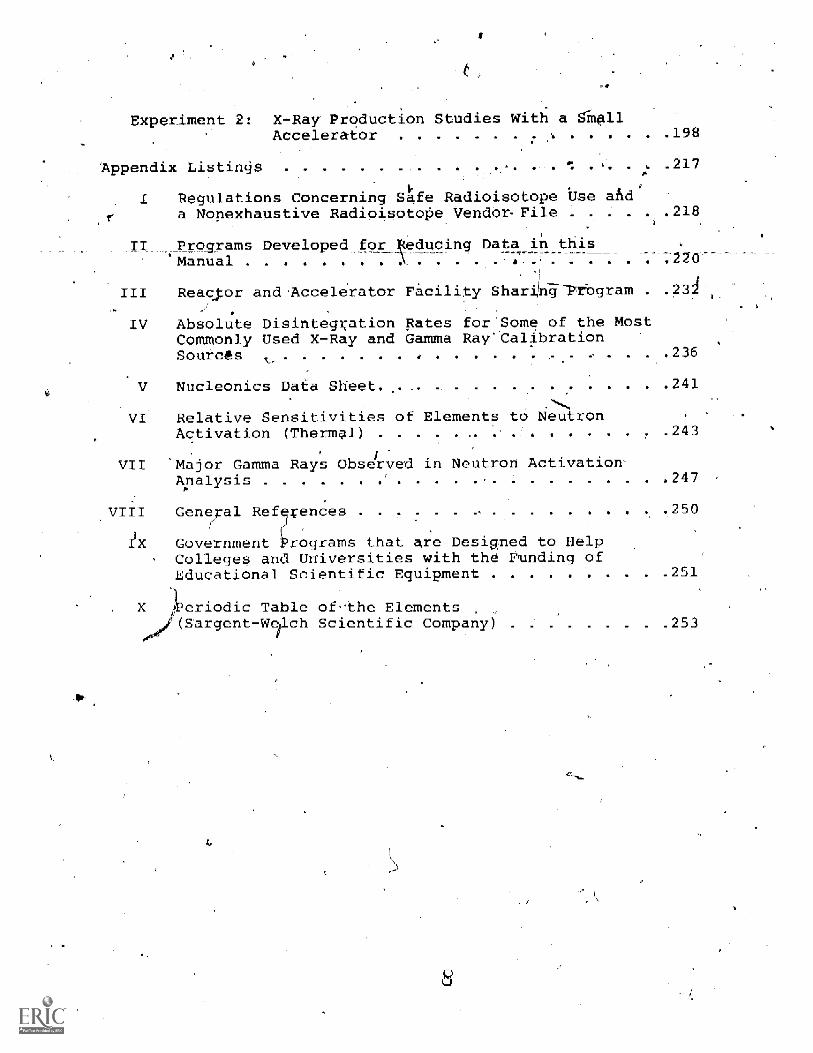
Experiment 2: X-Ray Production Studies With a ginallAccelerator 198
Appendix Listings . . ., .. . . .-, . --. . , .217A
-4-I Regulations Concerning Safe Radioisotope Use acid
a Nonexhaustive Radioisotope Vendor File .
II Programs Developed for reducing Data in this_
Manual =
III
.218
Reac,por and Accelerator Facility Shari4n4 Program . 431'
IV Absolute Disintegration Rates for Some of the MostCommonly Used X-Ray and Gamma Ray'CalibrationSources . . ,
V Nucleonics Data Sheet. . . .. . ... .241
VI Relative Sensitivities of Elements to NeutronActivation (Thermal) .. . ... .243
VII Major Gamma Rays Observed in Neutron Activation
Analysis . .. . . . .247
General References . . ,250VIII
Government Programs that are Designed to HelpColleges and Universities with the Funding ofEducational Scientific Equipment 4 4 4 4 4 .251
X eriodic Table of-the Elements ,
(Sargent-Welch Scientific Company) .253

- MODULE ONE
Y FLUORESCENCE
A Module on Photon-Excit9d X-Ray Fluarescende
INTRODUCTION
* Tay fluorescence is a ve y powerful analytical techniquewhich s used for the detection of trace impurities. Basically,the method involves bombarding a sample with photons from a radio-active source or other sources of photons while observing thecharacteristic X rays from the sale. The Xrays produced inthe sample are counted with a high-resolution X-ray'detector anare characteristic of the element's present in the sample. Withthis method it is now possible-to do quantitative analysis on asample containing as many as twenty elements. the method ast e
in the fields-of biology, chemistry, physics, geology,'and environmental sciences and has also been used quite extensivelyfor industrial problems and pollution analysis,. At. present, thedetection limits are fairly well established et approximately 1,,Qpart per million. In addition to the senAitivities found in X-rayfluorescence studies, the method has the added advantage that itis a nondestructive type f i.e. the samples may be,used again.
I
The module consists of six eixp rimentt which may be performedby Ehe student,' In the first three experiments the student willbe.introduced to the different"detectors and techniques used inX:-ray fluorescenee'stUdies. The advantages and disadvantages ofthe various detectors will be emphasized; The 4th and 5th experi-ments are more advanced and are designed for the student who habcompleted either Experiments 1 or 2 or has had some experience withSi(Li) or Ge(Li)'detectors. Experiments 4- and. 5 have environmentaland geochemical applications. The 6th experiment is a tube-excitedX-ray fluorescence experiment which represents the "state of theart" in photon-excited X-ray fluorescence. Sensitivities availablewith this technique are about a factor of 10 better than withsource-excited methods but require a larger capital investment.
Following this*introduction are the o ctives for the module,a list of desirable prerequisites for-the student to have before--attempting this module, and a theoretical section which tirscussessome of the basic' physical concepts and the=nomendlature used in)c-ray fluorescence studies.
OBJECTIVES
The objectives of the module are to familiarize the student-with- the detectors, equipment, and techniques used in photon-excited.X-ray fluorescence. Commonly used X-ray detectors will
2
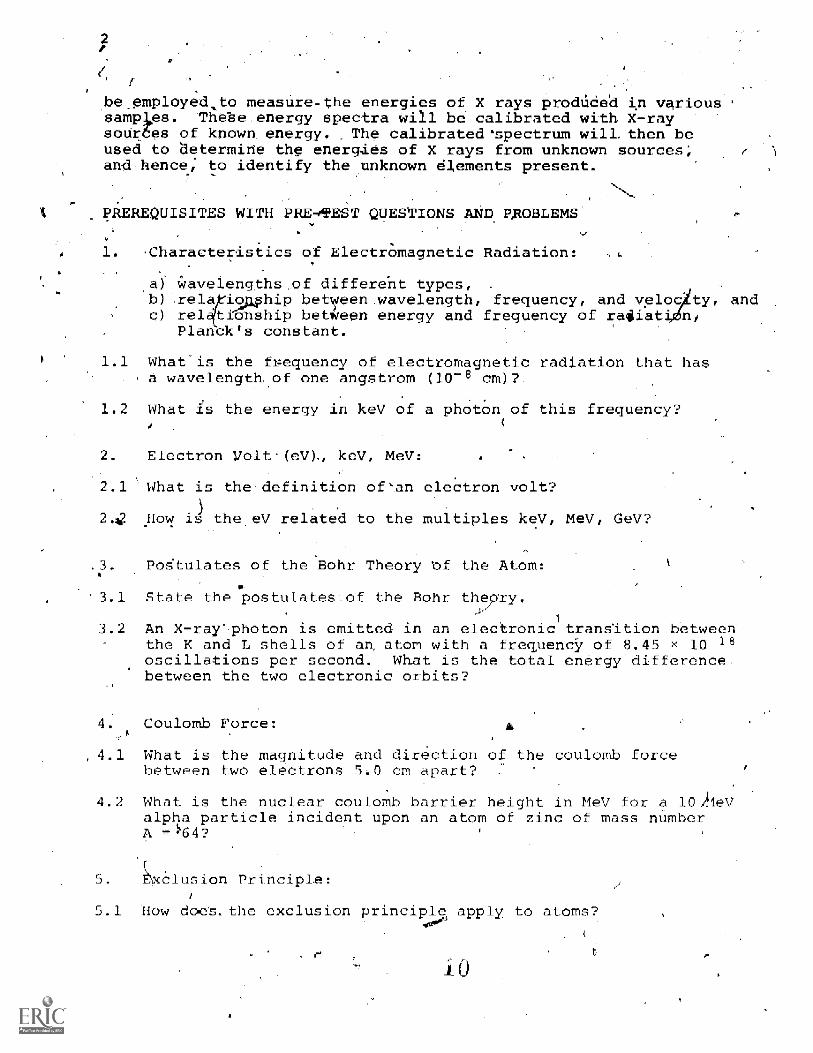
-befimployed,to measure-the energies of X rays produce'd in varioussamples. -TI7iebe,energy spectra will be. calibrated with. X-raysources of known_ energy. ;The calibrated spectrum will. then beused to 'determine the energies of X rays from unknown sources;and-hence; to identify the unknown elements present.
PREREQUISITES WITH PRETEST QUESTIONS AND PROBLEMS
1. .Characteristics of Electrjmagnetic Radiation:
a) T.:Iavelengths,of diffe eht types,b) ,rel
;
J qchip between wavelength frequency, and veloc , andc) relZtionship betiveen energy and frequency of radiat ni
Planck's constant.
1.1 What is the fveqUenCy of electromagnetic radiation that hasa wavelength: of one angstrom (10-8 cm)?
1.2 What is the energy in keV of a photon of this frequency?
2. Electron Volt.(eV)., keV, MeV :
2.1 What the definition of'.an electron volt?
2. .How is the eV related to the multiples keV, MeV, GeV?
Pos'tulates of the Bohr Theory of the Atom:
3.1 State the postulates ° -of the Bohr theory.
1_3.2 An x -ray photon is emitted in an electronic transition between-
the Kand L shells of an, atom with a frequency of 8.45 x 10 18oscillations per second. What is the total energy difference.between the two electronic orbits?
Coulomb Force:
, 4.1 What is the magnitude and direction of the coulomb forcebetween two electrons 5.0 cm apart?
4.2 What is the nuclear coulomb barrier height in MeV for a 10 /iIeValpha particle incident upon an atom of zinc of mass numberA = 1'64?
5. cclusion Principle:
5.1 Bow dpes.the exclusion principle apply to atoms

6. Interaction of Electromagnetic Radia
a) photoelectric effectbltinmpton effectci- pair production
.,6.1 4hat is the*raximu kinetic energy of an ele6fron ejected
from the surface of a meti by the photoelectric process ifak.4-the work required to free't-e electron from the surface.ia',
7 eV and, ultraviolet light ofifreqUency_ 14916 00gyq1/sa __ __c_isi__:___.,- A
used to illuminate the surface?
n with Mat
6.2 Show that for the Compton effect it is not possible to con-serve 'both total relativistic energy and momentum if anessentially free electron absorbs all of the energy anincident quantuirt.
7. Electron Capture and internallConversion:
71 Explain the differences between eleCtron capture and Internalconversion.
7.2 The ground state. of 50V decays by electron capture 70% ofthe t4aDie to the first excited state of "Ti at 1.55 MeV.HoW much energy is availabl- for electron capture?
THEORY
The Bohr Atoms
X ray's.are electromagnetic radiation of wavelengths in therange from 10-6 to 10'9 cm. he origin of X rays can best beExplained by -referring to the semiclassical picture of the atomas proposed by Bohr. In this model the atomicKelectrons areassumed to move about the nucleus in well-define circu arorbits under th fluence of the coulomb attraction be enl,the electron and the nucleus.
Figure 1 is a representation of the atomic nucleus and thefirst few electronic orbits The orbits whicl are closest to thenucleus correspond to more negative energies. Electrons in theseinner shells are more tightly bound to the nucleus than those inouter orbits.
Electromagnetic radiation' is emitted if'an electron. initiallymoving in a circular orbit of energy., Ei, discontinuously changesits motion so that it moves in an orbit of energy, Ef. The fre-quency of the emitted radiation, v, is equal to the quantity (Edivided by Planck's constant, h. The radiation is clas'sified asoptical radiation or X radia,tion depending on its energy with nopre04pe boundary separating the two. The ppii,cal radiation islower'in energy than the X radiation and ihcludes the visiblespegtrum.

4
_N/17.- SHELL-
L .SHELLRti
Electronic Energy Levels,
, Figure 1
A diagram depicting theatomic nuleus.and thefirst few electronic
orbits.
The total energies of the electrons i- the different orbitsEi, Ef, etc.)' ma be -found by solving Schroedinger's equa-tion using the nuclear coulomb-potential as the interaction poten-tial betwepn the negativelycharged electron and the positively-charged nucleus. Xor. an atom of charge +Ze with a single electron,
_this potential is just *
V
and one finds that the energy of this electron is just a functionof the principal quantum number, n. The quantum number, nr mayhave the values 1-r--1,2,3 and correspond to the major electronic shellsK, L, N,. ., respectively. The solutions of Schroedingeeb equa-tion also identify two other quantum numbers labeled X, m, whichcorrespond to.the relative orbital angular momentum between theelectron and the ucleus and its z-component.. L may have thevalues ,n-1, and in may have 'the values m=-L,-i4-1,
t
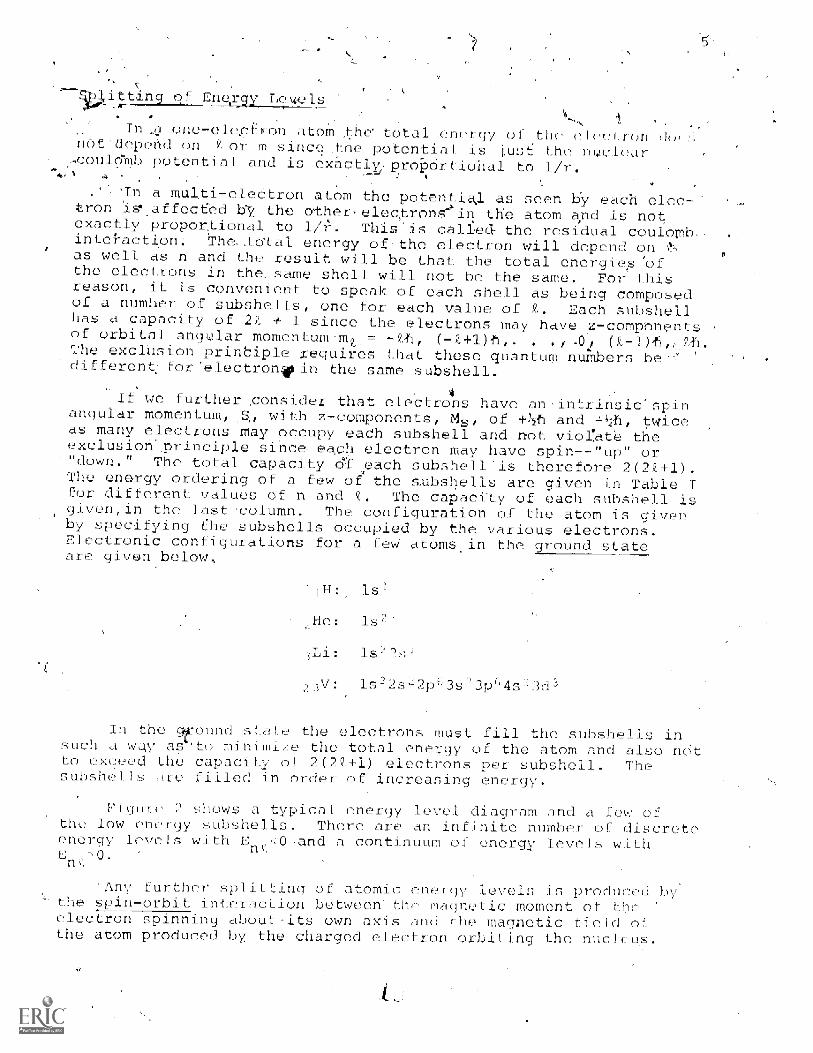
it in Enerc. -.,
Tn ,a one-electron atom the total onor ty of the elet.:l n rloenot=- depend on Y, or m since :he potential is lusC the nuclear.4-2ould'mb potential and is exactly, proportional to 1/r.
_ .
_(
In a illti-eleCtron atom the potential as seen by each elec-tron is*affectled bl the other-electronein the atom and is not.exactly proportional to 1/L This' is cal -led- the residual coulomb-inteFacton; the-tcftal energy of the electron will depend on (!-,
as well as n and the result will be that the total energies ofthe electrons in the. same shell will not be the same. For thisreason, it is convenient to speak of each shell as being composedof a number of subshells, one for each value of Z. Each subshellhas a capacity of 2Z + 1 since the electrons may have z-compOnonts -of orbital angular momentum m9 -th, (-Z4-1)h,. . (1-1),6 .th..-The exclUsion print!iple requires that these quantum numbers bedifferent: for'electrondpin the same subshell.
If we further consider that electrons have an.intrinsic'spihangular momentum, q, with z-components, Ms, of 4-11f1 and 1/21'1, twiceas many electrons may occupy each subshell and not vior'ate theexclusion'principle since- each electron may have spin--"up" or"down." The total capacity of each subshell is therefore 2(2Z+1).The energy ordering of a few of the subshells are given in Table Ifor different values of n and Z. The capacity of each subshell isgiven, in the last column. The configuration of the atom is givenby specifying he subshells occupied by the various electrons.Electronic configurations for a few atoms in the groundare given below,
Insuch 1 way asto excood thesubshells are
III: 1s1
He.
Li: is
V: is
state
Ind state the electrons must fill the subshells in_nimize the total energy of the atom and also nd
capacity of 2(2Z+1) electrons per subshell. Thefilled in order of increasing energy.
Figure s a typical energy level diagram and a few ofthe low energy subshells. There are an infJnite number nC discreteenergy levels with Erly0 and a continuum of energy levels withEr
'Any further splitting of atomic energy levels is produced bythe spin-orbit interaction between- tho magnetic moment of theelectron spinning about-its own axis and the magnetic field ofthe atom produced by the charged electron orbitlng the nucleus.

5
- Table I
Erierg Or-c ering of Electronic Sub-hqlis
Quantum Number Subshell Designation Capacity of Subshe 1
4f6s
14
5 5p 6
4 2 4d 105 0 5s4 =1 4p 6
3d 100 4s 2
3p 5
3 0 21 60 ,
is2
Vigure 2
Atomic energy levelsshowing a few lowenergy subshells.
E = 0,C1PTT c*tXCITATION
X-RAYEXCITATIO3d
Is
7
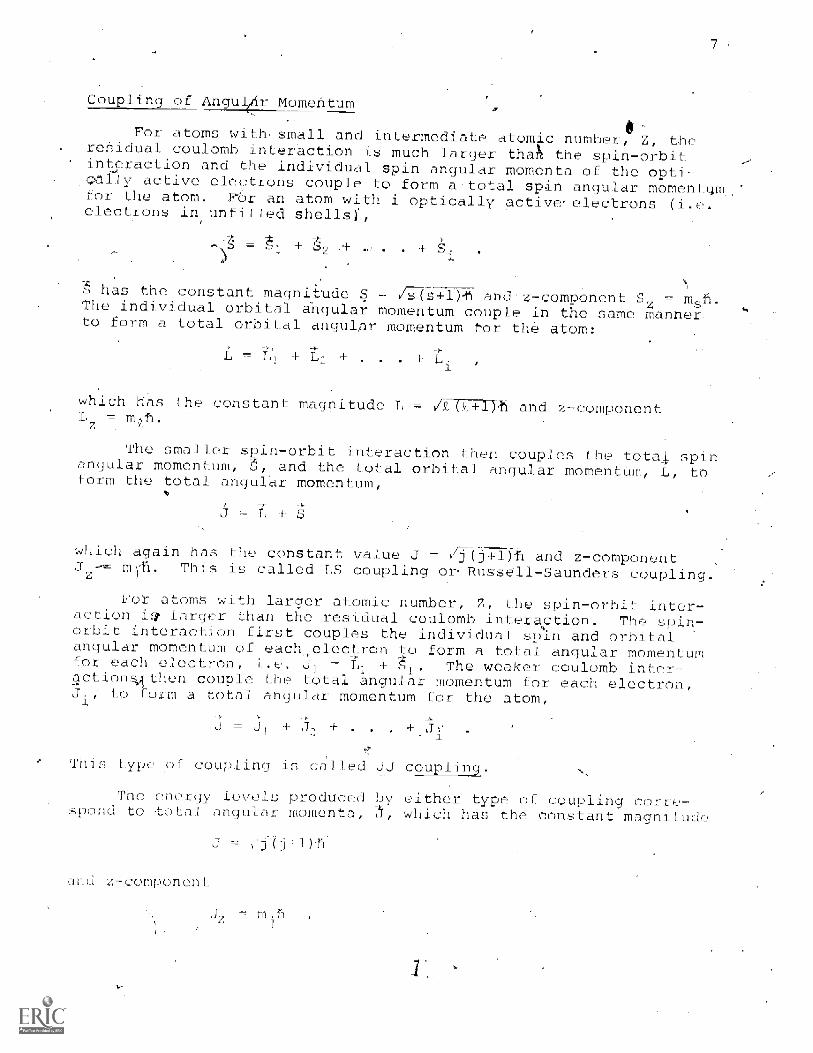
Couplinc fArigi-mc2rrientarn
For atoms with small and intermediate atomic number, Z, theresidual coulomb interaction is much larger thaN the spin-orbitinteraction and the individual spin angular momenta of the optic
active electrons couple to form a total spin angular momentrmfor the atom. Fbr an atom with i optically active- electrons (i.e.electrons in unfilled shells)',
+ + +
has the constant magnitude S /s(s-121),i'l and z- component = ISThe individual orbital angular momentum couple in the same manner.to form a total orbital angular momentum For the atom:
L + L2 + + L
which has the constant magnitude L = /2.7=R+IT and z-componentL = n
The smaller sc?in-orbit interaction then couples the total spinangular momentum, 5, and the total orbital angular momentum, L, toForm the total angular momentum,
%
-*
L
which again has the constant value J = j(j+1)-ri and z-componentm 4'1. This is called LS coupling or Russell-Saunders coupling.
For atoms, with larger atomic number, Z, the spin-orbit inter-ction i larger than the residual coulomb interaction. The spin-
orbit interaction first couples the individual spin and orbitalandulaT momentum of each=,,electron to form a total angular momentumfor each electron, i.(2. J1 + S,. The weaker coulomb inter-4ction%,ithen couple the total angular momentum for each electron,1
to form a total angular momentum for the atom,
This type of co piing is called JJ coupling.
The energy levels produced either type of coupling corre-spond to .total angular momenta, which has the constant magnitude
and z-corm onont
8
T atomic energy levels are thus specified by the quantumnumbers n, .2, j-
N%
Inie raction of Electra a nettc Radiation it Matter
Electromagnetic radiation may interact-with the atomic elec-trons'ty three prcesses: Photoelectric effect, Compton effect,
iand pair production./ In the photoelectr effect the energy. of,
ofs,
the incidernt quaptuin is completely 4Abs;:ored by the atom and thebound electron is ejected. For a Compton encounter the quantumscatters from an essentially free electron and go:-s off suffe ;ingonly a reduction in energy. For quanta with energies greater -thanthe rest mass energy of a pair of electrons, the process of pairproduction is possible. Here, the quantum of electromagneticradiation completely disappears with the production of a pairof electrons.
Excited States of Atoms
For an atom in an.excited state, one Or more electrons areexcited toa higher energy level (more positive iiltenergy). For-tunately,in most cases the number of electrons which make thetrans(tiops small. If an atom is excited by the absorptionof eIect.romgnetic radiAtion, at most only one quantum is absorbed *1by any particular atom and the quantum tends to interact with onlyone-or two elect-rdns.. The configuration of an atom in an excitedstate differs.from an atom in its ground state in that one or atmost a few electrons are in higher energy subshells and there arecorresponding vacancies in the subshells from which they came
/.
The possible excitation of an atom may be divided into twoprimary types.. The first type corresponds to excitations in whichan electron in one of the higher energy subshells which were occu-pied in the ground state of the atom is excited. The electron maybe excited into a higher energy bound state which corresponds to-a negative total energy or into a positive ever y continnqo state.If.the pxcitation of this electron is completel out of the.atominto a continuum state, the atom is said to be ionized. The second'type of excitation corresponds to an electron in one of the lowerenergy subshells being promoted- tb a. higher energy unoccupiedsubshell or to ,a continuum state. The exclusion principle requiresthat the electron bey excited to an unfilled subshell rather thanone that is already filled. %These two types of.excitations arerepresented in Figure 2.
X -Ray Fmission
An excitation of the first type requires only a few electronvolts (eV) of Hiergy while an excitation of the second type mayrequire more than a 1000 eV: After an excitation of either typethe atom will eventually return to its ground state 47 producing
q,uanta of radiation. he Very/high.energy quanta that form thecharacteristic X-ray spectrum of the atom are emitted when anexcitation of the second type has taken place. The much Iowerenergy quanta emitted when an atom returns to its ground stateafter an excitation of the first type. form the optical sPecti7uurof the atom. The atom de.--excites in both cases as electrons inthe higher energy levels fall -into the holes left by the excitedelectrons.
The major difference between X-ray*%nd optical spefra isthat the energies of X rays :increase uniformly from element toelement as the atomic number-, Z, increases an_ as no abruptchanges in energy from one element to the next as in opticalspectra. The reason being that the energies of the character-istic X rays depends on the binding energies of the electronsin the inner shells. With increasing atomic number, Z, thesebinding energies simply increase uniformly dueto,the increasednuclear charge, and are not affected by the periodic changes inthe number of electrons in the outer shell. The atomic energylevels involved in the emission of X rays are shown in Figure 3.4for four of -the innermost major shells. The energy levels arespecified by the quantum numbs n, i j which are given/ adjacentto the levels in Figure 3. The variouS--ossib4ilies &_,)'r the Kand h X-ray lines are also shown.
If the photoelectric effect-oceurs'aAd removes a Kelectronfrom the atom, the most probable event is an L electron will fallinto the K shell vacancy producing the characteristic K radiationfrom that element in the sample. For example the radiation pro-duced when a LTIT electron falls pinto A K vacancy is called theK, characteristic X ray. If an MII:.electron falls into the KL .shell vacancy a K1 X-ray is produced. For'Iight elemenbelow Tin) ,the most prominent X iaykitrom an element are theKi and th K lines.
Not all transitions are possible.in Figure 3. There -is aset of selection rules governing the changes in quantum numbersFor the allowed transitions. The selection rules are:
0
Aj = 0, tl
Some e the possible transitions which obey these rules are shownin Figure 3 for the K and L X rays. The X-ray line spgctrum of theatom conSists of these allowed transitions plus a few which areobserved to be emitted very infrequently in violation of these rules.

10
K X-RAYS L X-RAYS
0 - 1/21 1/21 3/2
1
1/21/23/2
2 3/22 5/2
4 0 1/24 1 1/24 1 -3/2
N 2 -3/24 2 5/2
3 5/23 7/2
ATOMIC ENERGY LEVELSINVOLVED IN THE EMISSION OF X-RAYS
P1 gore

11
Bremsstrahlen
.01-n addition to the X-ray line spectrum, one may also observea continuum spectrum which is often called bremsstrahldn. Thisis a word of German origin which means braking radiation ordeceleration radiation. Bremsstrahlen is produced by electrons,which have been djected from the atom, that have suffered Coulombinteraction scattering in close collisions with the nuclei ofother atoms in- the target:

12
Expe iment 1
Basic Source-Excited X.Ra Fluorescence,.
- L
To study he basic properties,of a lithium - drift. silicondetector for X-7,ray measurements; to,study the technices of pre-paring samples for fluorescing; to construct a calibration curvewith known Xray and gammarray lines andto use the cal4pTationcurve to determine the elemental composition of the unkn60.4.samples; to measure the resolution of a Ge(Li) detect.ot4,determine the energies of X rays from unknown radioactive.,
a Lithium- Drifted Silicon Detector
sources.
Reference
1. J. C. Russ, Elemental X-Ra- Anal-sis of Materials, availablefrom EDAX International, Inc., 4579 Creedmoore Road, Raleith,North Carolina ($5) .
F. S. Goulding and Y. Stone, "Semiconductor Rldiation Detects_Science, 170, 280 (October 1970.).
G. L. Clark, The Encyclopedia of X:Ra-s and Gamma Ra-s, ReinholdPublishing Co., N w York, 1963.
4. F. S. Goulding and M. Jaklevic, TL2ff11-fED21/AL3k:LX-Ray Fluorescence, TID-4500, available from Clearinghouse forFederal Scientific and Technical information, NBS, U. S.
Department of Commerce, Springfield, Virginia 22151.
5. R. D. Giauque and J. M. Jaklevic, "Rapid Quantative Analysisby X-Ray Spectrometry," Advances in X7Rqz2L.J11,11L, Vol. 15,p. 266, Plenum Press, New York, 1972.
R. Woldseth, D.,E. Porter, and R. S. Frankel, "The AnalyticX Ray," Researcn_nlazine, February 1971.
Introduction
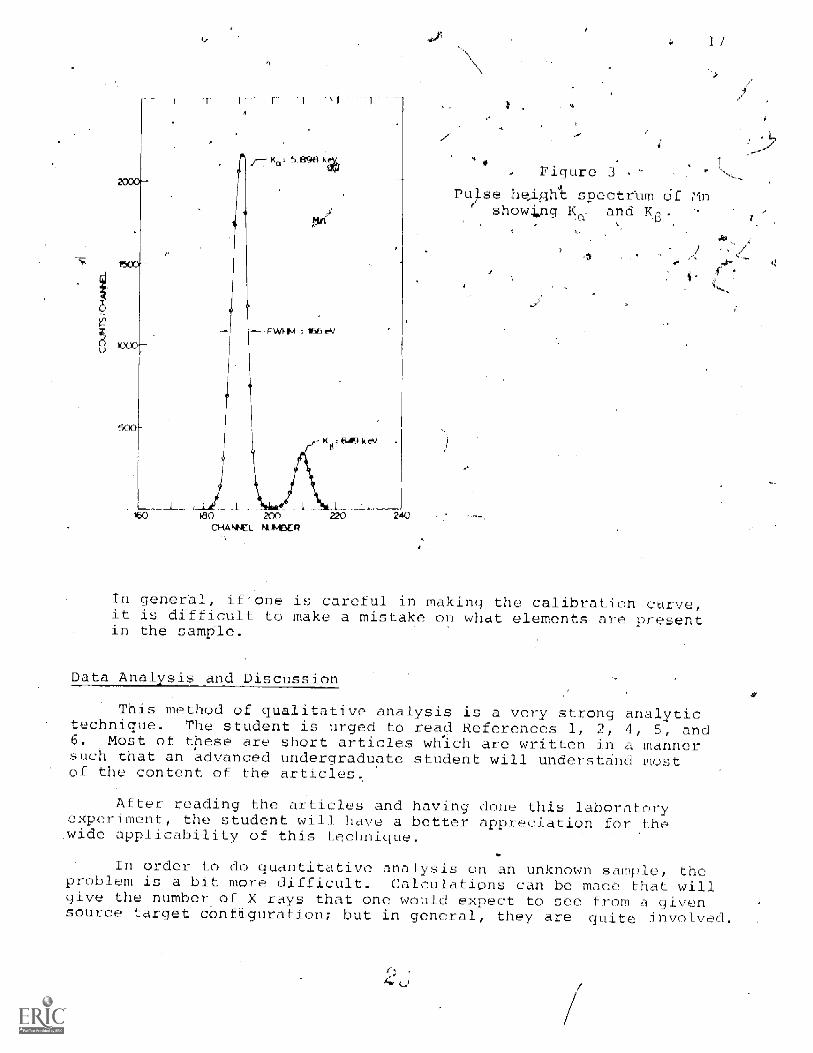
In this experiment we are going to use a Si(Li) detector tomeasure the X rays as low in energy as 2 keV and up to about 30 key.Normally those detectors show resolution capabilities. of 200 eV orbetter-. Figure 3, for example, shows a pulse height spectrum ofMn with one of these detectors, From an analytic point of view
fi
one of the most difficult problemd in X-ray spectroscopy (non-dispersive) is in trying to resolve between adjacent elements inthe periodic table. For example, let us assume that an unknownsample contains zinc and-copper. The strong X-ray line that we

13
would sec from zn is the Ka line at 8.638 keV. The Ka line fromcopper is 8.047 keV. (These energies are listed in Appendix V ofthis manual: X-Ray Critical Absorption and Emission Energies.)The problem is resolving these two lines which are 591 eV afPartin energy. This can quite easily be done with a 200 eV resolutiondetector.
If the student makes a careful calibration curve in accordancewith the instructions in this report, he will easily be able toidentify the unknowns that are provided in ti'le latter part oftheexperiment.
Equipment
1. Lithium- Drifted Silicv X-Ray Detector and Pre-amplifier(resolution ',200 eV)
2. Detector Bias Supply
3 Low Noise Spectroscopy Amplifier
4 MUltichannel Analyzer ('-',500 channels)
6 4
Excitation Source: 25. mCi of I7Yd- source muse be specially_
prepared for fluorescence applications. See, for -example, NewEngland Nuclear Corporation, Radioactive Source Catalog, 36 PleasantStreet, Watertown, Massachusetts. Note: sources of this activityrequire state licensing.)
OscilloscOe'(optional)
7. Various Materials, to be Fluoresced (for example: titaniumfoil, copper foil-, arsenic powder, and yttrium metal)
Nuclear Pulses generator (optional)
Procedure
1. Sample Preparation f-or Calibati
The materials to be used for sam.des can be standard reagentgrade chemicals. Usually these them- _ls are 95-plus percent pure.Metallic foils can be mounted direct-_y above the fluorescing appa-ratus or in an inexpensive sample holder. Powder samples are A'usually placed in these'plastic sample holders. These holders orcups are designed so that the part of the holder that faces theX-ray detector is a 1.25 x l0 cm Mylar film. The cups are plas-tic cylinders that have Mylar stretched over the bottom of thecylinder. A
The Mylar offers very little attenuation either to 'the excitingphoton coming into the Sample or the fluorescence X rays coming out ofthe medium. The plastic cups and the Mylar are nearly free of trace

14
materials and hence, quite good for trace analysis work. Theesample cups can be obtained from any of the companies that providesupplies for X-ray analysis studies. One such company is: SomasLaboratories Inc., 54 East 11th Street, NeW York, NY 10003.
Many manufacturers ply cups that can handle either solidor liquid sp.mples. In go oral sample preparation for calibrationis quite simple and offers no real problem for the student.
The samples to be used this experiment can be-prepared bythe students before the laboratory period begins.
Electronics. or
Set up the electronics as shown in Figure 1. Actually nuclearmodular electronics is quite easy to "hook up." Inputs and outputsare usually''clearly labeled and' the lengths of connecting cables arein general not important. Make sure the instructor approves the setup before turning on the high voltage power supply. CAUTION On someSi(Li). detectors the high voltage Must be slOwly turned to therecommended value. A wise practice is to take about 1 minute togo from zero up to the recommended voltage.
14V
POWERSUPPLY
RING SOURCE
rr
CHARACTERISTICX RAYS
ExcluNGRAumfloN
Cd7109 Lsource
SEMI GONDUCTORDOE CTOR
Si(Li)
MULTI.
CHANNEL
ANALYZER
PULSE
GENERATOR
READOU
Figure 1
Electronics for Source Excited X-ray fluorescence.
TELETYPE
Usually the source and collimator) are purchased from the manu-facturer as a single unit. 'Ideally,khis.unit would fit snuglyover the top of the detector shown in Figure 1. Since the sourcesused for X-ray fluorescence analysis arc of the order of many mCi's,some pat caution 'should be used i T handling the sources: The recom-mended ppocedure is usually-included by the manufacturer in theinstrucVion manual. Care must also be taken to protect the thin

15
berrylium window that allows the X rays to pass into the sensitiveregion of the detector.
These windows are of the order of 2.5 i0-3 cm or thinhence, Llay.will definitely break if th are touched, evenlightly.
3. Calibration
a. Place the highest atomic number sample to be used in the sampleposition (Figure oA case, this is yttrium,Z = 39. Thesample should physically be about 2.0 cm,er closer from theface of the detector. Adjust the gain of the amplifier sothat the 14.933 keV Kee line from yttrium appears about midwayin the multichannel analyzer. This roughly calibrates thesystem to 30 keV full scale..
Accumulate an yttrium spectrum in the multichannel analyzerfor a time period long enough to have %1000 peak counts in the_ line. This should take about 3 minutes. Readout the multi-channel analyzer on the teletype and record the channel positionof the Kc, and K,A lines. Note, a computer.program,written'inBASIC LANGLI,AGE (GAUSS-6) is included at the end of this manualwhich will find the centroid of a GAUSSIAN peak to an accuracyof 0.1 channels. Actually for the purposes of this experiment,a visual estimate of the centroid from the multichannel willusually suffice.
Accumulate spectra of arsenic, copper, and titanium, and deter-mine the centroids of the K and lines in the same manneraS (b) .
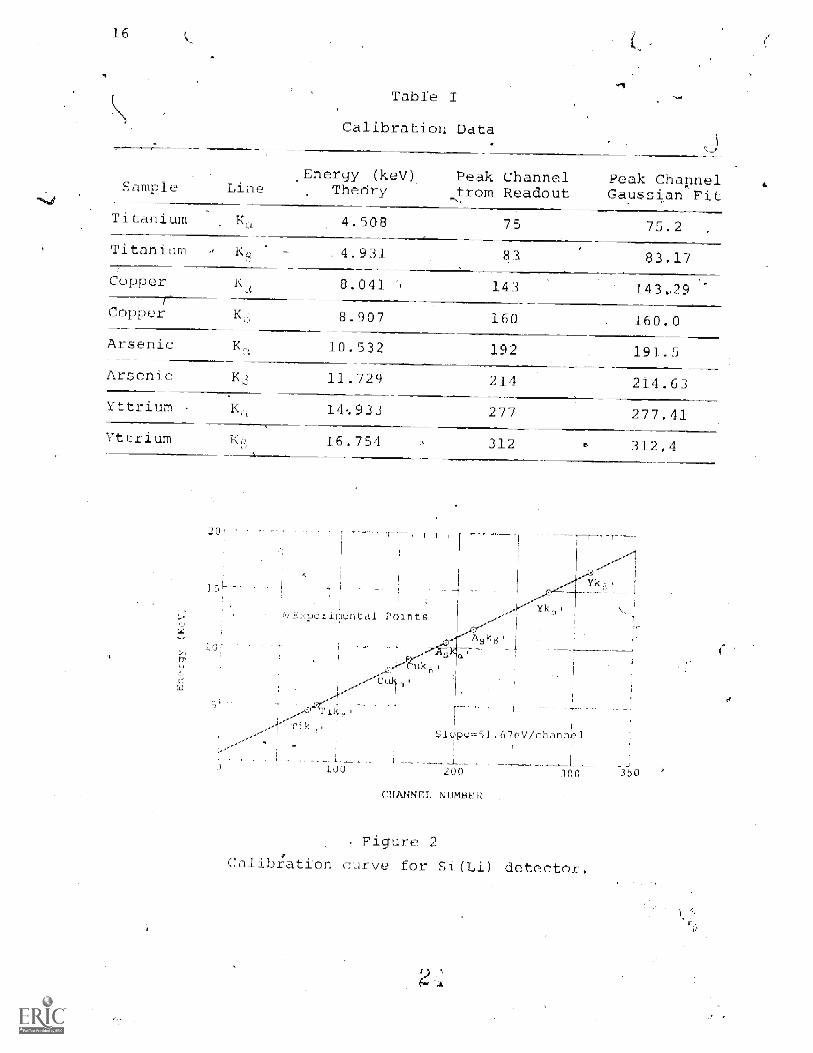
Plot a curve of energy vs channel number to establish the cali-bration curve. Table I shows typical calibration data that were-obtained by a group of undergraduate environmental students fromStockton State 'College, Pomona, New Jersey. Figure 2 shows thecorresponding calibration curve for this data. In Table I thecolumn labeled "Peak Channel from Readout" is the rough estimateof where the peak is from the teletype output. The columnlabeled "Garyssian Fit" was obtained from the computer programGAUSS-6.
Obtain the unknowns from e instructor, accumulate their spectra,find the centroids of the lines, assign energies from the cali-bration curve; and, hence, determine what elements are pr6sentin the unknowns. Figures 4 and 5 shoW typical compounds thatare given as unknowns. Remember for K lines the K, andenergies must be correct, or at least within 100 eV of theaccepted values. The same is true For L lines, which areshown in Figure 6. L , L, , -mod L must have the properenergies.
16
Table I
Calibration Data
Peak Channelfrom Readout
Peak ChapnelGaussian Pit
Sample Line.Energy (key)
. Thedry
Titanium 4.508 75 75.2
Titanium 4.931 83.17
Copper 8.041 143 143.29
Copper 8.907 160 160.0
arsenic Ka 10.532 192 191.5
arsenic 11.729 214 214.63
Yttrium 14..933 277 277.41
Yttrium 16.754 312 312.4
10:
0
7
Exper llion t 1 Min
T
IQy
Figure,Lalibration curve for
Slc-T0.---51. 670i/char-mei
200 300
NUMBER
detector.
350
wp0.-IAIWE imi3E
, Figure 3
Pulse hgislA spectrum cif Mnshowi.ng K. and K.
17
In general, if'one is careful in making the calibration curve,it is difficult to make a mistake on what elements are presentin the sample.
Data Anal and DiscussionAnal _
This method of qualitative analysis is a very strong analytictechnique. The student is urged to read References 1, 2, 4, 5, and6. Most of these are short articles which are written in a mannersuch that an advanced undergraduate student will understand mostof the content of the articles.
After rc ading the articles and having done this laboratoryexperiment, the student will have a better appreciation for thewide applicability of this technique.
In order to do quantitative analysis on an unknown sample, theproblem is a bit more difficult. Calculations can be made that willgive the number of X rays that one would expect to see from a givensource target configuration; but in general, they are quite involved.
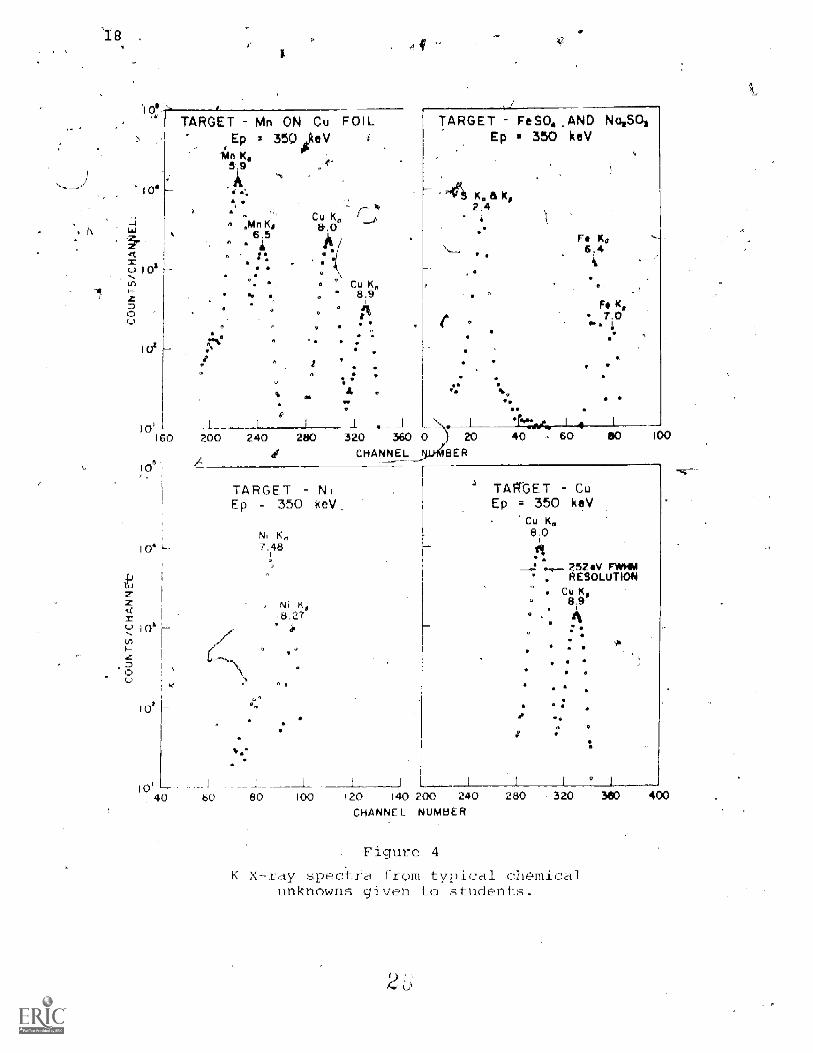
TARGET Mn ON Cu FOILEp 350 V
Mn A K.59
TARGET FeSO4,AND NoiSEp 350 keV
1 04
nKo6.5
Cu K,a.o
u1eHz0
1
lo'160 200 240 280 320 360 0 20 40 - 60
;0CHANNEL « «BER
lo'
TARGET NiEp = 350 keV
Ni Ka7.48
4 Ni K8.27
TARGET - CuEp 350 keV
Cu Ka8.0
!4i252 eV F*HM
, RESOLUTIONCu K.
.4*
40 60 80 100 120 140 200 240 280CHANNEL NUMBER
Figure 4
K X-ray spec{ from typical chemicalunknowns given to students.
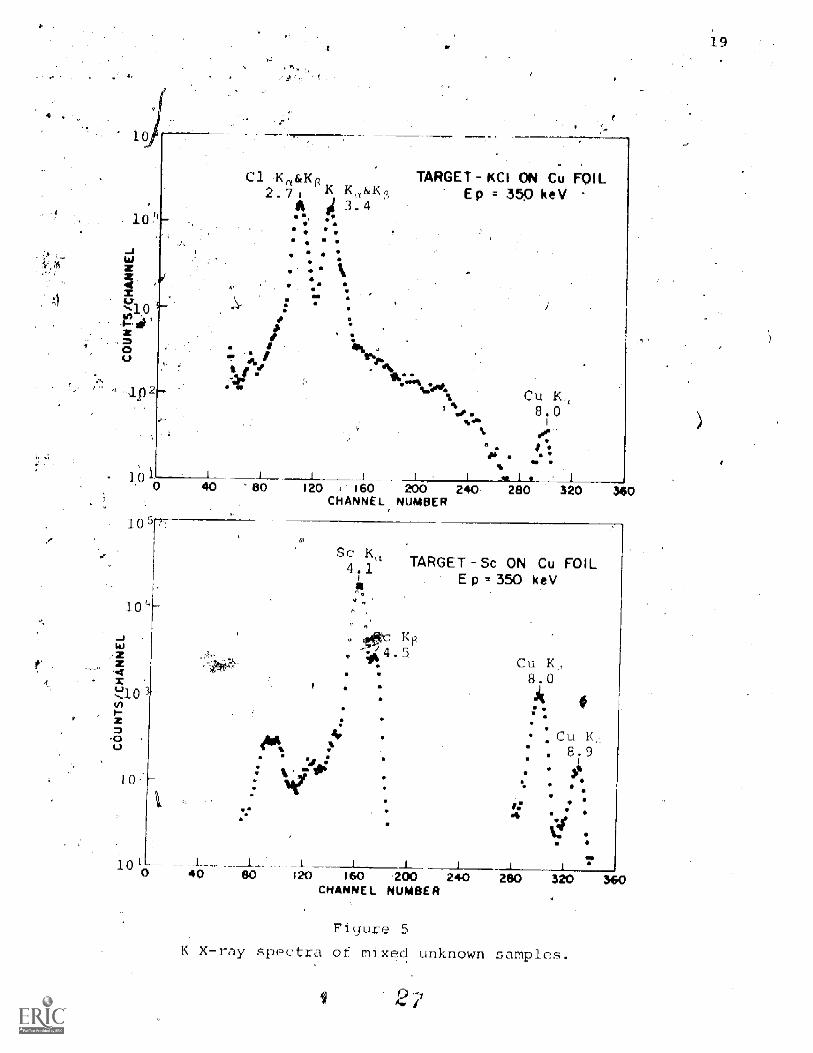
C1 Kii&K(/2.7, K
A 3.4, *,
TARGET KCI ON Cu FOILEp 350 keV
1_ I80 120 r 160 200 2
CHANNEL NUMBER
105
10
-Jwzzz
21OU)
10
1010 1
40
Sc X.4.1 TARGET Sc ON Cu FOIL
E p r- 350 keV
a a
a
1120 160 200 240
CHANNEL NUMBER
Cu K8.0
,CuC K
. 8. 9
*
a
Figure 5
K X-ray spectra of mixed unknown samples.
19

20 -
,The first problem is calculating how many exciting phetons,get into.ti -sample and how deep; next4'the question is how many eharacte*-istic X rayp get put of the:ample and' into. the detector. There areat least six parameters that one must consider for a Single elementtarget.
Resolution of the Detector
Shown in Figure 2 is the slope of the calibration curve. Thiswas obtained by determining the quantity (dEidc) where dE-difference irienergy petween the Y KB- and the Ti_Ka , de is thecorrespondin'q channel 'difference. The resolution of the detectoris the channel spread across the peak multiplied by the slope-ofthe -calibration curve. Detector resolution is usually given. interms of the Mn Ka line. .For- example, Figure 3 shows a pulseheight spectrum that was obtained for Mn with,a.system that hada calibration slope of 30.18 eV/channel. The channel spread acrossthe peak (Ka) in Figure 3.is about 5.5 channels. Note, it takes 5plotted channels to give j 5-channel spread, or full width at halfmaximum (FWEM)as it is sometimes called.'
a
Hence, for Figure 3:
Resolution = (5.5 channels)( 30.18 eV/channel)
= 166 -eV
Determine the resolution of your detector byre methodoutlined above.
Determination of an Unknown
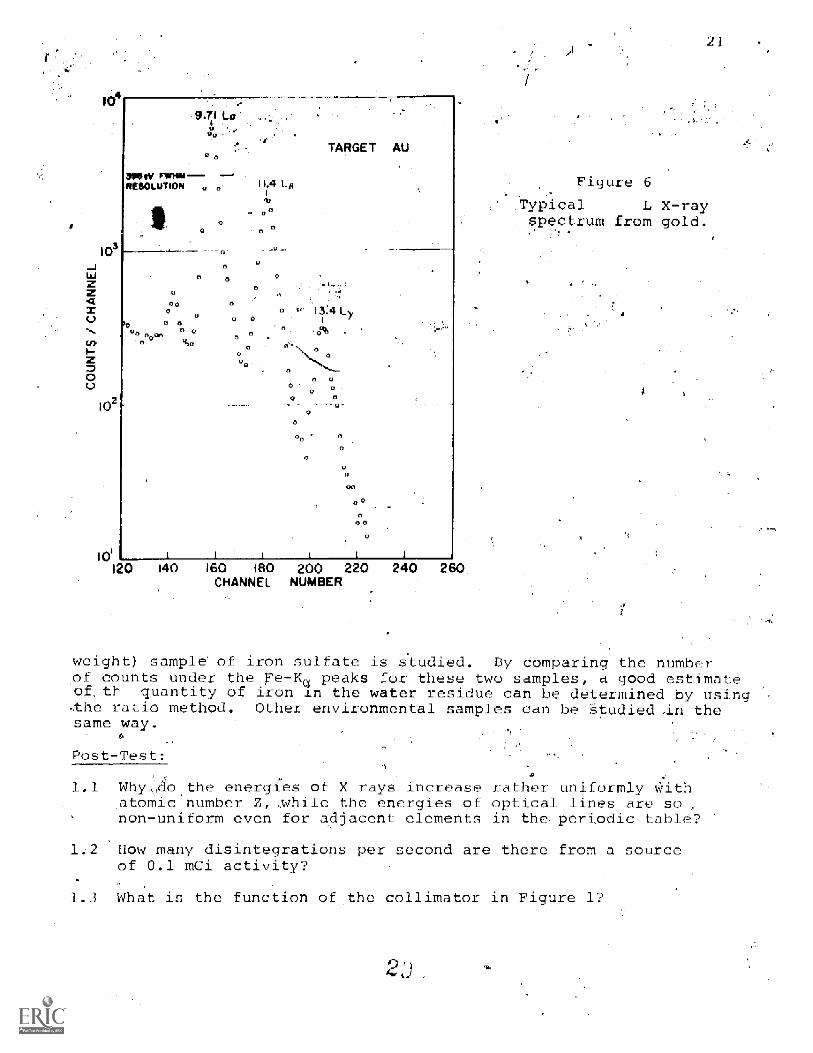
At this point the student is ready for the unknowns. Ingeneral, the instructor will have these samples prepared and readyto give to the students. These un owns can be single elements,chemical compounds', or solutions. he student should rememberthat both K and L lines can be excited from the'sample. If theunknown contains K lines, a spectrum similar to Figute 3-will beobtained. The Ka peak has approximately even times as manycounts as the KB. For L lines-the grPupsHisually observed arethe La , LB , and Ly . For example,-Figuke 6 shows typical Llines from a gold foil.
An easier method to do quantitative analysis with fluorescenceis by- thevtomparative method. In using this method,--all samplesmust be thin. This means that X rays made at the deepest portionof the sample must not be attenuated appreciably in going throughthe sample to the detector.
For example, let us assume that we have a dried water residuethat contains iron. We fluoresce a thin sample of the residue( A.008 cm thick) and obtain the iron- peaks. Next a thin (known
lo4
0il
lal
zzX
LO
z0
102
10
L71 La
3911iVRESOLUTION
000
0 00 0930
I L4 LB
- 0.
0 0
0
TARGET AU
4- I34Ly,0%
0 00
0
U
0
120 140 160 160 200 220 240 2CHANNEL NUMBER
21
Figure 6
Typical L X-raySpectrum from gold.
weight) sample of iron sulfate is studied. By comparing the numberof counts under the Fe -K peaks for these two samples, a good estimateof,th quantity -of iron in the water residue can be determined by usingthe ratio method. Other environmental samples can be Studied-in thesame way.
6
Post-Test:
1.1 Why,, do the energies of X rays increase rather uniformly with.atomic number Z, while the energies of optical lines are so ,
non-uniform even for adjacent elements in the- periodic table?
1. How many disintegrations per second are there from a sourceof 0.1 mCi activity?
1.3 What is the function of the collimator in Figure 1?
1.4 Roughly estimate the'nimber of counts in a 'gaussian peakwhich is 6 chahnels Wlde_(FWHM) and contains 3000 :countsin the peak4chan.nel
1.5 Obtain the slope of the calibration cutve, in Figure 2 usingthe data given',in-Table I for A) the Titanium 1(6 And ArsenicKB lines, and b) the Copper Ka and the Yttrium Ita
If J radioactive source of intensity io haS a half-life of128 days, what will be the intenOity in 640 days? How manyhalf-lives is this?
1.7 If the spectroscopy amplifier shown in Figure l is a linearamplifier, does that mean that the calibration curve shownin Figure 2 will also be linear?
computer Programs
GAUSS-6 finds centroids and FWHM. of. pulse height spedtra.'LINEAR-6 does linear least squares fit to calibration data. Thisprogram can be used to very accurately establish the calibrationcurve. -Students have used-this program to identify unknowns to±30 V.
Optional Work
Obtain radioactive sources from the instructor that have X raysin their decay scheme. Determine the energies of the X rays frathese sources. Any radioactive source (mil OCi) that has' eitherelectron capture or internal conversion in_ its deeay scheme willshow X rays from the daughter atom. The student is urged to reviewthese two simple-nuclear processes. For this experiment the 109Cdsource is removed and the source card containing the source isplaced about 1. cm away from the'detector.
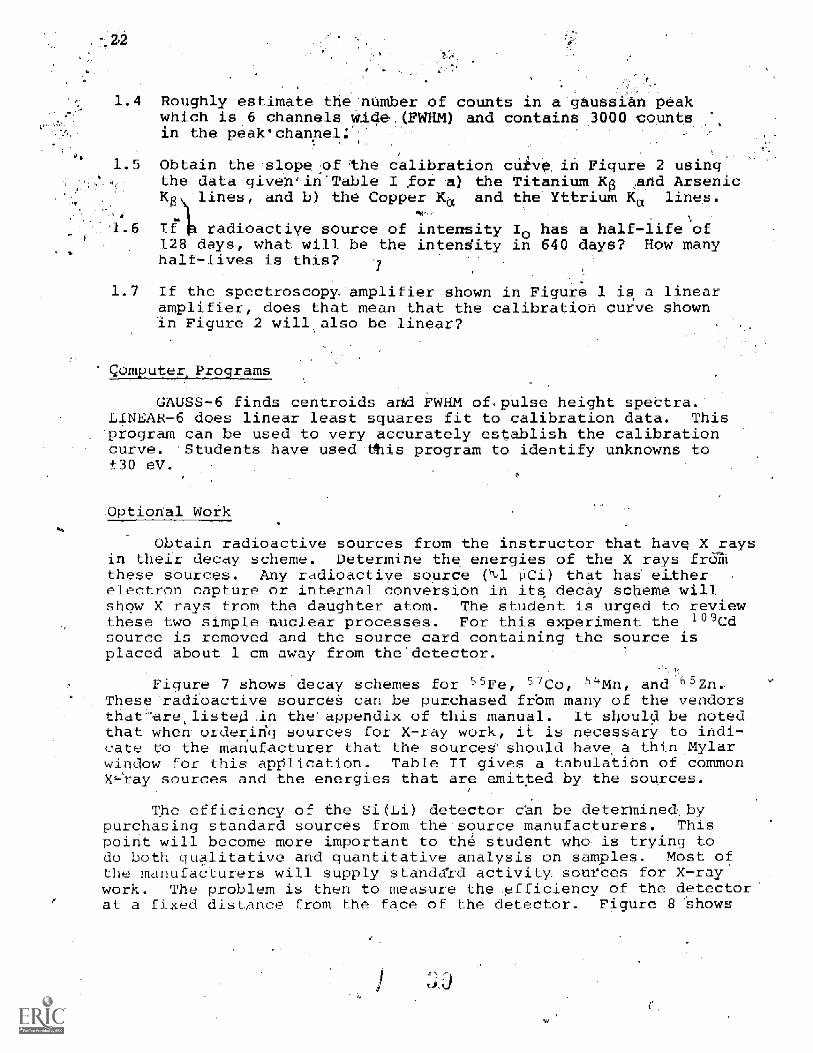
Figure 7 shows decay schemes for 55Fe, 57Co, 54Mn, and 55Zn,These radioactive sources can be purchased frbm many of the vendorsthat-ere.listea .in the'appendix of this manual. It should be notedthat When- ordering sources for X-ray work, it is necessary to indi-cate to the manufacturer that the sources' should have a thin Mylarwindow for this application. Table II gives a tabulation of commonX,-ray sources and the energies that are. emitted by the sources.
The efficiency of the Si(Li) detector can be determinec1bypurchasing standard sources from the-source manufacturers. Thispoint will become more important to th student who is trying to-do both qualitative and quantitative analysis on samples. Most ofthe manufacturers will supply standXrd activity sources for X-raywork. The problem is then to measure the _efficiency of the detectorat a fixed distance from the face of the detector. Figure 8 -shours-
5
EC (100%)
36MOV
.b 1439MeV
55--Fe (2.6y)
0d)
Figure 7
Decay schemes for 57Co, 54Mn, 55Fe, and "Zri,
Table II
Common Sources for X-ray Calibration
Nuclide Daughter Half -Life Radiation Photon Energy (keV)
57Co
54mn
88y
5 7Fe
`,4Cr
271.,6 d
312.6 d
106.6 d
Ka Ks X rays
Ka, KB x rays.
Ka,Kf3 X rays
6.40, 7.059
5.411, 5.947
14.933, 16.754
-41Arn 23'7Np. .58 105 d a' ')( rays 13.9, 17.8,20.841AM 237Np
LY_
X Lays 3.30
:41AM 237Np ray 26.4
20-3114 203T1 46.59 d K- X rays 70.821, 69.894
55Fe , 55Mn 2.7 y rays 5.895, 6.492
65Zn "Cu 243.7 d Ka, K; X rays 8.041, 8.907
"Cr Sly 27.8 d X rays; 4.949, 5.427
23
24
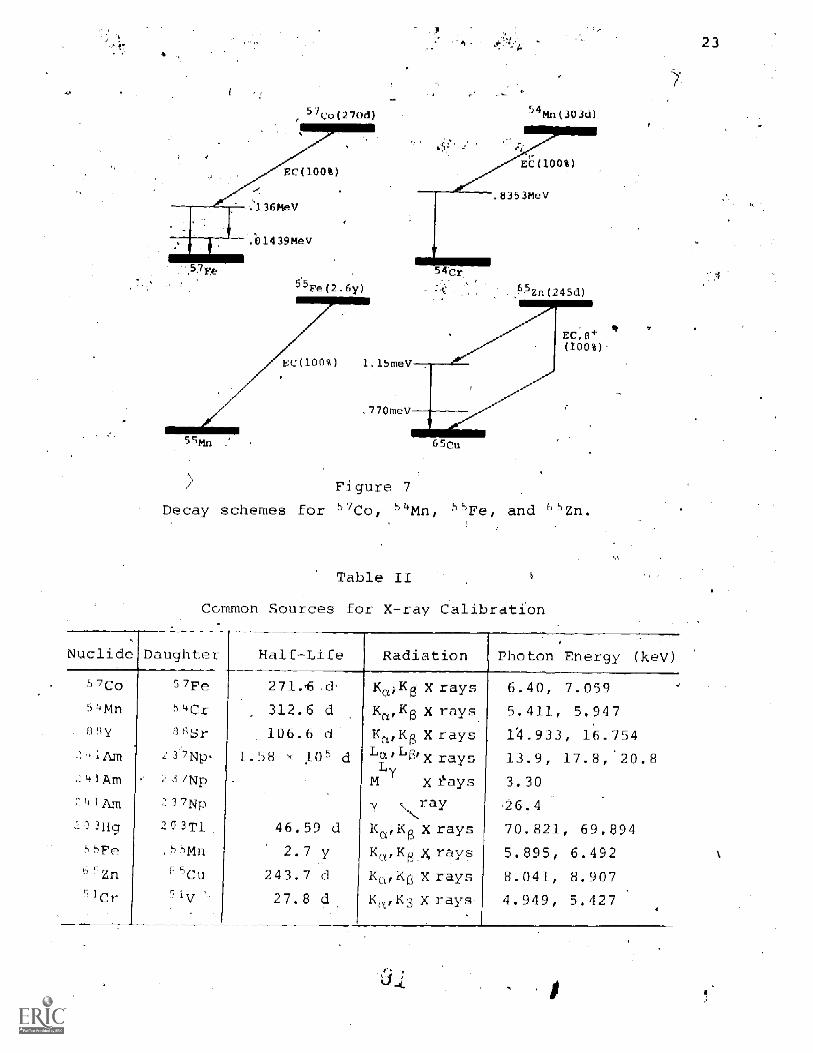
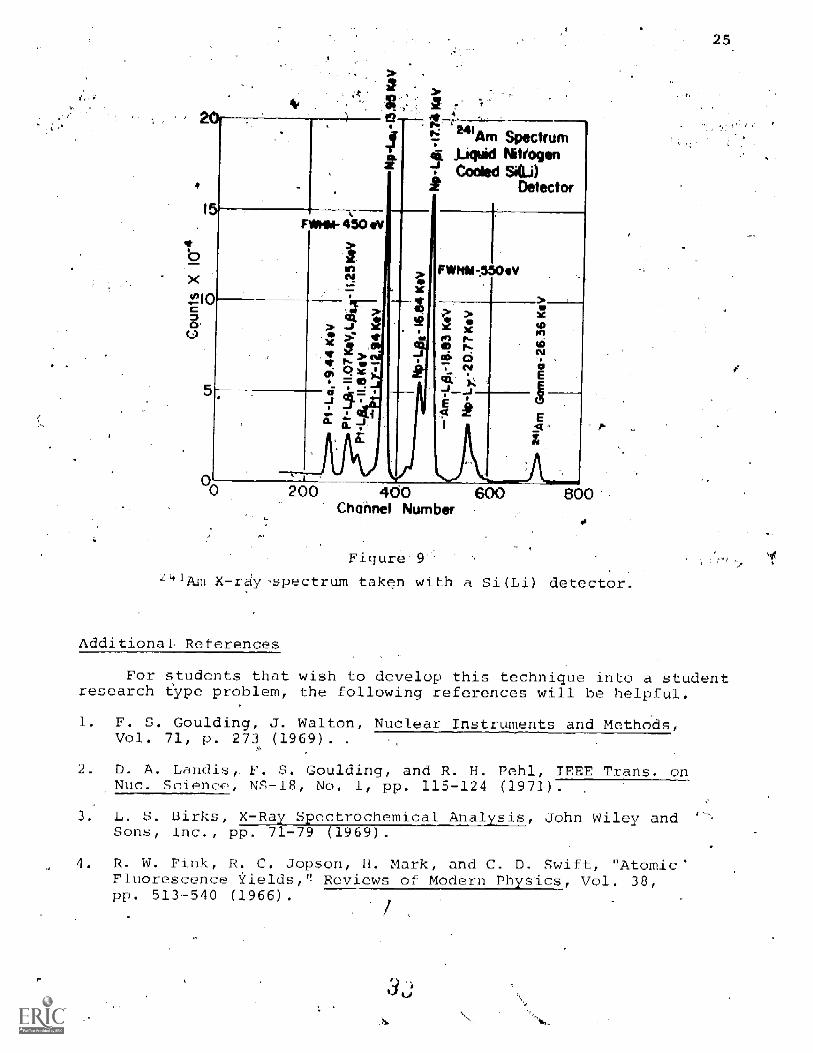
typical efficiencies of a Si(Li) detector with various thicknessentrance windows. This experipent can easily be done if thestdhdard gources al=e available. Pigue re 9 shows a typical spettrumthat was obtaned from an .241Am source,. The intensities of thelines in Figu e 9 are shown in Table I. The platinum peaksshown, in Figure are from fluorescence of the source backing.
NERGY (kW)124 62 31 21 16 12.4 6.2 3.1 2.1 1.6 1.24-100
0
CD 110
3 mm THICKSi DETECTOR
0.13 mm(5 mil)
UNDO tS
00o 0.05 mm
(2 mil)
(TRAL RESPONSE OF Si DETECTORox 0 i 0.2 ).4 0.6 Q.6 i
2 10
WAVE LENGTH (A)
Figure 8
Spectral response of a Si(Li) detector.
Table IIIIntensities
Photon Energy (keV)
of 241A Lines
Relative Intensity %
11.89 Np Lk 2.213.90 Np La 37.517.80 Np 56.320.80 Np Ly 13.826.35 .Am=y 7.059.50 Am-y 100.0
Am SpectrumNitrogenSILO
Detector
b
0Q
> _
C
200 400 8Channel Number
Figure 9-
spectrum taken with a Si(Li) detector.
Additional References
25
For students that wish to develop this technique into a studentresearch type problem, the following references will be helpful.
1. F. S. Goulding, J. Walton,Vol. 71, p. 273 (1969).
2 D. A. Landis, F. S. Goulding, and R. H. Fehl, IEEE Trans.
Nuclear Instruments and Methods,
Nue. Science, NS-18, No. 1, pp. 115-124 (1971).
L. S. Birks, X -Ram ctrochemi2lAL21, John Wiley andSons, Inc., pp. 71 -79 (1969).
4. R. W. Fink, R. C. Jopson, H. Mark, and C. D. Swift, "Atomic'Fluorescence Yields," Reviews of Modern Ph sue, Vol. 38,pp. 513-540 (1966).
26
5. C. M. Lederer, 3. iii. Hollandr, - and I. P rimai, Table ofIsotopes, Sixth Edition, John W iley and Sons, !Ino._(1967).
6. R. D. Giauque, "A Radioisotope Source Target Assembly forX -Ray Spectrometry," Anal. Chem., Vol. 40, pp 2075-2077(1968) .'
27
Experiment 2
Fluorescence with a .LithiumDrifted Germanium Detector
(Source Excited)
Objective
To study the basic properties of a lithium-drifted germanium,Ge(lii), detector; to construct a eafibratiOn curve with knpwn X-ray-
'andgamma-ray lines from radioactive sources end to study Sourcee ited X-ray fluorescence in the energy rlingefrom15 to 100 keV;-
determine the elemental composition in unknown samples.
References
Dearnalpy.and D. C. Northrop,-Sem _nductokCounters forNuclear Radiations, 2nd edition, Wiley Publishing Co., New'York, 1966.
42. W. R. French, R. L. Lab and J. 4. Curran, {" "Lithium DriftedGermanium DetecXors," n Journal of Ph sics, Vol. 37(1),p. 11, 1969.
3. W. R. French, Jr., Wr. and S. E. Moore, "Measurementof Photoelebtric, Compto air Production. Cross Sectionsin Germanium," American 1,of Physics, Vol. 37(4), p. 291,,1969.
F. S. Goulding, "SemicondliCter Detectors--Their Properties andApplications, Nucleonics, Vol. 22(5), p. 54, 1964.
5. J. C. Russ, Elemental X -Ray Analysis of Materials, availablefrom SDAX International, Inc., 4509 Creedmore Road, Raleigh,-North Carolina, 1972 ($5).
IntroductiOn
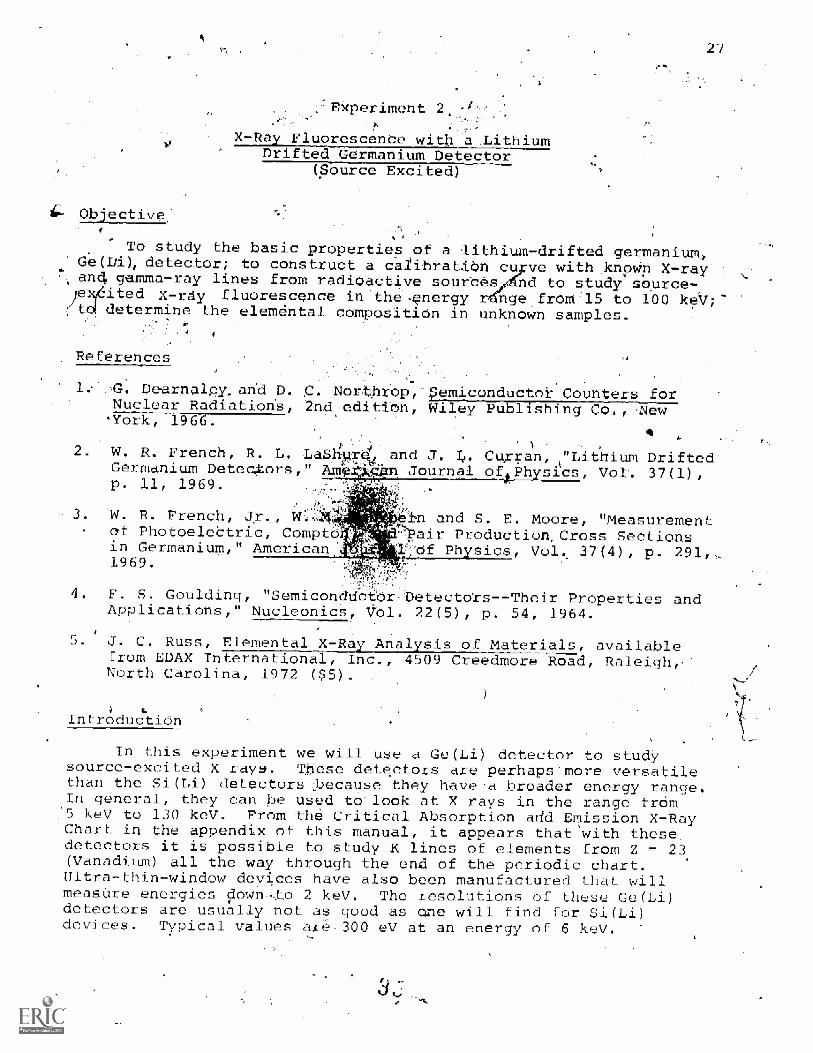
In this experiment we will use a Ge(Li) detector to studysource-excited X rays. These detectors are perhaps'more versatilethan the Si(Li) detectorsJoecause they have a broader energy range.In general, they can be used to look at X rays in the =range from'5 keV to 130 keV. From the Critical Absorption add Emission X-RayChart in the appendix of this manual, it appears that with thesedetectors it is possible to study K lines of elements from Z 23(Vanadium) all the way through the end of the periodic chart.Ultra-thin-window devices have also been manufactured that willmeasure energies down -to 2 key. The resolutions of these Ge(Li)detectors are usually not as good as one will find for Si(Li)devices. Typical values are'=300 eV at an energy of 6 keV.

28
Nevertheless, they represent the "state of the art" for lookingat K lines for intermediate to heavy elements. Fortunately,nature is with us here in that as the atomic number of the Sample -
increases the K X-ray energy difference between adjacent elementsalso increases; and, hence, ma eV resolution Is adequate for- .
most measurements. In any case,. &nee the student has performedthis experlment, he will certainly appreciate the-usefulness ofthese detdctors. In a later experiment we will discuss the useof these thin-window Ge(Lil X-ray detectors in the solution topollution problems.
Equipment_
1. Lithium- riftedGermanium,Ge(Li) x-Ray-Detector- (resolution 400 eV or better at 6 keV)
2. -Detector Bias Supply
3. Low Noise Spectroscopy Amplifier
4. Multichannel Analyzer 0.500 channels)
5. Radioactive Sources for Calibration as follows:
a) 10 jCi 57Cob) 1 pCi 241Amc) 5 pCi 137Csd) 2 pCi 109Cd
6. Radioactive Source for Exciting the Samples 10 mCi 57Co
, Oscilloscope
8 Various Materials,to be Fluoresced (for example: silver, tin,iodine, tantalium, gold, mercury, lead)
9. Nuclear Pulse Generator (optional)
cedure
Electronics
Set up the electronics as shown in Figure 1. Vote, care shouldbe used in adjusting the bias voltage to its recommended value. Thecollimator shown in Figure 1 is a lead sleeve that/ fits Over the endcap of the detector. The sleeve has asoid end on it which facesthe sample. A hole (,1.25 cm) is drilled in the solid end whichallows the emitted X rays to'pass into the detector. Usually the -
schematic drawings that come with the excitation source (l mCi57Co) Will clearly,indicate how the source can be adapted to thedetector. The radioactive sources are usually deposited in ring

geometry directly on the collimator:. The samples to,be studiedshould be placed about 2 cm from the excitation source.
COMM
RING SOURCE
SAMPLE
CHARACTERISTICX-RAYS
MULTI-CHANNEL
ANALYZER
Co-- 7 SourooEXCITING
RADIATION
SEMICONDUCTORDETECTOR
L
OSCILLOSCOPE
REAOOLI
29
TELETYPE
Figurd 1
Electronics for X-ray fluorescence with a Ce(Li) detector.
2. Calibration
In this experiment we are going to study X rays in the energyrange from 10 to 85 keV; and, hence, the multichannel analyzer mustbe calibrated in this range. This calibration will be made withX-ray and gamma-ray lines from radioactive sources. The sourcesused and their characteristic energies are shown in Table I.
Table i
Radioactive Sources Used for Energy Calibration Ce(Li)
Source Half-Life Photon Energies (KeV)
iCo 270'd 14.37, 121.94, 136.31
2 4 1 Arn 458 y 26.36, 59.57
13 /Cs 30.0 y 32.191, 36.376
'd 453 d 87.7, 22.162, 24.942
30
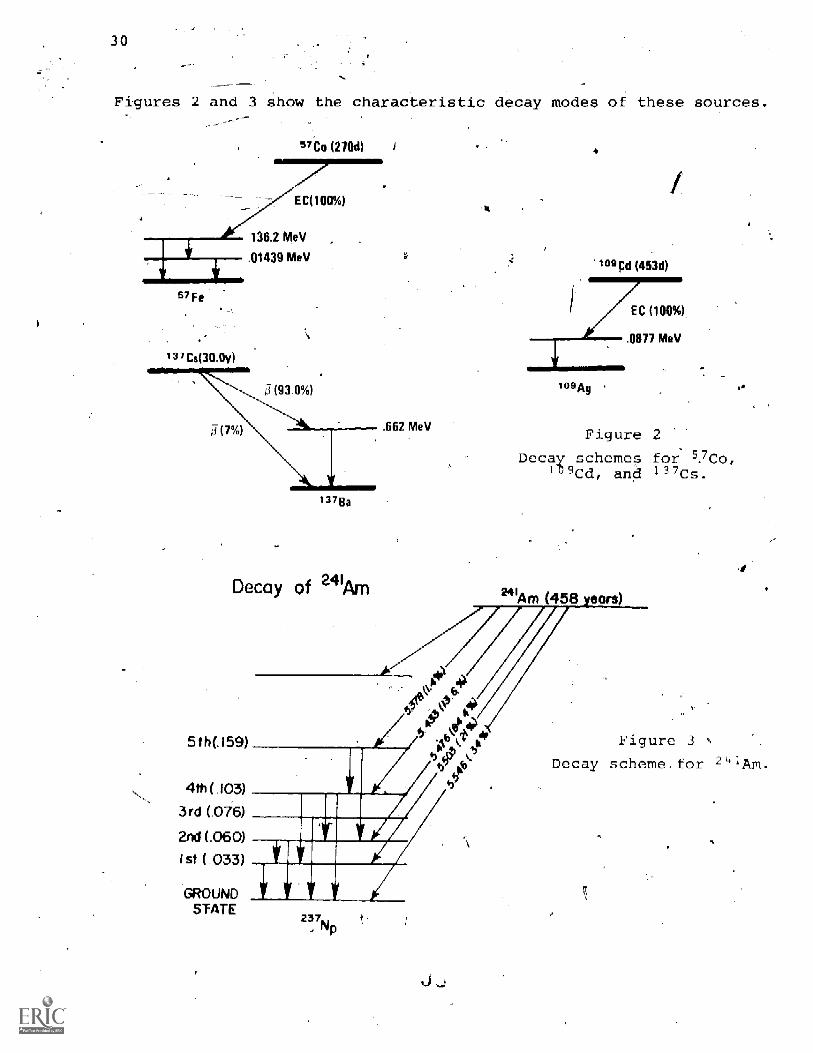
Figures 2 and 3 show the characteristic decay modes of these sources.
57Fe
ECOON
136.2 MeV
.01439 MeV
1 37 Ba
.662 MeV
1090 (453d)
EC (10%)
.0877 MeV
10A
Figure 2
Decay _schemes for 5 /C0.9Cd, and 137Cs.
5 th(.159) Figure )
4th (.103)
3rd (.076)
x(0601st (033)
GROUNDSTATE
237Np
Decay scheme for 2
31
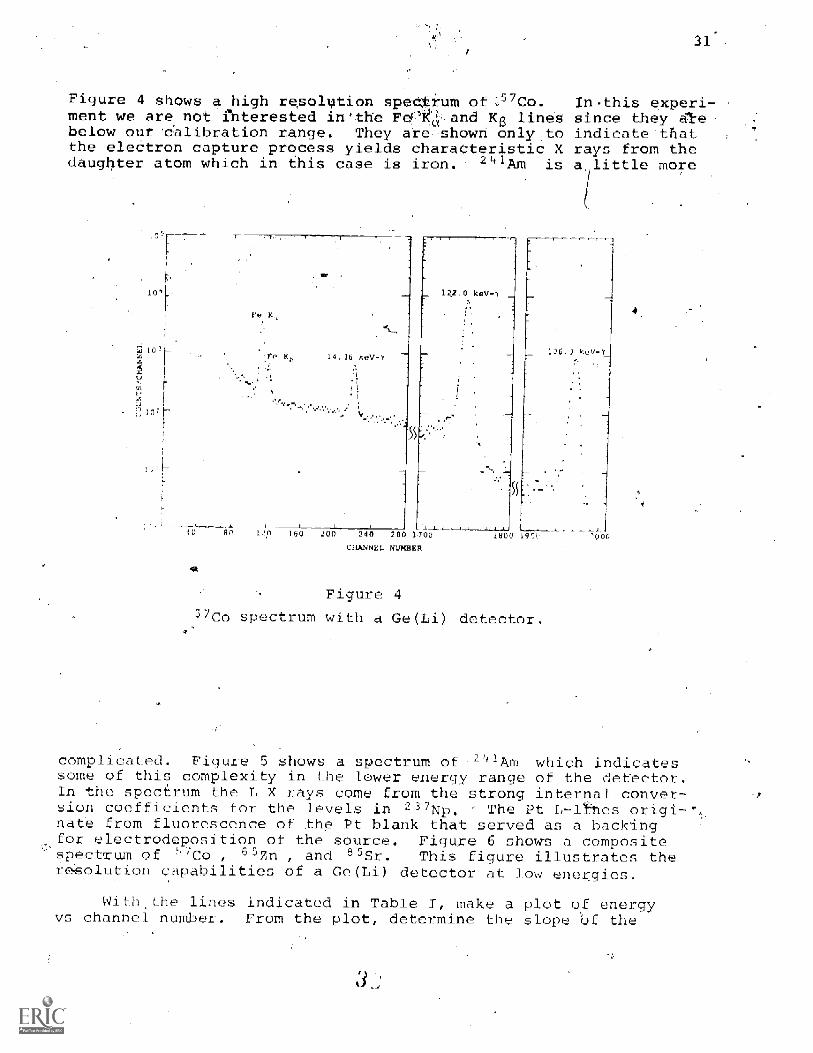
Figure 4 shows a high resolvtion speo*rum of 57Co. In.this experi-ment we are not interested in'the Fell(cti and K lines since they alebelow out 'calibration range. They are shown only to indicate thatthe electron capture process yields characteristic X rays from thedaughter atom which in this case is iron. 241Am is a,_little more
CHANNEL NUMBER
Figure 4
__ctrum with a Ge(Li) detector.
complicated. Figure 5 shows a spectrum of '241Am which indicatessome of this complexity in the lower energy range of the detector.In the specfLrum the L X rays come from the strong internal conver-sion coefficients for the levels in 237Np. - The Pt L-lYnes origin`:_nate from fluorescence of the Pt blank that served as a backingfor electrodeposition of the source. Figure 6 shows a compositespectrum of 'Co= , 65Zn , and "Sr. This figure illustrates theresolution capabilities of a Ge(Li) detector at low eriogies.
With the lines indicated in Table 1, make a plot of energyvs channel number. From the plot, determine the slope -Of the

32
200 400Channel Number
Figure 5
Pulse height spectrum of 2 4 1Am.
Figure 6
Cmposite spectrum oft Co,57 65Zn, and 85Sr.
105
tO"
03
z
10°
5 7
6.403A 8.05
7c07.057
800
Zn8.9
05-Sr13.5
200 400 600CHANNEL NUMBER
33
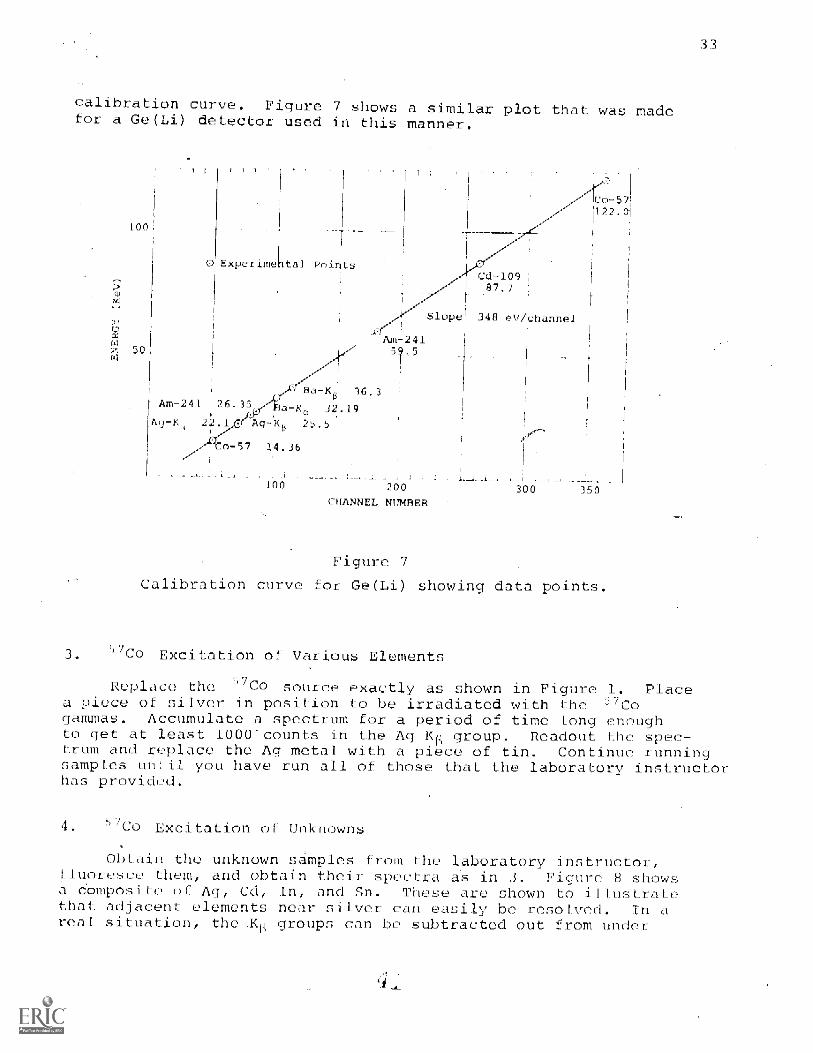
calibration curve. Figure 7 shows a similar plot that was madefor a Ge(Li) detector used in this manner.
100
z 50
r T /
0 Experime tal Points
Ba-K6 36.3Am-241 26. 32.19Ag-K, 22.1 liAg-K6-
-57
100
Slope 348 eV/channel
200 300 350CHANNEL NUMBER
Figure 7
Calibration curve for Ge(Li) showing data points.
3. 57C0 Excitation of Various Elements
5 _Replace the 7 Co source exactly as shown in Figure 1. Placea piece of silver in position to be irradiated with the -'Cogammas. Accumulate a spectrum for a period of time long enoughto get at least 1000 counts in the Ag K Readout the spec-trum and replace the Ag metal with a piece of tin. Continue runningsamples unit you have run all of those that the laboratory instructorhas provided.
4. 57Co Excitation of Unknowns
Obtain the unknown samples from the laboratory instructor,fluoresce them, and obtain their spectra as in 3. Figure 8 showsa Composite of Ag, Cd, In, and Sn. These are shown to illustratethat adjacent elements near silver can easily be resolved. In areal situation, the .ky groups can be subtracted out from under

34
ine nergy_.(keV
22.104.Ag
Ag K 24.987Cd Ka 23.109Cd 2-6.143In K 24.139In K5 27.382Sn
Ag Cd KaIn K
Sn KEs
28.601
CHANNEL NUMBER
Figure 8
Combined spectrum of Ag, Cd, and Sn with Ge(Li) detector.
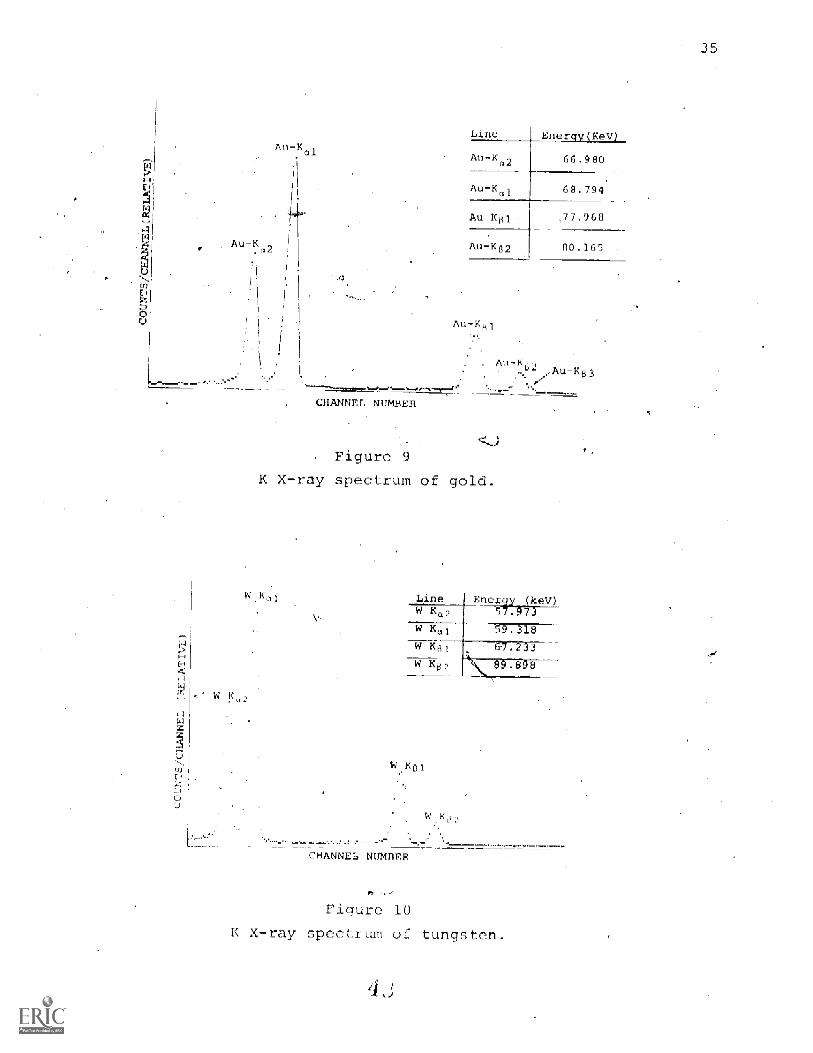
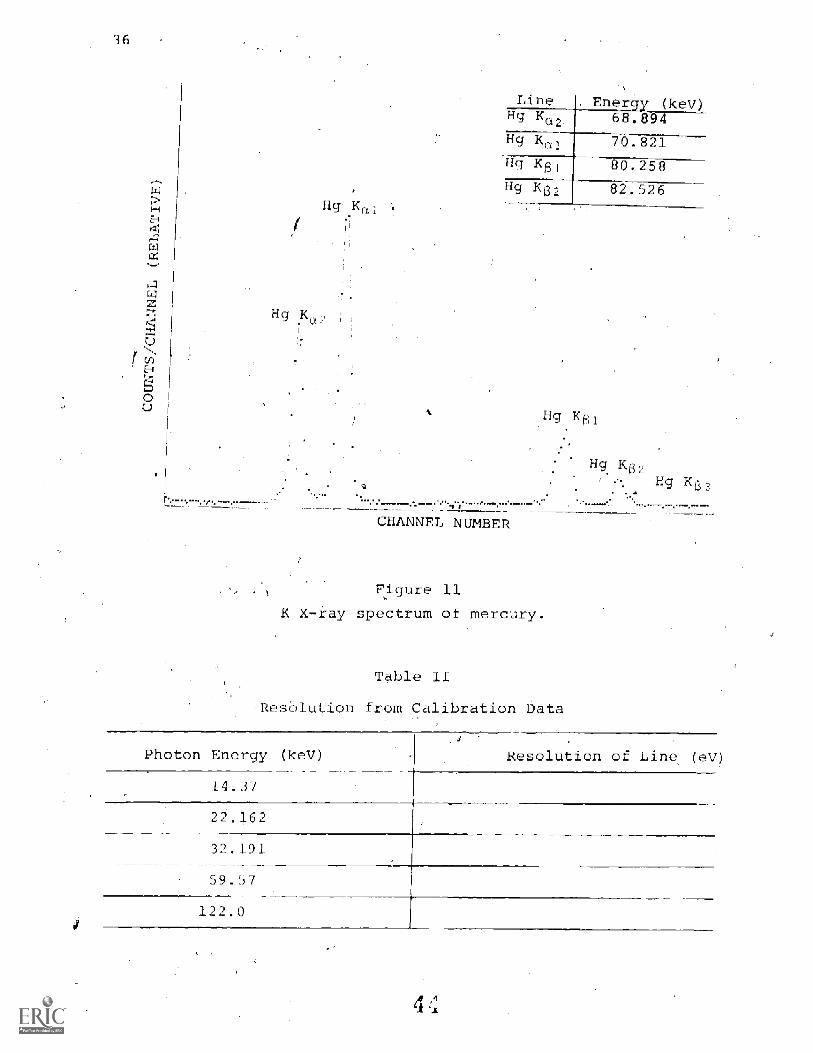
the Ka groups. This is easy to do since the Ka/Kp ratios are wellknown and the position of the 1K group is also accurately known.Eigure8 9, 10, and 11 show K lines from three popular samples thatare frequently studied. Note the separation of the Kc2 and Kailines for heavy elements. For light elements the E 1 and Ku2groups usually appear as one group.
Data Reduction
Exercise (a)
Measure the resolution of the ilowinq lines from the cali-bration sources used in the CALIBRATION (B) 14.37, 22.162, 32.191!59.57, and 122. key. See Experiment 1 for the details of thisprocedure. Fill in the data Table
Exercise
Plot= a curve of energy in keV versus resolutionin Table II.
nn th hits
35
CHANNEL NUMBER
Figure 9
K X-ray spectrum of gold.
W K,-,
WK
CH_ANNEL NUMBER
Figure 10
K X-ray spectrum of tungsten.
36
Hg K1
Hg K ,
Line Ene (key)Hg Ket,2 68.894
Hg Kai 70.821
0.258
Hg 2.526
Hg K61
CHANNEL NUMBER
FigurFigure 11e
K k - ray spectrum of mercury.
Table II
ResOlution from calibration Data
Fig KB,
Photon Energy (key) Resolution of Line (eV
14.37
22.162
32.191
59.57
122,0

37
Exercise
Determine the experimental energies of the materials that werefluoresced in Procedure 3 above. Fill in data Table III (an example
Table III
Comparison of Experimental and Theoretical Ka and K
Sample Energy (KeV), (Theory)
Measured Channel Energy (KeV)(Measured)
Ag Kc 22.104
Ag K 24.987
Cd Kc,,, 23.109
Cd R3 26.143 !
In K 24.139
In K 27.382 .
Sn Kr, 25.1913
Sn Ki, 28.601
Exercise (d)
For the unknown samples determine the energies of the K X-raygroups; and, hence, determine the elements that are present in thesample. Note there is a listing of K X-ray energies in the barkoF Utis manual.
Post-Tes:,
2.1 Dcflno internal conversion coefficients.

Computer Programs
(See the Appendix of this manual.)
GAUSS-6 and LINEAR-6 can be used to accurately establish Lhecalibration curve shown in Figure 6. With the aid of these pro-grams, students have been able to determine the energies of Klines for heavy elements to an accuracy of ±50 eV which is quitegood for these detectors.
Additional References
For students who wish to use a germanium detector for seniorresearch-type projects such as pollution analysis, etc., the-following additional references will be helpful.
1. J. A. Cooper and J. C. Langford, Pacific Northwest Laboratoriesreport No. BI W-SA-4219 (May 1972) .
R. G. Flocchini, P. J. Fenney, et al., NuclearMethods, Vol. 100, p. 397 (1972).
Ins arid
R. D. Giauque and J. M. Jaklevic, Advances in X -Ra sis,Vol. 15, X. F. J. Heinrich, editor (Plenum Press, 1972),p. 164.
4. W. H. McMaster, N. Kess, et al., University of CaliforniaLawrence Livermore Laboratory Report UCRL-50174 (May 1969).

Oblective
Experiment 3
Fluorescence Using a Gas FilledProportional Counter
39
To study the basic properties of gas-filled proportionalcounters for X-ray measurements; to become familiar with the elec-tronics used with proportional counter X-ray measurements; toconstruct an energy calibration curve; to X-ray fluoresce knownand unknown samples in order to determine the characteristic eller-gies of the K X rays from these samples and thus, toltdptify theunknown elements; to study escape peaks present in X -ray spectrataken with proportiondl counters and their causes; to measure theefficiency of a proportional counter as a function of X-ray energy;and to identify unknown radioactive Sources from their X-ray speCtra.
References
I. W. J. Price, Nuclear RadiationCompany, New York, 1964.
Detection McGraw-Hill Book
2. R. E. Lapp and H. L. Andrews, Nuclear Radiation Ph-sics, PrenticeHall, Inc., Englewood Cliffs, New Jersey, 1963.
t. S. Birks, XRay S-ectrochenAnal--sis, John Wiley & Sons,Inc., 1969, pp. 71-79.
4. G. D. Chase and J. L. Rabinowitz, Princi les of Radioisoto eMethodology, Burgess Publishing Company, Minneapolis, 1967.
J. Radiological Health Handbook, U. H. Department of Health,Education, and Welfare, PH S Publication 2016, Washington,D. C., 1970.
Introduction
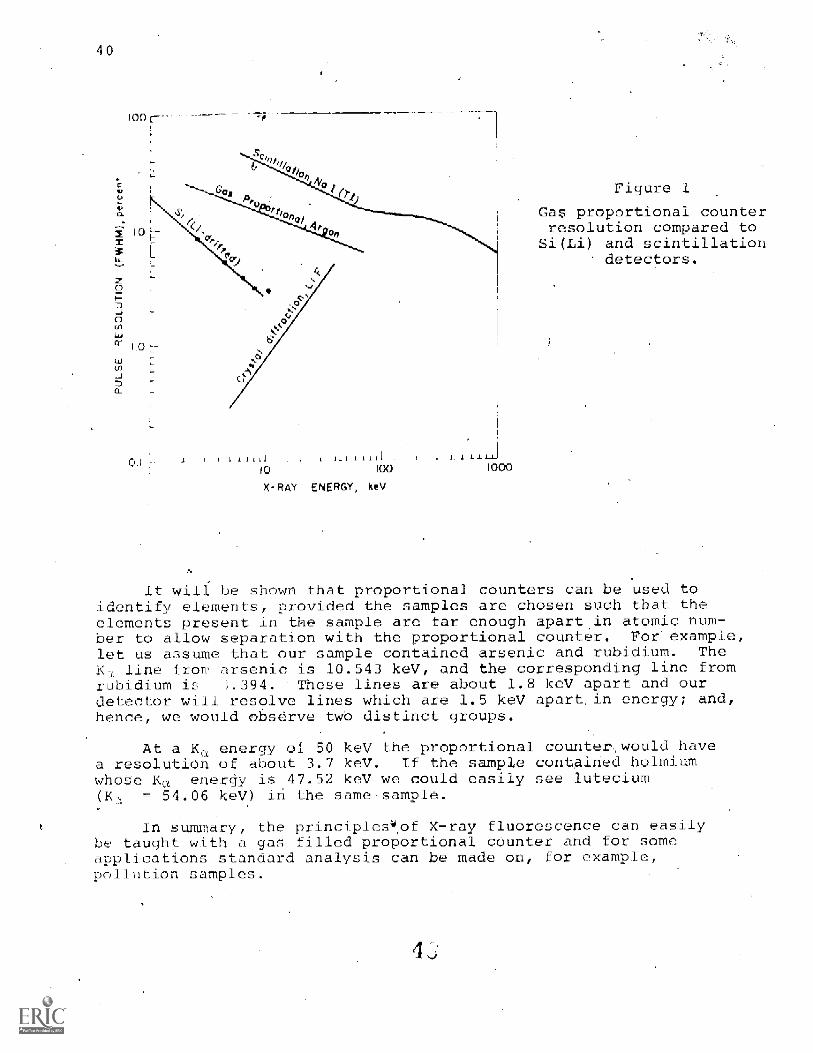
X-ray fluorescence experiments can be done with rather inex-pensive gas-filled proportional counters. In general, the resolu-tion that one finds with a proportional counter is perhaps afactorof 5 or 10 times worse than would be. observed with a high-resolutionSi(Li) detector as described in Expeliment 1. For example (seeFigure 1) -the resolution of a typical proportional counter is 15%at an X-ray energy of 10 keV, while the corresponding Si(Li) reso-lution is about 3%. Nevertheless, proportional counters for thisapplication cost around $300 while the corresponding Si(Li) detectorcosts at least a factor of ten more.
40
100
1 11.11 11 1_111111.to loo
X -RAY ENERGY, keV
1 1. I 1_1
1000
Figure 1
Gas proportional counterresolution compared toSi(Li) and scintillation
detectors.
It will be shown that proportional counters can be used toidentify elements, provided the samples are chosen such that theelements present in the sample are far enough apart in atomic num-ber to allow separation with the proportional counter. For example,let us assume that our sample contained arsenic and rubidium. TheKt line from arsenic is 10.543 keV, and the corresponding line fromrubidium is ;.394. These lines are about 1.8 keV apart and ourdetector will resolve lines which are 1.5 keV apart in energy; and,hence, we would observe two distinct groups.
At a Ku energy of 50 key the proportional counter., would havea resolution of about 3.7 key. If the sample contained holmiumwhose Ka energy is 47.52 key we could easily see lutecium(Ka = 54.06 keV) in the same sample.
In summary, the principles4,of X-ray fluorescence can easilybe taught with a gas filled proportional counter and for someapplications standard analysis can be made on, for example,pollution samples.
Equipment
1. Thili Window Proportional Counter for-X-Ray Applications
Proportional Counter High Voltage Power Supply
Pre-amplifier for Proportional Counter Application
4 Low Noise pectroscopyAmplifier
5. Biased Amplifier (optional)
6. Multichannel Analyzer
10 mCi }Co5 Source for Excitation with Lead Shield
Radioactive Sources for Calibration as follows: '1 pCi,10 pCi, liCs; 10 pCi, 57Co
41
9- I Am;
9. Samples to Fluoresce (fOr example: copper, zirconium, palladium,aftd cadmium. These can all be thin foils.)
10. Oscilloscope (optional)
Dcedu
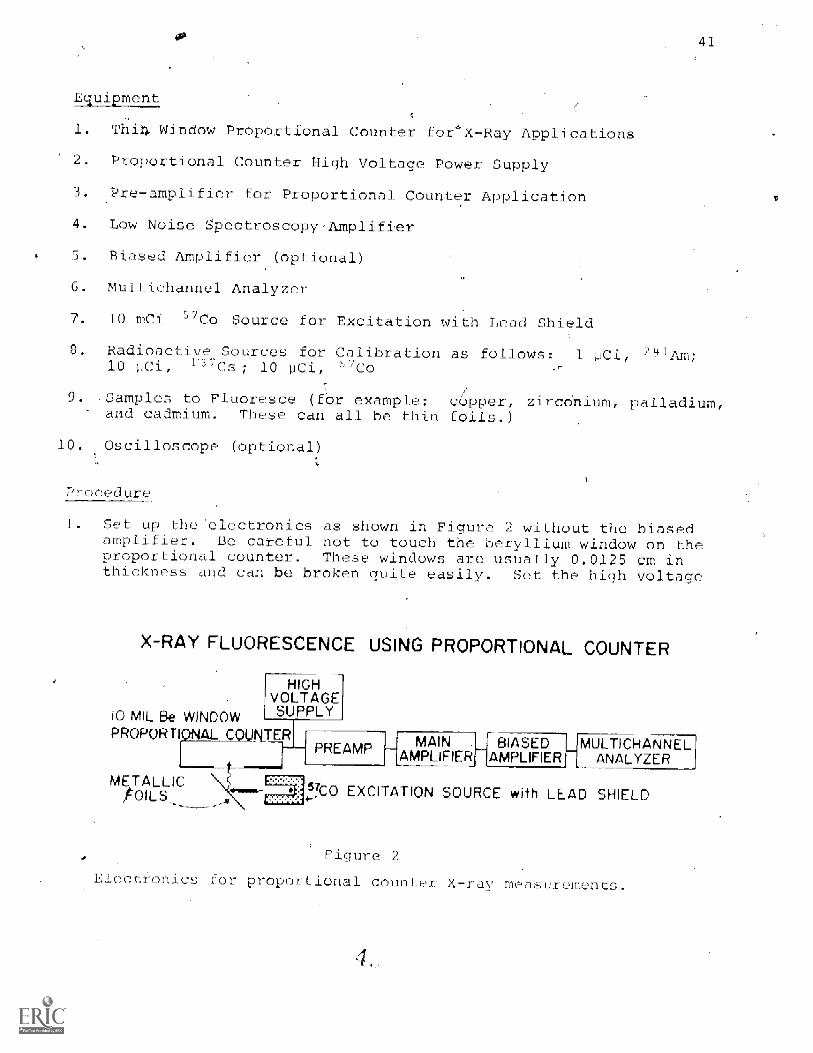
1 Set up the 'electronics as .shown in Figure 2 without the biasedamplifier. Be careful not to touch the beryllium window on theproportional counter. These windows are usually 0.0125 cm inthickness and can be broken quite easily. Set the high voltage
X-RAY FLUORESCENCE USING PROPORTIONAL COUNTER
10 MIL Be WINDOW
HIGHVOLTAGESUPPLY
PROPORTRWAI-OUNTER[PREAMP
METALLICFOILS_
MAIN BIASEDAMPLIFIER AMPLIFIER
MULTICHANNELANALYZER
5TCO EXCITATION SOURCE with LEAD SHIELD
Figure 2
Electronics to _ proportional l counter X-ray measurements.
.42
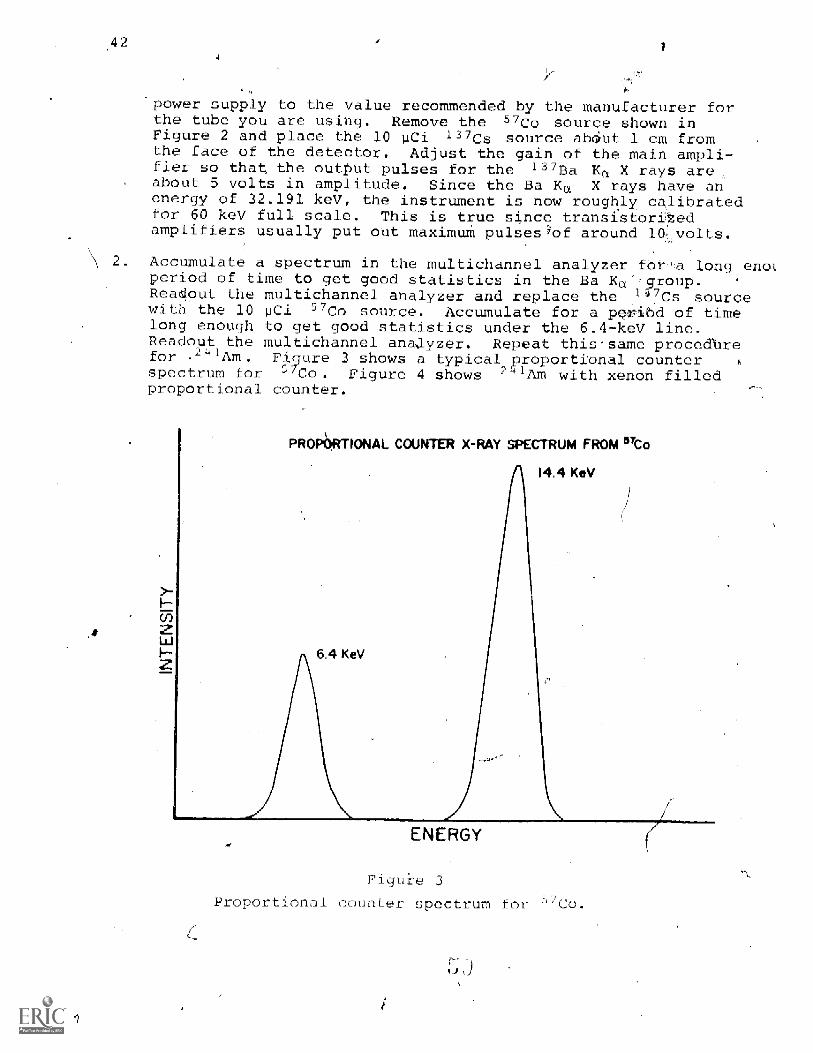
power supply to the value recommended by the manufacturer forthe tube you are using. Remove the 57Co source shown inFigure 2 and place the 10 pCi 137Cs source abOut 1 cm fromthe face of the- detector. Adjust the gain of the main ampli-fier so that.the output pulses for the 137Ba Ka X rays areabout 5 volts in amplitude. Since the Ba Ka X rays have anenergy of 32.191 keV, the instrument is now roughly calibratedfor 60 keV full scale. This is true since transistoriedamplifiers usually put out maximum puises3o- around 1Vvolts.
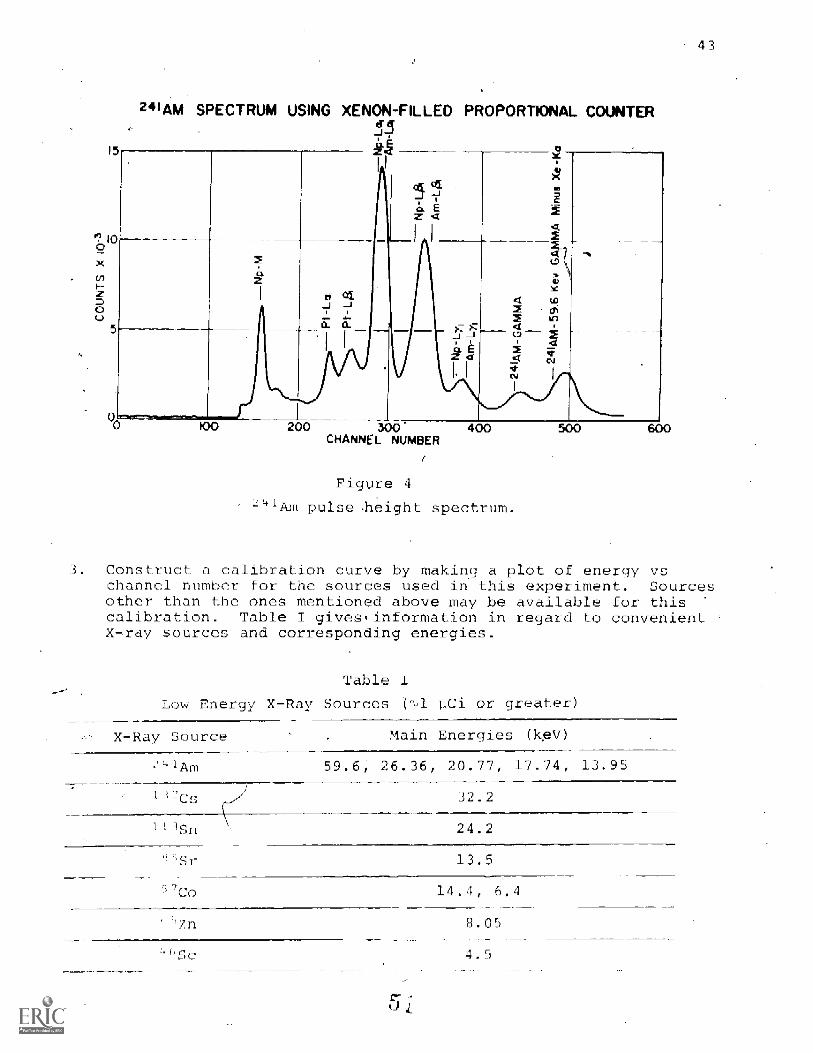
2. Accumulate a spectrum in the multichannel analyzer fera long enoleriod of time to get good statistics in the Ba Ka',group.Readout the multichannel analyzer and replace the 1'37Cs sourcewith the 10 pCi 57Co source. Accumulate for a pgribd of timelong enough to get good statistics under the 6.4-keV line.Readout the multichannel analyzer. Repeat this-same procedUrefor z41Am" Ficure 3 shows a typical -roportional counter A
spectrum for Co. Figure 4 shows lAm- with xenon filledproportional counter.
AL COUNTER X -i AY CTRUM FROM Co5
Figure 3
Proportional counter spectrum for =7Co.
C
43
241AM SPECTRUM USING XENON-FILLED PROPORTIONAL COUNTER
200 300CHANNEL NUMBER
Figure 4
'-=41Am pulse ,height pectrum.
Construct a calibration curve by making a plot of energy vschannel number for the sources used in this experiment. Sourcesother than the ones mentioned above may be available for thiscalibration. Table I gives' information in regard to convenientX -ray sources and corresponding energies.
Table
Low Energy X-Ray Sources ('l wCi or greater)
X-Ray Source
1 Am
Main Energies (kpV)
59.6, 26.36, 20.77, 17.74, 13.95
11 1Sn
Sr
32.2
24.2
13.5
C 14.4, 6.4
8.05
4.5
44
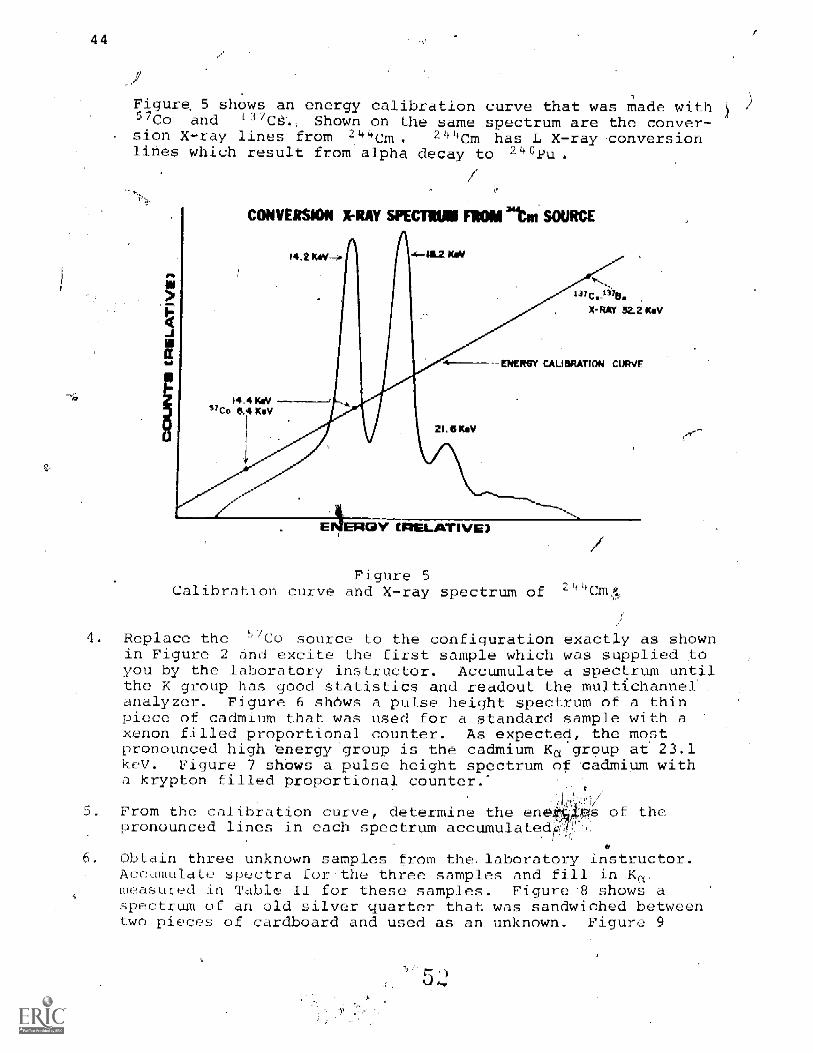
Figure 5 shOws an energy calibration curve that was made with57Co and 137C S' Shown on the same spectrum are the conver-sion X-ray lines from 2 4 4cm 2 4 4cm has L X-ray conversionlihes which result from alpha decay to 2 0 pu
Figure 5Calibration curve and X-ray spectrum of 44
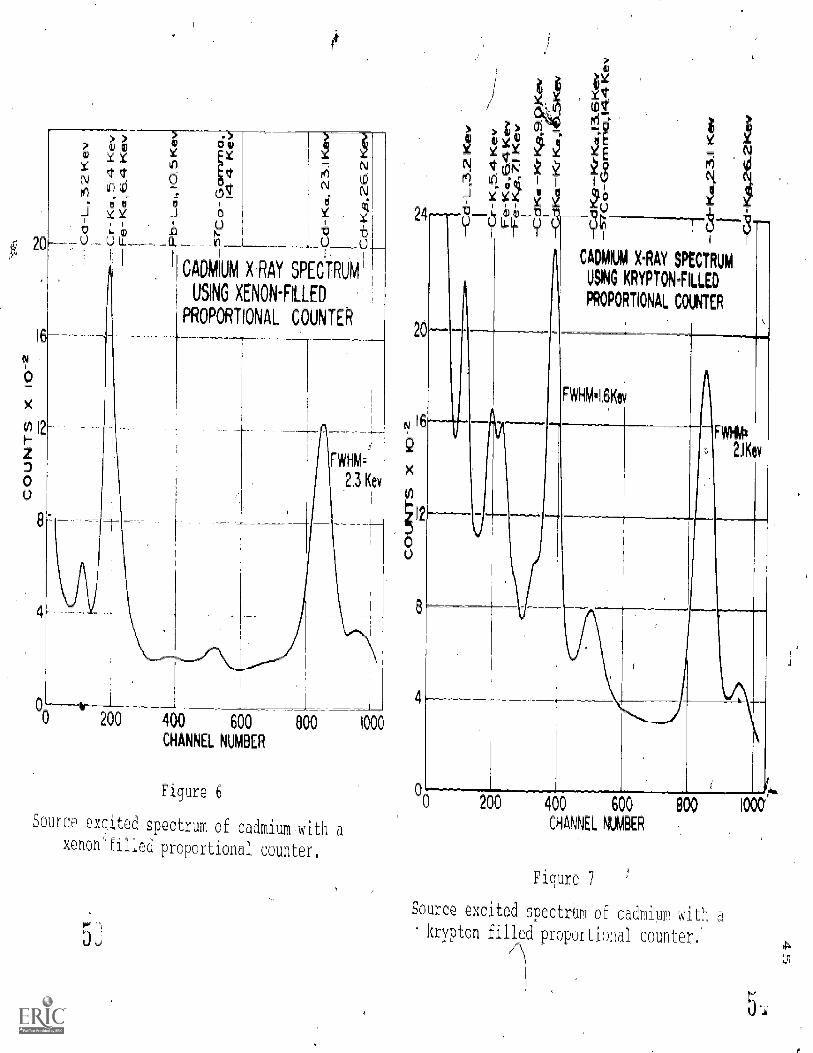
4 Replace the "Co5 source to the configuration exactly as shownin Figure 2 and excite the first sample which was supplied toyou by the laboratory instructor. Accumulate a spectrum untilthe K group has good statistics and readout the multichannelanalyzer. Figure 6 shows a pulse height spectrum of a thinpiece of cadmium that was used for a standard sample with axenon filled proportional counter. As expected, the mostpronounced high energy group is the cadmium Ku group at 23.1keV. Figure 7 shows a pulse height spectrum of cadmium witha krypton filled proportional counter.-
From the calibration curve, determine the en s of thepronounced lines in each spectrum accumulated
, 1
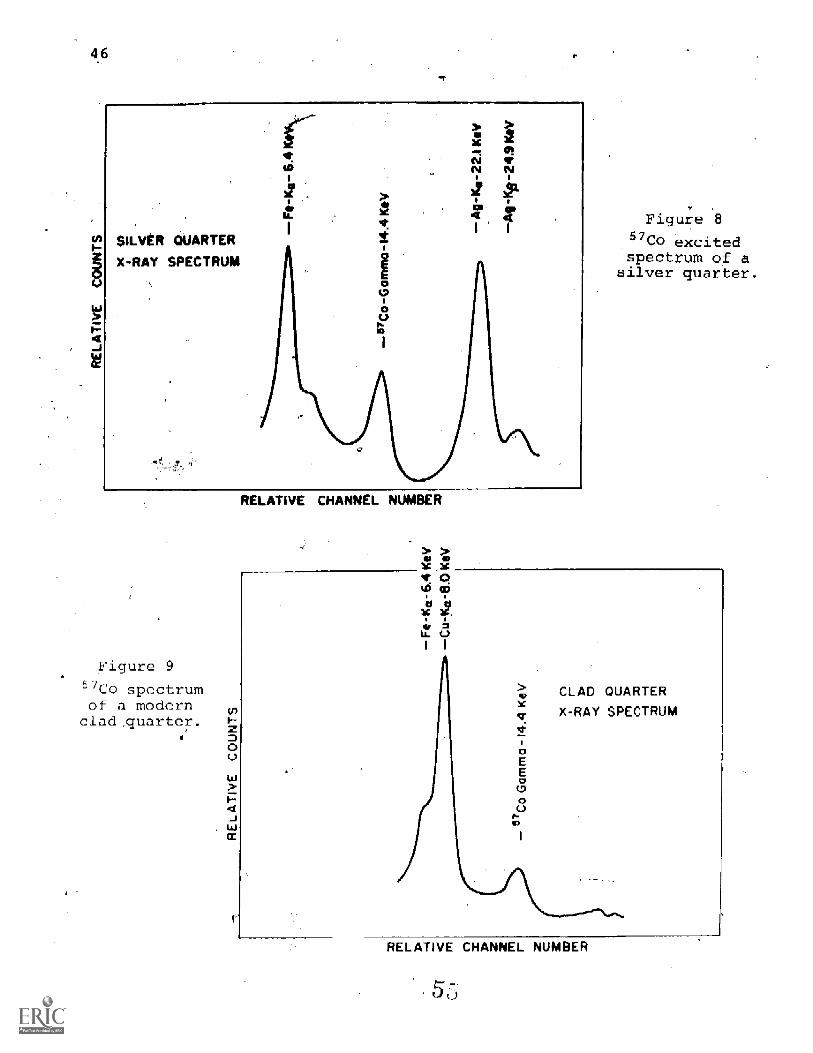
Obtain three unknown samples from the,laboratory instructor.Accumulate spectra foi-the three samples and fill in KA,measured in TzcblF II for these samples. Figure 8 shows aspectrum of an old silver quarter that was sandwiched betweentwo pieces of cardboard and used as an unknown. Figure 9
20
,- >Q OV
0 Y Y Y EYY 0
6
i
. Ut b
If)
N
V
CADMIUM X-RAY SPECTRUM
USING XENON-FILLED
PROPORTIONAL COUNTER
012[-2jU
Nal=2.3 Key
200 400 600 800 1000
CHANNEL NUMBER
Figure 6
Source excite spectrum of cadmium with a
xenon filled proportional counter.
DJ
24
0
N6
2
12
4
CADMIUM X-RAY SPECTRUM
USING KRYPTON.FILLED
PROPORTIONAL COUNTER
FV1HMil6Kov
FW1411.
2,1K v
200 400 600
CHANNEL NUMBER
Figure 7
Source excited spectrum of cadmium witl a
'krypton filled proportional counter.
Lfl
46
1Lu
SILVER QUARTER
X-RAY SPECTRUM
21.
Xfw
Figure 9
57Co spectrumof a modernclad,quarter.
0
RELATIVE CHANNEL NUMBER
Figure 8
57C0 excitedspectrum of a
silver quarter.
-j
CLAD QUARTER
X-RAY SPECTRUM
RELATIVE CHANNEL NU BER

47
Table II
Tabulation of Theoretical and Measured Energies (key)for Proportional Counter X-Ray Spectra
Sample Ka Theory Ka.measured-- --E(Xq Escape)ap- e)
Theory(Ka scape)MeaSured
Copper 8.041
Zirconium 15.746
Palladium 21.123
CadMium 23.109
Silver 22.104
Molybdenum 17.443
Unknown A
Unknown B
Unknown C
shows a spectrum of a modern clad quarter that was given- asan unknown in the same type of cardboard configuration.
Fill in the measured energies in Table II for the samples thatyou have studied. Note that the entry in Table II marked Kutheory is the weighted average of Kai and }<c2. The resolutionof the gas filled proportional counter does not allowsepara-tion of Kai and Ka2 for the elements listed; and, hence, theaverage value is used. The position of the escape peaks and-other features of the spectrum will be discussed later inthis experiment.
In the figures that are shown in this laboratory report, xenonand krypton filled proportional counters are used. There isa problem inherent with proportional counters associated withtheir construction. This problem is mainly one of efficiencyin regard to generating an output pulse at the full X-rayenergy.
In general, pulses will be produced at incident energies ofand E0 E1, where E0 is the incident X-ray energy and E1 isthe escape energy of the Kci X ray, associated with the countinggas. In the proportional counter an X ray comes in and makes
48
a photoelectric interaction with, say for example, a krypton,atom in.a krypton filled proportional counter. The propor-tional counter:generates an output pulse whose magnitude iscomposed of several parts. These are:
P =A+B-1- C
where P magnitude of the electrical pulse generated from theproportional counter,
A = the energy of the recoil electron produced by theinitial photoelectric interaction,
B = the energy of the X ray produced as a result of the. vacancy in the K shell of the krypton atom, and
= the total energies of other X rays and Auger electronsproduced in the resulting rearrangement of the kryptonatom.
If the X ray B which is the Ka X ray for krypton (12.630 key)is'captured in the proportional counter, the pulse P willgenerally be the full energy pulse; and, hence, proportionalto the incident X ray. (In this discussion it is assumed thatthe initial .X-ray, energy from the source is high enough toremove the K electron from krypton.) .It is possible, however,that the krypton. X-ray energy B will escape from the counter.If this happenS, the pulse generated will have an energyP = A C, which is'the incident energy of the X ray minusthe Ka X-ray energy for krypton.
Figure 7 is an excellent example of this phenomenon. The linesthat we see are the cadmium Ka line at 23.1 keV and the escapeline which corresponds to the cadmium Ka energy minus the Kaline from kryptonenergy, which giveS a peak at 10.5 keV. Thecadmium La line at keV doesn't suffer from the above prob-lem since the L X rays which would produce the problem with Lspectra are so low in energy that they are usually captured.
Figure 6 shows the same cadmium Ka line measured with a xenonfilled proportional counter. The escape peak is not presentsince the initial X-ray energy is not great enough to producea vacancy in the K shell of the xenon atom. The interactionswere in the L shell of xenon; and, hence, no K escape peak.The chromium peak shown in Figure 6 results from the iron andchromium bricks that were used to shield the 5700 excitationsource.' The 57Co 14.4 keV gamma line shown in Figures 8 and 9are from, oherent scattering in the sample.

49
Data Reduction
Exercise (a)
From the calibration curve plotted in PrOcedure 3, determinethe resolution of the proportional counter for the 6.4, arld14.4keV lines from 57Co and for the 32.2 key Ka line from Ba-137;
Exercise (b)
Identify the escape peaks in the spectra and tabulate (Ka-Escape)in Table II. Fill in the measured and theoretical values for columns=4 and 5 in Table II.
Exercise (c) (optional)
Obtain an unknown radioactive source from the instructor anddetermine the energies of its X rays. Are there escape peaks?What is the source?
Exercise (d) (optional)
Obtain standard radioactive sources whose activities are knownfrom the instructor. These might be any of the sources listed inTable I. Place the first source at a distance of 3 cm from theface of the detector and count for a period of time long enoughto get 4000 counts under the Ka group of interest. Readout thespectrum and sum under the Ka group. Continue for the othersources provided by the instructor. Fill in the entries in dataTable III,
Table III
Efficiency Measurement for a Proportional Counter
SourceEnergy(keV)
Photons/secTheory
Photons/secMeasured
E%Efficiency
5.4
5,7 CO 14.3
"Zri 8.05
13.5
kThe theoretical photons/sec listed in-column.3 is the value-obtained from the standard,activity printed on the source. Themeasured..ph?tons/sec is determined by dividing- the. under the-Ka group by the time in, seconds. The efficiency is determined
-.by taking the ratio of measured activity to theoretical activity.Usually this value is put in percent by multiplying by 100. Plota curve of efficiency, c, versus energy.
Post-Test
3.1 Eplain single escape and double escape peaks. sometimes foundin gamma-4ray energy spectra.
3.2 What is an Auger electr8h?
Computer Programs
The programs GAUSS-6 and LINEAR-6 in the Appendix of thismanual can be used to find the centroids of the peaks in the pro-portional counter spectra. The program LINEAR-6'will also givethe slope of the calibration curve which is used in 'the resolutionmeasurement.
Additional References
1. G. L. Clark, The Entyclopedia of X-Rays and Rays, ReinholdPublishing Co, New York, 1963.
2. J. C. Russ, Elemental_X-Ray Analysis of Materials, availablefrom EDAX International, Inc., 4509 Creedore Road, Raleigh,North C: -lina ($5).
R. Wolds,d1, D. E. Porter, and R. S. Frankel, "The AnalyticX-Ray," Industrial Research Magazine (February 1971).
4. C. M. Lederer, J. M. Hollander, and 1. Perlman, Table ofIsotopes, 6th edition, Wiley & Co., New York, 1967.

Experiment 4
Source Excited X-Ra- FluorescenceEnvironmental and C oo ernic l les
(Si Li) detector)
51
Objective,
To study theapplications of source-excited X-ray fluorescenceto _environmental samples and- geochemical specimens; to study theeffectiveness of various excitation sources in stimulating Kfluorescence for different ranges of elements;to calibrate asi(Li) detector using standard sources and with this calibrationcurve- to-determine-the unkhown,elemental composition of the environ-mental and geochemical samplesp to investigate the qualitative andquantitative sensitivities ofthe method.-
References
1., J. R. Rhodes, et al., Proceedings of the S os um on Low EnergyX-Ra- and Gamma Sources and A lications, i1. S.A.E.C. ReportORNL-11C-5, 1965.
2. F. S. Goulding and 3, M. Jaklevic, "Trace Element Analysis byX-Ray Fluorescence," UCRL- 20625, UC-4 Chemist T1D-4500 (57th
- -edition) transmissionreports a siMilar echnique using a n anodetube.
J. C. Russ, Elemental X-Ray_12.nalyisis of Materials, availablefrom EDAX Inter,ational, Inc., 4509 Creedmoore Road, Raleigh,North Carolina ,$5).
R. D. Giauque and J. M Jaklevic, "Rapid Quantative Analysis,by X-Ray Spectrometry," ladKagELnIIIAK22_is, Vol. 15,'Plenum Press, New York, 1972, 266.
5. R. Woldseth, D. E. Porter, and R. S. Frankel, "The AnalyticX-Ray," Industrial Research maataE (February 1971).
6. F. S. Goulding and Y. Stone, "semiconductor Radiation DetectoScience, 170, 280 (October 1970).
Introduction
It will be assumed that the student is familiar with the basicoperations of the Si(Li) detector. X-ray fluorescence with a Si(Li)detector has wide applicability for "trace analysis" in the fieldsof biology, chemistry, physics, geology industrial problems, andthe whole complex field of pollution analysis. Under the best ofconditions at this point in time, the technique is sensitive to
52
approximately one part in a million.. The technique; therefore,doesn't even compete in sensitivity with neutron activation analyis which is sensitive for Many elements down to, theHnanogram.reion.
What it does offer, however, is speed. It is possible to deteImine,.as you will see, as many as twenty'elements simultaneously from somesamples in a time per,iodas short, as ten Minutes. If you will takea piece of ordinary filter paper and place it-over the' hose of avacuum gleaner and let the machine run for two hours in a metro-politan area, you will quickly convince yourself that, for somesamples, nanogram sensitivities are not necessary..
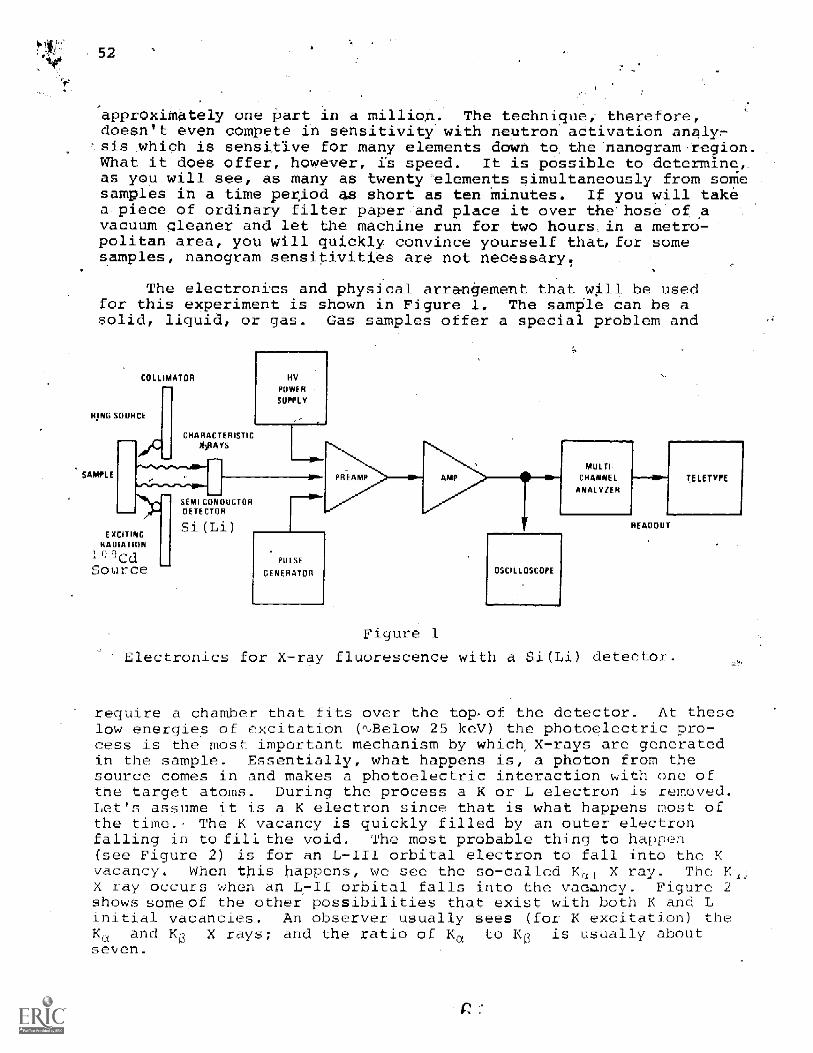
The electronics and physical arrangement that will be usedfor this experiment is shown in Figure 1. The sample can be a_solid, liquid, or gas. Gas samples offer a special problem and
COLLIMATOR
RING SOURCE
SAMPLE
CHARACTERISTICRAYS
HV
POWERSUPPLY
MULTI
CHANNEL
ANALYZER
EXCITINGRADIATION
I"CdSource
SEMI,CONOUCTOROETECTEIR
OSCILLOSCOPE
READOU1
TE MITE
Figure 1
Electronics for X-ray fluorescence with a Si(Li) detector.
require a chamber that fits over the top,of the detector. At theselow energies of excitation (%Below 25 key) the photoelectric pro-cess is the most important mechanism by which X-rays are generatedin the sample. Essentially, what happens is, a photon from thesource comes in and makes a photoelectric interaction with one ofthe target atoms. During the process a K or L electron is removed.Let's assume it is a K electron since that is what happens most ofthe time. The K vacancy is quickly filled by an outer electronfalling in to fill the void. The most probable thing to happen(see Figure 2) is for an L-III orbital electron to fall into the Kvacancy. When this happens, we see the so-called Kil X ray. The KX ray occurs when an L-II orbital falls into the vaoncy. Figure 2shows some of the other possibilities that exist with both K and Linitial vacancies. An observer usually sees (for K excitation) theKu and X rays; and the ratio of Krt to K is usually aboutseven.
K X-RAYS4
ONENIMMIEWIMIUMINEMMAIMIIMIIIMINZII
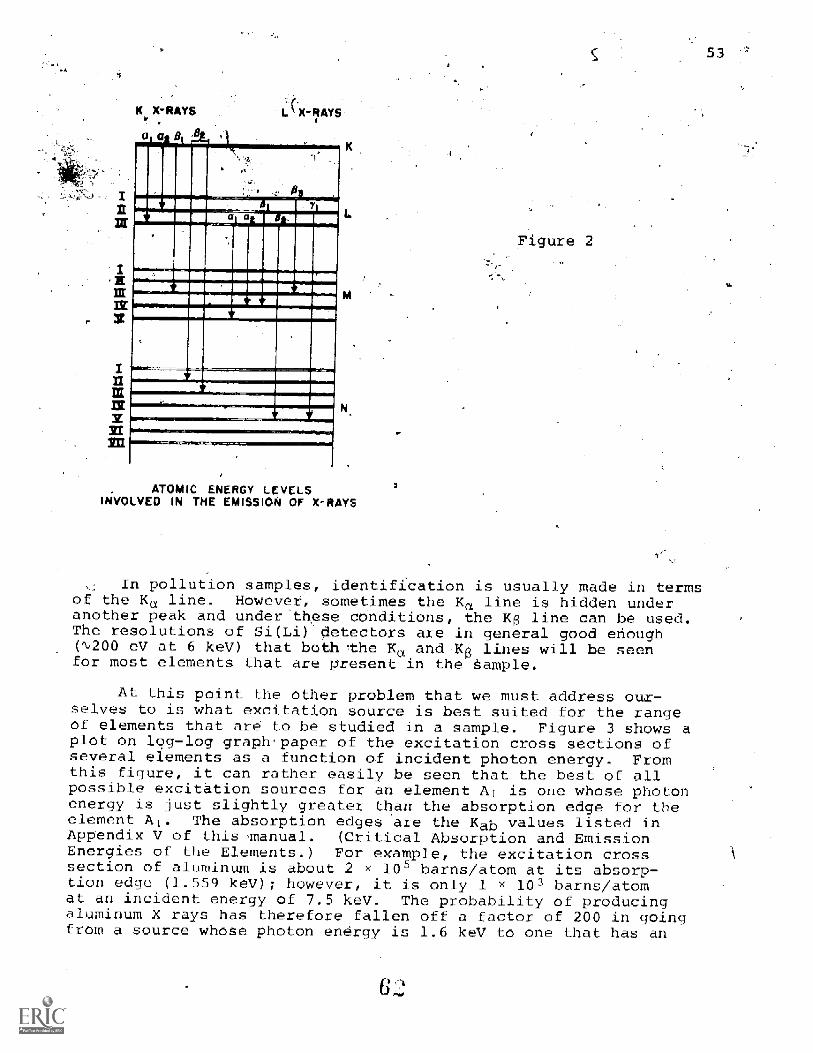
ATOMIC ENERGY LEVELSINVOLVED IN THE EMISSION OF X-RAYS
Figure 2
In pollution samples, identification is usually made in termsof the Ka line. However, sometimes the Ka line is hidden underanother peak and under these conditions, the 14 line can be usedThe resolutions of Si(Li) detectors are in general good enough( ,200 eV at 6 keV) that both the Ku and-K(3 lines will be seenfor most elements that are present in the Sample.
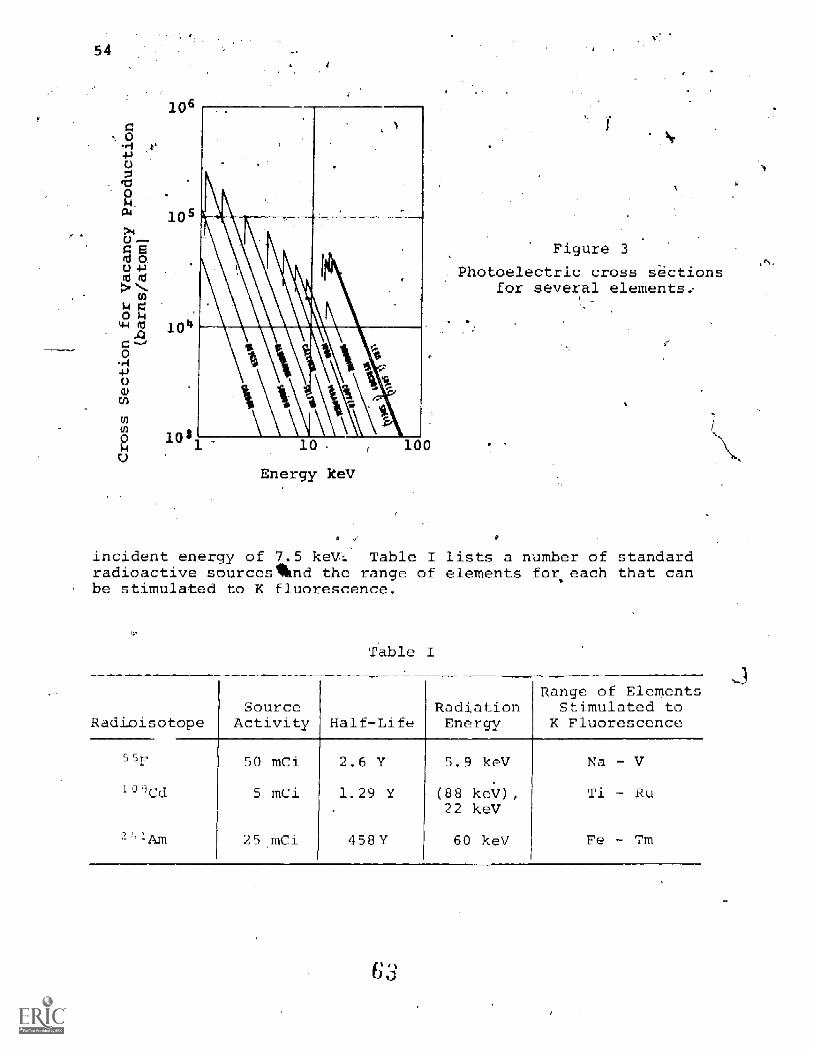
At this point the other problem that we must address our-selves to is what excitation source is best suited for the rangeof elements that are to be studied in a sample. Figure 3 shows aplot on log-log graph paper of the excitation cross sections ofseveral elements as a function of incident photon energy. Fromthis figure, it can rather easily be seen that the best of allpossible excitation sources for an element Ai is one whose photonenergy is just.slightly greater than the absorption edge for theelement Al. The absorption edges are the Kab values listed inAppendix V of this manual. (Critical Absorption and EmissionEnergies of the Elements.) For example, the excitation crosssection of aluminum is about 2 x l0 barns/atom at its absorp-tionedge (1.559 keV); however, it is only 1 x 10 barns/atomat an incident energy of 7.5 key. The probability of producingaluminum X rays has therefore fallen off a factor of 200 in goingfrom a source whose photon energy is 1.6 keV to one that has an
54
Energy keV
Figure 3
. Photoelectric cross sectionsfor several elements
incident energy of 7.5 keV Table l lists a number of standardradioactive sourcesiknd the range of elements for. each that canbe stimulated to K fluorescence.
Table I
Radloiso
55F
1 9ed
2
opeSource
Activity Half-LifeRadiationEnergy
Range of ElementsStimulated toK Fluorescence
50 mCi 2.6 Y 5.9 keV Ida - V
5 mCi 1.29 1 (88 keV),22 keV
- Ru
25 mCi 4581 50 key Fe - 'gym
Eqpipment
1. Lithium Drifted Silicqn X-Ray Detector and Pre-amplifier(resolution 200 eV)
2. DetectorBias-Supply
Low Noise Spectroscopy Amplifier
Multichannel Analyzer (,500 channels)
25 mci 109Cd (excitation source)
25 mei ,Fe (excitation source)
50 mei 2'1Am(excitation source)
55
8. Calibration Sources as follows (all should be standard sou;ces±10% activity):
a) 10 oCi 57Cob) 1 UCi 241Amc) 10] oCi 541tin'
d) 10 'ICJ_ 51Cr
9 Environmental and Geological, etc., Samples to be Studied.
Procedure
1. Set up the electronics as shown in Figure 1. Set-the biasvoltage to the value recommended by the detector manufacturer.Place the 10 oCi 57C0 source at exactly the location wherethe samples will beunder-fluorescing conditions (note the109Cd excitatNpn source has been removed for this part ofthe experiment)., Adjust the gain of the system so that the14,36 keV peak is about mid-scale qon your analyzer. Figure 4shows how this would look on a 400 channel analyzer. Thesystem is now roughly calibrated for 28 keV full scale. Accu-mulate a timed spectrum for a period of time long enough toobtain 'A,2000 total counts under the 14.36 keV group. Readoutthe multichannel and erase.
Place the 1 iCi 241Am source at the same distance as in 1 andaccumulate a spectrum for a long enough period of time' to getgood statistics in all of the pronounced 141Am peaks. Repeatthe same timed measurement for the -)4Mn and 'Cr° sources.From the multichannel readouts, fill in the peak channelinformation in Table 11.
Remove the calibration source and place the first environmentalsample to be studied in the sample holder. Place the 1o9cdexcitation source in its proper position. Fluoresce the sample
Equipment
1. Lithium Drifted Silicoji x-Ray Detector and Pre-amplifier(resolution 4200 eV)
2. DetectorBias-Supply
3. ,Low Noise Spectroscopy Amplifier
4. Multichannel Analyzer (500 channels)
25 mCi 109cd (excitation source)
25 mCi 55fe (excitation source)
50 mCi 241Am(excitation source)
8. Calibration Sources as follows (all should be standard souses±10% activity
a) 10 pCi 57Cob) 1 pci 241Amc) 10J pCi 54Mn'd) 10 iCi 51Cr
9 Environmental and Geological, etc., Samples to be Studied.
Procedure
1. Set up the electronics as shown in Figure 1. Set-the biasvoltage to the value recommended by the detector manufacturer.Place the 10 iCi 57C0 source at exactly the location wherethe samples will be under- fluorescing conditions (note the'09Cd excitatIon source has been removed for this part ofthe experiment)., Adjust the gain of the system so that the14,36 keV peak is about mid-scale in your analyzer. Figure 4shows how this would look on a 400 channel analyzer. Thesystem is now roughly calibrated for 28 keV full scale. Accu-mulate a timed spectrum for a period of time long enough toobtain 1,2000 total counts under the 14.36 keV group. Readoutthe multichannel and erase.
2. Place the 1 pCi 241Am source at the same distance as in 1 andaccumulate a spectrum for a long enough period of time' to getgood statistics in all of the pronounced 141Am peaks. Repeatthe same timed measurement for the -)4Mn and °1Cr sources.From the multichahnel readouts, fill in the peak channelinformation in Table 11.
Remove the calibration source and place the first environmentalsample to be studied in the sample holder. Place the lo9cdexcitation source in its proper position. Fluoresce the sample

57
for a eriod oftime long enough to obtain reasonable statisticsin the peaks of interest. Figure 5, for example,shows dirtsample at was taken near a busy road. Readout the multichannel.Repeat .r other environmental or chemical samples. Be sure torun loi enough for each .sample to get good statistics under,the s of interest.--
LAB. READ DIRT, XRF C 9109 BXCITfD
Ca
Figure 5
X-ray fluorescence of a dirt sampletaken near a busy road.
4. In order to determine the number of milligrams of a .givenelement in the sample, it is frequently convenient to comparethat X-ray line to a standard of a similar matrix which thestudent prepares in the chemistry laboratory. For example,Figure 6 shows a plot of K X-ray, counts per minute per 1%element in the matrix. The sample used could be consideredinfinitely thick thpr this application. The matrix used wasCaCO3. Figures 7 and 8 show spectra of a lead standard thatwas prepared by coprecipitating lead with calcium (CaC204).The lead concentrations were then determined by atomicabsorption.

Cd-109 X-Ray Fluo scenceCalibration
8 10 12 14
Xk
Erfergy (KeV)Xk (KeV)
6
CPM/1% concentration of the
element in the matrix.
16
PbCALIBEATION,Ce204Metrix3=7.4Den.2.2,Cd409 Excited
Pb1,010,549KeV
500 bon
Figure 7
1500
, Standardization curve made with Pb L.

2.0
%PB1.0
0.5
Pb CALIBRATION, CaC204 MATRIX
Z..7.4, Den. 2.2 909 ExCited
o12.61,1 KeV
J
TARCET of 500 mg: 100 mg/c-
500
CPM
1000 1500
Figure 8
Standardization curvemade with Pb Ln.
p
59
5. Remove the 109cd source and place the -"re source in theexcitation source position. Fluoresceteach of the same environ-menal samples with 55re. Remember "re is goo& for elementsfrom sodium up to vanadium. Accumulate each spectrum for aperiod of time long enough to obtain reasonable statistics'inthe peaks of interest. For example, Figure 9 shows ordinarycigarette- ash that has been fluoresced._ with 55re. If avacuum-chamber is available for exciting samples with 55Fe5in vacuum, a profound effect can be observed because of theattenuation offered by the air. Also the argon Ko line fromair will show up for samples studied in air. To illustratethis point, Figure 10 shoWs a silicon sample that was fluorescedfor 20 minutes in air. (Note the argon line from air.)Figure 11 shows the same data taken under vacuum conditions.
Data ReduOtion
Exercise4
From the data in Table II, plot an energy versus channel numbercurve for 57Co, 5 4mn 2 41Am and "Cr.' Figure 12 Shows a similarcurve that was taken for K lines in this same energy calibrationrange.
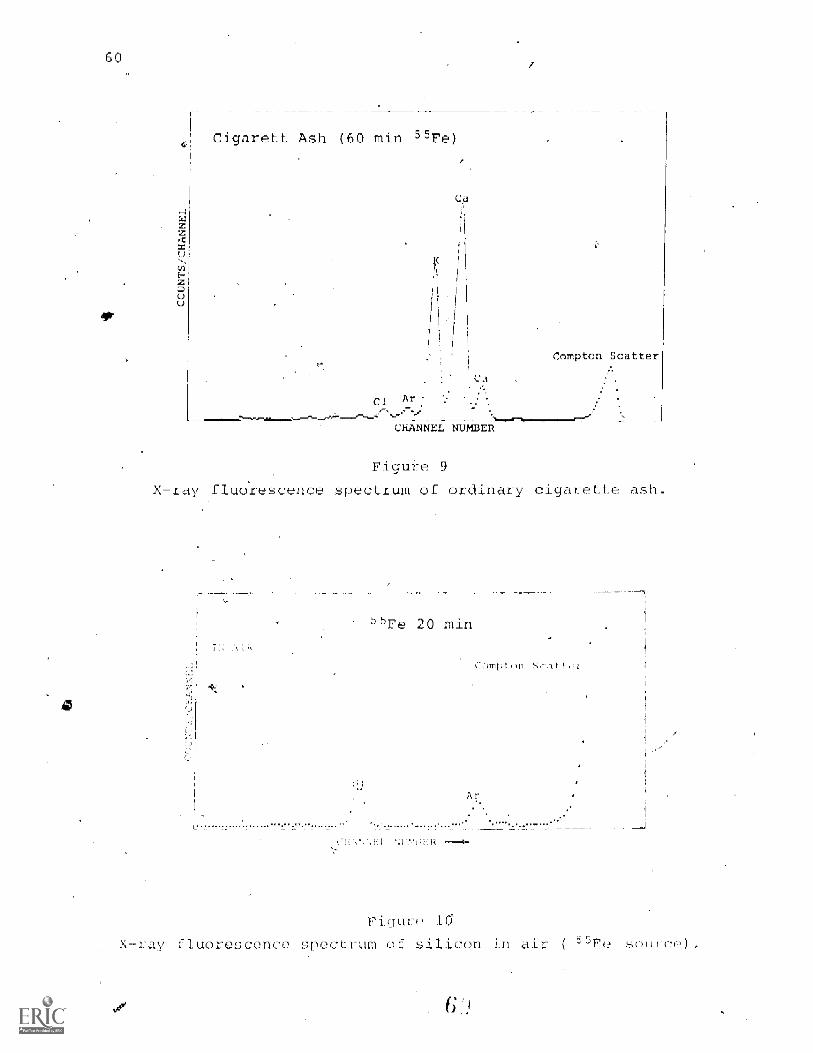
60
Cigarett Ash (60 min 55Fe)
Figure 9
-ray fluorescence spectrum of ordinary
....... . . . s
ay 11 eresc(__!r
55Fe 20 min
Comp Scatter
garette ash=
ri(jare
of licon air SOUrc0

Cr)
0
55Fe 20 min
IN VACUO
Si
CHANNEL
Eigure'12
Energy calibrationcurve for a Si(Li)
detector.0.
UI
20
10
Compton Scat ter
61_
Figure 11
X-ray fluorescence ofsilicon invacuua.
0 Experimental Pqir
Slcpe.51 67eV/enannie 1
I
100 00 300 350
CHANNEL NUMBER
Determine the slope of the calibration curve and measure theresolution of the °ICr, 54M n, and 57Co lines in Table TT.
Exercise (b)
For each line. in Table II, sum under the peak of interest andide by the corresponding time to obtain the measured photons/sec
en.y.in Table TT. From the decay schemes for the isotopes usedanc the absolute disintegration rates tabulated for these standardsoUrces, calculate the theoretical number of photons/sec for each

62
line in Table II. (Note, in Appendix IV of this manual, there isa tabulation of the latest photon decay information for some of the i
more commonly used X-ray and gamma calibration sources.; The abso-lute efficiency for the detector is defined as the measured photons/sec divided by the actual number of photons/sec that the source emit-(Be sure-to make any necessary half-life corrections required oncalibration sources.) This quantity is called Calculatefor the values in Table II. Plot a curve of efficiency versus energyfor the detector. Figure 13 shows a similar curve for a silicondetector and various window thicknesses. Since you are not correct-in;; our data for geometry and the one over R2 intensity fall off,your maximum efficiency will probably be about 10%. You can convertyour data to a curve similar to Figure 13 if you make the necessarycorrections.
124!00
0
tj 80
LI
60
r
z 000
20IJ
00 0m 01
ENERGY (ItaY)62 1 21 16 12.4 6 2.1 1.6 1.24
8.1NDOVIS
3 mm THICK61 DETECTOR
Ex, iiC ise (c)
0.13 mm(5 min
0.05 rnm_(2 m(l)
PECTRAL RESPONSE OF Si DETECTOR__ I L _t
0.2 0.4 0.6 0.8 I 2 4 6 8 10
WAVE LENGTH A)
Figure 13
Efficiency plot for a Si (Li) detector.
From Ltu cali1>r<1t ion Curve, identify the major peaks in yourenvif-rnmental or chemical samples for the 1"Cd excitation. If
f !r -;ample_, are thin and uniform, you may also wish to determinefhe amount of each oloment that is present; in your sample. Figuiy14 shown, a spectrum of a dried wafer sample that-, was taken at the
:it water: channel of to sower water treatment plant in Nashville.Since the sample was quite ttlin, quantitative information could

U
63
100
CHANNEL NUMBER
200
Figure 140
X-ray fluorescence spectrum of final treatment waterfrom a water treatment plant ( 109Ccl source) .
also have been extracted from the multichannel readout. Figure 15shows an air pollution sample that was obtained from the Air QualityControl Board in Nashville. Again since it w a thin sample, thetechniques discussed in Procedure 4 are applicable for extractingabsolute information in regard to the peaks.
Exercise (d)
Repeat Exercise c!) for all of the dat,, taken with your samplesand the J5Fe source. Figure 16 shows a thin sample of powderedcoal. Since' the sulfur component in coal seems to give the laTgestpollution problem at coal- -fire energy generation plants, this tech-nique offers a good method of monitoring sulfur content in coal.Figure 17 shows some fly ash that was collected from the Bull Runcoal-fire generating plant in Oak Ridge, Tennessee. Note the-silicon,potassiutml, and titanium is present in the sample

64
00
lad
Air Pollution Sample55Fe XR (20 min)
ca
71 0 oa'.
%.
CHANNEL NUMBER
Figure 15
X-ray fluorescencespectrum of anair pollution
filter.
ZOO
CHANNEL NUMBER
Figure 16
X-ray fluorescence spectrum of soft coal.
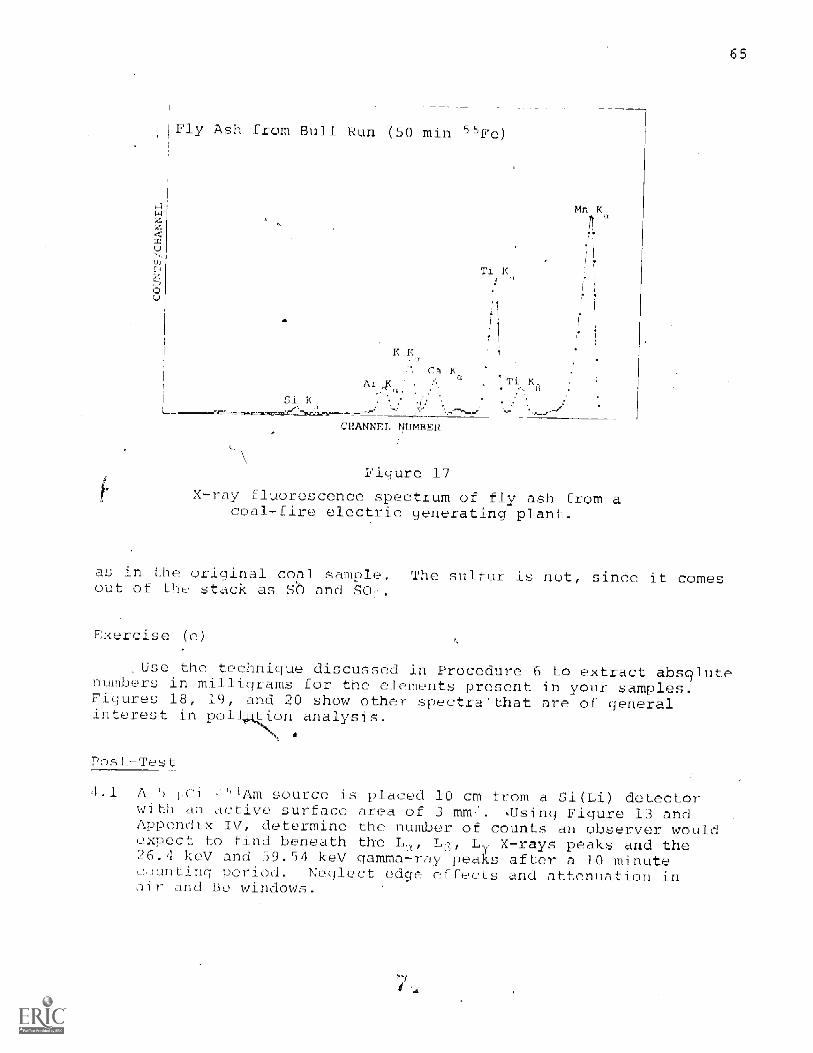
I Fl_y Ash from Bull Run (50 min "Fe)
K K
caAr
Si K
CHANNEL NUMBER
Mn K
Ti K
Ti K_
Figure 17
X-ray fluorescence spectrum of fly ash fromcoal-fire electric generating plant.
as in the original coal sample.out of the stack as So and SO,.
Exercise (o)
a
The sulfur is not, since it comes
Use the technique discussed in Procedure 6 to extract absOntenumbers in milligrams for the elements present in your samples.Figures 18, 19, and 20 show other spectra, that are of generalinterest in pollution analysis.
Post-Test
4. 1 A 5 oCi .''f !Am source iswith an active surfaceAppendix IV, determineexpect to find beneath26.4 key and 59.54 keyc,,uinting period.air and Be windows.
placed 10 cm from a Si(Li) detectorarea of 3 mm . ,Using Figure 13 andthe number of counts an observer wouldthe Lic, Ly X-rays peaks and thegamma-ray peaks after a 10'minute
r_cjlect edge effects and attenuation in

66
z
P,
0U
5000
4900
3000
2000
1000
0
Air Pollution109Cd XRF
qia
I
(20
V Mn
Samplemin)
Z nN :1
0 CL.1,1Fe . A
n
: '.Pb
!'\
Br
Aul:'7
' b.'..
B r
:
-;;
Sr-. Pb
.
S r
Figure 18
X-ray fluorescencespectrum of air
pollution filter( 109cd excitation
source).
et,
;
50 100 150 200 250CHANNEL NUMBER
Figure l9
X-ray fluoreScencespectrum otroxit
water fromtreatment plant
not( -,5Fe source).
til C
17n 2040
I \K
P 1 1
1 Ca ( K . ). I . .
A. e I.
1 I
Final Water Sample55Fe XRF (20 min)
M_n ( K
50 Iti NM
COUNTS ,/ CHANNEL
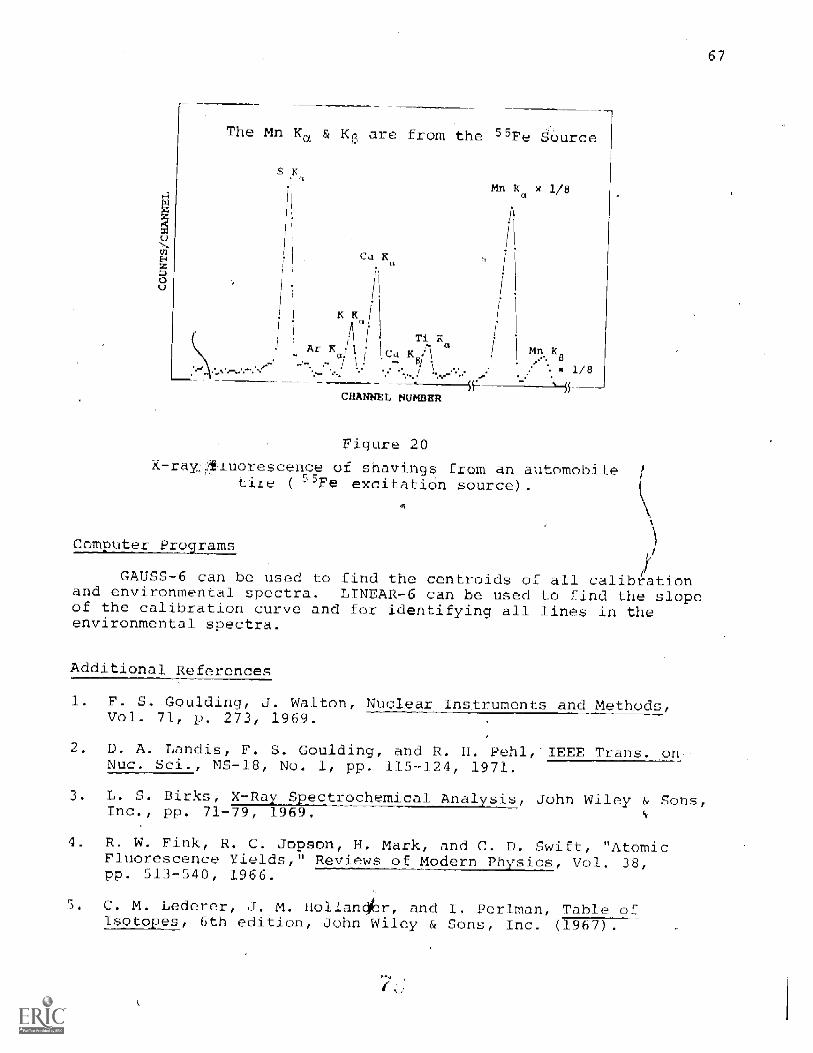
67
The Mn
S K
& K13 areae from the 55Fe SOurce-r
Ca K
it
CHANNEL NUMBER
Mn K x 1/8
Mn K
Figure 20
s-r _uerescence of shavings from an automobiletire 55Fe excitatiOn source) .
saaa-rET-0IJIL72Lml
GAUSS-6 can be used to find the centroids of all calibLtionand environmental spectra. LINEAR-6 can be used to find the slopeof the calibration curve and for identifying all lines in theenvironmental spectra.
Additional References
1. F. Goulding, J. Walton, Nuclear Instruments and Methods,Vol. 71, p. 273, 1969.
D. A. Landis, F. G. Goulding, and R. H. Pehl,"IEEE Trans. onNuc. Sci. , NS-18, No. 1, pp. 115-124, 1971.
L. S. Birks, /LR2LS:ectrcichealAnalsis, John Wiley & Sons,Inc., pp. 71-79, 1969. %
4. R. W. Fink, R. C. Jepson, H. Mark, and C. D. Swift, "AtomicFluorescence Yields," Reviews of Modern Physics, Vol. 38,pp. 513-540, 1966.
. C. M. Lederer, J. M. Hollan sr, and 1. Perlman, Table oIsotopes, 6th edition, John Wiley & Sons, Inc. (r9-67).
68
6. R. D. Giaugue, "A RadioiSotope Source Target Assembly forX-ray Spectrometry," Anal. Chem., Vol. 40, pp. 2075-2077,1968.

Ob'ective
Experiment 5
Element Anal sis of Pollution SamFluorescence with a Ge(Li) Detecto
To study the application of source excited X-ray fluorescencewith a Ge(Li) detector; to establish an efficiency curve for thisprocess; to investigate heavy element Z > 32 concentration inpollution and chemical samples.
References
1, R. Wbldseth, D. E. Porter, and R. S. Frankel, "The AnalyticX-Ray," Industrial Research112.1, February 1971.
J. C. Russ, Elemental X-Ray Anal of Materials, availablefrom EDAX International, Inc., 4509 CreedmooreNorth Carolina ($5).
Road, Raleigh,
R. D. Giauque and J. M. Jaklevic, "Rapid f uantative Analysisby X-Ray Spectrometry," Advances in X-Ra- Analysis, Vol. 15,Plenum Press, New York, 1972, p. 266.
4. L. S. Birks, ?i1RE§RestI2cIlemija4LalLLEL, John Wiley & Sons,1969, pp. 71-79._
In
In this experiment it will be assumed that the student isalready familiar with Ge(Li) detectors nd the techniques of basicX-ray fluorescence experiments. He mayalso wish to read the intro-.duction of Experiment 4 which is a rathr detailed cl4cussion ofsome of the parameters associated with X-ray fluoresCence. Most ofthe information in Experiment 4 is applicable in this experiment.
The main differences between the Si(Li) and Ge(Li) detectorsfor X-ray fluorescence are the efficiency End resolution. Ingeneral, Si(Li) devices have resolutions of 200 eV at 6 keV whileGe(Li) would show perhaps 350 eV at this energy. However, theGe(Li) devices are mach more efficient for photons in the energyrange from 30 to 100 keV than the Si(Li). The reason for thisimproved efficiency comes from the fact that photons at theseenergies usually interact by the photoelectric process. Thecross section For the photoelectric process varies like z'), where
is the atomic number. The Z for silicon is 14 and for germaniumit is 32. The ratio of these two numbers raised to thc. fifth poweris 62 22 which is roughly th'e ratio of the cross sections.
70
The arguments made in Experiment 4 about the cross section forexcitation being greatest just above the absorption edge are equallyvalid for samples that will be studied in this experiment. The onlydifference is that in general with Ge(Li) systems, one is interestedin higher Z elements in the sample; and, hence, the exciting sourcewill have a higher energy than the ones used for Si(Li) spectro-scopy. In this experiment, we are going to use 241Am and 57Coas excitation sources. For 41Am it will be the 59.6 keV gammathat does most of the excitations in our samples. In 57Co the122 keV line is the best candidate for excitation.
aillipment
1. Lithium Drifted Germanium X-Ray Detector with a Resolution'1,350 eV
Detector Bias Supply
3. Low Noise Spectroscopy Amplifier
4. Multichannel Analyzer 0=500 channels)
Excit Lion Sources as follows (license required)
a) 25 mCi ='41Amb) 25 mCi 57Co
6 Calibration Sources as follows:
a) 10 uCi 57C0 standard activity +10%b) 1 oCi y_41Am standard activity ±10%c) 5 -wCi 177Cs standard activity ±10%d) -1Ci 1"Cd standard activity 71:10%
7 Pollution or Chemical Samples to be Studied
Procedure
1. Set a the electronics as shown its Figure 1. Do hot put inthe Co source. The system firrst has to becalibrated.
Turn on the bias voltage to the detector and adjust it to tharecommended value.. Place the 1 standard source at theposition where the sample will be when fluorescing pollutionsamples. Adjust the gain of the system until the 59.6 keVlihu Flom 2'"Am falls about mid-scale on the analyzer.
0011ect a timed spectra for a period of time which is sufficto give reaS( le statistic's in the pronounced lines of =
shown in Tab Readout e multichannel.

CULIMIATO
mr SOLIRC1
SAMPL
SEMI CDNOUCTORCo DETECTOR
SourceExcluNG
RADIATION
CISOLLDSCOPE
-71
TELETYPE
READOUT
Figure 1
Electronics for X-ray fluorescence with a Ge (Li) detector.
Table I
,solute Calibration for a Cte Detector
Nur-lid:-Photon Energy
(keV)Peak
ChannelPhotons/secMeasured
Photons secCalculated Efficiency
'7ci, 6.40
=7Co 14.36
Co 122.0
o 136.3
1 = -C 32.191
irj'ca 87.70
'Cd 24.942
.'1Am 26.36
..
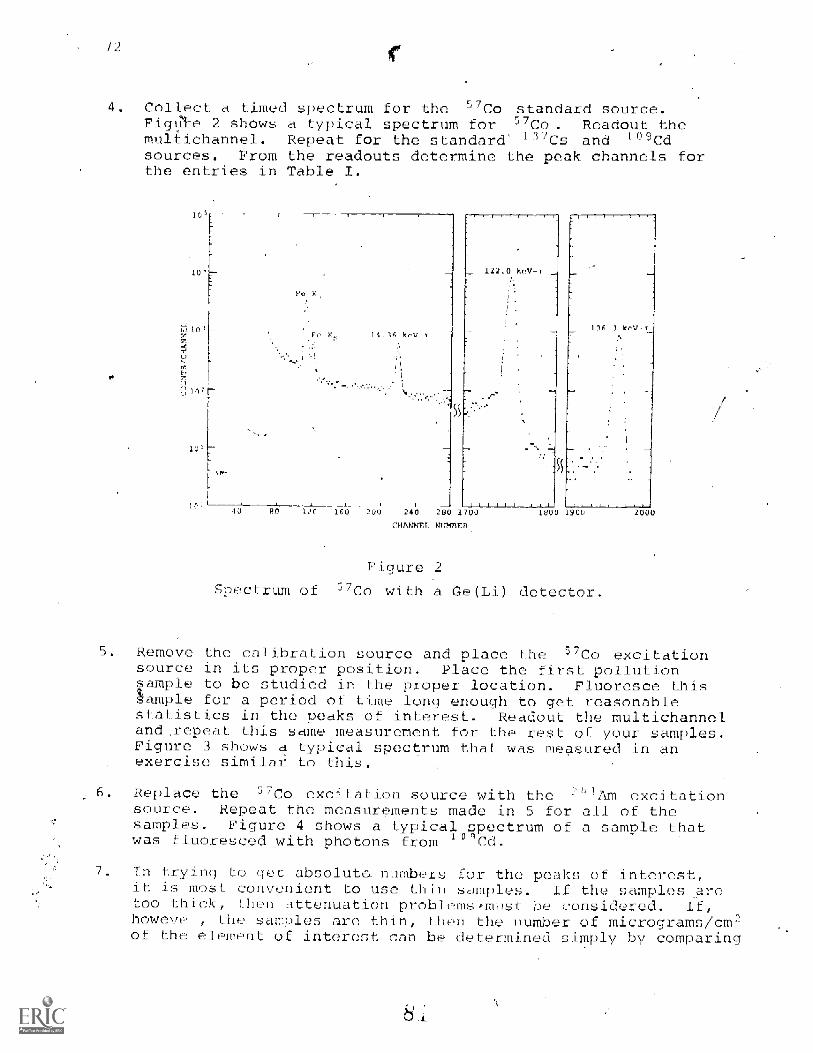
4 Collect a timed spectrum for the 5/Co standard source.Figq1e 2 shows a typical spectrum for 57Co. Readout themultichannel. Repeat for the standard' 137Cs and io9cdsources. From the readouts determine the peak channels forthe entries in Table T.
6
14.16 keV=y
122.0 k
1 I I. I I I _I_ J._120 100 200 240 200 1700 1000 1900 2000
CNANNEL NUMBER.
Figure 2
Spectrum of 57Co with a Ge( i) deter
5. Remove the calibration source and place the 57Co excitationsource in its proper position. Place the first pollutionsample to be studied in the proper location. Fluoresce this`ample for a period of time long enough to get reasonablestatistics in the peaks of interest. Readout the multichanneland.repeat this same measurement for the rest of your samples.Figure 3 shows a typical spectrum that was measured in anexercise similar to this.
Replace the 57Co excitation source with the41
excitationsource. Repeat the measurements made in 5 for all of thesamples. Figure 4 shows a typical spectrum of a sample thatwas fluoresced with photons from 1 o9cd.
7 In trying to absolute. numbers for the peaks of interest,it is most convenient to use thin samples. If the samples arctoo thick, then attenuation problems must be considered. If,howeve , the samples are thin, then the number of micrograms cm-of the element of interest can be determined simply by comparing
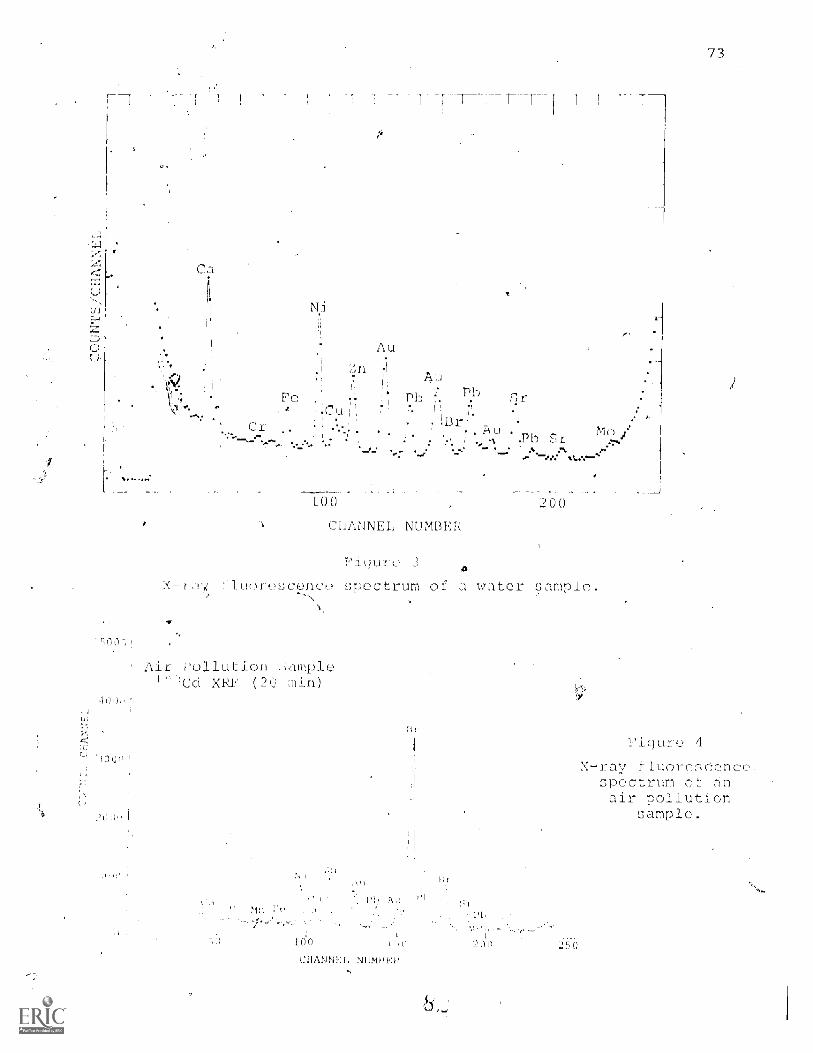
U
7, TT 7 T 7 --I-
El]r
100
CHANNEL NUMBEREN
X- = :Juoresco
Air Pollution c-linple
-jai X RP (2C min )
200
F i(jur 0 3
spectrum ot a wator sample.
73
Figure 4
X-ray fluortusConce-spectrum o2 anair pollution
sample.
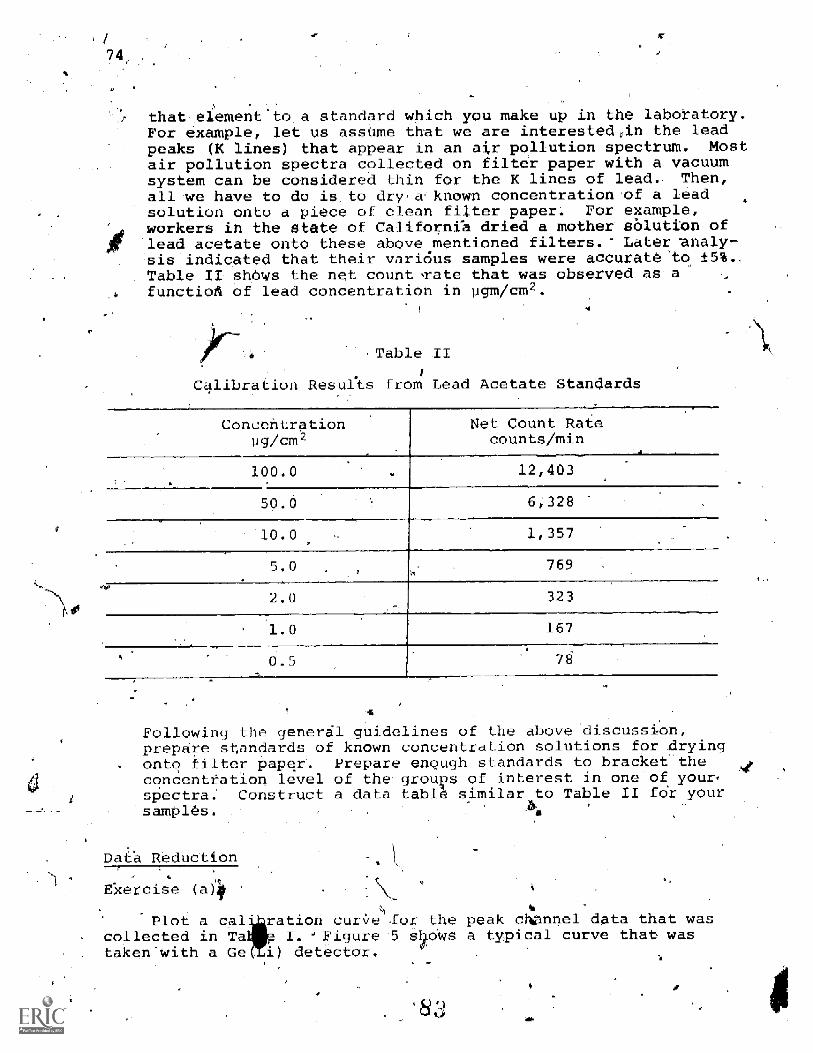
74,
that element to a standard which you make up in the laboratory.For example, let us assume that we are interested,in the leadpeaks (K lines) that appear in an air_ pollution spectrum. Mostair pollution spectra collected on filter paper with a vacuumsystem can be considered thin for the K lines of lead- Then,all we have to do is to dry, a known concentration 1pf a leadsolution onto a piece of clean filter paper. For example,workers in the state of California dried a mother,sblution ofjead.acetate onto these above mentioned filters.' Later:'analy-sis indicated that their various samples were accurate to ±5 %..
_Table II. ShOws the net count,rate that was observed as- afunctioft of lead concentration in pgm/cm2.
Table II
Calibration Results from Lead Acetate Standards
Concentrationug/cm2
Net Count Ratecounts/min.
100.0 12,403
50.0 6;328
10.0 1,357
5.0 769
2.0 323
1.0 167
0.5 78
A
Following the general guidelines of the above discussion,prepare standards of known concentration solutions for dryingonto filter paper. Prepare enough standards to bracket theconcentration level of the e-groups of interest in one of yourspectra. Construct a data table similar to Table II fdr yoursamples. -6
_
Data Reduction.
exercise (a)4
Plot a calcollected in Tataken'with a Ge
ation curVefor the peak chAnnel data that wasI. °Figure 5 sY oWs a typical curve that wasdetector.
win

106
50
0 Experime
Am-241 26=35
Ag-K 22.
natal
o 57
Ba -K5 36.3
a=K 32-19
25 . 5
14.36
Cd-109
Am-241_5 ,5
Slope
97.7
348 a \ /channel
__ 1 = 1 _ 1 _
100 200
CHANNEL NUMBER300
Figure 5
Calibration curve for Ge*(Li), detector.
Co 57122.0
From -the calibration curse, determine the slope of the lineand calculate the resolution of the following lines: 122 key57Co, 87.7 key 109Cd, and 59.57 241Am.
Exercise (b)
75
From the timed spectra collected in Procedures 3 acrd 4, deter-mine the sums under the peaks listed in Table I. Dividthese sumsby the proper times and thus determine the measured photens/secfor each of these standard sources., Enter these values in theirproper places in Table I.
Exercise
Calculate the number of photon /sec th t are emitted from eachof the standard sources in Table I. Sometimes this informiatim isprinted on the standard. If not, it can be determined from theactivity of the source and known information in rard teA\.the decaysch2me for that isotope. In the appendi>i.of- this manual is a tabu-lation'of certain disintegration data for many of the standardcalibration sources for X-ray and 'gamma-ray spectroscopy. Fill inthe calculated number of photons/sec-for each pf the entries inTable I.

76
Exercise (d)
The efficiency of the detector ( ) is the ratio/ of the measuredphotons/sec to the calculated photons /sec. Determine this numberfor your data and record the proper value for each of the entriesin Table 1. Plot a curve of E versus the photon energy in keV.
Exercise (e)
For each of your pollution samples, determine what-elementsare present in the sample fromyour calibration curve. Do this
for both 51Co and 241Am excitation.
Exercise (
Witi-o.your laboratory instructor's assistance, standardizesome of the peaks in accordance with the method outlined inProcedure 7.
Computer_ Programs
The centroids of allof e peaks measured in this experimentcan be found with the prt,gra _AUSS-6-. LINEAR-6 can be used toidentify what lines are present in 'ea- pollution spectra.
Additional Referencos
J. L. Cate, Jr.,, Determination' o` Lead in Air Sam le FiltersX -Ray Fluorescence, Lawrence Radiatibn Laboratory Chemistry
Report No. 'SID -4 5 0, UC-4, UCRL-51038,' Livermore, California94550.
W. H. McMaster, N. Kress, et al., University of California,Lawrence Livermore. Lab Report UCRL-50174, May 1969.
K. G. Carr-Brion and K. W. Payne, "X-Ray Fluorescence Analysis--A Review," The Analyst, Vol', 95, No. 1137, p. 977, 1970.
R. Giauque, "ASpectrometry,"No. UCRL-18292
Radioisotope Source-Target Assembly for X-RayLawrence Radiation Laboratory, Berkeley, Report1968.
77
Experiment 6
Tube Excited X-Ray Fluorescence
Objective
To.study the parameters associated with X-ray fluorescencemeasurements where the exciting photons are geneated with anX-ray tube; to determine an energy calibration curve with X raysof kAown energy produced.from a variety of elements; to usevthecalibration curve to determine.what unknown elements are presentin the pollution, environmental or biological samples; to stand-ardize measurements with known concentrations of the groups ofinterest.
References
1. F. S. Goulding and d, M. Jaklevic, "Trace Element Analysis byX-Ray Fluorescence," Lawrence Radiation Laboratory, Chemistry ,
Division, Livermore, California, Report No. UCRL-20625, TID -45p0.
2 R. D. Giauque and J. M. Jaklevic, "Rapid Quantative Analysisby X -Ray Spectrometry," University of California RadiationLaboratory, Livermore, California, Report No. LBL-204.
3. J. C. Russ, Euemental X-Ray Analysis of Materials, availablefrom EDAX International, Inc., 4509 Creedmore Road, Raleigh,North Carolina ($5).
4. R. Woidseth, D. E. Porter-and R. S. Frankel, "The AnalyticX-Ray," Industrial Research Ma azine, February 1971.
Introduction
In a few of the earlier experiments, we outlined the use ofsource excited %-ray fluorescence for problems such as pollutionanalysis and the. geochemical analysis of rock samples.` Under thevery best experimental conditions, source,excited X-ray measure-ments are good to one part in a million In other words, with thistechnique and under the best conditions, we can study microgramconcentration in gram samples. However, it was also pointed outthat for many applications this kind of sensitivity is adequate.In general, tube excited X-ray fluorescence is about a factor often better. # .
The systems that have been- manufactured specifically for thisapplication are in general designed to maximize this sensitivity.
In this discussion there is not time to go into the varioussystems and their operational parameters. This information can beobtained by reading References 1-4. In particular, Refekence 1 is
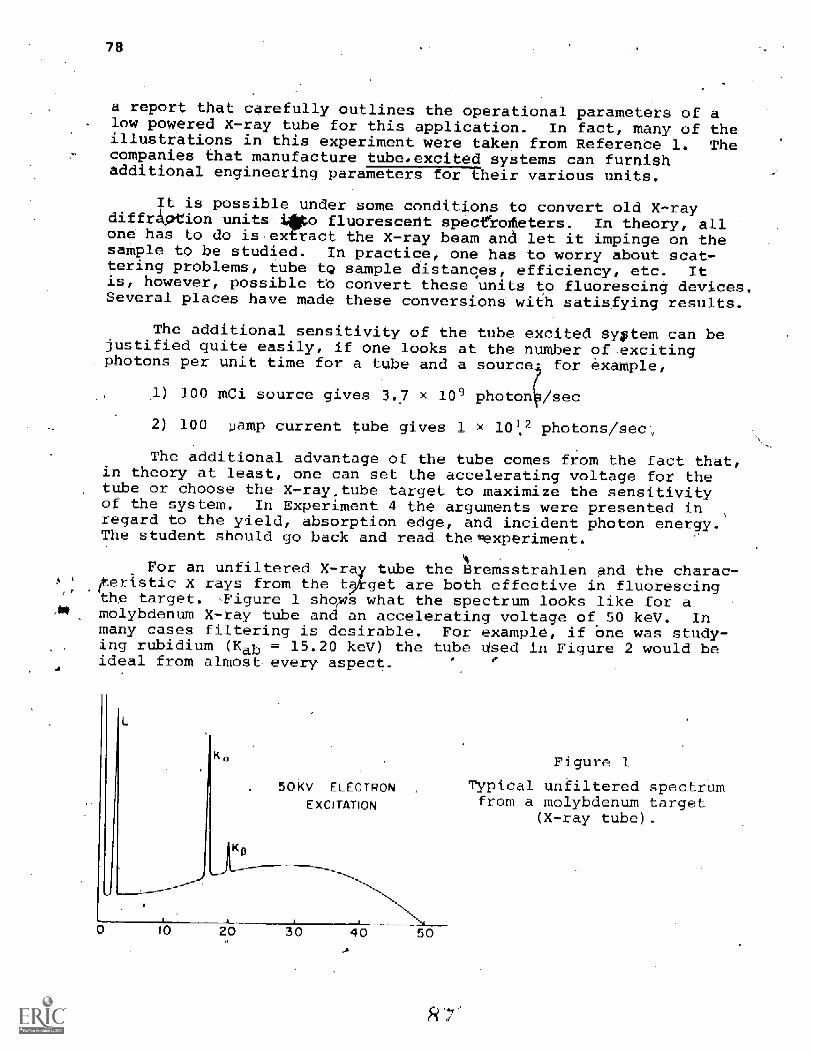
78
a report that carefully outlines the operational parameters of alow powered X-ray tube for this application. In -fact, many of theillustrations in this experiment were taken from Referende 1. Thecompanies that manufacture tube.excited systems can furnishadditional engineering parameters for their various units.
t is possible under some conditions to convert old X-raydiffr _ion units iito fluorescerit spectrometers.- In theory, allone has to do is-exfract the X-ray beam and let it impinge on thesample to be studied. In practice, one has to worry about scat-tering problems, tube tg sample distances, efficiency, etc. Itis, however, possible to convert these units to fluorescing devices.Several places have made these conversions with satisfying results.
The additional sensitivity of the tube excited system can bejustified quite easily, if one looks at the number ofexcitingphotons per unit time for a tube and a source,;, for example,
,1) 100 mCi source gives 3.7 x 10⁹ photon
2) 100 camp current tube-gives 1 x 10² photons sec
The additional advantage of the tube comes from the fact that,in theory at least, one can set the accelerating voltage for thetube or choose the X-ray,tube target to maximize the sensitivityof the system. In Experiment 4 the arguments were presented inregard to the yield, absorption edge, and incident photon energy.The student should go back and read the xperiment.
For an unfiltered X-r y tube the Bremsstrahlen and the charac-
;eristic X- rays from the tkget are both effective in fluorescingthe target. sFigure 1 shows what the spectrum looks like for amolybdenum X-ray tube and an accelerating voltage of 50 keV. Inmany cases filtering is desirable. For example, if One was study-inging rubidium Kab = 15.20 keV) the tube Used in Figure 2 would be
. eideal from almost every aspect.
50KV ELECTRON
EXCITATION
10 20 40 50
Figure 1
pical unfiltered spectrumfrom a molybdenum target
(X-ray tube).
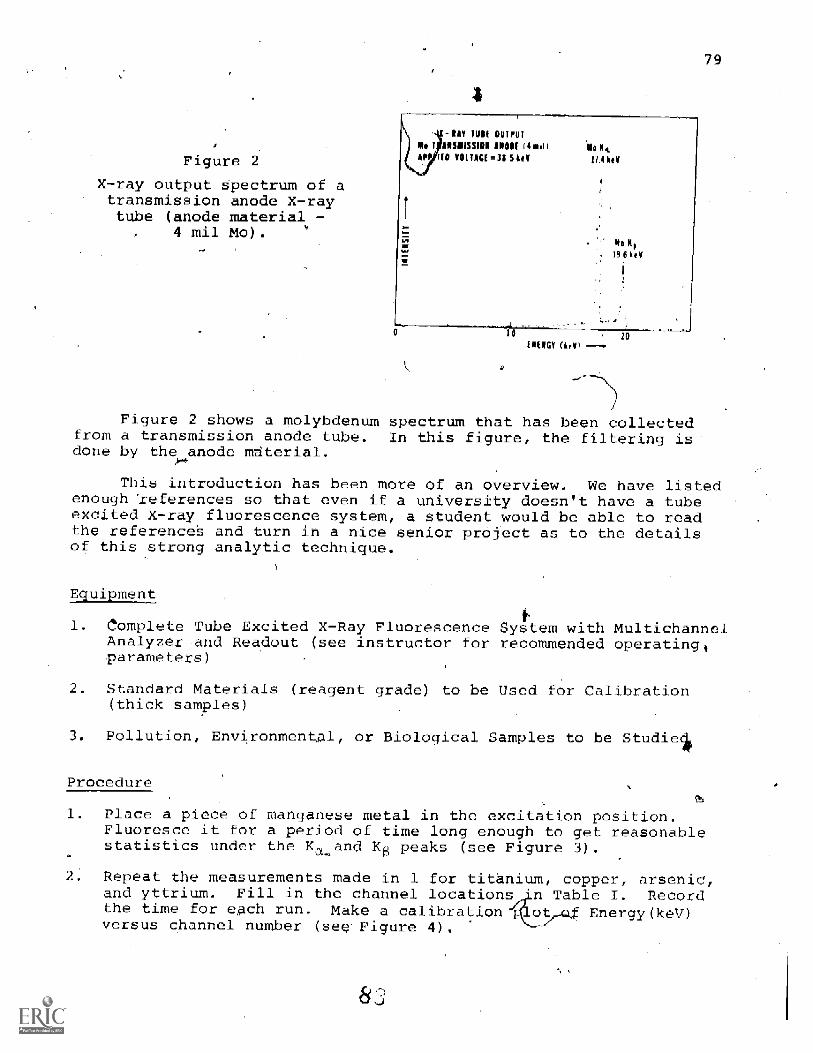
79
I
Figure 2
X-ray output Spectrum of atransmission anode X-raytube (anode material -
4 mil Mo).
L
= -RAI lull OUTPUT
Me 1 ANSIIIISS101 ANON 14 nu)APP 1(0 VOLTACE =31 5 Ad
10011t
11.1 keV
10 20DIEM (krV
Figure 2 shows a molybdenum spectrum that has been collectedfrom a transmission anode tube. In this figure, the filtering isdone by the anode material.
This introduction has been more of an overview. We have listedenough 'relerenms so that even if a university doesn't have a tubeexcited X-ray fluorescence system, a student would be able to readthe referenceS and turn in a nice senior project as to the detailsof this strong analytic technique.
Equipment
1. Complete Tube Excited X-Ray FluorescenceAnalyzer-and Readout (see instructor for recommended operating,parameters)
System with Multichannel
2 Standard Materials (reagent grade) to be Used for Calibration(thick samples)
Pollution, Environmental, or Biological Samples to be Studie-
Procedure
1. Place a piece of manganese metal in the excitation position.Fluoresce it for a period of time long enough to get reasonablestatistics under the Ka and KEi peaks (see Figure 3).
Repeat the measurements made in 1 for titanium, copper, arseniC,and yttrium. Fill in the channel locations =n Table 1. Recordthe time for each run. Make a calibration -t _ Energy(keV)versus channel number (see Figure 4).
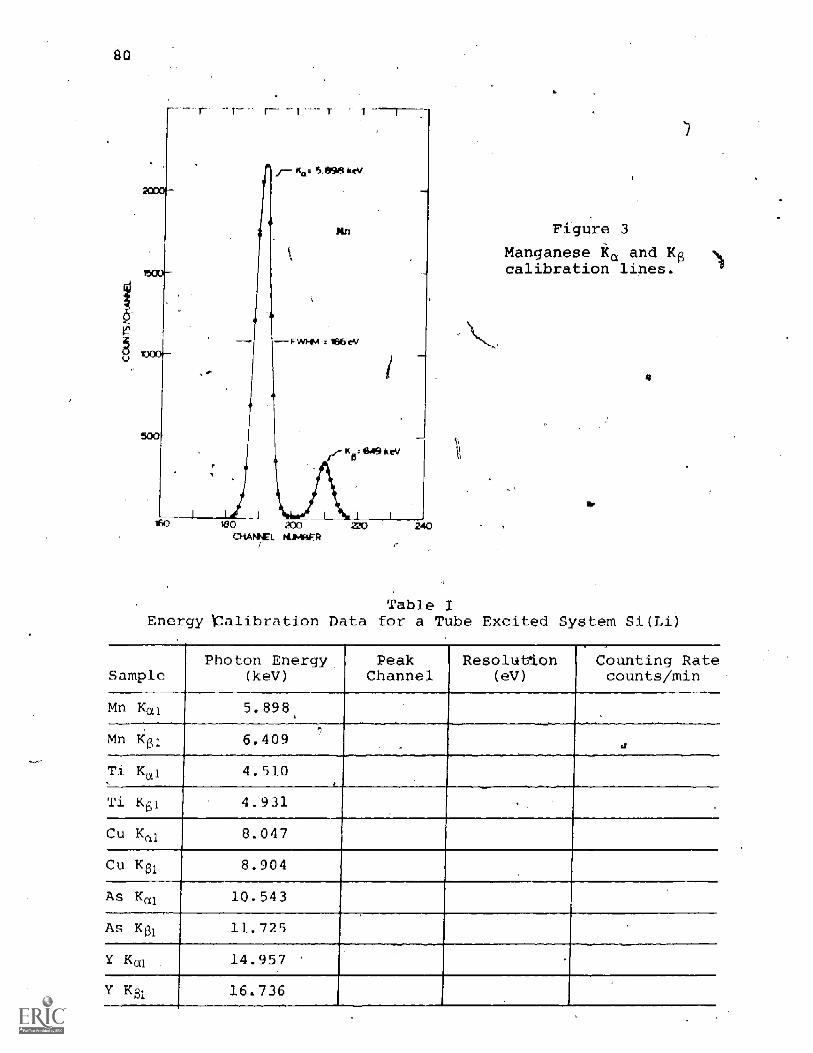
80
Figure 3
Manganese Ka and itcalibration lines.
Table IEnergy !alibration Data for a Tube Excited System Si (i(Li)
SamplePhoton Energy
(keV)Peak
ChannelResolution
(eV)
Counting Ratecounts/min
Mn Kri 5.898
Mn 1(1 6.409
Ti Kai 4.510
Ti K61 4.931
Cu Kai 8.047
Cu Kai 8.904
As Kai 10.543
As 141 11.725
Y Kai.
14.957
Y K-61 16.736
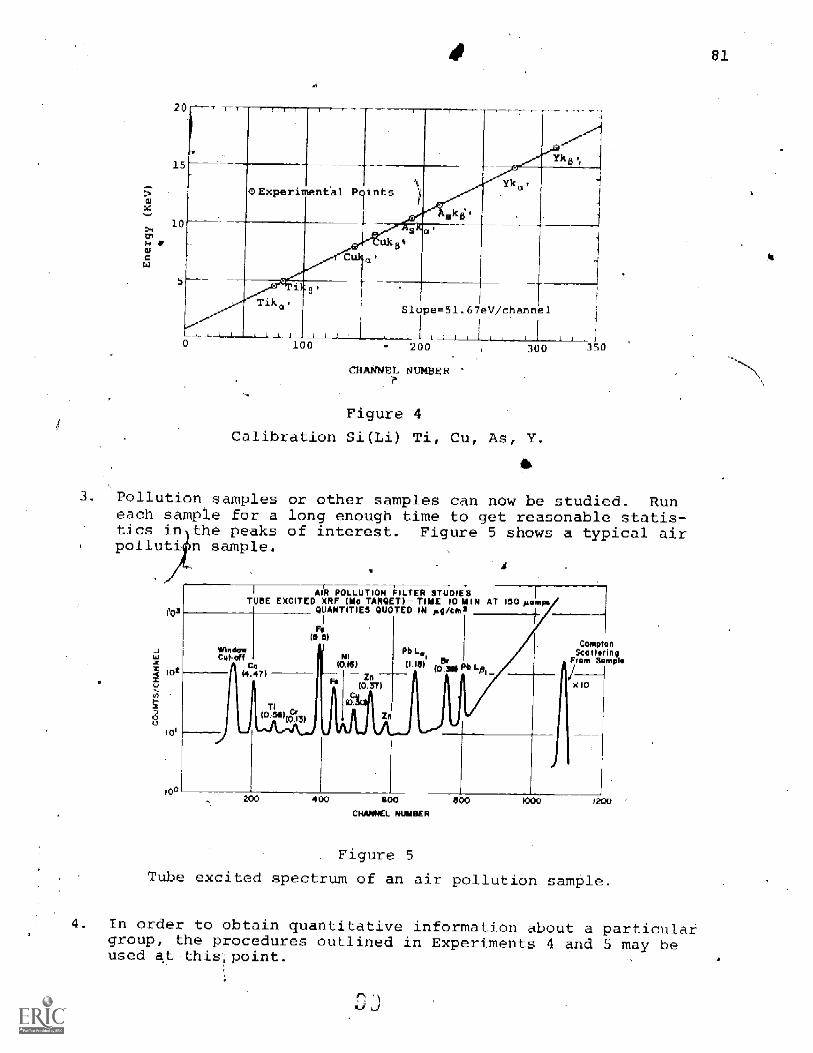
81
2
1
5
____
Yk8),_
0Exper mental P intsYXl
1
.
Cukg1 =
Tike.Rlope=51.670Vicnannel
0 100 200
CHANNEL NUMBER
300
Figure 4
Calibration Si(Li) Ti, Cu, As, Y.
3S0
pollution samples or other samples can now be studied. Runeach sample for a long enough time to get reasonable statis-tics in the peaks of interest. Figure 5 shows a typical airpolluti n sample.
AIR POLLUTION FILTER STUDIESTUBE EXCITED XRF (No TAROET) TINE 10 MIN AT 150 iaampt
QUANTITIES QUOTED IN tag/c412
RP
(5.5)=I Mello*111 CinOefi CaZ 14/ i 0 (4.47x0-...u-,
TI0.14) ccma
NI
ZIA
0.37)
Pb Ldi
HE
ComptonScatleririg
From Sam gii0
xI0
ID'
200 400 GOO
CHANNEL NUM R
Figure 5
Tube excited spectrum of an air pollution sample.
4. In order to obtain quantitative information about a particulargroup, the procedures outlined in Experiments. 4 and 5 may beused at this. point.
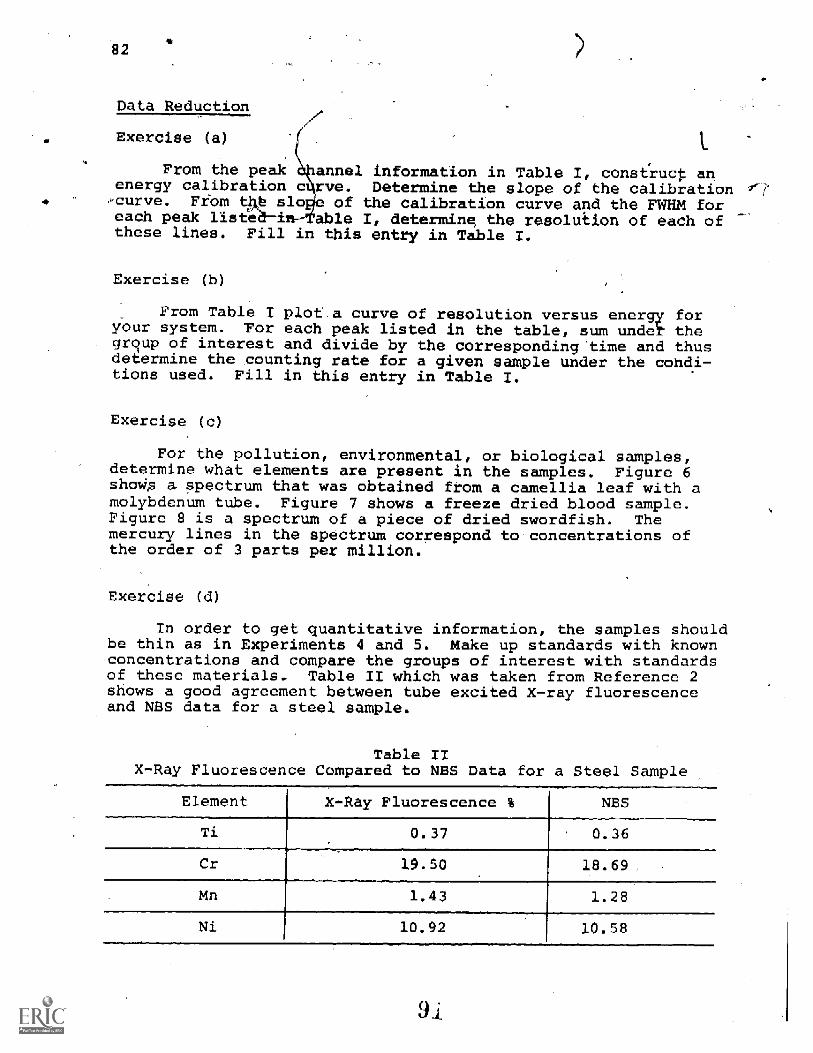
82
Data Reduction
Exercise (a)
From the peak annel information in Table I, construct anenergy calibration c rve. Determine the slope of the calibration-curve. From t slo of the calibration curve and the FWHM foreach peak liste able I, determine the resolution of each ofthese lines. Fill in this entry in Table I.
Exercise (b)
From Table I plof.a curve of resolution versus ener foryour system. For each peak listed in the table, sum under thegroup of interest and divide by the corresponding'time and thusdetermine the counting rate for a given sample under the condi-tions used. Fill in this entry in Table I.
Exercise (c)
For the pollution, environmental, or biological samples,determine what elements are present in the samples. Figure 6shoWA a spectrum that was obtained from a camellia leaf with amolybdenum tube. Figure 7 shows a freeze dried blood sample.Figure 8 is a spectrum of a piece of dried swordfish. Themercury lines in the spectrum correspond to concentrations ofthe order of 3 parts per million.
Exercise (d)
In order to get quantitative information, the samples shouldbe thin as in Experiments 4 and 5. Make up standards with known-concentrations and compare the groups of interest with standardsof these materials. Table II which was taken from Reference 2shows a good agreement between tube excited X-ray fluorescenceand NBS data for a steel sample.
Table IIX-Ray Fluorescence Compared to NBS Data for a Steel Sample
Element X-Ray Fluorescence %
Ti 0-.37
Cr 19.50
M 1.43
Ni 10.92
NBS
0.36
18.69
1.28
10.58
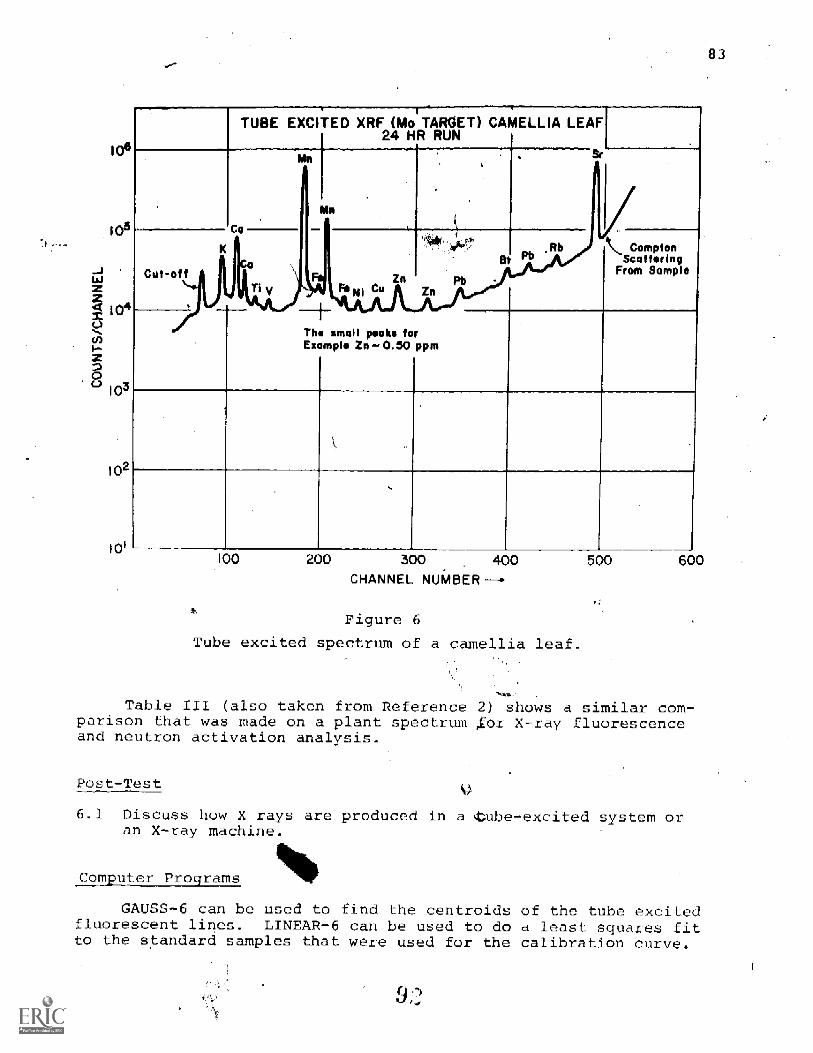
TUBE EXCITED XRF (Mtn TARGET) CAMELLIA LEAF24 HR RUN
22Io
Lcol
20
10
02
10
The 'mall pocks forExample Zn 1150 ppm
ComptonScattaring
From Sample
100 200 300 0 500 600
CHANNEL NUMBER
Figure 6
Tube excited spectrum of a camellia leaf.
Table III (also taken from Reference 2) shows a similar com-parison that was made on a plant spectrum Ear X-ray fluorescenceand neutron activation analysis.
Post -Test
6.1 Discuss how X rays are produced in a cube- excited system oran X-ray machine.
Computer Programs
GAUSS-6 can be used to find the centroids of the tube excitedfluorescent lines. LINEAR-6 can be used to do a least squares fitto the standard samples that were used for the calibration curve.

84
w
I
20 IQr0
TUBE EXCITED XRF (Mo TARGET) FREEZE DRIED BLOODVOLUME 3m1
FS
_Cam ptonScattering
From sample.
102
I0100 200 400
CHANNEL NUMBER A-
Figure 7
Tube excited spectrum of freeze dried blood.
SPECTRUM OF DRI SWORDFISH -TUBE EXCITED XRF (Mo TARGET)
LINE
Fe-Ka-1
ENERGY '<eV'
6.403
Zn-Ku
Hg-La
Br-Kai
8.838
9.987
11.923
Rb-Ka 13.394
(Hg) is 3 parts per million (La)(As) is 5 parts per million (Kai)
ENERGY (RELATIVE)
Figure 8
Tube excited spectrum of dried swordfish sample.
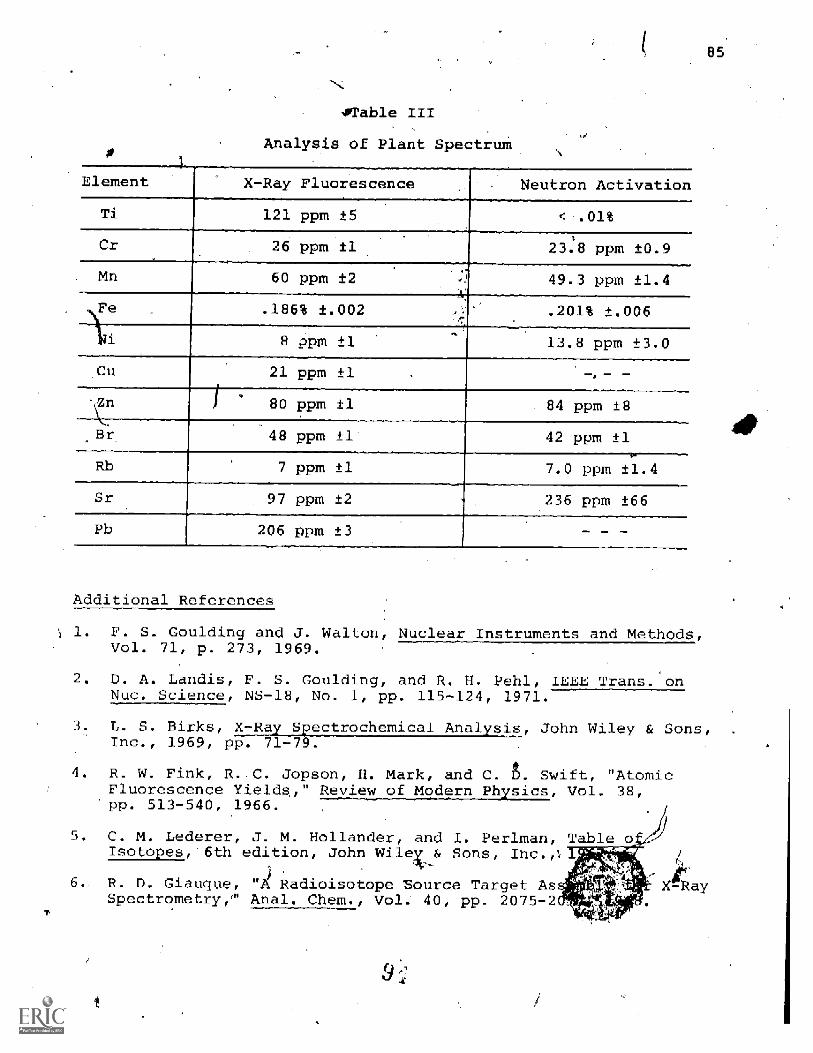
'Table III
Analysis of Plant Spectrum
Element X-Ray Fluorescence Neutron Activation
Ti 121 ppm ±5 .01%
Cr 26 ppm ±1 23.8 ppm ±0.9
Mn 60 ppm ±2 49.3 ppm ±1.4
Fe .186% ±.002 .201% ±.006
8 ppm ±1 13.8 ppm ±3.0
Cu 21 ppm ±1
Zn 80 ppm ±1 84 ppm ±8
.Br. 48 ppm ±1 42 ppm ±1
Rti.
7 ppm ±1 7.0 ppm ±1.4
Sr 97 ppm ±2 236 ppm ±66
Pb 206 ppm ±3 - - -
Additiona References
F. S. Goulding and J. Walton, Nuclear Instruments and Methods,Vol. 71, p. 273, 1969.
2. D. A. Landis, F. S. Goulding, and R. H. Pehl, IEEE Trans. onNur. Science, NS-18, No. 1, pp. 115-124, 1971.
L. S. Birks, X --LE.yEpLELEas1-2trlisiL412L.1:01, John Wiley & Sons,Inc., 1969, pp. 71-79.
85
4. R. W. Fink, R. C. Jopson, H. Mark, and C. b. Swift, "AtomicFluorescence Yields, ET/i2HaL21212EnEllyEiE, Vol. 38,pp. 513-540, 1966.
5 C. M. Lederer, J. M. Hollander, and T. Perlman, 'TaiIsotopes,-6th edition, John Wiled & Sons, Inc.,
R. D. Giauque, " Radioisotope Source Target As-Spectrometry,'" Anal. Chem., Vol. 40, pp. 2075-2
86
C. L. Luke, "Detcrmination. of ,Trace Elements in Inorganic andOrganic Materials by X-Ray Fluorescence Spectrometry I " Anal.
.Chem. Acta. Vol. 41, p. 239,_1968.
M. E. Salmon, "An Improved X-Ray Fluorescence Method forAnalysis of Museum Objects," Advances in X?Ray Analysis,Vol. 13, Plenum Press, 1970, p. 9
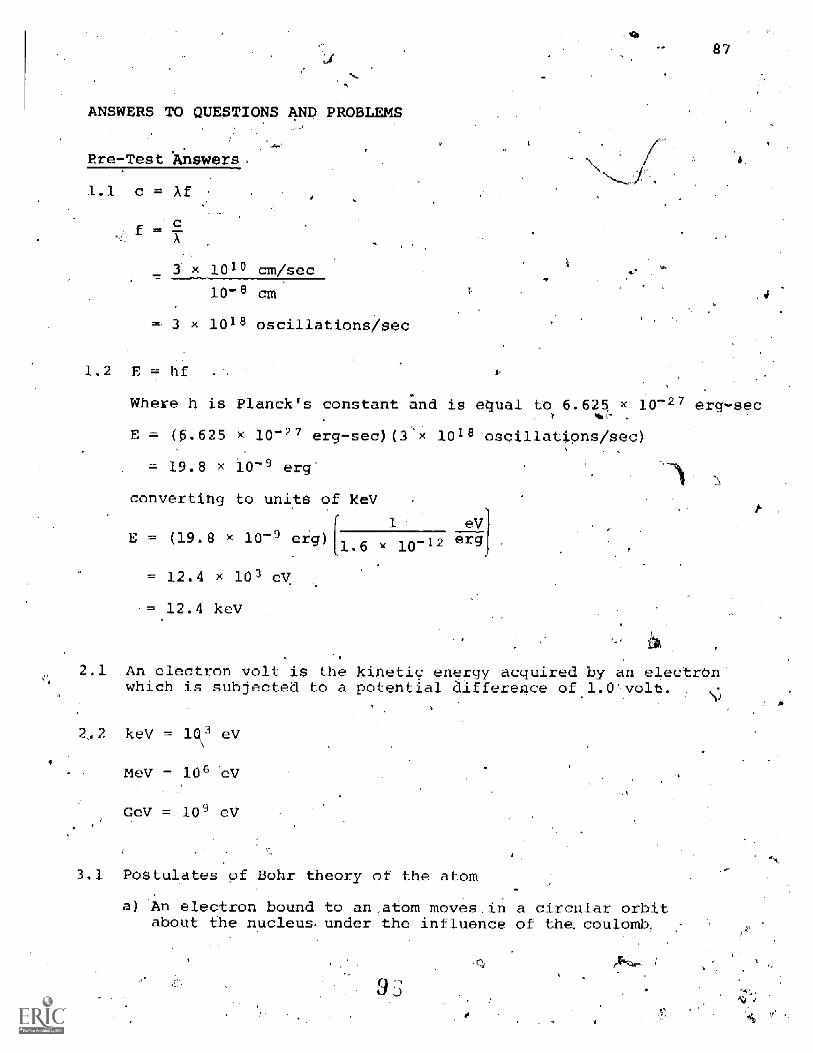
ANSWERS TO QUESTIONS AND PROBLEMS
Pre-Test An wers-
1.1 c = Af
cA
x 101 cm/sec
io-8
3 x 10¹⁸ oscillations /sec
87
1.2 E = hf
Where h is Planck's constant and is equal to 6.624 x 0-27 erg-sec
E = (5.625 x 10=27 erg-sec)(_
= 19.8 x 10⁻⁸ erg=
converting to units of keV
1018 oscillations /sec).
E = (19.8 10-9 erg)1.6
= 12.4 x 10³ eV
12.4 key
10-12eV
erg
.1 An electron volt i the kinetic energy acquired by an electronwhich is subjected to a potential difference of,1.0volt.
2,2 keV = 1 eV
MeV = 106
GeV -,109 eV
3.1 Postulates pf Bohr theory of the atom
An electron bound to an,atom moves.in a circular orbitabout the nucleus under the influence of the coulomb.
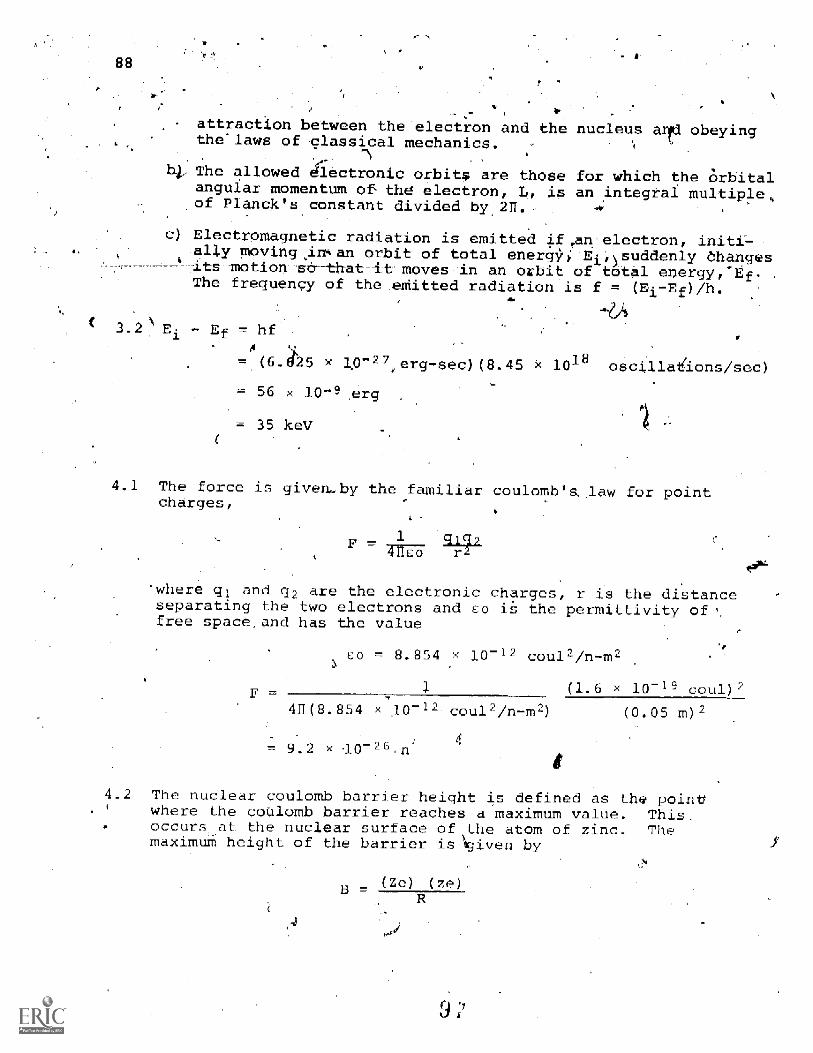
- a
attraction between the electron and the nucleus arfti obeyingthe'laws.of classical mechanics.
4 The allowed gectronic orbit* are those for which the 6rbitalangular momentum of the electron, L, is an integral multiple,of Planck's constant divided by 211.-
c) Electromagnetic radiation is emitted if n.electron, initi-ally movingjJran orbit-of total energy 'ti,Suddenly changes
'7its-notion -s&-ttat-it-moves-in-an -orbit of total energy, -EfThe frequency of the .emitted radiation i s f = (E1- Ef) /h.
Ef = _fA
=_(6.en5 x 13-27,erg-sec)(8.45 x 10¹⁸ oscilla ions s c_
- 56 x 10-- erg
35 keV
4.1 The force is given_by the familiar coulomb'.law for pointcharges,
1F TITEE
`where gi and (42 are the electronic charges, r is the distanceseparating the two electrons and co is the permittivity of %free space, and has the value
F
E 8.854 x 10⁻¹² cou12/n-m2
1
417(8.854 x 10⁻¹² coul2
9.2 x 10⁻²⁵
(1.6 x 10⁻¹⁹ coul)2
(0.05 m)2
4.2 The nuclear coulomb barrier height is defined as the pointwhere the coulomb barrier reaches a maximum value. Thisoccurs at the nuclear surface of the atom of zinc. Themaximum height of the barrier is)qiven by
(Ze) (zeB R--

where Ze is the nuclar chargeyof the zihc atom, ze is tleincident alpha particle charge, and R is the niiclear'radiusof 'zinc-. °,.
)
R = 1.2 x A /3 fermis
= 1.2 x, (64) 1/3
4.8 fermis
Multiplying both the numerator and denominator by Planck'sconstant divided by 21I and the speed of light, one obtains:
substituting
and
Zz e2 ficBt7F
Zz- -*
2
47,F the fine structure constant, a
tic. = 197.32 MeV - fermis
(30) (2)
4.8 erns 137
-18 MeV
(197.32 MeV - fermis)
5.1 In a multi-electron atom there can never be more than oneelectron in the same quantum state.
6.1 E ax hf W
- (6.625 x 1827 erg-sec)(1016 cycles/sec) - 4 eV
= (6.625 10-1 erg)(lev/1.6 10-12,erg) - 4 eV
= 41.4 eV 4 eV
= 37.4 eV
89

90
i
1
2 If the inaidept photon IS completely absorbed by the e , t__conservation of totaL!reiativistic energy gives
i Y 16?/E + Eel. =
?
where EY -I
can be rewritten
and
E
Ee- = p2c2 m2b40
c pAlDo2Py 0
I 0,-=since initially the momentum of the electron is,equalto zero,
The7'efore, we have
/.Pic + Mo_
-
By the conservation of- momen um,
Pf
Substituting in the above equation far Py, we obtain
2 m2cM C- +0 f 0
Hence, both total relativi t b:energy and momentum cannot beconserved. 4
4.
in electron capture, the nucleus capture a negati,yely chargedatomic electron. The atomic number Z decreasesby one and theneutron number N increases by one. The energy available forelectron capture by the nucleus is
AZ-1-m
In internal conversion, the exc ta _ion energy of the nucleusis transferred directly to the Atroa through the coulomb
V
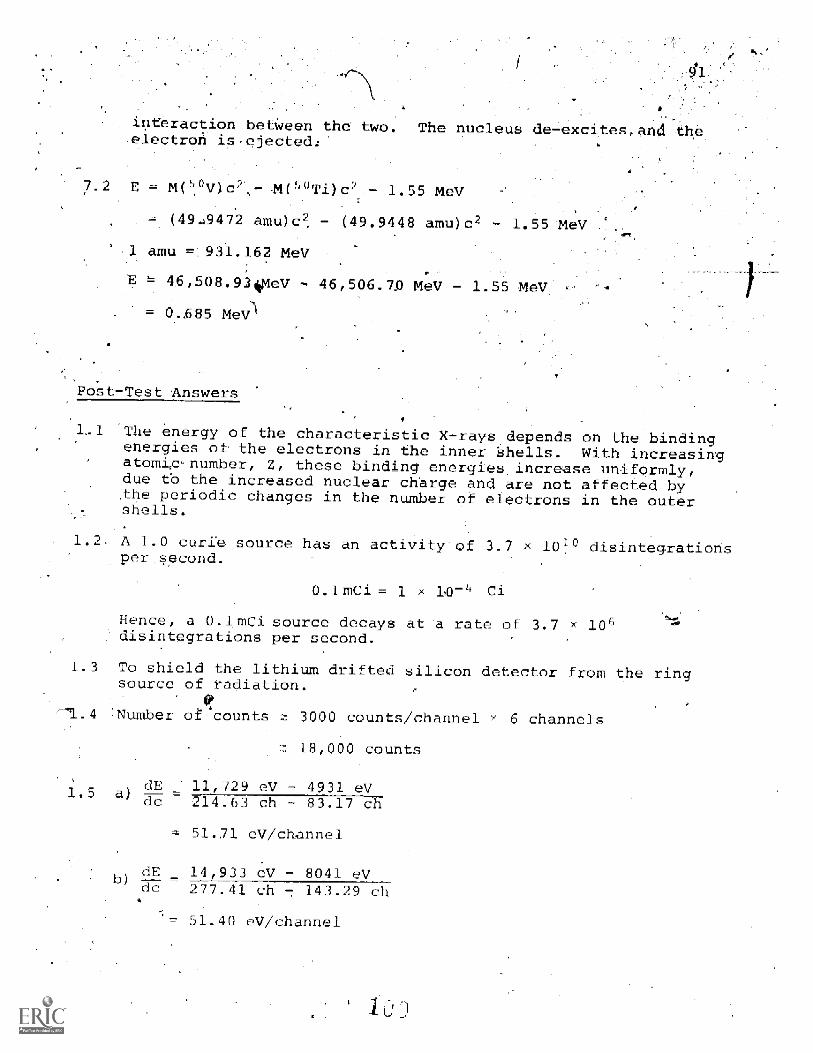
interaction between the two.electron ispjecteth
The nucleus de- excites, an
7.2 E = "-)Ti)c2 - 1.55 MeV
(49.49472 amu)C2 (49.9448 amu)c2 - 1.55 MeV
amu =931.162 MeV
= 46,508.934MeV 46,50 .70 MeV - 1.55 MeV
= 0..685 MeN.\
Pos Te
the
1..1 The energy of the. characteristic X -rays depends on the bindingenergies of the electrons in the inner shells. With increasingatomic-number, Z, these binding energies increase uniformly,due to the increased nuclear charge and are not affected bythe periodic changes in the number of electrons in the outershells.
1.2, A 1.0 curie source has an activity of .7 101° disintegrationsper,seeond.
1.3
r'1.4
1.5
0.1 mEi = 1 x 1,0=4
Hence, a 0.1mCi source decays at a ratedisintegrations per second.
To shield the lithium drifted siliconsource of radiation.
Number o counts 3000 counts/channel
18,000 counts
dE 11,729 eV - 4931 eV
of 3.7 x 10⁶
detector from the
6 channels
ring
dc 214.6 ch - 83.17 ch
51.71 eV/channel
dE 14,933 eV - 8041 eVb)dc 277.41 ch - 143.29 ch
51.40 eV /channel

1.6 a'
b) 5
1.7 Yes.
to
2.1 An internal conversion coefficient is the ratio of thepro-bability for-eMitting-anTelectron from a givenSbe-IIt fhprobability for emitting a gamma ray.
Escape peaks may be produced in a gamma-ray energy spectrUmif the energy of the incident gamma 'ray, Ey, is greater thanthe rest mass energy of two electrons. If the incident gammaray interacts by means of the pair production process, then,1.022 MeV of energy -is required to produce the electron-positron pair and the regaining photon energy is given tothe charged .particles as kinetic energy. This 'kinetic energyis deposited in the detector as the two charged partiCles lose.energy through Coulomb interactions and come to rest. The-positron and an electron annihilate each other producing two511 keV photon's. If both 511 keV photons escape the detectorthen'a -double escape peak of-energy; Ed, is-produced.
E 1.022 MeVY
If one 511 keV photon is detected the energy of he,escapepeak, E, , is
E I= Es y
0.511 MeV
If both 511 key photons are detected then a full energy peakis observed.
E = E
4
3.2 An Auger electron is an electron ejected from an atom in aradiationless transition. For example, an atom in which aK shell electron has been ejected has a large probability ofemitting a Ku X ray as an L shell electron falls into theK shell. If, however, the atom de-excites through theemission of'an L shell electron, the radiationlessrtransi-tion is called an Auger transition and the L shell electronejected is an Auger electron.
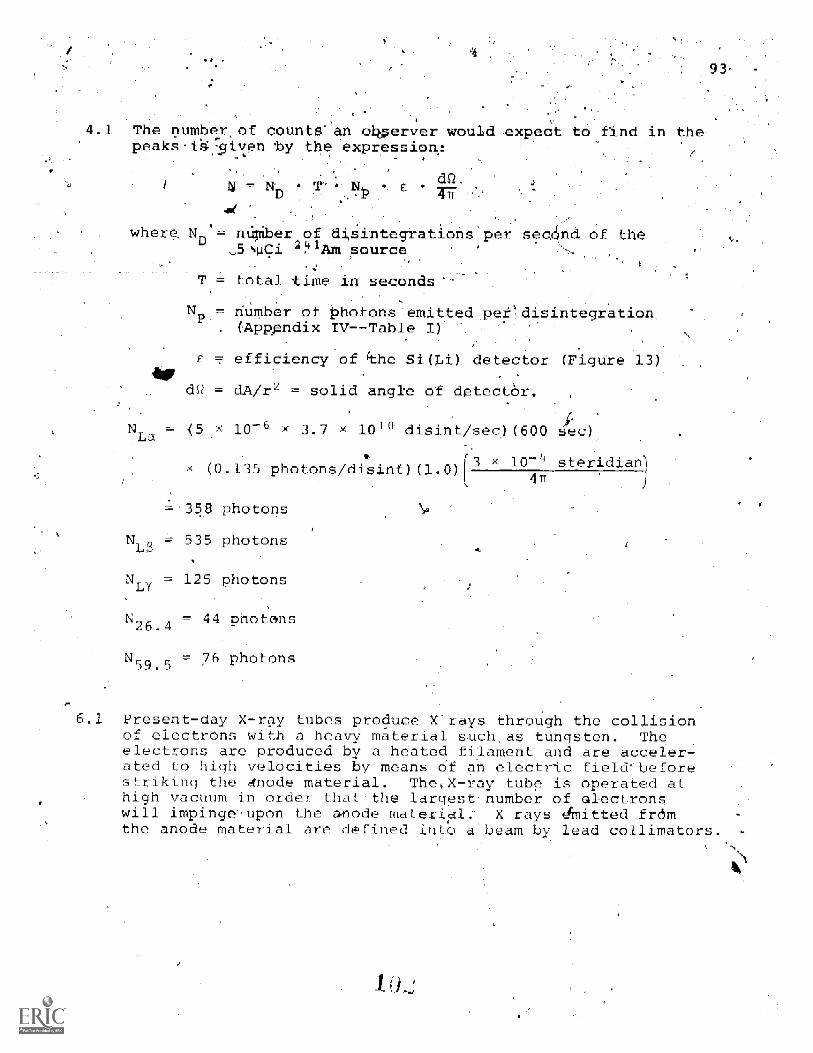
4.1 The n-peaks
er of counts an observer would expect to find in the:given by the expression:
E *
where No = n b r of disintegrations per sec nd of the21Am source
T = total time in seconds
N_ number of Photons-emit e(Apppndix IV--Table 1)
sintegration,
efficiency of the Si(Li) detector (Figure 13)
dS-2 = dA/r2-= solid angle of detect6r.
' x 10-6 x 3.7 4--
disint/sec)(600 sec
x (0.135 photons/disin- )(1.0)1-
=1'358 photons
N = 535 photons
= 125 photons
= 44 photons26.4
N59.5 = 76 photons
x 10-4 steridian-`41T
93
6.1 Present-day X-ray tubes produce X rays through the collisionof electrons with a heavy material such,as tungsten. Theelectrons are produced by a heated filament and are acceler-ated to high velocities by means of an electric field'beforestriking the Anode material. The X-ray tube is operated athigh vacuum in order that-the largest number of aleetronswill impinge'upon the anode material : X rays emitted fromthe anode material are defined into a beam by lead collimators.
INTRODUCTION
MODULE--TWO
CHARGED PARTICLE DETECTION
Module On,Charged-Partidle Detection Using.Silicon Surface Barrier Detectors
Solid,state detectors have been in usefor the detection ofionizing radiatOnfor the past .two decades. The first use of ap-,n junction devide as a solid state detector was by N. G. McKayfor alpha particle detection. Since then, their use hasrevolutionized charged particle detection.
4micondUctsf charged particle detectors may.be,used over abroad _range of energies and projectilegfrom 20 key electrons to200 MeV heavy ions. These surface-barrier detectors may be pre-pared with energy resolution of better than 0.5% which i surpassedonly'by magnetic spectrometers. Thektiming characteristics ofthese detectors nsec pulse rise time) are good'enough toperform fast coincidence experiments and in addition theirefficiency is essentially 100% for their active volume.,
The module ists of three experiments which may be per=formed` by the student. In the first experiment the student willbe introduced.to some of the procedures and detectors commonlyOployed in alpha particle studies. In Experiment 2 the studentwi.'5,1 be familiarized with the use of solid state charged particledetectors for conversion electron spectroscopy. In Experiment 3a thin transmission surface barrier detector is employed todemonstrate "state of the art" nuclear timing techniques.
This introduction is followed by,the objectivesc=for themodule, a list of'prerequisites which the student should havebefOre attempting this_m6dule, and a theoretical section whichdisuses some of the basic concepts of radioactive decay andsemiconductor detectors.
013,1TIVES
To f3 .iliarizo the student with the use of solid statechar gd particle detectors for alpha particle studies andconvorsion electron spectroscopy.
4,
I
t
PREREQUISITES WITH PRE-TEST QUESTIONS AND PROBLEMS
1. Coulomb Force:
1.1 Determine the magnitude and direction of the coulomb forcebetween two electrons I'5 cm apart.
1.2 What is the nuelear-eoUloMb.barrier height in MeV for a5 MeV proton incident upon an atom of copper (A = 65).
2.
2.1 How is an electron volt defined?
2.2 Hosil is the eV related to the multiples keV, MeV, GeV?
Electron Volt (eV), kV
THEORY
Natural Radioactivity
'Naturally occurring radioactive isotopes emit alpha, beta,or gamma radiation. If an alpha particle is emitted by the nucleusof an atom, the atom is transformed into a new atom which has itsatomic mass, A, decreased by 4 units and its atomic number, Z,decreased by _3 units. If a beta particle is emitted from a nucleusof atomic number, 4, the atomic number of the new atom formed isZ 1 and the atomic mass remains the same. Two geneticallyrelated nuclei are called isobars., Gamma radiation is sometimesassociated with either alpha or beta decay of a radioactive nucleus.
Almost all the radioactive nuClei occur within the range of!omit numbers Z 81 to 92. These elements have been grouped
into three genetically related series: the uranium-radium series,the thorium series and the actinium series. A. very bong -livedisotope begins each series while one of the stable lead orbismuth isotopes ends each.
Rate of Radioactive Deca
The decay rate of a particular radifiocte material is aconstant that is independent of physital and chemical conditionsThe average number of atoms, dN, that will decay' in a small timeinterval, dt, is prOportional to the number of atoms, N, present,at the time, t.
-dN = ANdt

The constant of prOpoetionalitYl-A, is the decay constantfor that particular radioactive isotope. Integrating, oneobtains
N = No e7At
where Np is the number of atoms present at time t = 0. Hence,the number of `atoms of a given radioactive substance decreasesexponentially with time assuming no new ato m.. are introduced.
At the end'of a certain tine interval, called the half-lifeof the radioactive element,, half of the atoms will have decayed.This time interval may--be determined by setting N = N0/2 andt = t-
1/2
with the result
At = 2,n 2
0.693
The mean lifetime is defined as
4 tmnand is just the reciprocal of /the deday constan
41.
Activity f Radioactive Source
A
97
The activity of a radioactive source is normally expressed asthe number of disintegrations per unit time. A commonly used unitis the curie and is equal to 3.7 x 10¹⁰ disintegrations per second.The curie was originally based on the rate of decay of a gram ofradium. More convenient sUbmultiples of the curie are the milli-curie (1 ma = 10-3 curie) and the microcurie 10-6 curie).
Alpha Particle Energy
The energies of known alpha particle emitters range from8.9 MeV for
enemiesto 4.1 MeV for NTh. Alpha particles may 'be
detected and their energies determined very accurately withsilicon surface barrier detectors.
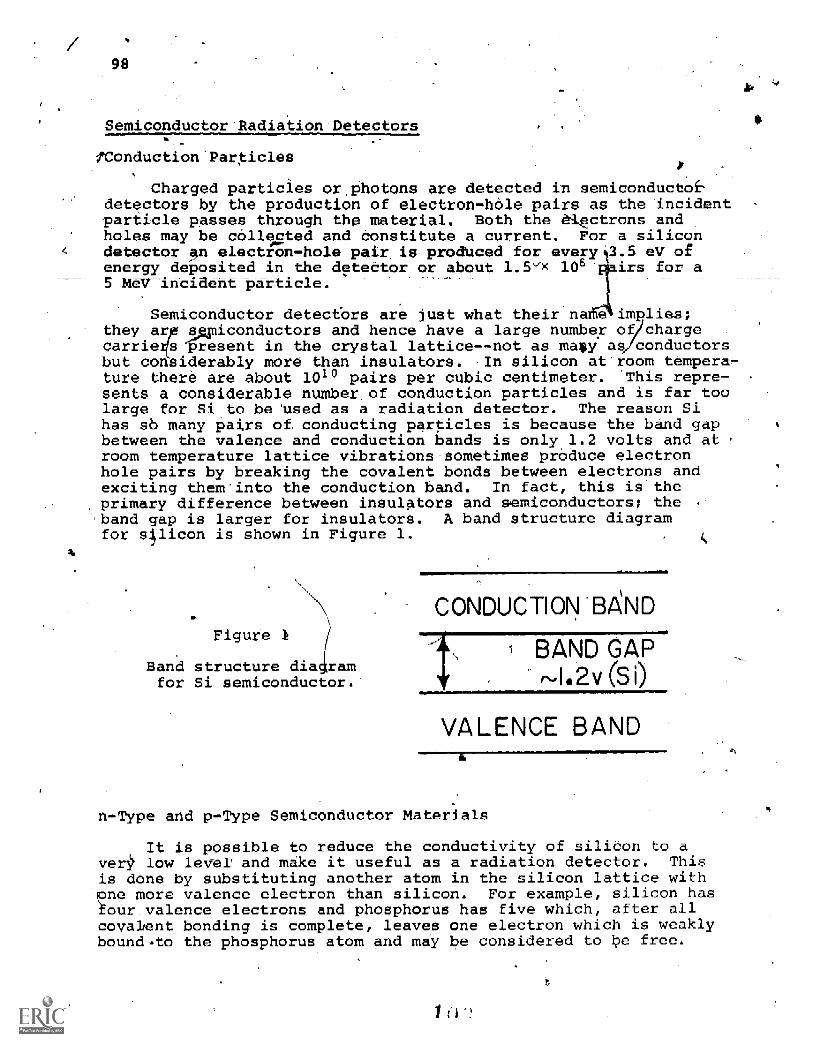
98
Semiconductor Radiation Detectors
1Conduction Particles
Charged particles or,photons are detected in semiconductordetectors by the production of electron-hole pairs as the incidentparticle passeS through thp material. Both the 01pctrons andholes may be collected and Constitute a current. For a silicondetector an electron-hole pair_ is produced for every'3.5 eV ofenergy deposited in the dpteCtor or about 106 -irs for
inc e particle.
Semiconductor detectbrs are just what their n e implies;they a e3Apiconductors and hence have a large number of/chargecarrierspresent in the crystal lattice- -not as mazy as/conductorsbut considerably more than insulators. In silicon at'room tempera,ture there are about 1010 pairs per cubic centimeter. This repre-sents a considerable- number, of conduction particles and is far toolarge for Si to be 'used as a radiation detector. The reason Sihas sb many pairs conducting particles is because the band gapbetween the valence and conduction bands is only 1. volts and atroom temperature lattice vibrations-sometimes prOduce electronhole pairs by breaking the covalent bonds between electrons andexciting them into the conduction band. In fact, this is theprimary difference between insulators and aemiconductors; theband gap is larger for insulators. A band structure diagramfor silicon is shown in Figure 1. ,
Figure 1
Band structure diagramfor Si semiconductor.
CONDUCTION 134ND
BAND GAPI.2v (Si)
VALENCE BAND
Type and p-Type Semiconductor Materials
It is possible to reduce the conductivity of silidon to aver low level and make it useful as a radiation detector. Thisis done by substituting another atom in the silicon lattice withne more valence electron than silicon. For example, silicon hasour.valence electrons and phosphorus has five which, after allcovalent bonding is complete, leaves one electron which is weaklybound..to the phosphorus atom and may be considered to be free.

.
ery phosphorus Atom adds one free -lcctron in,fheJattice andin addition reduces the number of holes present since the greaterthe number of electrons, the eater the,Probab4ity that anelectron will fall from the c nduction band back into a hole inthe-Valence band and hence re uce the number -0f.holes. Thus,the intrinsic si=licon w ch contained the same number of conduc-Aion holes .ana electrons been changed by phosphorus do- _ngto a'material with a larg mber of conduction electrons andfew holes.. Therefore, the conduction of electric currentlVi41be primarily by the electro-S-4, Since electron e have a negativeirge thphosphorus-doped-silicon is called an n-typeemiconductor-material..
It is also possible to produce a p-type material by dopingsilicon with a material which has one less valence 4ectron thansilicon. 'Boron only ha three valence electrons. The electronic-structure of boron is: 1s2 2s2 2p1. Boron-doped siliconis ap-type material and current is conducted primarily by the motionof holes'.
p-n Junction Diode
A detector is made by producing a p-n junction in a dinglepie-of- silicon. Figure 2(a) shows a single crystal doped withphosphOrulon the right and boron on the left. The phosphorus-doped side has excess electron charge carriers-and the boron-dopedside has excess hole charge carriers. Figure f(b) shows the samecrystal with an electrie-)field applied across -the crystal. Thefree holes in t1 ie p-type material are driveh to the left while-the frees electrons i4-1 the n-type material are driven to the rightleaving a layer inthe center of the crystal which is depletedof almost all charge carriers. This is called the depleted layerwhich acts as a-- insulator. This depleted layer has the charac-teristics required for a detector. An incident ionizing particlewill leave a path Of electron-hole pairs Ilich will be swept outby the electric field and the charge colle- ?_(1 will pass into anexternal circuit. ,e1 i
A silicon p-n lq.action detecto_ is shown in Figure 2(c). Then-type material is made wafer thin so that the incident ionizingparticle will lose only a minimum amount of energy before recl2hingthe depleted layer. *pieall these 4,,ayer of n-type materialwill be .0.1',, thick (1p = 10-
0
'Silicon n-p,junction detectors have been made with surfaceareas up to 1 cm- and sensitive thicknesses or depleted layers1 mm thick. This thickness will completely Stop a 10 MeV proton-or a 40 MeV alpha particle.
99
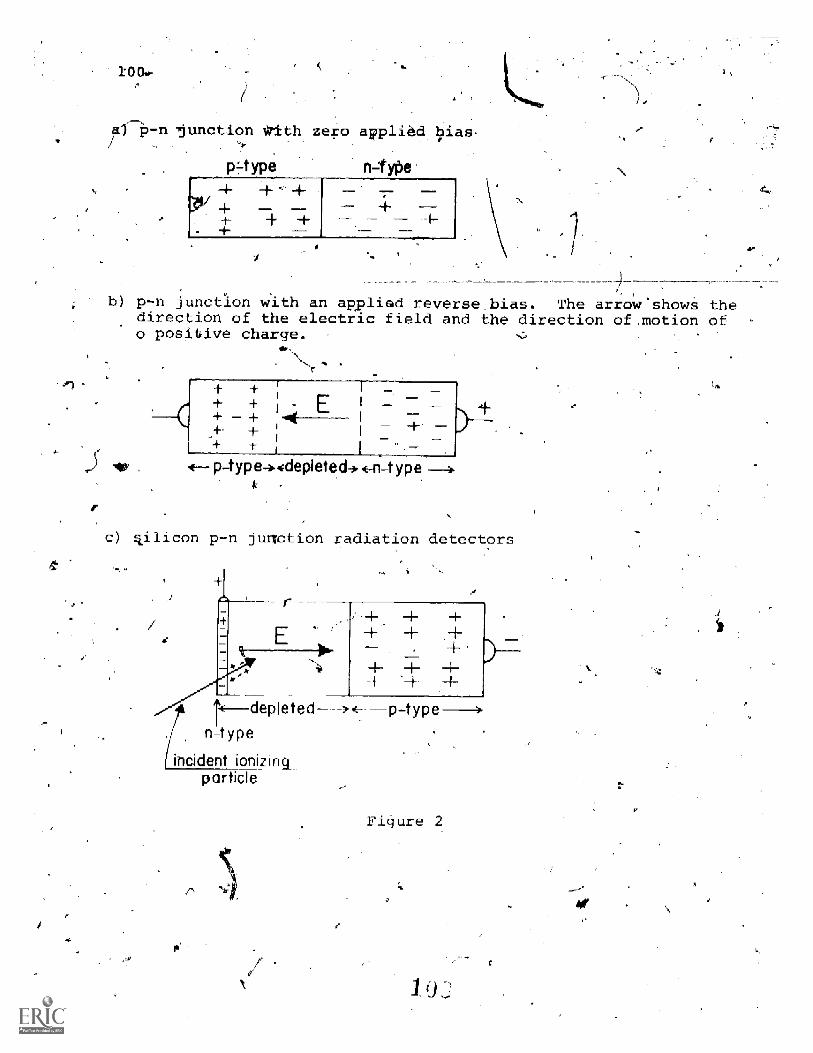
100#
p-n junction TkIth zero applied as
ptype ntype-1- 4- -1-
---
AP
b) p-n junction with an applied reverse.bias. The arrow'shows thedirection of the electric field and the direction of,motion ofo positive charge.
± It4p ype-).4depleted(--n-type
kilicon p -n junction radiation detectors
f.-÷-I- ± ,±
-4-
± -1-± `-±depleted ype
n-type
ident ionizinAparticle
Figure 2

Objective
101
Eperl,ment 1
`rthe Use of Solid State Char ed ParticleDetectors for Alpha Particle Studies
To Study.the application of silicon surface barrier detectorsalpha-spectroscopy; to construct an energy calibration withoa
single alpha source and a pulse generator, to determine the absoluteenergy of an unknown alpha source.
References
1: G. Dearnaley and D. C. Northrop, Semiconductor counters forNuclear Radiations, 2nd edition, Wiley, New Yo 1966,
2 J. M. Taylor, Semiconductor Particle DetectorS Butterworths,Washington, 1963.
3. F. S. Goulding, "A-,Survey of the Applications and Limitationsof Various Types of Detectors in Radiation Energy Measurement,"IEEE Trans. Nucl. Sc'' NS- '11(3) 177 (June 1964).
G. Dearnaley, "Nuclear Radiation Detection by Solid StateDevices," ci. Instr. A3, 869 (1966).
J. M.'MoKenzie, Index to the Literature of SemiconductorDetectors, Government P-rinting Office, National Academy ofScience, Washington 1969.
Introduction
In this experiment we will outline the use of silicon surfacebarrier detectors for alpha spectroscopy- However, the techniquesand methods used in the experiment will be applicable to many otherexperiments that will ho done in the manual.
Surface barrier detectors for charged particle spectroscopy havewide application in physics and nuclear chemistry. These detectorscan be constructed with active detecting areas as small as 1 mm2 oras large as 25 cm-'. They; arc, 100% efficient for. alphas over theiracts is area. Resolutions 'as low as 8 key have been obtained for5 MeV alpha particles. Perhaps the nest impressive feature of thedetectors is that they can be used for virtually any charged parti-cle and their dynamic-range is quite impressive. These have beenused in exeriments for 200 electeon Volt recoiling electrons andfor 200 MeV heavy ion studies. For example, Figure 1 shows a pulseheight spectrum of 120 keV scat -red electrons from a_ accelerator.
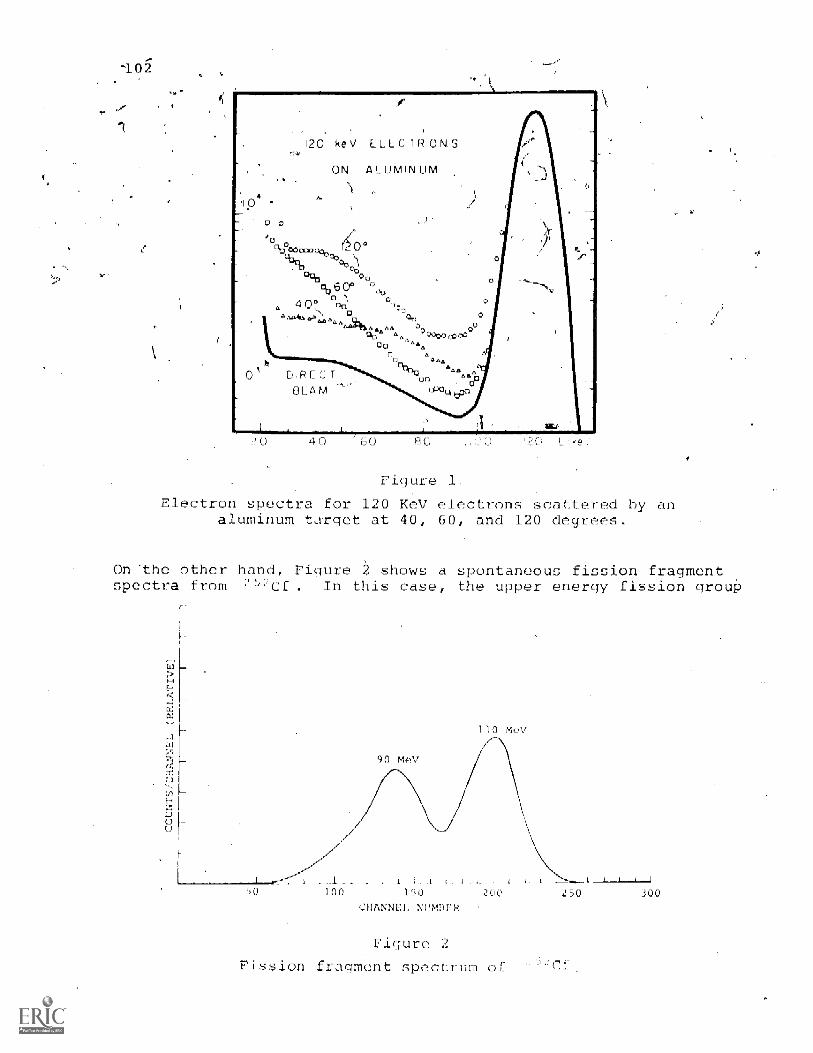
o
120 keV ELEC TR ON.S
ON ALUMINUM
0 a
702,x,
. N -0o,0 ) 0
040° 00
A '4,44. AA"' %0 0044,,,Aga 0
00 A 4 U"300 W 000000_ "a
a 44,
oY DiRr T
REAMu0
444
40 .J :0
Figure 1.
Electron spectra for 120 KeV electrons scattered by analuminum target at 40, 60, and 120 degrees.
On the other hand, Figure 2 shows a spontaneous fission fragmentspectra from ;52cf. In this case, the upper energy fission group
(ANNE I, NMIER
Figure
Fission fragment spectrum of
is 110 MeV. /There are many applications in nuclear chemistry inwhich charged particles are measured in order to establish someparameter in a'chemical system. Surface barrier solid stateradiation detectors do an excellent job in this capacity.
Eauipment
1. Radioactive Sources
c)
d)
0.1 wCi 241Am0.1 oCi0.5 1ACi ''"0Thunknown a 1pha source
follows:
103
Solid State Surface Barrier Detector with the following parameteresolution (30 keV), area (50 mm2), depletion depth (100 microns
3. Bias Power Supply ,for the Detector
4. High Resolution Pre-amplifier
Spectroscopy Amplifier
Simple Vacuum Chamber and Pump
7. Nuclear Pulse Generator
8. Multichannel Analyzer (1=400 channels)
9. Biased Amplifier (optional; some multichannel analyzers havebiasing capabilities built in)
10. Oscilloscope
Procedure
1. Set up the electronics as shown in Figure 3. Place the 24source in the vacuum chamber and pump down. Adjust the biasvoltage to its recommended value. Setthe gain of the amplifierso that.the strong peak from 241 Am falls about mid-scale inthe multichannel. Figure 4 shows a spectrum of 241Am whichindicates the two alpha groups that are seen if the multichannelhas enough channel capacity. If the 5.48 MeV alpha is placed atmid -stale of a 400-Channel analyzer, the two groups willonly be separated by 1.5 channels- and, hence, it is impossibleto show the separation seen in Figure 4. Nevertheless, forthis experiment- it is not necessary to show the separation.
Accumulate a spectrum for the 241Am source for a period of tilong enough to obtain about 1000 counts in the peak channel.Readout the multichanneland plot just the alpha peak as inFigure 4. Call the 5.48 MeV peak position channel Co.
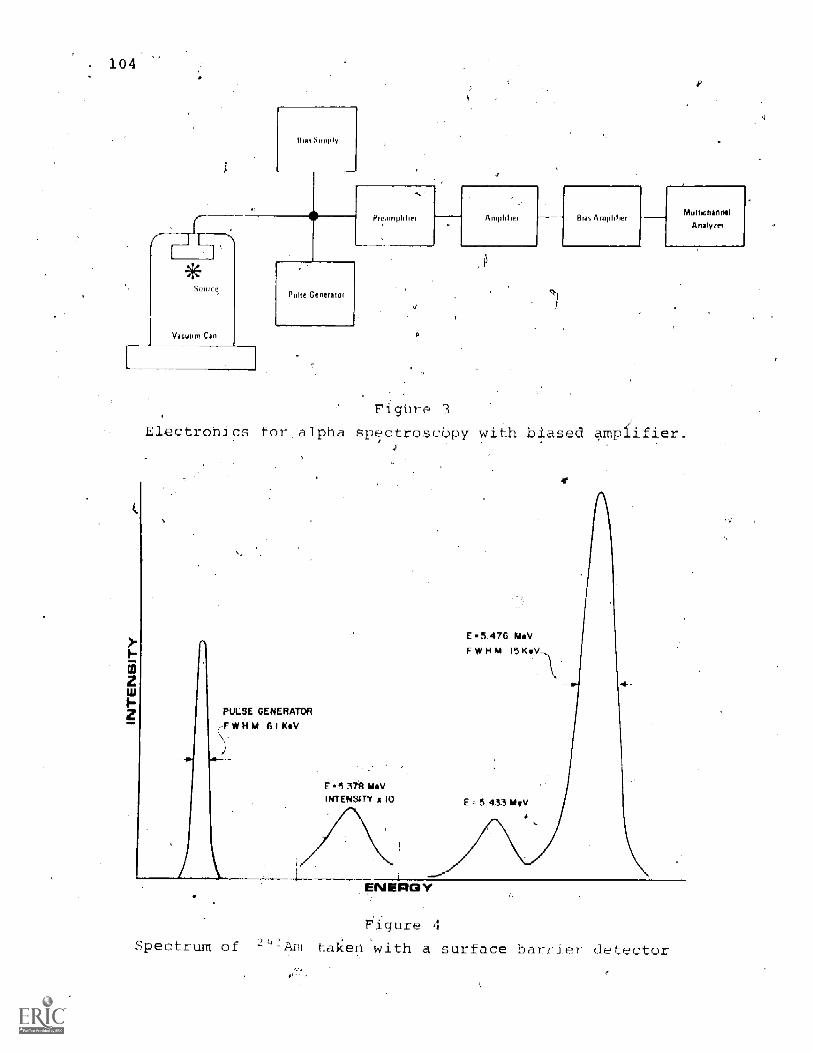
104
Source
Vacuum Can
Piihe Geriemlui
Preampfaler
FigUre 3
Amplifier
.Electrohics for.alpha spectroscbpy
PULSE GENERATOR
FWHM KeV
E5.3Te MeVINTENSITY 10
ula$ AmplifierMultochafinel
Analyzef
biased amplifier.
E*5A76FWHM 15 Ke
En 433 M V
2 t4Spectrum of
ENERGY
Figure 4
taken with a surface barrier detector
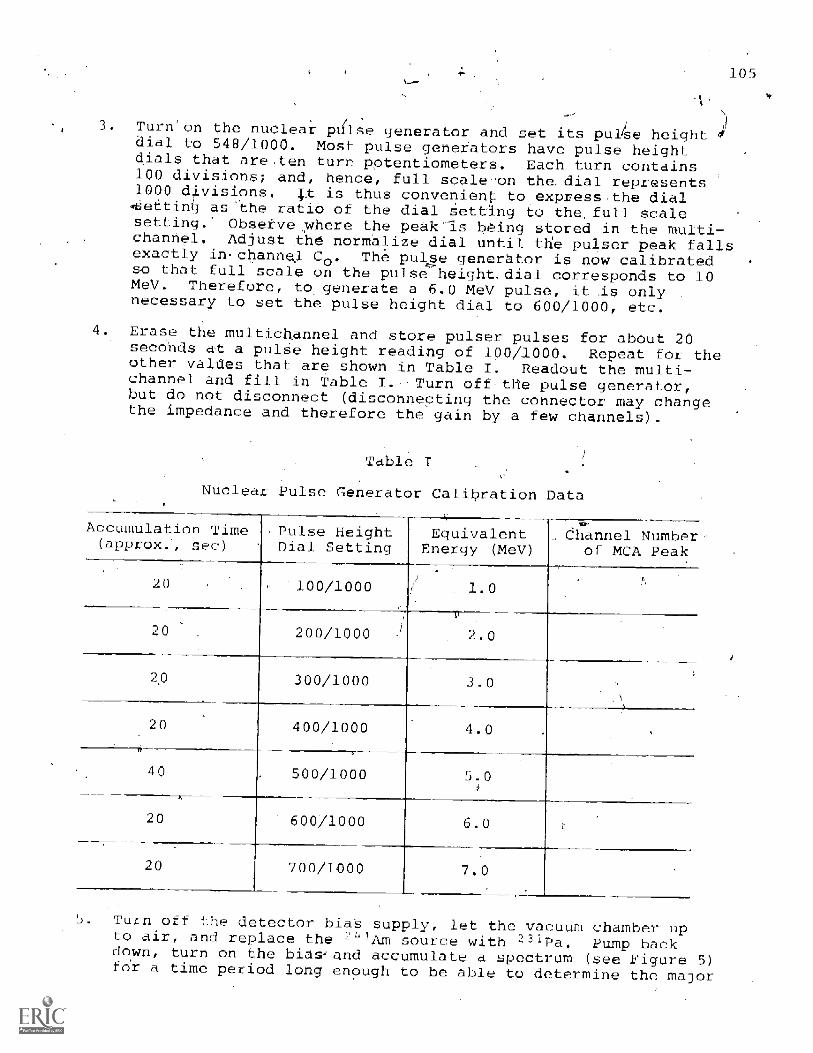
195
/Turn on the nuclear pulse generator and set its pulse heightdial to 548/1000. Most pulse generators have pulse heightdials that are,ten turn potentiometers. Each turn contains100 divisions; and, hence, full scale-on the dial represents1000 divisions. ;.t is thus convenient to express.the dial4Sefting as 'the ratio of the dial setting to the, full scalesetting. Observe, here the peak-is being-stored in the multi-channel. Adjust the normalize dial until the pulser peak fallsexactly in-channj Co. The pulse generator is now calibratedso that full scale on the pulse height. dial corresponds to 10MeV. Therefore, to- generate a 6.0 MeV pulse, it is onlynecessary to set the pulse height dial to 600/1000, etc.
Erase the multichannel and store pulser pulses for about 20seconds at a pulthe height reading of 100/1000. Repeat for theother valtes that are shown in Table I. Readout the multi-channel and fill in Table I.-Turn off,tHe pulse generator,but do not disconnect (disconnecting the connector may changethe impedance and therefore the gain by a few channels).
Table I
Nuclear Pulse Generator Calibration Data
Accumulation Time(approx.', sec)
Pulse HeightDial Setting
EquivalentEnergy (MeV)
Channel Numberof MCA Peak
20 100/1000 1.0
20 200/1000 j 2.0
2,9 300/1000 3.0
20 400/1000 4.0
40 500/1000 5.0$
20 600/1000 6.0
20 700/1900 7.0
Turn off the detector bia'ssupply, let the vacuum chamber upto air, and replace the 241Am source with 231Pa. Pump backdown, turn on the bias and accumulate a spectrum. (see Figure 5)for a time period long enough to be able to determine the major

106
Apeak positions in t. spectrum. Readout the multichannel Andfill in the channol,.pnsitiens as indieaied in IlAhlp 11.
5
300
200
100
Pa-2315.01 MeV .
Pa-2314.94 MeV
.
,
. P0-215
Pa-2314.72 MeV
Ra-223 + Th-2 75.71 1444W
Rn-2196.80
7.36
MeV
MV=111
=---..-----)100 200
CHANNEL NUMBER
Figure 5
Pulse height spectrum of 231Pa.
Table II
Alpha Peaks from a 23IPa Source(See Figure 5y
' Nuclide E1 (MeV) Theory Channel Number Ea Measured(MeV)
:2 3 'Pa 4.72
23I2a 4.94
231Pa 5.01
2 2 3Pa , 2 7Th 5..71
219Rn 6.80
:15130 7.36
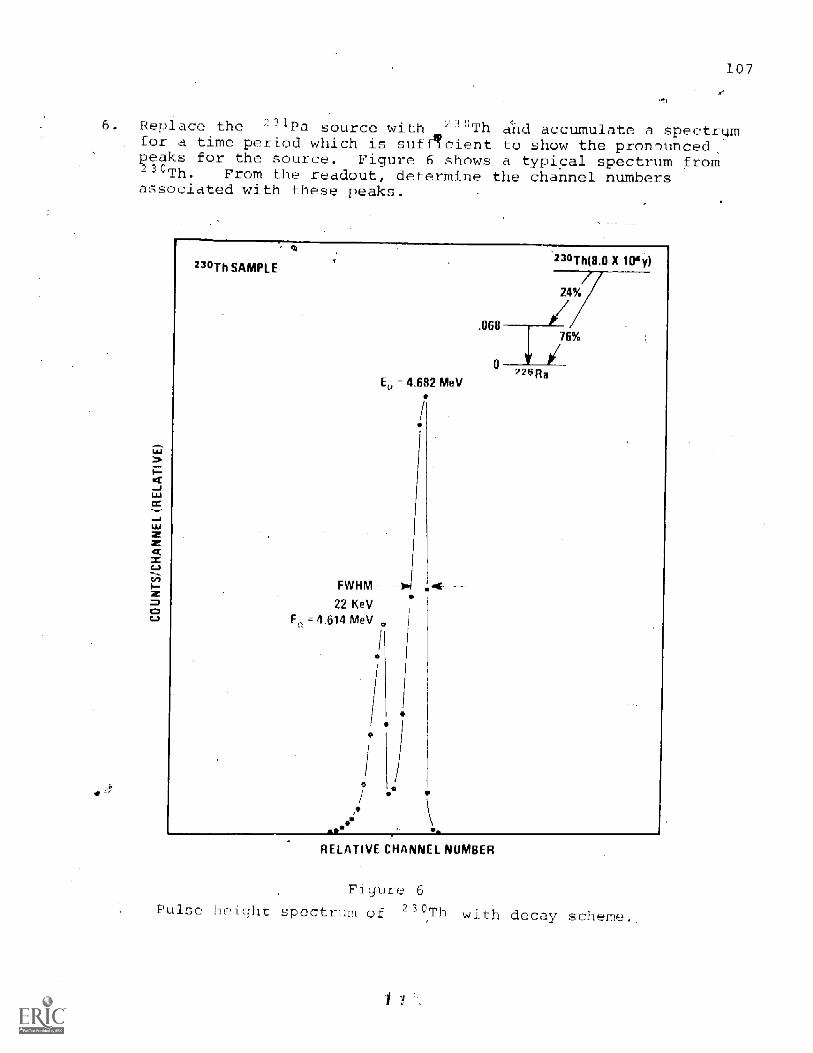
6. Replace the 23IPa source with 23°Th Ad accumulate a spectrfor a time period which is suff!cient to show the pronounced,eaks for the source. Figure 6 shows a typical spectrum from-3uTh. From the readout, determine the channel numbersassociated with these peaks.
LU
230Th` SAMPLE
FWHM
22 KeVEa = 4.614 MeV
0*
Ea = 4.682 MeV
a
_
.0
'30Th( .0 X 104y
2 26 R a
RELATIVERELATIVE CHANNEL NUMBER
Pulse he i <qht spect
Figure 6of 30Th ith decay scheme.
107
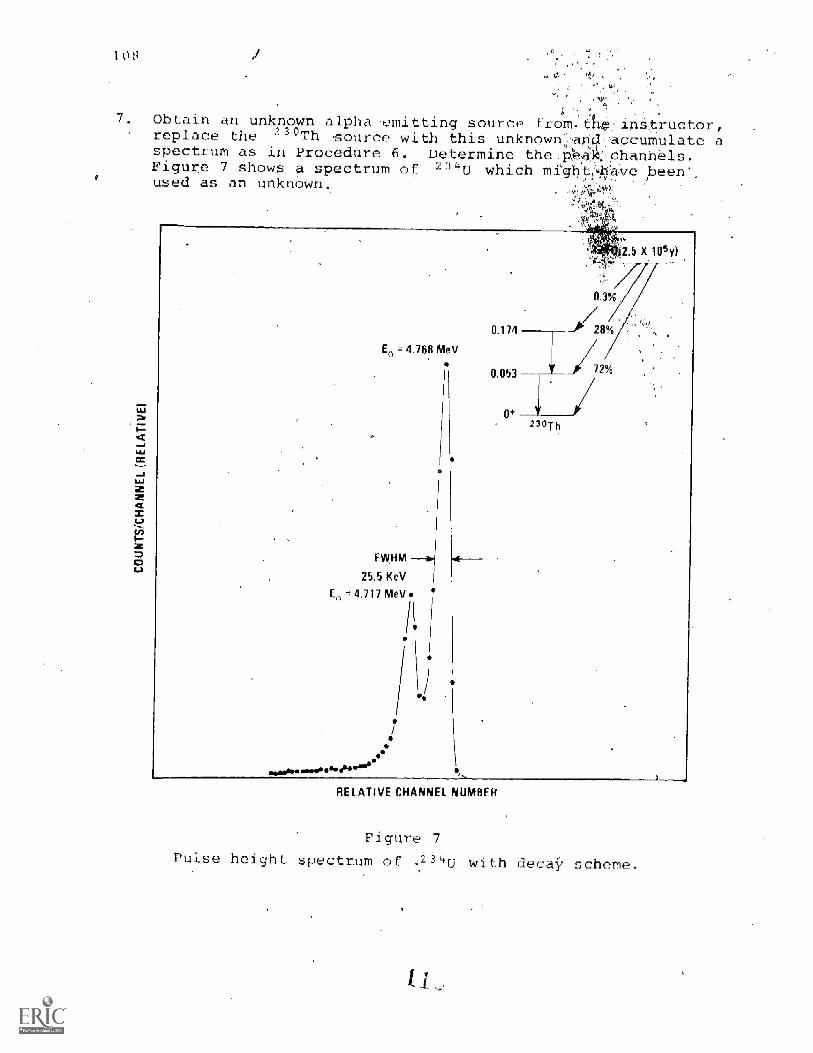
7. Obtain an unknown alpha emitting source from- instructor,replace the 2 3°Th source with this unknown and :accumulate aspectrum as in Procedure 6. Determine the 1*.ak:Channels.Figure 7 shows a spectrum of 2 3 4u which mightkia've been'.. -used as an unknown. ,,..
,r.--
LU
LU
=
E = 4.768 MeV
EWHM
25.5 KeV
4.717 MeV
I
30Th
RELATIVE CHANNEL NUMBER
Figure 7
Pulse height spectrum of 2 3 4u with deear scheme.

109
Optional (the use of the bias amplifier in alpha spectroscopy).Set up the electronics as shown in Figure 8. Place the 231Pasource in'the vacuum chamber, pump down, and turn on the detec-for bias voyage. Turn on the pulse generator and set itspuise-height dial to '450/1000. Set the gain of the biasamplifier at 1 and the bias level control 'on4the bias ampli-fier at 0/10f)0. Turn on the multichannel and visually observethe position of the ptllser peak: -It should be about mid-scaleas it,was in Procedure 3. Now, raise the bias level on theamplifier while visually observing the position of the peakon the multichannel. Continue raising this bias level untilthe pulser peak is being stored in the first few channelsWe have now biased out all nuclear pulses below 4.5 MeV. Setthe pulse generator for an 8 MeV output pulse (800/1000) andobserve where the pulse is being stored in the last fewchannels of the analyzer. The multichannel is now calibratedfrom 4.5 MeV to 8.0 MeV.
Alpha Snur
EWOupply
Puke A'rpe,,Ihrt
Pr pant AmplOier Bias Amp ijiCr WMtchannel
Analyzer
Figure 8
Electronics for alpha spectroscopywith biased amplifier
9. Erase the multichannel and store the 8 MeV pulse for about 20seconds. 'Set .the pulser at 7.5 MeV and store for 20 seconds.Continue for the other values in Table III. Readout theanalyzer and fill in the v es. Note, the peak at 700/1000was stored for 40 seconds 'rather than 20 seconds. The rea2,,nfor this is so that it can be recognized on the readout. Inother words, if you get mixed up in which peak is which, the-7 MeV point will help you since it has twice the counts ofthe other peaks.
10.' Turn off the pulse generator, erase the multichannel and storea -1Pa spectrum for a long enough period to obtain goodstatistics in the pronounced peaks listed in Table II.Readout the multichannel.

Table III
Calibration with a Nuclear Pulse Generatorand a Bias Amplifier
Accumulate Time(approx., sec)
Pulse-HeightDial Setting
EquivalentEnergy (MeV)
Channel Numberof Peak
20 800/1000 8.0
20 750/1000 7.5-
40 700/1000 7.0
20 650/1000 6.5
20 600/1000 6.0
20 550/1000, 5.5
40 500/1000 5.0
Data Reduction
Exercise (a)
From :the data collected in Table I, plot calibration curveof energy vs channel number. Figure 9 shows a typical calibrationcurve that was plotted for similar data. Determine the slope ofthe calibration curve. From the slope and the 241Am spectrumcollected in Procedure 3 determine the resolution of the alphagroup. Resolution is given by
R (EWHM)(Slope of Calibration Curve)
where the FWHM is the full width at half maximum of the alpha peak.In other words, it is the width in,channels of the peak at half ofits height. 1
Exercise (b)
From the calibration Curve and the readout of the 31Pa
ectrum in Procedure 5, fill in the rest of the data in Table II.

111
2`
100 200
ANNEl NOM0ER
Slope 75 KeViC
300
Figure 9
Calibration curve for charged particle detector.
How do your numbers compare with the accepted values in column 2for this source? Determine the resolution of each orthe groupsin Table 11.
Exercise
Determine the energy and resolution of the unknown alphaurce in Procedure 7 from your calibration curve.
(The rest of the exercises go with the optional portions of theexperiment Procedures 7 through 10.)
Exercise (d)
Plot a calibration curve for the data collected in Table III.Determine the slope of the calibration curve. Note that the slopeis quite different with this data as comparea----to- that which wasobtained in Table 'II. Figure 10 shows a typical plot for TableNote that in comparing Figures 9 and 10, the slope changed from25 keV/channel to 9.2 keV/channel. The bias amplifier, therefore,allov%rn one to look with better detail at a given spectrum.
Exercise
From the calibration curve in Exercise ( determine the energiesand resolution oftlthe pronounced peaks in the 2:11Pa spectrum collectedin Procedure 10.
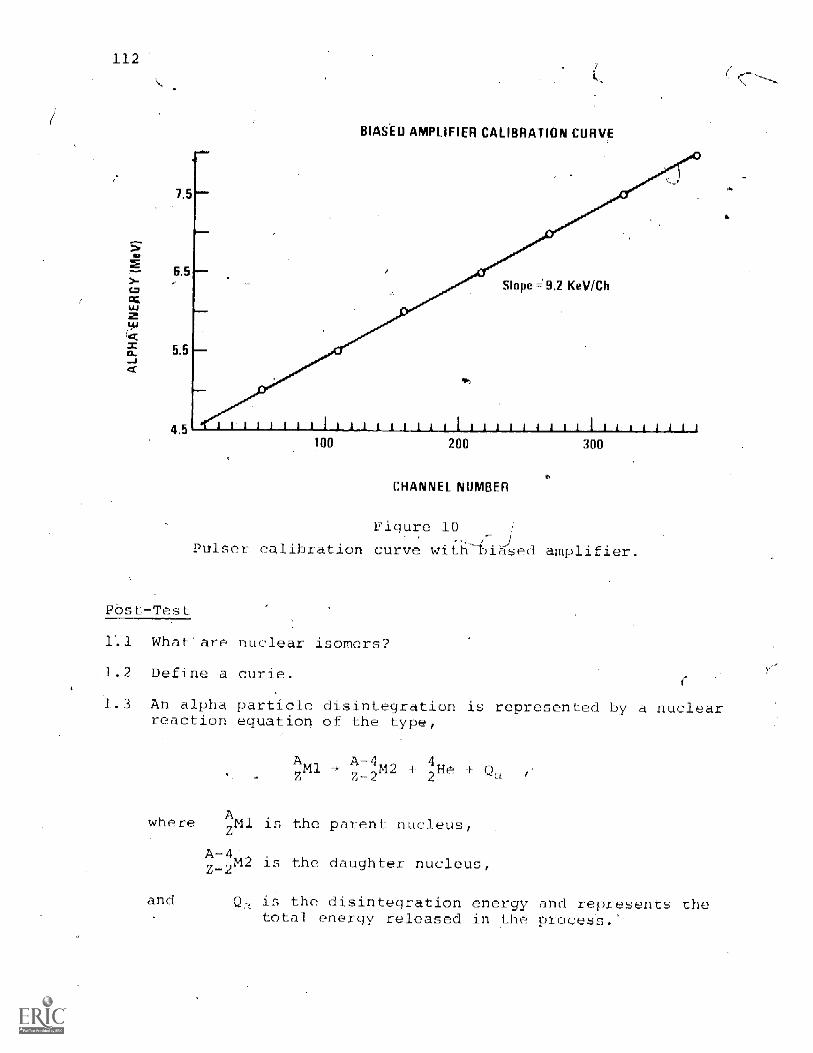
112
POs
What'are nuclear isomers?
.1.2 Define a curie.
7.5
55
BIASED AMPLIFIER CALIBRATION CURVE
Slope z 9 2 KeV /Ch
4.5 IA 1 I 1 1 1 lAj (I j100 200 300
CHANNEL NUMBER
Figure 10
Pirlser calibration curve with-biased amplifier.
\mow
1.3 An alpha particle disintegration is represented by a nuclearreaction equation of the type,
where
A A-4 4_M2 HnZ-2 2
A...isM1 s the parent nucleus,Z--
A-4_M2 Is the daughter nucleus,
and Qy is the disintegration energy and represents thetotal energy released in the procesS.
113
Evaluate the disintegration energyv,Q, in terms of the kineticenergy.of the alpha particle, E,, using the principles ofconservation of energy and meMentram. 'Assume that the parent----nucleus is 'at rest initially._
1.4 What are nuclear isobars
1.5 .Determine the nber of alpha article% per second emitted by5 mg (c) radiuma.nd express this number in,millicuries.
1.6 e Determine the amount o 210p0source of alpha particles.
necessary t_ rrovide a.- 3' mC ,t--f
y
S21-1ELLSLhIan
The program GAUSS-6 can be used to find the centroids of allthe peaks,and for the two calibration curves the slope can befound from LINEAR-6. Both of these programs are listed in theAppendix.
Additional References
1. J. L. Duggan, W. D. Adams, R. J. Scruggs, L. S. Anthony, Am.Journal of Physics, Vol. 35, p. 631 (1967).
2. B. L. Anderson, "Alpha Particle Thickness Gauge Using a SolidState Detector," Nuclear Instr. and Methods, Vol. 12, p. 11(1961).
H. C. Brill, H. E. Wegner, "Response of Semiconductor Detectorsto Fission Fragments," Review of Scientific Instruments, Vol. 34,p. 274 (1963) .
4. b. A. Bromley, "Nuclear Experimentation with SemiconductorDetectors," IRE Trans. in Nuclear Science, NS-9(3), p.135(1962).
4
Experiment 2
I112,2dy2tK and L hell Binln Energies-
Objective
To familiarize-the studen faith the use of solid state surfacebarrier 'detectors foonversion electron spectroscopy, to measurecanversion electron spectra and thus determine the K__and L shellbinding energies 6 207pb and 113In
Refe en es
1. K. Siegbahn, editOr, LkIEhA, Beta- and Gamma -RaVols. 1 and-2, North Holland Publishing Co.,
ectroscost-rdam, 1965.
2. G. Dearnaley and D. C. Northrop, Semiconductor Counters torNuclear Radiations, 2nd edition, Wiley, New York, 1966.
3. J. M. Taylor, Semiconduetir Particle Detectors, Butterwo ths,Washington, 1963.
4. ORTEC Instruction Ma-h-ua for Surface Barrier Detect and thebibliography at the end of the manual which contains 157references, avaifable from ORTEC, Inc., 100 Midland Road,Oak Ridge, TN 37830.
J. M. McKenzie, Index to the Literature of SemiconductorDetectors, availa71_77-rom Government Printing Office, NationalAcademy of Sciences, Washington, 1969.
_ M.'Lederer, J. M. Hollander, and T. Perlman, Table ofIsotopes, 6th edition, Wiley, New York, 1967.
Introduction
Many radioactive'isotopes that are used in chemical and medicalresearch decay by a process called internal conversion. In theinternal conversion process it is possible for an excited nucleusto give its energy of excitation directly to one of the closelyorbitinglectrons. Since nuclear energies are in general higherthan, for -ample, K-shell binding energies, the result is that theK electron knocked out of the atom. If the conversion processoccurs with a L-shell electron, then it is removed from the atom.In any case, internal conversion results in X rays. and conversionelectrons. If the energy of excitation of the nucleus is E, thenthe energy of the K-shell conversion elect-on is given by
He
(1)

Ea =renergy of the conversion electronhnd
Xab = the binding energy of the K-electron.
115
The values of Kab are listed in the back of this manual (CriticalAbsorption and Emission Energies).
1 the conversion process occurs with.an L electron, then theenergyof the conversion electron is given by
E FL
=e x Lab ,(2)
For many nuclei the quantity Ex is well known; and,. hence,Equations (1) and (2),can be used to determine the K-andL-shell,binding energies of the daughter nucleus. if Ex is'not known,
athen it can usually be determined by measuring the gamma-ray energy37asseciated with the decay. For example, 1 Cs decays by bdta
emission to the 662 keltlevel in "/Ba, which-then decays bygamma -rayemission or internal conversion. Hence, for a 137CS- source,one would see 662 keV gammas and K-internal conversion electronswhose energy-are 552 key minus Kab for 137136 (662 keV-36 keV=626 keV)..
Radioactive sources for internal conversion measurementsshould be specially prepared for this application. The sourceshould be thin and covered with a thin piece of Mylar.
Equipment
1. Radioactive Sources for Internal Conversion Measurements asfollows:
a)b)
c)
,55
10
jiCipci
pCi
137Cs2o7Bi
1.13Sn
Surface Barrier Detector: thickness (1000 microns), area (50mm2), resolution (15 Key for betas)Key for
High Resolution Pre-amplifier
Spectroscopy Amplifier'
5. Simple Vacuum *Can in Which to Make the Measurements
6. Solid State Detector Bias -nn-lv

Multichannel Analyzer ( -(1,400 channels)
Oscilloscope
Procedure
1. Set up the electronics as shown _in Fi_re 1. Place the '37Cs
source in the vacuum can and pump the system down until themechanical pump is quiet. Adjust_ the bias voltage to the valuerecolfmended for the detector. Set the gain of the amplifier --,,,
Ica
Varaum Ca
Palo Gimarataa
els Amp MitHaltichannai
A natylac
Figure 1
Electronics for conversionelectron spectra.
4
so that the output pulses from the 137Cs conversion line fallapproximately mid-scale on the multichannel analyzer. (SeeFigure 2.) Accumulate a spectrum for a time period longenough to determine the centroid of the 624 keV group. Callthis channel Co.
2. Turn on the pulse generator and adjust the pulse height dialto 624/1000.. This corresponds toH24 turns. Most commercialpulse generators have pulse height dials that are ten turnpotentiometers. Adjust the ,nbrmalize:dial on the pulse gene-rator until the pulser peak is being stored in the multichannelanalyzer at exactly channel Co. The pulser is now calibrated for1000 key full scale. Clear the multichannel and store pulser peaksfor about 20 seconds each for the pulse height values shown inTable 1. Readout the multichannel analyzer and record the channel.positions for the indicated groups. The system is now-calibrated.
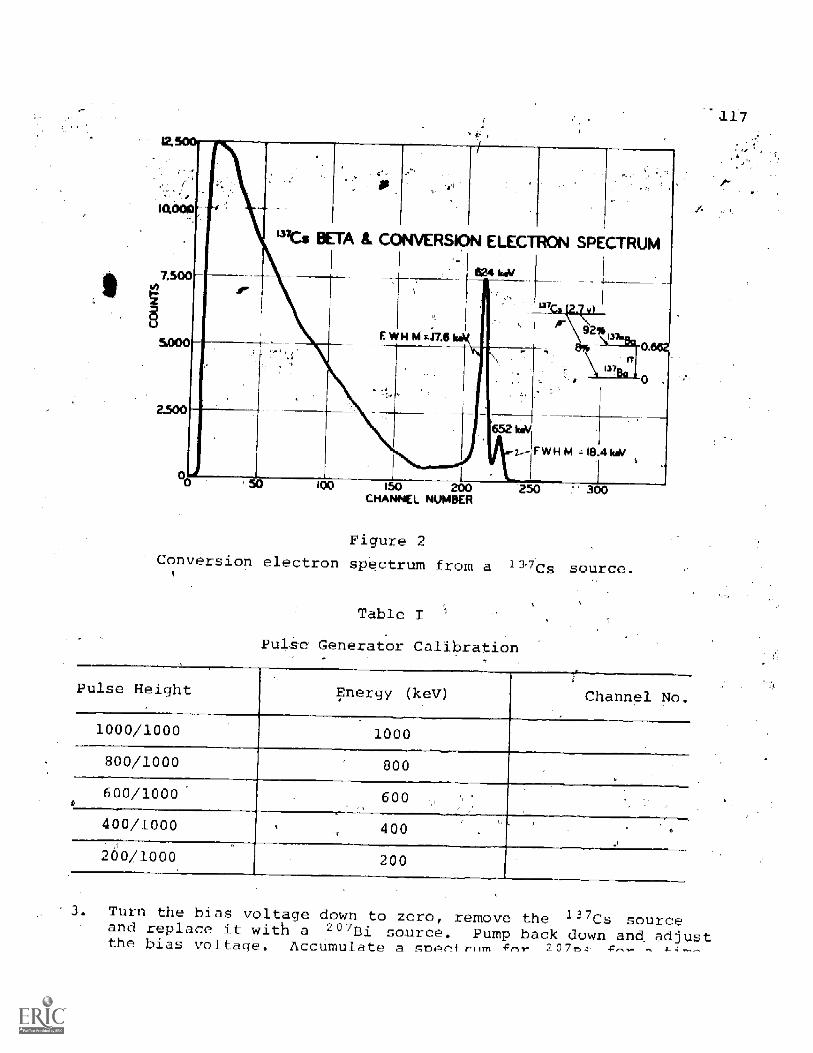
RSION ELECTRON SPECTRUM
1 2CHANNEL NUMBER
Figure 2
Conversion electron spectrum from a 137Cs source.
Table I
pulse Generator Calibration
Pulse Height Energy (keV) Channel No.
1000/1000 1000
800/1000 800
600/1000 600
400/1000 400
200/1000 200
117
Turn the bias voltage down to zero, remove the 137Cs sourceand replace it with a 297Bi source. Pump back down and adjustthe bias voltage. Accumulate a qnr4c7.Frilm fnr 20-7z

0 2CHANNEL NUMBER
Figure 3
Conversion electron spectra forr a 207Bk. source.
4 Remove the 2"Bi source and replace it with the 11 Isn source.Accumulate a spectrum for a long enough tithe-to get good statis-tics in the L conversion electron group. Readout the multichannel.Figure 4 shows a spectrum that was taken for a 113Sn source.
Data Reduction
Exercise (a)
From the information recorded in Table 1, plot a calibrationcurve energy versus channel number. An example of such a plot isshown as the straight line in Figure 3. The ordinate is labeled asenergy on the right hand axis. TheiSlope of the calibration was2.71 keV/ch for that amplifier gain setting. Determine the slopeof your calibration curve.
Exercise

_ E RUM
H
EC _0-392
ii0
H =I
7INAYI
FWH .
I 2
150(
5
R
Figure 4
Conversion electron spectra for a 3Sn source.
Resolution = (FWHM) (Slope of calibration curve)
= and the MIT_ is the number of channels across the half height ofthe peak.
Exercise (c)
From the calibration curve and the readouts takenand 11 3Sn fill in Table II.
Exercise (d)
or 2 ° 7Bi
Lid
From Equations (1) and (?) and, the data in Table II, calculatethe K -arid L-binding energies for 11 3in ana 2°77Pb. In doing this111

0.
--NTable IT.,
.
Source Conversion Line (key) Measured Energy(key)
07Bi 1047
207Bi974
2o7BiS54
2o7Bi489
113sn387
1I3Sn 363 -..-
Exercise (e)
Calculate the difference in binding energy between theand L shell for :113In assuming that you don't know the energyof excitation Ex; (Hint: write 'out Equations (1) and (2) anddetermine what has been-experimentally determined.) Repeat forthe two pairs flf conversion electrons for 207Pb.
Exercise (fl=
The ratio of conversions to the K and'L shell for a givennudleus can be determined simply by summing under these variousgroups. and then taking the ratio of the sums. Find these ratiosfor all the conversion spectra that were measured.
Post-Test
2.1 137Cs decays by beta decay to the 0.662 MeV level of 137Bawhich decays by gamma-ray emission or electron conversion.What are the kinetic energies of the K-and L-shell conversionelectrons?
2.2 The 1062 key gamma rays from 2°78i are incident upon a pieceof uranium. What is the kinetic energy of the ejected K-shellelectrons?
Computer Pro a
entroids of the peak g. LINEAR-6 can be used to obtain a leastsquares fit, the calibration,dhta-in Table I.
Additional References
1. W. J. Price, Nuclear Radiation Detection, 2nd edition, McGraw.Hill, New York 196
Radiolo ical Health Handbook, U. S. Department of Health,E ucation, and Welfare, PH5 Publication, 2016, Washington,1970.
G. Dearnaley and A. B. Whitehead, "The Semiconductdr SurfaceBarrier Detector for Nuclear Particle Detection," NuclearInstruments and Methods, Vol. 12, p. 205, 1961.
R. S. Bender, I. B. Williams and K. S. Toth, "Apparatus forMeasuring Spectra of Radioisotobis with Half-Lives of From1 Sec to 1 Milli-second," Nuclear Instruments and Methods,.No. 40, Vol. 2, p. 241.
121
122,
Experimen 3
Al ha particle Time-of- Fli-t E- i_ent
Objective
'o familiarize the student with "mate -of- the -art" nucleartiming-apparatus:by Measuring the flight time of an alpha particleover a given pathlength.
References
1. G. Dearnaley and D. C. Nbrthrop, Semiconductor Counters forNuclear Radiations, 2nd edition, Wiley, New York, 1966.
2. J. M. Taylor, Semiconductor Partic Detectors ButterwoWashington, 1963.
3. F. S. Goulding, "A Survey of the Applications and Limitationsof Various Types'of Detectors in Radiation Energy Measurement,''IEEE Trans. Nucl. ci., NS-11(3), 177 (June 1964) .
G. Dearnaley, "Nuclear Radiation Detection by Solid StateDevices," J. Sci. Instr. 43, 869, 1966.
J. H. "McKenZie, ,Index to theiAterature of SemiconductorDetectors, Government Printing office, National,Academy ofSciences, Washington, 1969.
Introduction
In this manual there areseveral experiments that use siliconsurface barrier detectors in a rather straight forward manner tostudy alpha particles, conversion electrons, or beta particles.
The recent advent-of the thin transmission surface barrierdetector makes other experiments, as well as the, one describedherein, possible. The transmission detector is a totally depleteddevice which wil give an output pulse whose magnitude is propor-tional to the en-rgy deposited in the detector by the .chargviparticle being studied. For example, if a 7.36 MeV alpha Otirtici.goes through a transmission detector which is 26 microns thick, itwill lose energy (AE) of approximately 3.61 MeV.- Hence, theenergy of the 7.36 MeV alpha will be reduced by the specificenergy Loss (dE /dx) in silicon of 3.61 MeV.: The alpha particlewhich then emeisges from the back of the AE detector will have anenergy of 7.36 MeV minus 3.61 MeV or 3.75 MeV.

123
the thin transmission detector (LE). to another detector which we willcall the (E) 4tector. The physical arrangement for thisexperiment is 'shown in Figure 1.'
Vacuum Pump
The Main Vacuum Tube.is 2" Aluminum Tubin
6Detector
a
Source--wv-Eo
.-"--N.,-..--wswEf
)-------E Detector (Movable)
To AE Pre Amp
4Figure 1
Physical arrangement for alpha particle time-of-flight experiment.
Equipment
1. Vacuum Chamber (see Figure 1.
2. AE Surface Barrier Detector: area (50microns Or less), resolution (20 key),
, 3. E Surface Barrier Detector: area (100microns), resolution (25 key)
4. Detector Bias Supplies for the Two De
5. Nuclear Pulse Generator
thickness (26t a smission mounted
, thickness (100
sectors
6. Two Electronic Time Pick-off Units and Controls
7 Two,High Resolution Pre-amps for the Detectors
8. Two Spectroscopy Amplifiers
9. 50 Ohm Delay Box (0-50 nsec)
10. TiMe-to-Pulse-Height Converter
11. Sum Delay-Amplifier
12. Multichannel Analyzer (400 channels

-124
Procedure
1. Set up the electronics as shipwil in Figure 2. The time pick-offunit derives a signal from the detector which is fed into thetime-to-pulse-height converter (TPHC), The TPHC can be con-sidered as an electron clock. It produces an output pulsewhose magnitude is proportional to the difference in timebetween its start and the stop pulse. Simply speaking, whatis done in the experiment is start the TPHC with the AE pulseand stop it with the E detector pulse. The TPHC thus measuresthe flight time of the alpha particles between the two detectors.The output of the TPHC is amplified, and fed into a multichannelanalyzer. Before -the alpha particle measurement is made, it isnecessary to calibrate the TPHC. This is done with the nuclearpulse generator., Feed its output' simultaneously into both theAEand,E,time pick -off unit inputs. get the delay shown inFigure 2 at 5 nanoseconds and determine the position of thepeak in the multichannel analyzer (MCA). Repeat for the othervalues of delay shown in Table I and fill in the Peak channelpositions for each delay. After this measurement has beencompleted, set the delay back to zero.
Table
Delay Versus Pulse Height Data
Delay n sec. Peak Channel Position
5
10
15
20
25
30
2 Place the AE and- E detectors about 2 cm art (1.65 cm wasused in the data that will be ,shown). Pump the system downand apply the recommended bias voltage for each detector.Accumulate a spectrUm for a time period long enough to get
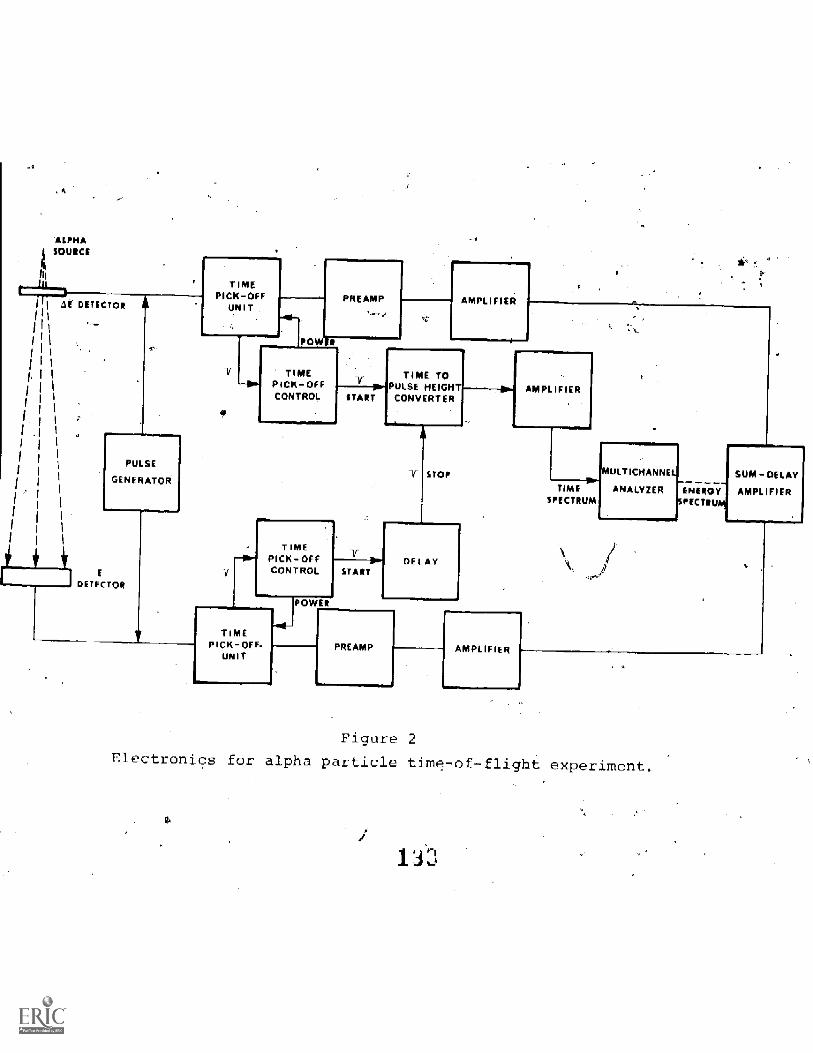
ALPHASOURCE
AE
Ih
TECT011
PULSE
GENERATOR
DETECTORI
TIMEPICK -OFF
UNIT
V
PREAMP)
OW111:
TIMEPICK -OFFCONTROL
*LW
TIMEPICK OFFCONTROL
TIMEPICK - OFF.
UNIT
YW
"TART
-v=
START
AMPLIFIER
TIME TOPULSE HEIGHT
CONVERTER
OP
DELAY
PREAMP
AMPLIFIER
AMPLIFIER
TIMESPECTRUM
MULTICHANNEL
ANALYZER ENERGYSPECTRUM
SUM - DELAY
AMPLIFIER
Figure 2
Electronics for alpha particle time- --flight experiment.
1 33
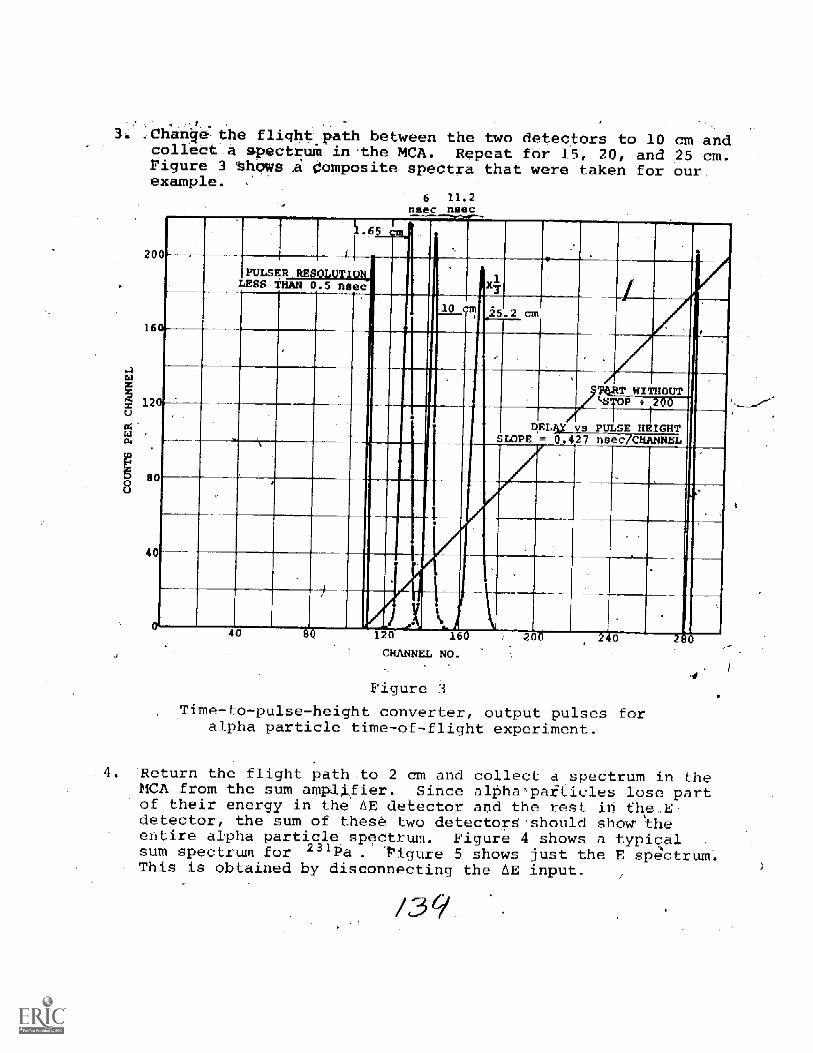
Change the flight path between the two detectors to 10 cm andcollect a spectrum in the MCA. Repeat for 15, 20, and 25 cm.rigure 3 Shows composite spectra that were taken for ourexample.
20
16
12
4
6 11.2nsec nsec
PULS ER RESOLUTION
I ll
10 25.2 cm
I
LESS THAN 0 . 5 a
111111 11
DE
74RT WIMOUTII II IIS
4'5 P i 200
11
I 1111 IllsI 1 11411M
vs PULSE HEIGHT= .427 nsec CHR1MELPE 0 /
m,
Iiiillin11 1
40 120 6 0
CH- NO.
Figure 3
Time-to-pulse-height converter, output pulses foralpha particle time-of-flight experiment.
4 Return the flight path to 2 cm and collect a spectrum in theMCA from the sum amplifier. Since alPhaparticies lose partof their energy in the AE detector and the rest in thp-Edetector, the sum of these two detector8'should show theentire alpha particle spectrum. Figure 4 shows a typialsum spectrum for 231Pa . figure 5 shows just the E spectrumThis is obtained by disconnecting the AE input.
/39

Data Reduction
I..CNANNIL MUNIMEit
Figure 4
Sum spectrum (E AE) for 2311 a
In this experiment the time of flight of the highst energygroup in 231Pa is being measured. The other groups were biasedout with a threshold discriminator on the time pick-off Control.These 7.36 MeV alphas leave the AE detector with an energy of%3.75 MeV. An alpha of this energy has -a reciprocal velocityof 75 nsec/meter. A flight path of 10 cm would give a timedifference of 7.5 nsec which is quite easy to measure withthe TPHC.
Exerdise (a)
From the data collected in Table I plot a delay Versus pulseheight. curve. This plot should be a traight line. The slope ofthe line in nsec/channel gives us a measure of our time reso-lution. Determine the sloop frnm r,,,r 91}-1
127

128
1010
a
a
CHANNIL NO
Figure 5
Pulse height spectrum from the (E) detector.
The time resolution of a,peak is determined by multiplyingthe slope of the calibratiorl=curve times the FWHM of the peak..Determine the time resolution for the peaks in Table I.
129
Exercise (c)
The first alpha time-of-flight path length was 2 cm, thesecond was made for 10 cm. The path difference (Ad) between thetwo runs was therefore 8 cm. Determine the difference in thechannel position of the peak for:these two runs. Call thisnumber AC. Obtain the corresponding At by the following;
1) At s (AC) (slope of the calibration curve)
Determine the reciprocal velocity of the alpha group as follows:
2) 1/v = At/Ad
The accepted value for the group was 75 nsec/m. Determinethis value for the other path length differences used in theexperiment. From all of the data taken, calculate an averagereciprocal velocity.
Post -Test
3.1, Derive an expression for the flight time of an alpha particlein nsec in terms of it- kinetic energy and distance of travel.
Com uter Pr ocrams
GAUSS - 6 can be used to find the centroids for the timecalibration of the multichannel. LINEAR-6 can be-used to fitthe time calibration data and accurately establish the slope ofthe curve which is very important for this experiment.
Additional References
1. J. W. T. Dabbs and F. J. Walter, "Semiconductor Nuclear ParticleDetectors," National Academy of Sciences-National ResearchCouncil Publication 871, Washington, D. C., 1961.
2, Hans Bichsel, Phys. Rev, 112, 1089, 1958.
3, Ward Whaling ch der P.-sLik, 34, 193 -217, edited byFlugge (Springer-verlag, Berlin: 1958).
4. J. B. Marion, 1960 Nuclear Data Tables, Part 3, Nuclear ReactionGraphs, Superintendent OT Documents, U. S. Government PrintingOffice, Washington, D. C.
R. E. C1 ase, Nuclear Pulse Spctrometry, McGraw - ill, 173, 1961.
7 J. H. Neiler and W. M. Good, Fast Neutron Ph sits, J. Marionand J. Fowler, editors, Inter pence, 196 .
M. Bonitz, Nuclear instr._and Methods, 22, 238, _196-
ANSWERS TO QUESTIONS AND PROBLEMS
Pre -Test Ans
1.1 The force is given, by the familiar coulomb's law for pointcharges,
1
4ilco
q q
r
131
where qi and (1,-wre the electronic charges, rjs the distanceseparating the two electrons and p_is the permittivity of free,space and has the value
= 8.854 x 10⁻¹² coul-
F (1.6 10-19 cou4 854 x 14.1
9.2 10-
1.2 The nuclear coulomb barrier height is defined as the pointwhere the coulomb barrier reaches a maximum value. Thisoccurs at the nuclear surface of the atom of copper. Themaximum height of the barrier is given by
(Ze) (ze)
where- Ze is the nuclear charge of the copper atom, ze is the-incident proton charge, and R is the nuclear radius of copper.
R = 1.2 x fermis
1.2 (65)
4.82 fermis
Multiplying both the numerator and denominator by Planeconstant divided by 231 and speed of light; (he
13Zz 0- 4410
crie ge

2
substituting
e2 1= the fine structure constant, a
and
= 197.32 Me'' - fermis
(29) (1) 142 fermis 1.77
- 8.76 MeV
197.32 MeV fermis)
2gl An electron volt is the kinetic energy acquired by_ an,electronwhich is subjected to a potential difference of 1.0 volt.
2.2 keV = 103 eV
MeV = 106 eV
GeV = 109 eV
Post-Test Answers
1.1 Different energy states of the same nucleus. An isomericstate differs from an ordinary excited state of a nucleusin that it .lasts for a measurable time.
1.2 A curie is a rate of decay and is equal to 3.7 x 10¹⁰ dis-integrations per second. It was.originally based-on therate of decay of a gram of radium.
1.3 By the conservation of momentum, if an alpha particle isemitted of mass M and velocity V, the residual atom ofmassM2 Will recoil with_a velocity V2.-
MV = M2V2
is the total energy released. and equals
Qa = 1/2142(72)2 HMV`
where HMVis the kinetic energy of the c particle, Ea.Eliminating V2 from the above equations And substitutingE for the A particle energy gives

To a very close approximation we can replace the ratio gfthe masses by the ratio of mass numbers
M 4
M2 A-4
and the disintegration energy can be written
a EA41,4 Nuclei which have the same mass number, A, but different
atomic numbers, Z, are called isobars. Isobars are commonlyproduced in beta decay.
1,5 1 gm of radium produces 3.7 x 10¹⁰ alpha particles per secondand has an activity of 1 curie by definition.
NSmg_1000 mg 3.7 1010 diiiintéirationth per second
N 1.85 x 100 disintegrations per second
If 1 gm of radium has an activity of 1 curie, 5 rrig wouldhave an activity of 5 millcuries
1.5 A 3rnCi source has an activity àf 3 10 x (3.7 x 10°)or 11.1 x disintegrations per second. The number ofatoms of a radioactive isotope, dN, that will decay in asmall interval of time, dt, is equal to the number of atomspresent times the decay constant of the material:
dNANdtRewriting,
1 dNNdt
whero dN/dt is the activity of the 'sample and is equal to
= ll!1 disintegrations per second
Now
m=1 -1,,.1 -
T ci.693
133

134
N1211F2'' 5,400 seconds
days
= 1.92 x 10¹⁴ atoms
The number ofexpression:
11.1 107 disintegrationsec
of 218Po can be determines from the following
m(gm) = NA
where A is the atomic weight of 2 °Po and NA is Avogadro"number.
m = (1.92 x 10¹⁴
or
= 6.69 10-8
(210 ---21L)at
atoms(6.024 x 10²³ gm at we
m = 0.067'ng
2.1 Ek = 661.6 keV Kab
= 661.6 key - 37-4 keV
= 624.2 key
EL= 661.6 keV L
ab
= 661.6 key - 5.6 key
= 656.0 key
2.2 key-kE_ = 1062 kY K
ab
= 1062 key - 115.6 keV
= 946 keV
3.1 The kinetic energy of an alpha particle is given by :
E llv-
Rewriting, one obtains
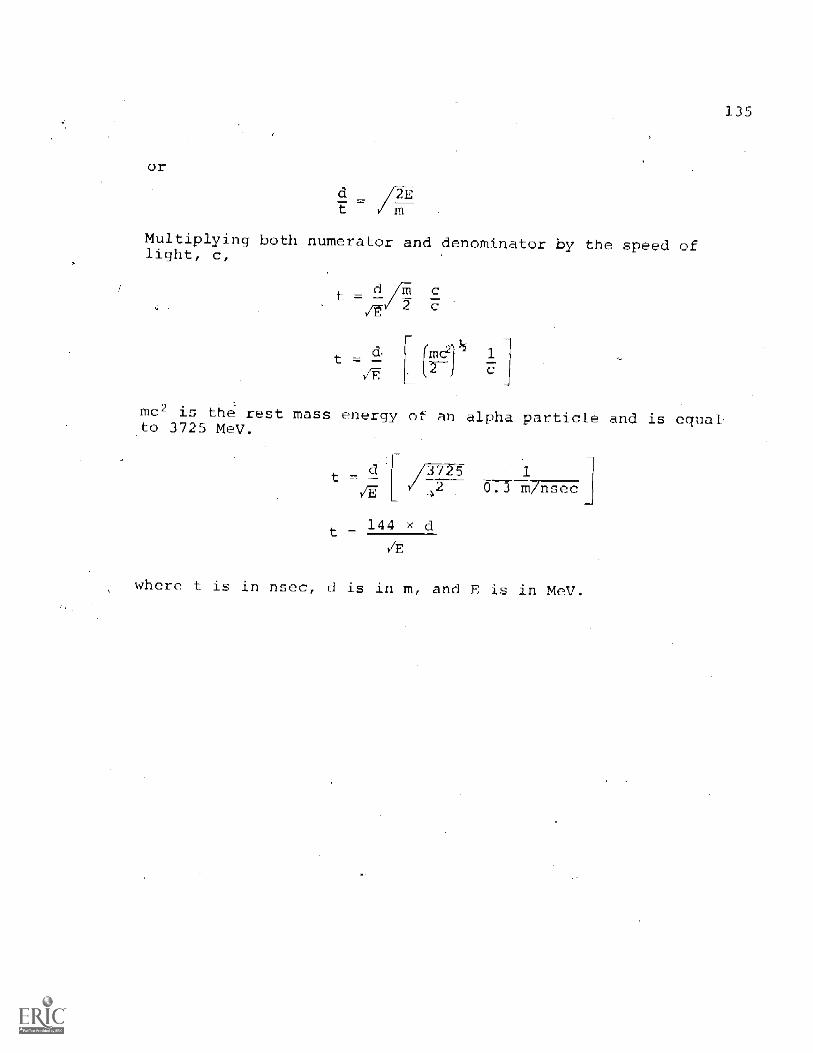
or
Multiplying both numerator and denominator by the speed oflight, c,
135
mc2 'is the rest mass energy of an alpha particle and is equalto 3725 MeV.
t
t144 x d
v/f
where t is in nsec, d is in m, and E is in MeV.

137
MODULE THREE
NEUTRON ACTIVATION ANALYSIS
A Module on Neutron Activation AnalysisUsing Fast and Slow Neutron Sources
INTRODUCTION
Neutron Activation analysis was begun in the late 1930's.Since then it has become a very powerful technique for bothqualitative and quantitative elemental identification.
Basically, a sample is irradiated by neutrons and becomesradioactive. By measuring the betaI, gamma rays produced, andthe half lives of the components of the sample, the elementalcomposition and their concentrations may be determined.
Neutron activation is normally produced by means of naturalradioactive sources, research reactors or neutron generators.
It is about 10 times more sensitive than other techniquesof analysis such as mass spectroscopy and is comparable insensitivity to X-ray fluorescence for some elements. For thisreason, activation analysis is used extensively in such fieldsas geology, medicine, chemistry, metallurgy, and the petroleumindustry.
This module consists of three experiments which may be per-formed by the student. The first experiment explores the useof thermal neutrons from radioactive sources for activationanalysis. The second experiment investigates the use of fastneutron fluxes from an accelerator or radioactive sources.Identification of an unknown by neutron activation techniquesis the subject of the third experiment.
Following this introduction are the objectives for the module,a list of preregnisites which the student should have before attempt-ing this module, ancta theoretical section which discusses some ofthe basic concepts of radioactive decay.
OSJECTIV
To familiarize the student with the techniques used in neutronactivation analysis; to measure the flux from fast and slow neutronsources; and to determine the:qualitative and quantitative aspectsof an unknown sample by neutron activation analysis,
138
QUISITES, WITH PRE-TEST QUESTIONS AND PROBLEMS
1. Characteristics of Electromagnetic Radiation:
a) Relationship between wavelength, frequency, and velocity.b) Relationship between energy and frequency of radiation;
Planck's constant.
1.1 If the emission spectrum of Nal has a maximum at 4100 angstroms,what frequency does this correspond to?
1.2 What is the energy of the radiation in electron volts corres-ponding-to this maximum in the emission spectrum?
2. Electron Volt (eV), keV, MeV:
2.1 How is the electron volt defined?
2.2 How is the eV related to the keV, MeV, GeV?
Interaction of Electromagnetic Radiation with Matter:
a) Photoelectric effectb)-Compton effectc) Pair-production process
3.1 What is the maximum klinetIc energy of an electron ejectedfrom the surface of a metal if the work required to freethe electron from ghe surface is 6 eV and ultraviolet lightof wavelength 150 A is used to illuminate the surface?
3.2 Would the 1013 key gamma ray from 27A1 have a very largeprobability of interacting in a Nai detector by means ofthe a) pair-production process?, b) photoelectric effect?,or c) Compton effect?
THEORY
Gamma-Ray Scintillation Detector
Gamma radiation is detected in the scintillation phosphor bymeans of three processes: the photoelectric effect, the Comptoneffect, and electron-positron pair production. The scintillationphosphor converts ,the energy deposited in the detector by theincident ionizing radiation into light emission. The emittedlAght is allowed to imninao nnrn A Qc,c44-,y
1394
The most desirable characteristics of a luminescent materialare 1) a higher density for greater absorption of gamma rays,2) increased pulse height for detection of low energy interac-tions, and 31 short decay times for fast counting and fast timingapplications. NaI isrthe most commonly used inorganic scintilla-tion phosphor primarily because of its large light output per unitenergy deposited. Because of its extensive use, calculated effi-ciencies of NaI crystals are readily available (see for example,"Calculated Efficiencies of NaI Crystals" hV E. A. Wo4cki,R. Jastrow, and F. Brooks, NRL Report 4833).
Rate Radioactive Decay
The rate of decay of a radioactive isotope is a constant fora particular material. The number of atoms, dN, which will decayin a time interval, dt, is equal to the number of atoms, N, presentat the time, t, times the decay constant for the material.
,integrating, one obtains
= ANdt
-X tN e
where No is the number of atoms present at time t = 0. The numberof atoms present at any given time decreases exponentially if nonew atoms are produced.
At the end of a certain time interval, called the half-lifeof the radioactive element, half of the atoms will have decayed.This time interval may be determined by setting N N0/2 andt tt, with the result
Qn 2
0.693
The mean lifetime of the radioactive isotope is defined as
tk
and is just the reciprocal of the decay constant.
Activity o _ a Radioactive Source

140
of a gram of radium. More convenienare the millicurie (1 mCi 10-3 cirri(11JCi 10-6 curie).
submultiples of the curieand the microcurie

141
Experiment 1
The Study of The -al Neutrons b Activation Techni ueu
Ob'ective
To accurately measure the thezrnal flux of neutrons from anisotopic neutron source or '252Cf source; to study the parametersassociated with the buildup and decay of radioactivity; to measurethe thermal neutron cross section of an isotope.
References
1. L. K. Curtiss, Introduction to Neutron Physics, D. Van NostrandCo., Inc., New York, 1959.
2 W. S. Lyon, A Guide to Activation An D. Van Nostrand Co.,Inc., New York, 1964.
J. M. A. Lenihan and S. J. Thomson, editors, Act lytignAnly!-Principles and Applications, Academic Press, 1965.
4 C. M. Lederer, J. M. Hollander, and I. Perlman, Table ofCT heIsotopes, 6th edition, Wiley, New York, 1967.
Introduction
In this experiment we are going to study a subject which verybroadly fits the name activation analysis. If a sample is intro-duced into a region where there is a thermal neutron flux (n/cm2-sec),the sample could absorb neutrons and become radioactive. The mostpronounced absorption process for thenual neutrons is the so-called(n,y) reaction. Essentially what happens to an atom Ai is thefollowing: it absorbs a thermal neutron and then finds itselfquite unstable. The resultant radioactive nucleus promptly emitsa gamma and is still radioactive. From a nuclear equation notationthe following happens:
Al n -4- Al** -4- Al (1)
When we remove our sample from the neutron flux, the radioactiveatoms in the sample are of the type Al*. For-most radioactiveatoms produced by this method, the most probable mode of decay isby beta emission promptly followed by gamma emission. Hence,measurements made on Al* can either be made with a GM counterfor the betas, or a gamma scintillation counter. In this experi-MOrlf" WA
142
The yield from an activation is
(2)
whereAA = initial disintegrations second of the whole element in
where
the sample when the irradiation stops, i.e., at T = 0.
= isotopic cross section for the reaction (cm2).
m s mass of the target element (gms).
Avogadro's number - 6.02 x 10²³ molecules/mole.
= neutron flux (neuts/cm2-sec).
a fraction of target isotope in the target element.
W atomic weight, and
S = saturation factor (1 - -At
= decay constant = 0.693/T- and T is the half life ofthe isotope
t = time of irradiation, same units as Tv
The activation relation requires that A0, the initial disintegra-tion rate of the activated-sample, be obtained. The sample activityis decaying during the period of measurement, and hence A0 mustgenerally be computed from the measurements. Moreover, a waitingperiod is frequently necessary because of the presence of unwanted,short-lived activity. If a sample is 'irradiated and then carri0to a detector, some of the activity was lost in this process. Letcall T = 0 the time that we terminate the irradiation, T1 thetransfer time, and T2 the counting period-plus Tl. T2 is thecounting time period plus T1 since it really is the total clocktime after T =, 0. Therefore, T2 T1, and counting time (same unitsof time). Then the number of disintegrations during the counting'period is given by
N No(e-ATI e-ATd ( 3 )
where No i the initial number of radioactive atoms at T = O.
T r.

where
(E-6Nd
the measured peak efficieilcy of the detector and
(4)
Fy is e fraction of gammas per decay. Values of Fy can beobtained from Reference 4.
Now all of the quantities in as J3) and (4) are known except NoHence, No, the initial number of radioactive atoms is given by
but
-6) 1
EFy -ATe
(5)
A0 AN0 (6)
therefore, A0, the initial number of disintegrations per -..,econdis experimentally determined and can be plugged back into Eck (2)as a known quantify.
Therefore, if ye take a known sample and irradiate it for -a
given length of time and count for a known time, we can experi-mentally determine 1), the neutron flux associated with the sourceand irradiating facility.
Equipment
1. Slow Nutron Source and Irradiator Facility
2. Nai Detector and Photomultiplier Tiabe
High Voltage Power Supply
4. Pre-amplifier
5. Spectroscopy Amplifier
6., Multichannel Analyzer (20C) bannels)
7. Aluminum and Vanadium Samples to ( O..depending on flux)
= each
143
0
Calibration Sources as follows: 3 IACi Cs, 5 Co*
nrile ft,f,

144
Procedure
I Set up the electronics as shown in. Figure 1. Adjust the highvoltage to the value recommended by tkle manufacturer. Setthe gain of the amplifier so that the calibration range willallow you to measure 2 MeV full scale. Make an enery versuschannel number calibration with 6°Co, 137C8, and r.
SourceNaI Detector
HV Power
Supply
Figure 1
e-amp
Electronics for Gamma Scintillation Spectrometry
Multi-channelAnalyzer
2. Place an aluminum sample in the irradiator and irradiate itfor 5 minutes. Terminate the activation and place the samplein the counting position. Wait an additional 1 minute-from ter-mination and then count for 2 minutes. From our definitionsin the introduction:
t = 5 minutes
T1 = 1 minute
T2 = 3 minutes
Figure 2 shows a typical spectrum that was collected underconditions similar to those just outlined. The cross sectionfor the 27A1(n,Y) 28A1 reaction is 0.210 barns.
3. Activate the sample of vanadium and count it, using the followingparameters: t = 5 minutes, T1 = I minute, T2 = 6 minutes. Read-out the multichannel analyzer. Note the counting time with themultichannel analyzer is 5 minutes since T2 = Ti 4- counting time.Figure 3 shows a vanadium spectrum. The cross_section of the51V(n,y)52V reaction is 5.0 barns.
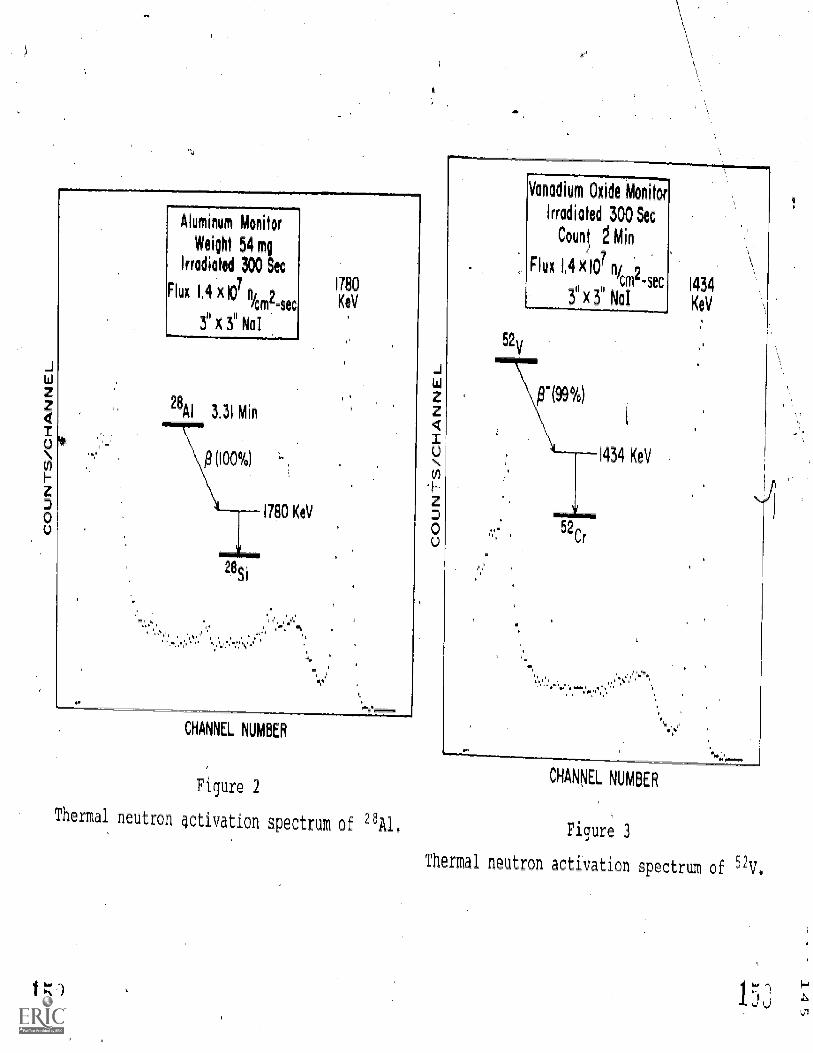
w
0'0z
00
Aluminum Monitor
Weight 54 mg
Irradiated 300 Sec
Flux 1,4 x101 n-km =sec
x 3" MI
e2 A 3,31 Min
0 (100%)
1780 KeV
HAMEL NUMBER
1780
KeV
Figure 2
Thermal neutron activation spectrum of 28A1.
Vanadium Oxide Monitor
Irradiated 300 Sec
Count 2Mm n
Flux 1.4 KIO7
ni _2cm -sec
3lX3HNot
Jwz
4IU
U)
`1-z00
1
1434 KeV
1434
KeV
CHANNEL NUMBER
Figure 3
Thermal neutron activation- spectrum of 5
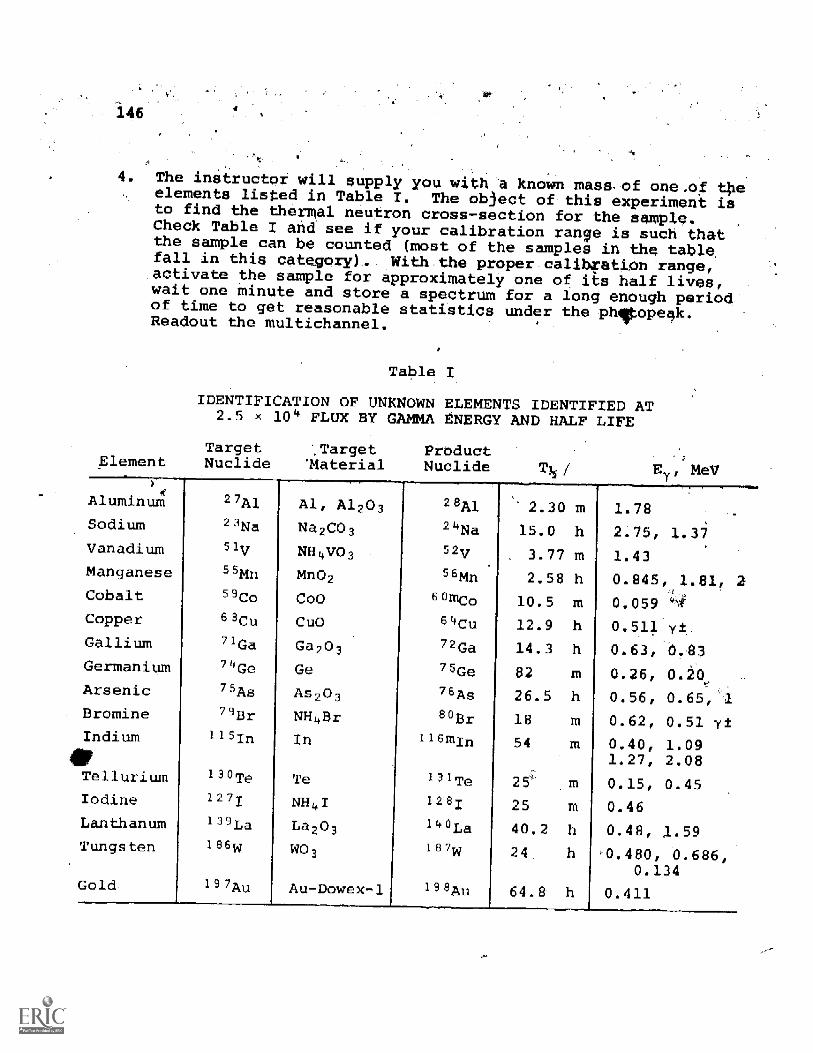
146
4. The instructor will supply you with a known mass of one.of toelements listed in Table I. The object of this experimentto find the thermal neutron cross-section for the sample.Check Table I and see if your calibration range is such thatthe sample can be counted (most of the samples in the table,fall in this category). With the proper calibration range,activate the sample for approximately one of As half lives,wait one minute and store a spectrum for a long enough periodof time to get reasonable statistics under the ph opeak.Readout the multichannel.
S
Table I
IDENTIFICATION OF UNKNOWN ELEMENTS IDENTIFIED AT2.5 x 104 FLUX BY GAMMA ENERGY AND HALF
Target Target PrbductElement Nuclide 'Material Nuclide T1/2
LIFE
MeV
Aluminum 27A1 Al, A1203 2 8A1 2.30 m 1.78Sodium 23Na Na2CO3 24Na 15.0 h 2.75, 1.37Vanadium 51v NH4V03 52v 3.77 m 1.43Manganese 55Mn Mn02 56Mn 2.58 h 0.845, 1.81,Cobalt 59Co Coo 60mco 10.5 m 0.059Copper 69Cu CuO 64Cu 12.9 h 0.511 yiGallium 71Ga Ga203 72Ga 14.3 h 0.63, 0.83Germanium 74Ge Ge 75Ge 82 m 0.26, 0.20Arsenic 7 -As As203 76As 26.5 h 0.56, 0.65,Bromine 79Br NH Br 80Br 18 m 0.62, 0.51Indium 1151n In 6mIn 54 in 0.40, 1.09
1.27, 2.08Tellurium 13°Te Te 131Te 25' m 0.15, 0.45Iodine 1271 NH4I 1281 25 m 0.46Lanthanum 138La La203 140La 40.2 h 0.48, ,1.59Tungsten 186w WO3 __7w 24 h 0.480, 0.686,
0.134Gold 187AU Au-Dowex- 1 8AU 64.8 h 0.411
147
Data.ReductiOn
Exercise- (a)
-From the multichannel readout in Procedure 1, determine theenergy of. the 28A1 gamma... Does it-agree with the value in Table I?.Determine (E-8) for the -phOtopeak and use thb'tormulation in the--introduction to.deterMine'Na, No, A0,.and 0. Remember, in Eg (2)A0 i in disintegrations.per second.
ExerciSe (b.
Repeat Exercise (a) for the vanadium monitor. Calculateand all the other parameters found in (a). Calculate the averageflux value from the aluminum and -vanadium data.-
Exercise (c)
For Procedure 4 the instructor has provided you with all ofthe information that=you need in regard to the sample. The unknownto be calculated is the thermal neutron cross section. Use theaverage flux value calculated in (b). Calculate a, the thermalcross section for this sample.
Rost -Test
1.1 Determine the fraction of the original radioactive atoms thatdecayed during a 4 minute counting period for an isotopewhich has a half-life of 163 minutes, if a 30 secondtran- time was required.
1.2 If th, number that decayed in Problem 1.1 was 8.2 x 10¹²,how many radioactive atoms were there initially and what wasthe initial number of disintegrations per second?
Computer Programs
GAUSS-6 can be used to find the centroids of all of the peaks.LINEAR-6 will provide'a linear least squares fit to the calibra-tion data. GAUSS-6 can be used to find the thermal neutron fluxin Exorcises (a) and (b).
Additional Refe-e
1. G. I. Gleason, Isotopic Neutron Source Ex erimen_ts, ORAU ReportNo. 102, availa e from the Oak Ridge Associated Universities,F. O. Box 117, Oak Ridge, TN 37830 (free).
148
H. D. Raleigh* compiler, -Activation An al sis--A LiteratureIrlD-3537 (August 3 , available rom t e C rIng-HaUFW-for Federal Scienti ic and Technical Information,
Springfield, Virginia.
H. J. M.-,Bowen and D. Gibbons, Radioactivation Analysis, OxfordUniversity Press, London, 1963.
D.-Taylor, Neutron Irradiation and Activation Analysis, D. VanNostrand Co., Inc., Princeton, New Jersey, 1964.
Texas A & M University, Proceedins of the First I -ernationalConference on Modern Trends in AcUniversity, College Station, Texas, 1961.
6. Texas A & M University,'Proceedings of the Second InternationalConference on Modern'Trends in Activation Anal sis, Texas AUniversity, College Station, Texas, 1965.
7. V. P. Guinn, "Activation Analysis," Encc1cyedipA7)fL-idustria]-sL2ELalLE,2aEiE, vol. 1, John Wiley Sons, New York, 1956.
8. V. P. Guinn and H. R. Lukens, "Nuclear Methods," Trace Analysis-_Physical Methods, edited by G. H. Morrison (IntersciencePublishers, New York: 1965). .
149
Experiment 2
Fast Neutron Activation Technic-ues
Objective
To accurately measure the fast 'neutron.flux from an acceler-ator or an unmoderated isotopic neutron source of 2 52cf to studythe parameters associated with the buildup and decay of radioactivity;to measure the fast neutron cross section of,s known isotope.
References
1. R. C. Koch, 1Ctivation Anal sis Handbook, Academic Press, NewYork, 1960.
2. K. S. Vorres, "Neutron Activation Experiments in Radiochemistry,"J. Chem. Educ. 37, 391 (August 1960) .
W. S. iyon, editor, Guide to Activation Anal -sis, E. Van NostrandCo. Inc., New York, 964.
4. Denis Taylor, Neutron Irradiation and Activation Analysis, D. VanNostrand Co., Inc., New York, 1964.
5. C. M. Lederer, J. M. Hollander, and I. Perlman, Table of Isotopes,6th edition, Wiley, New York, 1967.
Chart of the Nuclides, General Electric Co., modified by BattelleNorthi4est, R1Chland, Washington; available from Superintendentof Documents, GPO, Washington, D. C.
G. I. Gleason, Isotopic Neutron Source_ Ex- eriments, ORAU-102(March 1967), aVailable from Oak Ridge Associated Universities,P. O. Box 117, Oak Ridge, TN 37830.
8. Sam S. Nargolwalia and Edwin P. Przybylowicz, Activation Analysiswith Neutron Generators, John Wiley and Sons, New York, N. Y.,1973.
Introduction
The equations developed in Experiment 1 are equally applicableto problems in fast neutron activation analysis; and, hence, wewill assume that the student has read Experiment 1 before startingthis one.
There are three common sources of fast neutrons (in our case,fast means energies greater than 1 MeV) that are available tocolleges and universities. These are: low voltage accelerators,isotnnir7 non-Prnn nnA 252,-,E

150
The low v age accelerator in this application(leutronS by two reactions; these are:
and
T,+ d n 41-Ie 17.6 MeV)
= 3.2 MeV)
can generate
(1)
(2)
The first reaction, which is the one most used by accelerator groups,generates 14 MeV neutrons. A deuterium beam of approximately 1milliamp is allowed to strike -a Zircbnium Tritide target at anincident energy of 150 keV. The results can give neutron yieldsas high aa 1-x 1010 n/5 total yield. The flux at the irradiatingposition for this yield would be ,b1 x 109 n/cm2-secwhich is thequantity that we will measure. In Equation (2) Experiment 1,Jthisquantity is called the flux in n cm2-sec.
The-second sdurce_of fast neutrons is the isotopic neutronsource. This is the type that many colleges and universities use.Basically, the source is composed of an alpha emitting isotopewhich is mixed with beryllium and fabricated-in a stainless steelcylinder The most commonlof these sources are the so-calledPu-Be or Ra-Betypes. The neutrons 'are produced by the followingreaction:
9Be + c n 12c (4m 5.704 MeV)
The flux of neutrons produced by one of these sources is shown inFigure 1. A one curie' Source will generally produce about 1.5 x 10⁶n/sec. Note, in Figure 1 there is a distribution of energies andnot just a single energy. The average energy for a Pu-Be source isabout 5 MeV; and,hence, if we use an unmoderated source of this typein the experiment, the average cross section measured will be forMeV neutrons.
Another source of neutrons that has recently become availableto colleges and universities is 252Cf. 252Cf is a spontaneouslyfissioning nucleus and, hence, the spectrum that would be observedis a typical fission spectrum. Figure 2 shows this spectrum for anunshielded 252Cf source. A 1 gram source will produce 2.34 x 10¹²n/s in the distribution as shown in Figure 2. The sources that arebeing given to universities are usually a few micrograms and theiryield would be r,15 x 106 n/sec which is roughly equivalent to a 3 CiPu-Be source.
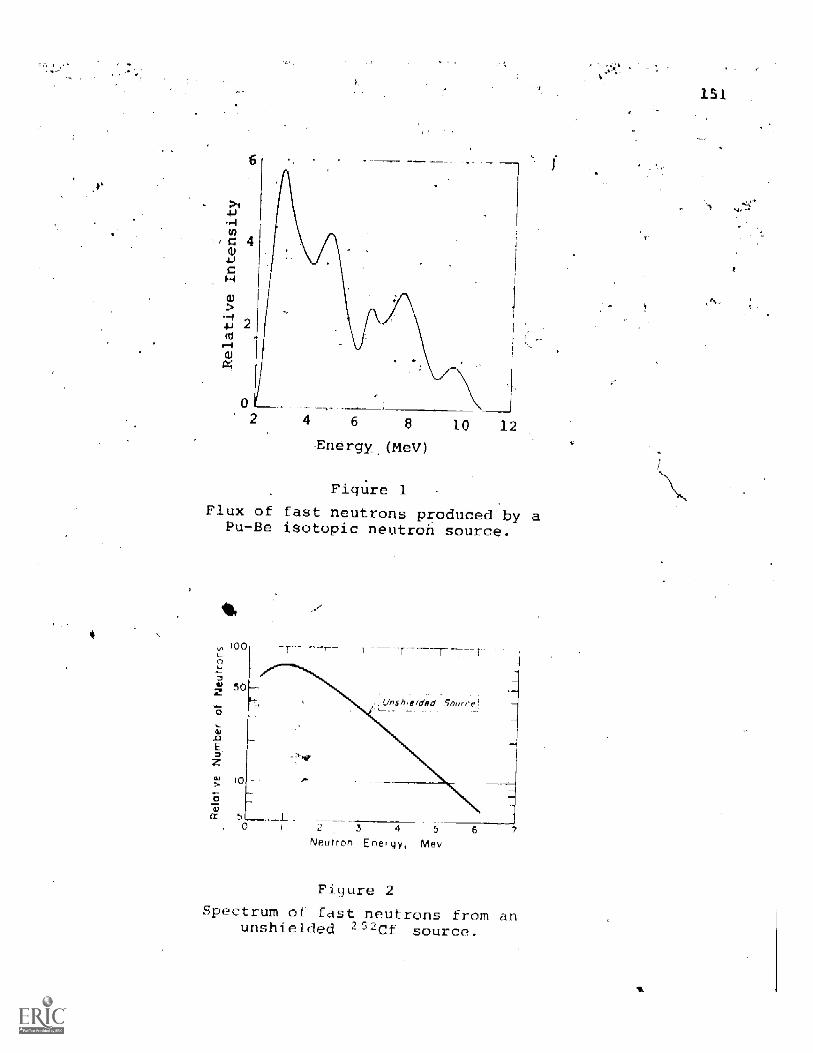
4 6 8 10 12
EnergyA eV)
Figure 1
Flux of fast neutrons produced-0y aPu-Be isotopic neutroh source.
00
50unsn,e/ded Source!
E.
0
2 4 5
Neutron Energy Mev
Figure 2
Spectrum of fast neutrons from anunshielded 252Cf source.
151
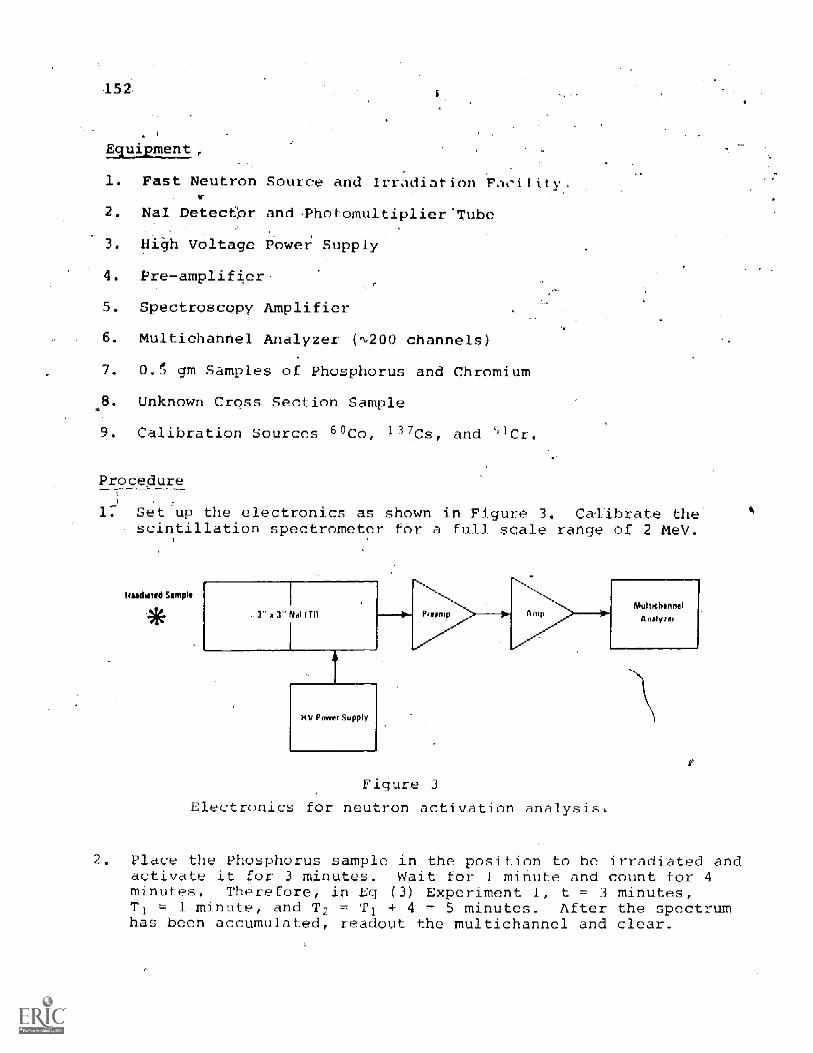
152
E5iiipment
3. Calibrate therange of 2 MeV.
1. Fast Neutron Source and Tyr iat ion F 1
2. NaI Detector and .Photomultiplier'Tube
Hi4h Voltage Power Supply
Pre-amplifier
5. Spectroscopy Amplifier
6. Multichannel Analy_zer 0,200 channels)
7. 0-5 gm Samples of Phosphorus and Chromium
Unknown Cross Section Sample
9. Calibration Sources "Co, 137Cs, and Cr"
Procedure
1. Set up the electronics as shown in Figurescintillation spectrometer for a full scale
Imbued Semple
3" 3"' Ndl ITI)
HY Power Supply
Figure 3
Electronics for neutron activation anal
hiuluchannel
Analyzer
2 Place the Phosphorus sample in the position to be irradiated andactivate it for 3 minutes. Wait for 1 minute and count for 4minutes. Therefore, in Eq (3) Experiment 1, t = 3 minutes,T1 = 1 minute, and T2 T1 4 = 5 minutes. After the spectrumhas been accumulated, readout the multichannel and clear.

153
Repeat Procedure (2)'for the chromium-sample with the followingparameters: t'= 4 minutes, T1 = 1 minute, T2 =:5 minutes,
r the spectrum has been accumulated, readoUt the multichannelclear.
Ain the unknown sample from the instructor_ d dedide on thetVradiation and countingparameters. -Irradiate .the sample and
--store a spectrum of the resulting activity.
Data keduction
Rxercise.(a)
The phosphorus reaction for the activation prooets is given by
3 1 p + .n 31Si
The cross section for the reaction is '100 mb The resultantgamma ray from 31 Si has an energy of 1.266 MeV. Determine the energyexperimentally from the calibration curve. From the multichanneloutput determine (E13) for the photopeak and solve Eq (2) throughEq (5) in Experiment 1 for the value of 4.
Exercise (b)
The chromium reaction for the activation process is given by
52Cr + n = p 52V
The cross section for the reaction is 80 mb. The resultant gammaray from 52V has an energy of 1.44 MeV. From the calibrationcurve, find the experimentally determined energy for this gamma.From the multichannel output determine (E--) for the photopeak andsolve Eqs (2) through (5) Experiment 1 to obtain another value for
Exercise (c)
The instructor will provide you with all of the informationabout the unknown except the fast neutron cross section. From thereadout find (E-6) for your unknown and solve Eqs (2) through (5)for a, the cross section for the reaction. Note, use the averagevalue for the flux found in exercises (a) and (b). Tablegives some useful reactions that can be Studied in this exerclie.The cross sections in this table are-for 14 MeV neutrons. Thegamma energies from the final radioactive nucleus can be foundin Ref. 5.
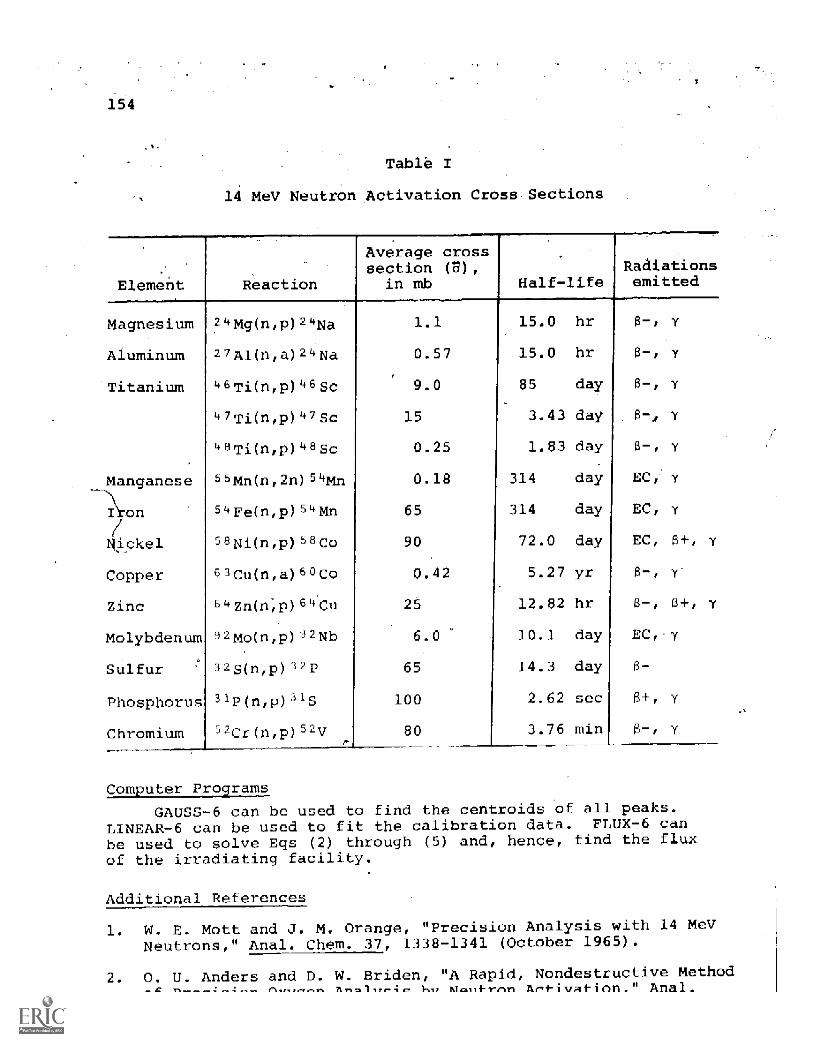
154
Table I
14 MeV Neutron Activation Cross-Sections
Element Reaction
Average crosssection (1)
in mb Half-lifeRadiationsemitted
Magnesium 24mg(n,p)24Na 1.1 15.0 hr 8-1 Y
Aluminum 27A1(n,a)24Na 0.57 15.0 hr 8 -, Y
Titanium 46Ti(n,p) 46se 9.0 85 day 8-, Y
47Ti(h,p)47Sc 15 3.43 day 8-, y
48Ti(n,p)4Sc 0.25 1.83 day 8-, Y
4anganese 55Mh(h,211)54Mn 0.18 314 day EC,- y
_n 5 Fe(n,p)54Mb 65 314 day EC,
.-ickel 58Ni(n,p) 58Co 90 72.0 day EC, Y
copper 3Cu(n,a)60Co 0.42 5.27 yr 8-, y
!,inc 4 Z11(1;13) 64Cu 25 12.82 hr 8 -, 8 +, y
lolybd-num 92Mo(n,p) 2Nb 6.0 10.1 day EC, -y
sulfur -2S(n,p)3 P 65 14.3 day 8-
Phosphorus 31P(n,p)31S 100 2.62 sec 8 +, Y
'hromium 52Cr(n,p)52V 80 3.76 min 6-, Y
Computer Programs
GAUSS-6 can be used to find the centroids of all peaks.LINEAR-6 can be used to fit the calibration data. FLUX-6 canbe used to solve Eqs (2) through (5) and, hence, find the fluxof the irradiating facility.
Additional References
1. W. E. Mott and J. M. Orange, "Precision Analysis with 14 MeVNeutrons," Anal. Chem. 37, 1338-1341 (October 1965).
2. O. U. Anders and D. W. Bridenhi=m1ie.
"A Rapid, Nondestructive MethodAr-i-ivAi-inn." Anal.
155 -
3. J. T. Gilmore arid D. E. Hull, "Neutron Flux Monitoring forActivation Analysis of Okygen," Anal. Chem. 35, 1623 (1963).
4. A. Volborth and H. A. Vincent, "Determination of Oxygen in USESRock Standards'by Fast-NeUtron Activation," Nuci. Phys. 3,701-707 (November 1967).
5. A. Volborth, "Precise and Accurate Oxygen Determination byFast-Neutron Activation," Fortschr, Miner. 43,.1, 10-21.
6. F. A. Iddings, "A Study of Flux Monitoring for InstrumentalNeutron Activation Analysis," Anal. Chem. Acta 31/ 206-212.
156
I
Objective
Experiment 3
cati n_ A_ Unknown-by_14zutron ovation Analysis
To determine the - qualitative and quantitative aspects of anunknown sample by slow neutron activation analysis. This includes. an identification of he elements present in the sample by
gamma-ray activity and half-life and comparison with standardsto determine the amount. of that element which is present.
References
1. L. K. Curtiss, Introduction to Neutron Ph-sics .D. Van NostrandCo. Inc., New York, 1959.
W. _ Lyon, A Guide to Activation Anal sis, D. Van Nostrand Co.,*Inc., New Y r 1964,
J. M. A. Lenihan and. S. J. Thomson, editors, Activation Analysis-Princi les and A .ications Academic Press, 1965.
C. M. Lederer, J. M. Hollander, and I. Perlman, Table of theIsotopes, 6th edition, Wiley, New York, 1967.
_oRadiolo:ical Health Handbook, U. S. Department of Health,E ucation, and Welile, PH S Publication,-2016, Washington, D. C.
C. F. Crouthamel, editor, A_-lied Gamma Ray SpectrometiT, PergamoiPress, New York, 1960. In Appendix IV of the book gamma-raysources are listed in terms of increasing energy.
Introduction
in this experiment we are going to assume that the student hasalready performed Experiment 1, The Stud of Thermal Neutrons byActivation Techni ues. It will-alsd be assumed that the fluxo t_ al neutrons n m2-sec) has been determined.
Identifications of an unknown by activation analysis is accom-plished in the following manner. The sample is first irradiatedfor a short (10 min) period of time It is then counted to deter-mine if that short irradiation produced any measurable activity-.I the answer is yes, then some estimate is quickly made in regardto -the half-life of the isotope that is produced. For example,let's assume that the half-life o'f the activity was 10 minutes.Then-if we made a one-minute count every 2 minutes, we would beableto,see the photopeak dying away as a function of time. With
L_)/
isotope which was produced. The other finger print that is usedis the measured gamma energy. By first calibrating the spectra-mete, we can rather accurately determine the gamma energy of theresultant radionuclide. There are rather exhaustive tabulationsof isotopes listed in accordance to increasing gamma energy.Reference 6 at the beginning of this experiment is perhaps oneof the best. In Appendix VI of this manual we have tabulatedthe relative Sensitivities of sixty isotopes relative to the27A1(n,y) 28A1 reaction. In the tabulation we have listed thehalf-life, measured gamma energy, and the relative sensitivityfor thermal neutron activation. At the end of this tabulationwe hav made up a convenient coded chart that indicates thesensitivities of the elements as- they appear in the PeriodicChart.
It is, therefore, assumed that with the aid of these charts,references, a set of carefully measured gamma spectra, and half-lives, the student will be able to find,his unknown and standardizeit in terms of the actual weight in the sample. This can be doneeven though the unknown may be complex in nature.
Equipment
1. Source of Thermal Neutrons and Irradiation Facility
3" 3" Nal Detector and Photon itiplier
3. High-Voltage Po =r Supply
4. Scintillation Pre-amplifier
5. Spectroscopy Amplifier
6. Multichannel Analyzer (1,200 channels)
7. calibration Sources °CO , I 3 7CS
Unknown Samples (several identical samples of each unknown)
Procedure
1. Set up the Electronics as shown in Picture 1. .Except in a fewcases, a full scale calibration of 2.5 MeV for the multichannelwill be .sufficient. Calibrate with -"Co, 137Cs, and Cr sothat 6°Co is about in the middle of the multichannel analyzer.
Irradiate the first unknown for a period of 10 minutes, wait 1minute, and then count for a period of 5 minutes. The chancesare good that under these conditions you will at least seegammas from your sample. Depending upon the amount of ,le-LiviLythat you pruduced, you may -roceed to ei:her Procedure 3 or 4.

158
fried Sample
A
H V Puwvr Supply
AuItichuuuai
Ana lyzerr
Figure 1
Electronics for neutron activation analysis experiment.
Assume that there is not much activity produced. If this isthe case, the only thing that you can do is irradiate longerand count longer. Try some combination of both.
Assume that there is plenty of activity produced. This meansthat either there is a lot of the element present that is beinc-tudied, or that the half-life is short. It could be some-combination of both. At this point, try to establish thehalf-life of the residual isotope. This can be done, forexample, by taking counts in 5-minute intervals. Figure 2,for example, shows four spectra that were collected for :24Tiat 5-minute intervals.
From the calibration curve, you can also determine the gammaenergies of the isotope. Figure 3 shows a spectrum of aTungstic acid sample. The reaction that produced this acti-vity was "bt,i(n,f)1H7W. The decay scheme for 197W can befound in The Table of the Isotopes, Reference 4. Also, onemay use Reference 6 or Appendix VI at the hack of this manualto help identify an unknown.
6. Assuming that yotvget the right answer for your unknown thenext problem comes in the quantitative assay. For the purposeof this discussion, let's assume that the unknown was vanadium(see Figure 4), The student then weights up a known monitorof vanadium. Irradiate it and count for reasonable statistics.Repeat this exact measurement with the vanadium unknown. Remember the laboratory instructor provided you with several identi-cal samples of the unknown. Be sure to compare the standardto a vanadium unknown that has not alrfaciy beQn irradiated.
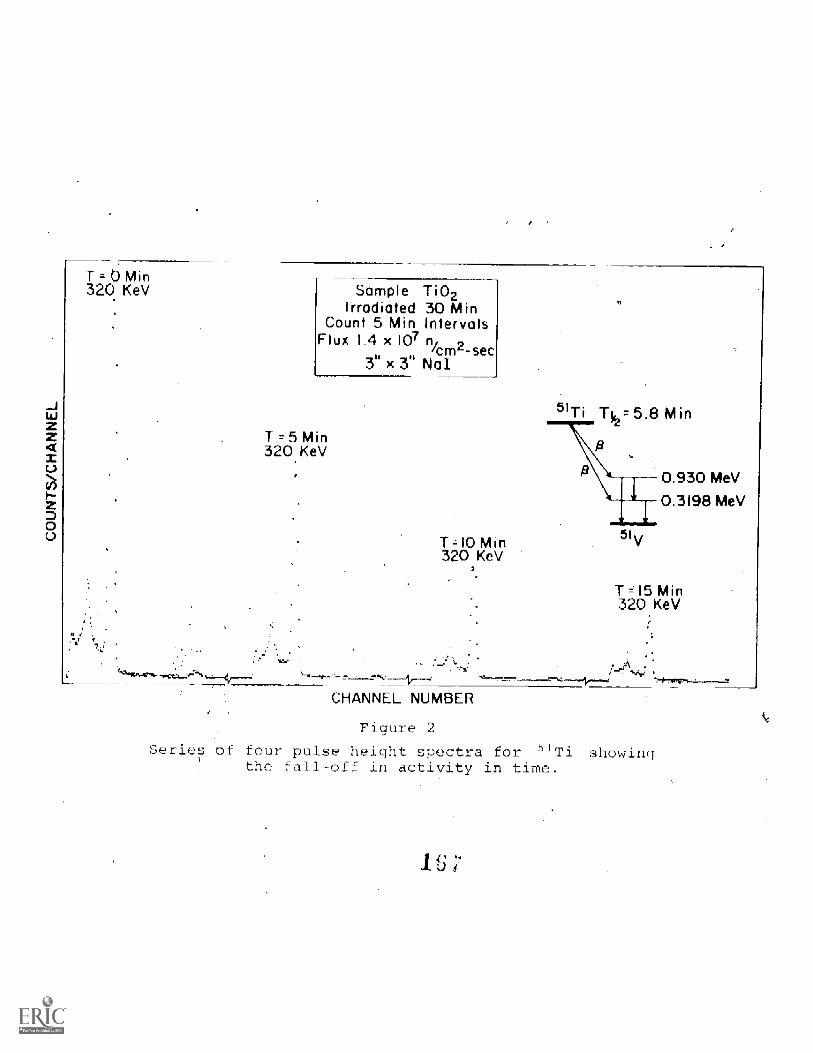
T = 0 Min320 KeV Sample TiO2
Irradiated 30 MinCount 5 Min Intervals
Flux 1.4 x 10⁷ nkm2-sec
3'x 3" Nor
T 5 Min320 Key
T=10 Min320 KeV
5 Ti TL= 5.8 Min
0.930 MeV0.3198 MeV
T=15 Min. 320 KeV
CHANNEL NUMBER
Figure 2
Series of four pulse height spectra for 5 1Ti showingthe fall-off in activity in time.
1 4'

Ui
zz
I0
0I-zJ0U
Tungstic Acid
Irradiated 4,0 iirs
72Flux 1,4 x 107 nf
cm -secKeV -"x 3" Nal
480"trigrA Key
0
552
KeV
686
KeV
68Key
CHANNEL NUMBER
Figure 3
773
KeV
Vanadium Oxide Monitor
Irradiated 300 Sec
Count 2 Min
Flux 1.4 x I0 ft/ _2,cm sec
3" Nor
LU
zz
I0
0
z000
Neutron activation spectrum of tungsten,
CHANNEL NUMBER
Figure 4
Pulse height spectrum pf activated vanadium lik*;;
Data Reduction
Exercise (a)
From your calibration curve determine the gamma energies ofthe unknown. The half-life data, along with the gamma energies,should provide you with enough data to determine what isotope itis that you are measuring.
Exercise (b)
In your comparative data determine (T,-(') for both the standardand the unknown. If all irradiation parameters were identical, theratios of photopeak sums is the same as the ratios of the massesof the standard and the unknown.
Exercise (c)
The method used in ExerciSe (b) is called the relative methodof comparison. It is also possible to determine the amount of anunknown isotope by the absolute method.
From Experiment 1
Eg (1) Ao amzaS
In this equation we know, or can experimentally determine, every-thing except (m), the mass of the sample in grams. Experiment 1carefully outlines how this can be done. Determine (m) by thismethod.
Com uter Pr: ams
GAUSS-6 can be used to find the .centroids of all of thepeaks. LINEAR_- -6 will provide a linear least squares fit to thecalibration (-1,;N GAUSS -6 can be used to find the thermal neutronflux in exercises (a) and (b).
Additional Refer -en
1. G. I. Gleason, Isotopic Neutron Source Experiments, ORM ReportNo. 102, available from,the Oak Ridge Associated Universities,R. O. Box 117, Oak Ridge, TN 37830 (free).
H. D. Raleigh, compiler, Activation Anal sis- -A LiteratureSearch, TID-3537 (August 1963} -7 available from Clearinghousefor Federal Scientific and Technical Information, Springfield,Virginia.
162
H. J. M. Bowen and I. Gibbons, RadioactivationOxford University Press, London, 1 63.
D. Taylor, Neutron Irradiation and Activation Analysis, D.Van Nostrand Co., Inc.; New York, 1964.
5. Texas A & M University, Proceeds of the First InternationalConference on Modern_Trends inActivation_AnalyslE, Texas AUniversity, College Station, Texas, 1961.
Texas A & M University, Pre edirig§ of the Second InternationalConference on Modern Trends in Activation Anal sis, Texas A & MUniversity, College Station, Texas, 1965.
7. V. P. Guinn, "Activation Analysis,"Chemical Analysis, Vol. 1, John Wiley _ Sons, Ne ,york, 1966.
8. V. P. Guinn and H. R. Lukens, "Nucleic Methods a,E221naLL.IL2:1Physical Methods, edited by G. H. Morrison, In irsciencePublishers, New York , 1965.
edia of Industrial
ANSWERS TO QUESTIONS AND PROBLEMS
Pre Tea Answers
00 o1.1 = 4100 A « 10-n cm/A
4100 x 10=8 cm
f = c/N
x 101° c- sec
4100 x 10=8 cm
.3 x 1014 sec-1
1.2 E=- h
= (6.625 10-27 erg - sec) ( 7.3 x 101'' sec-1)
148.S - 10-13 erg x,4
= 30.3 x 10⁻¹ ev
3 ev
1.602 10-12erq
2.1 An electron volt is the energy acquired by an elect=-1-_-_ inpassing through a potential difference of 1 volt.
2.2 1 keV = 1000 eV
1 MeV = 108 eV
1 GeV ----- 109 eV
3.1 A = 150 A
= 150, 10=8 cm
f = c/A
3 101' cm/sec
150 10-'3 cm
2 x IOl« gee-1
164
EMaX
W
(6.625 x 10⁻²⁷ erg sec) (2 x 1611 b sec- - 6 eV
= 13.25 x 10⁻¹¹erg _ 6 eV
76.7 eV
3.2 No, because 1022 key of energy is required to produce theelectron-positron pair.
b) Yes, with a Compton interaction approximately 20 timesmore likely than a photoelectric interaction.
Post -Test Answers
1.1 The decay constant for this isotope is
in 2
0.69393 sec
= 0.00745
The number of atoms which decayed is
= No -1 -AT,2Nd
where No is the original number o radioactive atoms, T1 isthe transfer time and T2 is the transfer time plus countingtime.
Nd
= No
N0
e0.00745 sec-1 )(30 sec
(e-0.224=
(0.6928)
= 0.6928
-2.2
e-(0.0074- sec-1) (300 see)
-
165
1.2 Nd = 8.2 x 10¹² disintegrations
No -
8.2 x 10120.6928
= 1.18 x 10¹² - 10
= ?N0
= (0.00745 sec-.1)(1.18 x 10¹² disintegrations)
= 8.8 x 10⁹ disintegrations/sec

MODULE FOUR
-RAY ATTENUATION
A Module on the Attenuation of Low-EnergyPhotons Passing Through Matter
(A Proportional Counter Experiment)
INTRODUCTION
167
Photon attenuation is very important especially for low energyphotons. For example, a 10 keV photon, as 100 times the probabilityof being absorbed as a 1000 keV photon.
This experiment involves the measurement of the linear absorp-tion coefficient for low energy X rays. Therefore, we will bedetermining the number of events that are observed under variousexperimental conditions. There are unique problems associated withX-ray absorption measurements and this experiment will be concernedwith the solutions of these problems. Ideally, the experiment shouldbe performed in vacuua; however, for 8 key x rays passing through afew centimeters of air, the corrections are small and may be neg-lected. For X rays below 8 key the corrections become increasinglymore important and attenuation experiments performed in this regionshould be done in a special vacuum chamber. As an example, a 2 keVX-ray beam would be attenuated about 80% by a piece of ordinarypaper.
The X rays will be detected with a gas-filled proportionalcounter. It will be assumed that the student is already familiarwith the use of proportional counters with X-ray sources.
OBJECTIVES
To study the attenuation of low energy X rays when they passthrough thin foils; to determine the. half value thickness foraluminum and nickel for the Ka X rays from Zn-65.
PREREQUISITES WITH PRE-TEST QUESTIONS AND PROBLEMS
1 Characteristics of Electromagnetic Radiation:
a) Relationship between wavelength, frequency, and velocity.b) Relationship between energy and frequency of radiation,
Planck's constant.
1.1 What is the -uency of the Kai X ray from Selenium hichhFis 11 ??1

168
1.2 What in the wavelength of this X ray?
2. Electron volt (eV), keV, MeV:
2.1 How is au/electron volt defined?
2.2 How is the eV related to the multiples keV, MeV, GeV?
Interaction of Electromagnetic Radiation with Matter:
a) Photoelectric effectb) Compton effectc) Pair production process
3.1 How is the mass attenuation coefficient related to the linearattenuation coefficient?
3.2 Derive the general relativistic expressions for the maximumforward momentum of a photoelectron ejected by a photon ofenergy hf and the corresponding recoil momentum of the resi-dual atom. Neglect the binding energy between the electronand the atom and the kinetic energy of the recoiling atom incomparison to the energy of the incident photon.
THEORY
At energies below 20 key, photons interact with matter pri-'manly by the photoelectric process. Compton and 'pair productioncross sections are for the most part unimportant in this energyrange. Let us assume that a thin piece of metal is placed betweenthe X-ray source and the detector.
From Lambert's law (Reference 1) the decrease in intensity ofthe radiation as it passes through the foil is given by:
I = Toe 1-IX
where:
I intensity after the absorber
intensity before the absorber
total mass absorption coefficient (cm
x = density thickness- in -m cmL
The density thickness is the product f density in g_ c times

169
The half value layer (HVL) is defined as the thickness of theabsorbi,pg foil which will reduce the original intensity to one-half of its initial value.
I/I0 = e-Px
n(I/I = -jx
if I/I0 = 0.5
then x = HVL
therefore Zn(0.5)= -p(HVL)
and HVL = 0.693/p
Experimentally the (HVL) is determined by inserting foils of variousthicknesses betwee r the source and the detector and observing theall off in intensity. A plot on a log scale of intensity versus
absorber thickness will give a straight line. The slope of theline is -1J and the HVL can be determined from the above information®
REFERENCES
C. E. Crouthamel, A lied grIlr±IlAyTectromea (PergamonPress, N. Y., 1960
2 C. D. Chase and J. L. Rabinowitz, Princi es of.RadioisoiMethodology, 3rd edition (Burgess Publishing Co., MInheapolis,1967) .
B. L. Henke and R. L. Elgin, "X-Ray Absorption Tables for the2-to-200 Angstrom Region," Advances in X-RayAa, B. L.Henke, Editor, Vol. 13 (Plenum Press, 1970).
4. H. A. Liebhafs y and H. G. Pfeiffer et al., "X-Ray Absorptionand Emission," Analytical Chemistry, John Wiley.
5. J. R. Rhodes, "Radioisotope X-Ray Spectrometry," The JournalSociety of November 1966, Vol. 91,
No. 1088.
EQUIPMENT
Option A
1. Gas Filled Proportional Counter for Low Energy X-Ray Measu ent
2. Proportional Counter Pre-amplifier
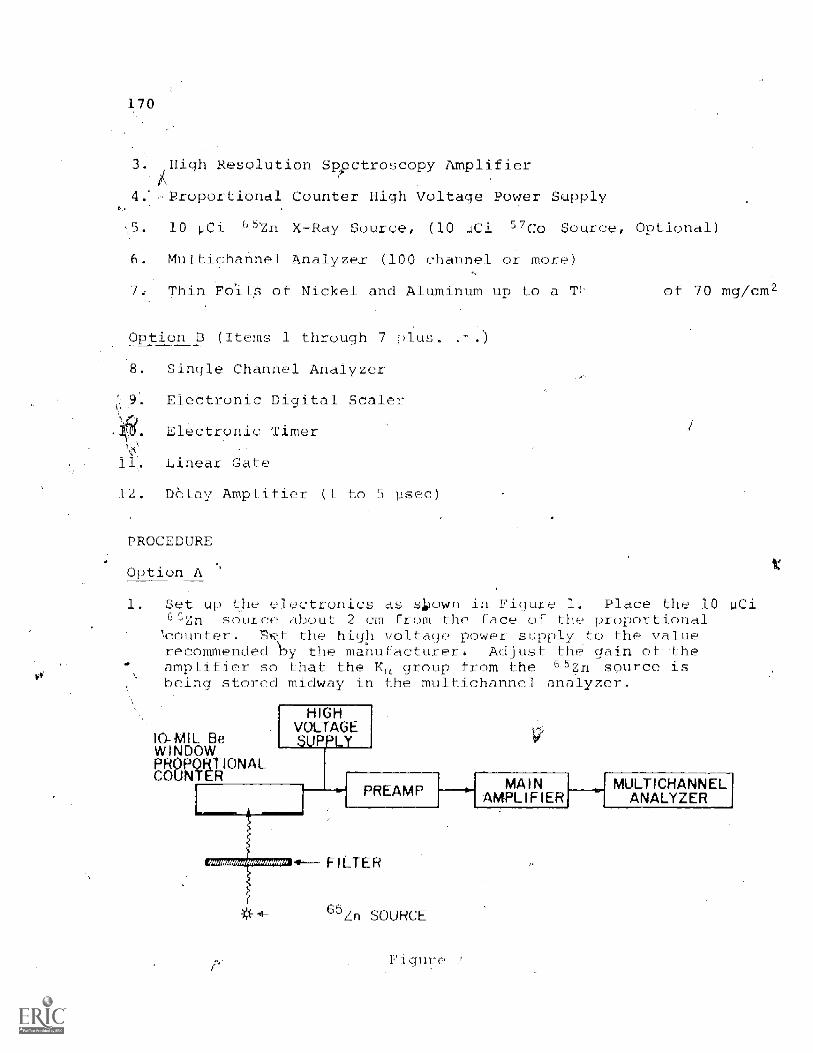
170
. -High Resolution Spvctroscopy Amplifier
Proportional Counter High Voltage Power Supply
5. 10 pCi 652n X-Ray Source, (10 uCi 57Co Source, Optional)
6. Multichannel Analyzer (100 channel or more)
Thin Falls of Nickel and Aluminum up to a T of 70 mg/cm
Option B (Items 1 through 7 plus.
8. Single Channel Analyzer
Electronic Digital Scaler
Electronic Timer
Linear Gate
12. Delay Amplifier (1 to 5 psec)
11.
PROCEDURE
Option A
1. Set up the electronics as siown in Figure 1. Place the 10 oCi652,711 source about 2 cm from the face of the proportionalcounter. -S-fit the high voltage power supply to the valuerecommended by the manufacturer. Adjust the gain of theamplifier so that the K1 from the "Zn source isbeing stored midway in the multichannel analyzer.
10-MIL BeWINDOWPROPORTIONALCOUNTER
HIGHVOLTAGESUPPLY
PREAMP
FILTER
SOURCE
Figure
MAINAMPLIFIER
MULTICHANNELANALYZER
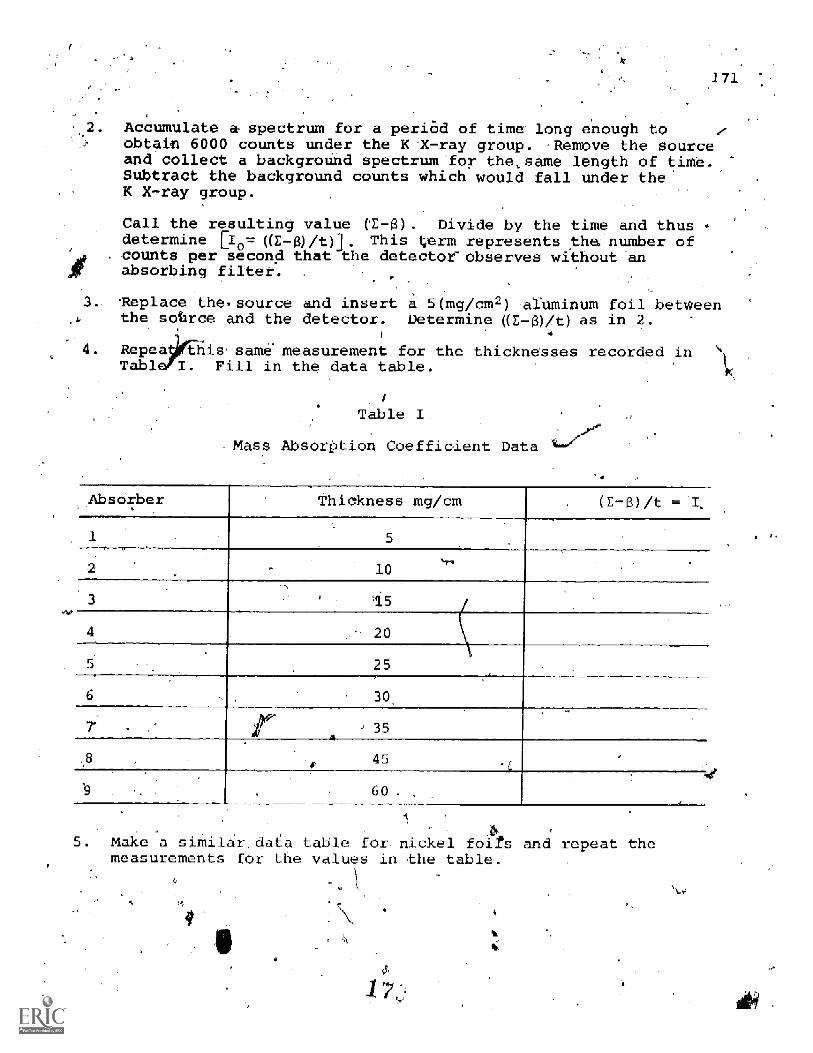
171
Accumulate a spectrum for a peri6d of time long enough=toobtain 6000 counts under the K 'X-ray group. - Remove the sourceand collect a background spectrum-for the, same length of tittle.Subtract the background counts which would fall under theK X-ray group.
Call the resulting value CE-(3). Divide by the time and thusdetermine [I0=1 ((z-aut)]. This term represents the number ofcounts per second that the detector-observes without anabsorbing filter.
Replace the. source and insert a 5(mg/cm2) -anminum foil betweenthe sotrce and the detector. Determine ((E- ) /t) as in 2.
Repe this. same' measurement for the thicknesses recorded inaTabl Fill in the data table.
Table I
-Mass Absorption Coefficient Data
Absorber thickness mg am (E-)
5.
2 10
----,
L5
20
5 25
6 , 30
i 35
45=
60 -
. m
A
5 Make a similar data table for nickel foifs and repeat themeasurements for the values in the table.
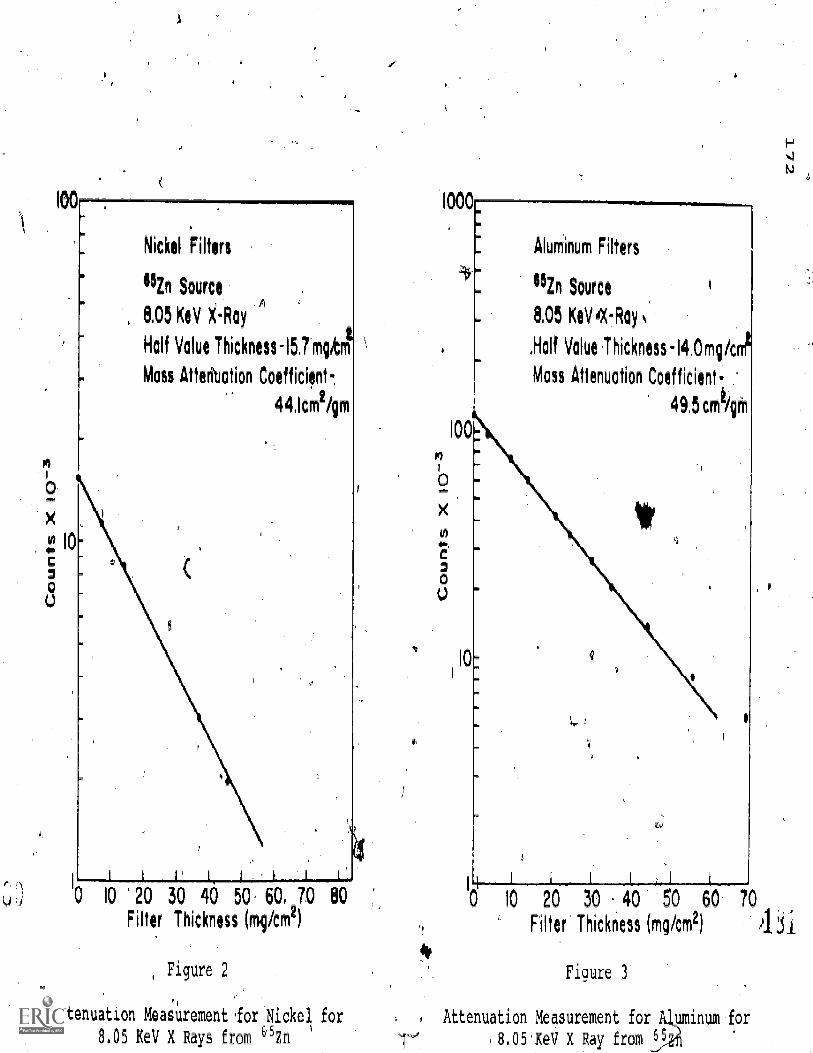
b
X
C300
100
10-
Nickel Filters
"Zn Source
8.05 KeV i.Ray
Half Value Thickness-15.7tgkm
Mass AtterNation Coefficient
44.1cm2/gni
0 10 20 30 40 50. 60. 70 80Filter Thickness (rng/cm
Figure 2
Attenuation Measurement 'for Nickel for
8.05 KeV X Rays from 6'5Zn
1000
X
04-,
C30U
Aluminum Filters
152n Source
8.05 KeV ' =Ray
.Half Value Thickness-14.0rng/cm1
Mass Attenuation Coefficient-
49.5 cm /cirn
10
10 20 30 40 50 60. 70
Filter Thickness (mg /cm2)
Figure 3
Attenuation Measurement for Quminum
8.051eV X Ray from
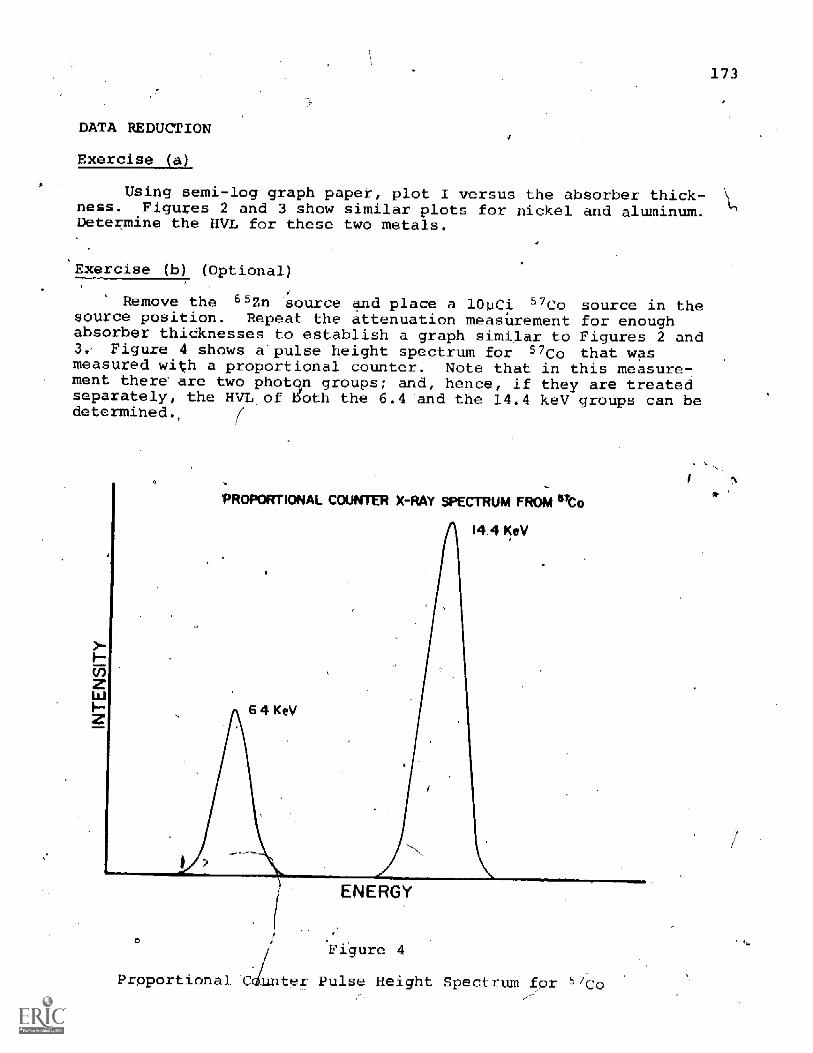
DATA REDUCTION
`Exercise a
Using semi-log graph paper, plot I versus the absorber thick-ness. Figures 2 and 3 show similar plots for nickel and aluminum.Determine the HVL for these two metals.
'Exercise (b) (Optional)
Remove the 65Zn source and place a 1011Ci 57Co source in thesource position. Repeat the attenuation measurement for enoughabsorber thiCknesses to establish a graph similar to Figures 2 and3.- Figure 4 shows a pulse height spectrum for 57Co that wasmeasured with .a proportional counter. Note that in this measure-.ment there' are two photqn groups; and, hence, if they are treatedseparately-the HVL of both the 6.4 and the 14.4 keV groups can bedetermined.
PR I AL C U R X -RAY CTRUM FROM "Co
14.4 KeV
zz 6.4 KeV
ENERGY
Figure 4
Proportional Gaunter Pulse Height Spectr 7 c0
173
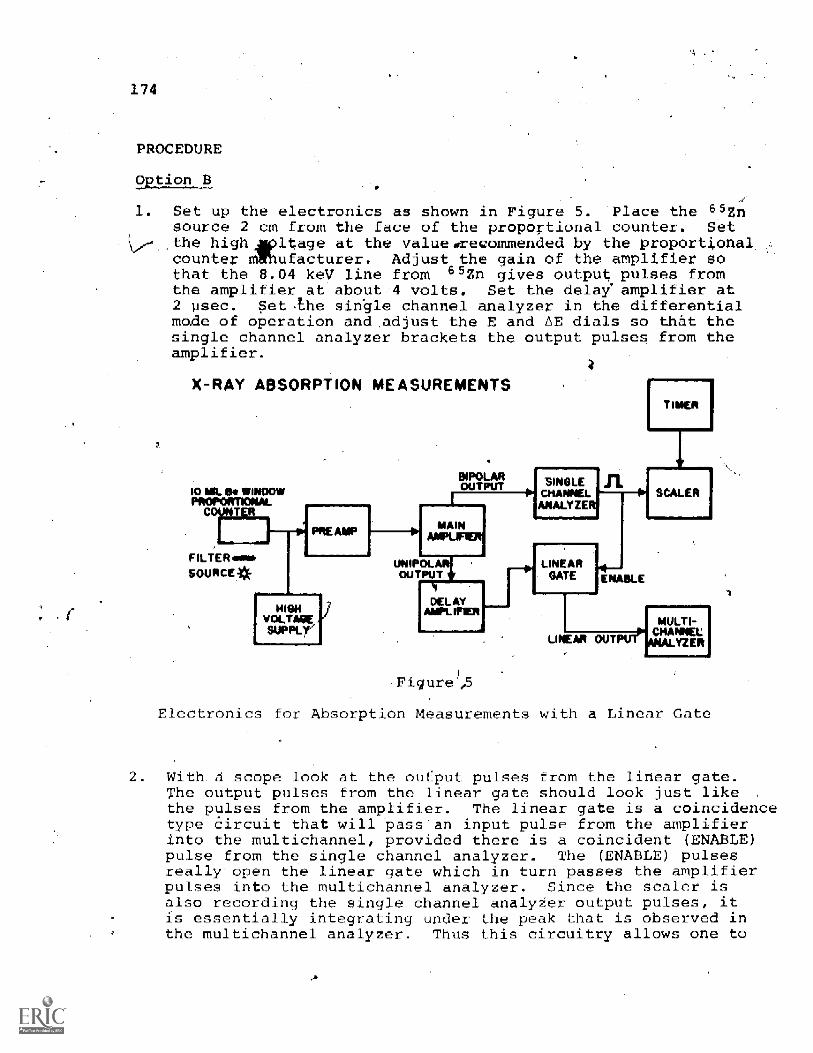
174
PROCEDURE
Option B
1. Set up the electronics as shown in Figure 5. -Place the 65Znsourde 2 cm from the face of the proportional counter. Setthe highApitage at the valueocecommended by the proportionalcounter manufacturer. Adjust- the gain of the amplifier sothat the 8.04.keV line from 55Zn gives output pulses fromthe amplifier at about 4_ volts. Set the delay' amplifier at2 psec. et. he single channel analyzer in the differentialmode of operation and .adjust the E and AE dials so that thesingle channel analyzer brackets the output pulses from theamplifier.
X-RAY ABSORPTION MEASUREMENTS
FILTER mooSOURCE*
BIPOLAROUTPUT
MAINANFLFT131
UN IPOLARtOUTPUT
DELAY
a
Figure'
SINGLECNANNELANALYZER
LINEARGATE
LINEAR
ii
ENABLE
TIMER
SCALER
MULTI-CHANNEL'MALT z ER
Electronics for Absorption Measurements with a Linear Gate
2 WithWithal scope look at the oufput pulses from the linear gate.The output pulses from the linear gate should look just like ,
the pulses from the amplifier. The linear gate is a coincidencetype circuit that will "pass'an input pulse from the amplifierinto the multichannel, provided there is a coincident (ENABLE)pulse from the single channel analyzer. The (ENABLE) pulsesreally open the linear gate which in turn passes the amplifierpulses into the multichannel analyzer. Since the scaler isalso recording the single channel analyZer output pulses, itis essentially integrating under the peak that is observed inthe multichannel analyzer. Thus this circuitry allows one to
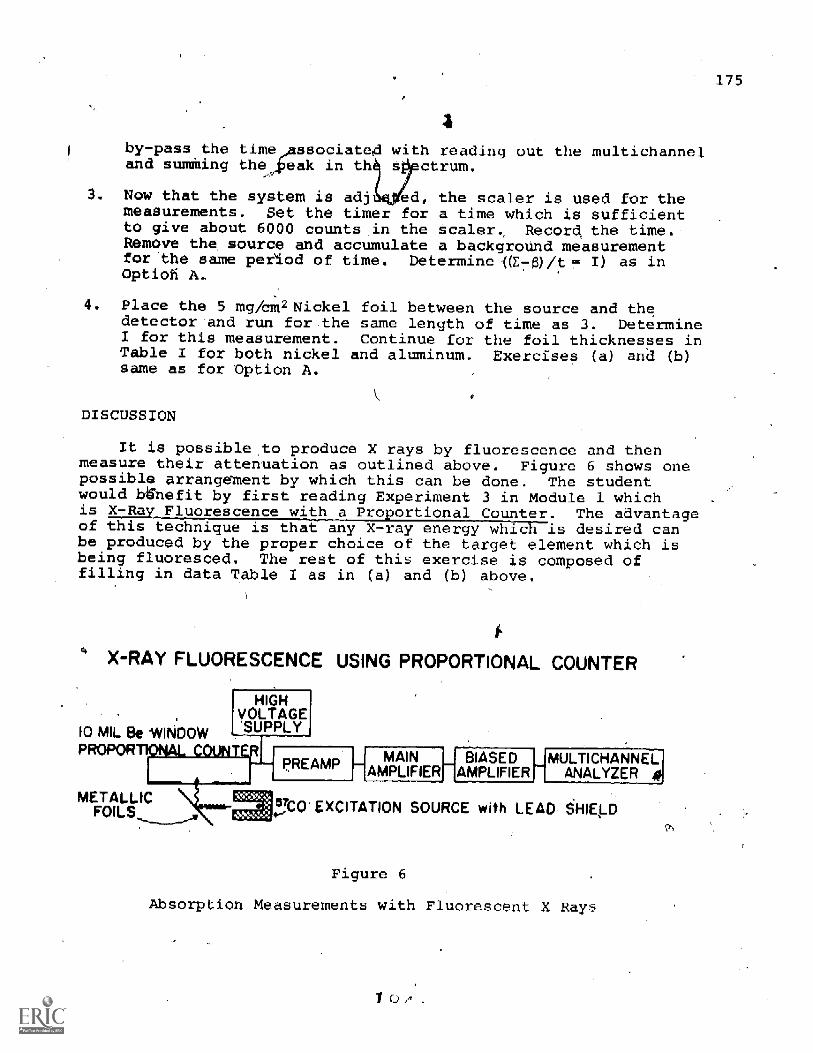
4
bar -pass the time sociated with reading out the multichanneland summing the eak in th sjectrum.
3. Now that the system is adj ed, the scaler is used for themeasurements. Set the timer for a time which is sufficientto give about 6000 counts in the Scaler, Record the time.move the source and accumulate a backgroUnd measurement
for the same period of time. Determine (O -13)/t. I) as inOption A.
4. Place the 5 mg/cm2 Nickel foil between the source and thedetector-and run for the same length of time as 3. DetermineI for this measurement. Continue for the foil thicknesses inTable I for both nickel and aluminum. Exercises (a) and (b)same as for Option A.
DISCUSSION
It is possible,to produce X rays by fluorescence and thenmeasure their attenuation as outlined above. Figure 6 shows onepossible arrangement by which this can be done. The studentwould bghefit by first reading Experiment 3 in Module 1 whichis X7Rav_Fluorescence with a Pr2portional Counter. The advantageof this technique is that any X-ray energy which is desired canbe produced by the proper choice of the target element which isbeing fluoresced. The rest of this exercise is composed offilling in data Table I as in (a) and (b) above.
X-RAY FLUORESCENCE USING PROPORTIONAL COUNTER
10 MIL 'NOMPROF
[VOLTAGE
HIGH
'SUPPLY
METALLICFOILS
MULTICHANNELANALYZER
TCQ EXCITATION SOURCE with LEAD SHIELD
Figure 6
Absorption Measurements with Fluorescent X Rays
175

176-
POST-TEST
1- What fraction of 847-key gamma rays incident on a 3 cm thicksheet of Fe are attenuated if the linear attenuation coefficientis 0.511 cm-1?
2. 6.4-JceV Ka X rays from Fe are detected byA Lithium driftedsilicon detector with a 10 mil (1_ mil0.001") Be widow posi-tioned 10 cm from the Fe target. -What is the correction forattenuation in the air and -Be window if the linear attenuationcoefficients are 0.023 cm°1 and 5.65 cm-I; respectively?.
Would 30-keV .X-ray photon have. a larger probability of-inter-acting by means of a) phd_ -lectric effect, b) Compton effect,or c) pair production process and why?
ADDITIONAL REFERENCES
1. Radiological Health Hand ook,- U. S. Department of Health,Educati-on, an Welfare, S Publication 2016, Washington,,D.C., 1970.
R.- T. Overman and H.Hill, N. Y.: 1960).
K. Seigbahn, Editor, Alpha, Beta and Gamma-Ra Spectroscopy,Vpl. 1 (North Holland Publishing Co., Amsterda 1965
Clark, Radioisqope Techniques (McGraw
4. C. M. Lederer, J. M. Hollander, and 1. Perlman, Table of theIsotopes, 6th Edition (Wiley, N. Y.: 1967).

177
ANSWERS 0 QUESTIONS AND PROMt,A NS
IPre-Test Answers
1.1 E '= hf
11,221 eV6.625 x 101-27 erg -sec
= (1693.7 x 1027 6V/erg-sec)
= 2.713 x 10¹⁸ sec-1
1.2f
= 1.106 x 10-8
= 1.106 A
602 x 10- e- eV)
2.1 The eV is the energy acquired by an electron in passingthrough a potential difference of 1 volt.
2.2 1 keV = 1000 eV
1 MeV = 106 eV
1 GeV = 109 eV
3.1 The mass attenuation coefficient /p(Cril /g) is the linearattenuation coefficient p(CM-1) divided by the density ofthe material p(g/cm3). The mass attenuation coefficient isreally more fundamental since it is independent of theactual density and physical state of the absorber.
3.2 By conservation of total relativistic energy
E E-e
E = E + Ea.
f
But, can be rewritten as
= h hc= = P c, and
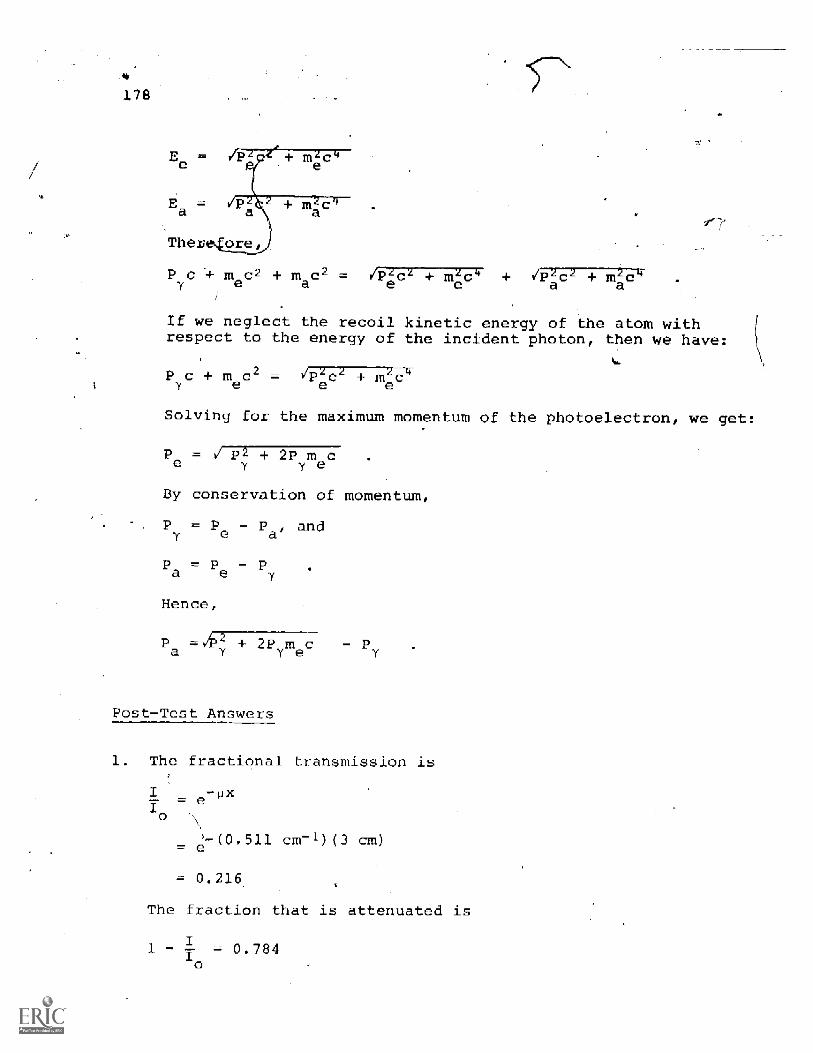
178
P meC2 ma-C2 =
y
7-7
If we neglect the recoil kinetic energy of the atom withrespect to the energy of the incident photon, then we have:
P c meC2 m 2_c_4
Solving for the maximum momentum of the photoelectron, we get:
Pe riT2 + 2P my y e
By conservation of momentum,
P = P and
Pa = Pe P
Hence,
@RY y e
Post-Test answers
The fractional transmission is
I -1_1X
e
cm-1)( cm)
= 0.216,
The fraction that is attenuated is
1 - = 0.784o
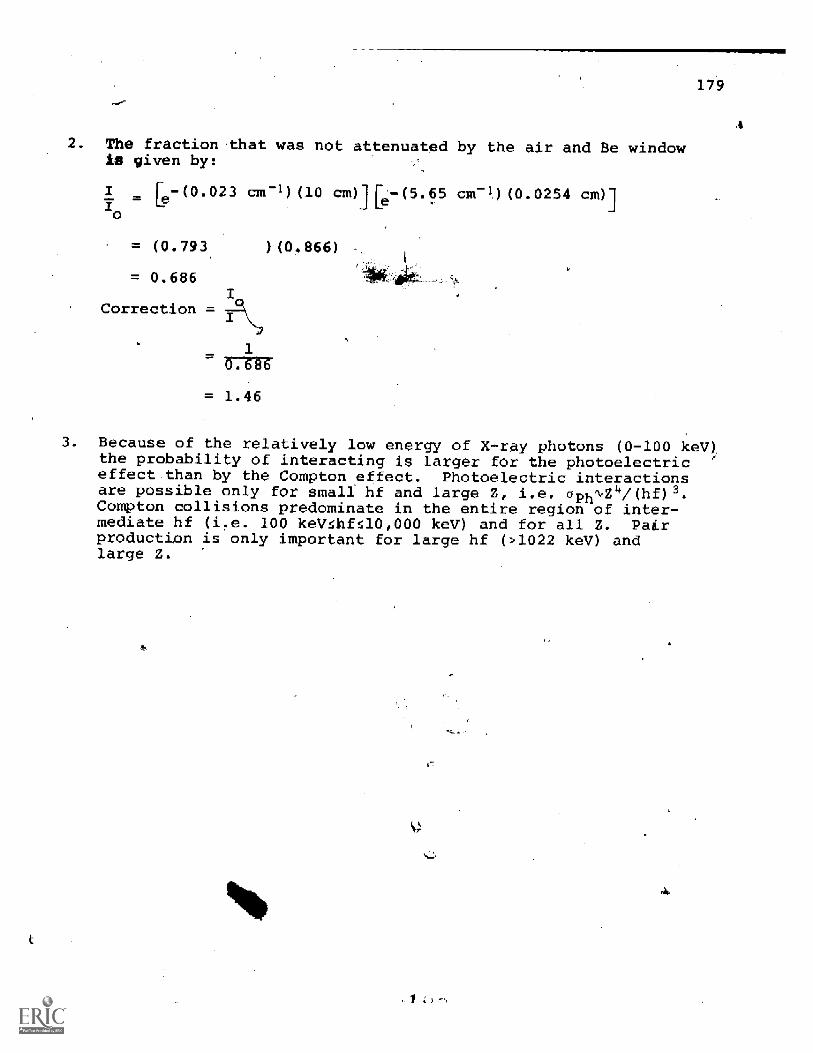
2. The fraction that was not attenuated by the air and Be windowis given by
= eI 0.023 -1)( 0 cm).11-9 (5.5 c_-1 ) (0.0254 cm)]Io
= (0.793
= 0.686
Correction
) (0.866)
1
0.686
1.46
179
Because of the relatively low energy of x-ray photons (0-100 keV),_the probability of interacting is larger for the photoelectriceffect than by the Compton effect. Photoelectric interactionsare possible only for small hf and large Z, i.e. aphq,Z4/(hf)3.Compton collisions predominate in the entire region of inter-mediate hf (i.e. 100 keV4hf110,000 keV) and for all Z. Pairproduction is only important for large hf (>1022 keV) andlarge Z.

181
MODULE FI
ACCELERATOR EXPERIMENTS
A module utilizing low voltage accelerators inatomic and nuclear physics experiments.
INTRODUCTION
Before -accelerators were used, natural radioactive sourcesand cosmic rays provided the only energetic sub-atomic particlesfor the study of nuclear properties. Since the early 1930's chargedparticle accelerators have been used extensively to advance ourbasic understanding of atomic and nuclear structure. They providethe experimenter with a vast number of different projectiles ofcontrollable energy and intensity. The earliest accelerators couldproduce proton beams from less than 100 key to 1 MeV in energyThe four basic types of accelerators are the Cockcroft-Walton, £helinear accelerator, the cyclotron, and the Van de Graaff.
This module consists of two experiments. The first experiment'involves the measurement of thin films by elastic ion-beam scattering.The @econd experiment studies X-ray production using a-smallaccelerator.
Following this introduction are the objectives for the module,and a list of desirable prerequisites for the student to have beforeattempting this module.
OBJECTIVES
The objectives off his module are to familiarizewith the equipmen and techniques used in experimentssmall accelerat . Specifically, the objectives arethe thickness o thin films by elastic ion scatteringstudy X-ray pro _uction by proton bombardment.
PREREQUISITES WITH PRE-TEST QUESTIONS AND PROBLEMS
the studentutilizingto measureand to
1. Electron Volt (eV), keV, MeV, GeV:
1.1 How is the eV related to the multiples keV, MeV, GeV?1.2 An eV is equivalent to how many ergs? Joules?
2. Relationship between Wavelength, Frequency, Velocity, andEnergy of Electromagnetic Radiation:

182
2.1 What is ttie frequency and wavelength the 11.92 key KaX-ray photonirom Bromine?
Coulomb Force:
3.1 What is the couloffibic force of attraction between the electron-and -the proton for the hydroge atom in its ground state?
4. Magnetic Force on a Nov Charge:
4.1 What is the magnetic force-on a 150 keV proton moving perpen-dicular to a uniform magi*tic field of 6 kilogauss?
5. Rutherford Scattering Cross Section:
5.1 what is the expression for the Rutherford scattering differentiacross section?
.2 How does the Rutherford cross section vary as a function of-theincident projectile charge? the target nuclear charge? theenergy of the incident projectile?
Experiment :1
Thin Film Measurements by Elastic Ion Beam ScatterinlaTE4 Low Voltage Accelerator
(A Laboratory Experiment & Senior Research_ Project)
Objective
To use a low voltage accelerator in the study of thin filmsby measuring the scattered ions from the sample.
References
1. J. L. Duggan, J. F. 2 gge, "A Rutherford Scattering ExperimentJournal of'Chemical Education, Vol. 45, p. 85, 1968.
2. J. L. -Duggan, editor, Proceedings of the First Conference onthe Use of Small-Accelerators forTeaChin Regearch, CONE 680411TID 4500. Available from the Clearinghouge for Federal Scientificand Technical Information, N.B.S. U.S. Department of Commerce,Springfield, Virginia 22151 (3).
J. L. Deggan editor, Proceedins Of-the Second Conference on theUse of Small Accelerators for Teaching & Research; CONF 7003221-TID 4500. Available from the Clearinghouse for Federal Scientificand Technical Information, N.B.S. U.S. Department of .Commeree,,Springfield, Virginia 22151 ($3).
4. J. L. puggan, "A Study of the 7Li(p,a)a Reaction," Journal ofNuclear Energy, Vol. 22, p. 611, Fergamon Press, 1968.
5 W. D. Bygrave, P. A. Treado, J.M. Lambert, Accelerator NuclearPh sics, Fundamental Ex .meats with a Van de Graaff AcceleratorHigh Voltage Engine ran "Corporation, Burlingto4, Massachusetts,
1970).VI
Introduction
In its experiment we are going to bombard a thin target.withprotons or deuterons from a low voltage accelerator.. The acceleratorcan be a Cockcoft- Walton or Van de Graaff type. The experi ental-write-up is intended for machines that have accelerating vol Aesless than 500 keV. Figure 1 shows a photog aph of a typical 400 keVVan de Graaff, bending magnet and scatteri chamber that is set upfor educational experiments. Figure 2 sh photograph Of abending magnet and scattering chamber. n geriral, the ion beamsthat are used for this application are ±uite low in intensity. Be4mcurrents for this application are us Willy legs than 50 namps. Atthese ,low voltages and beam current., there-is essentially no healthphysics problems genrated at the arget. However, a person-who is
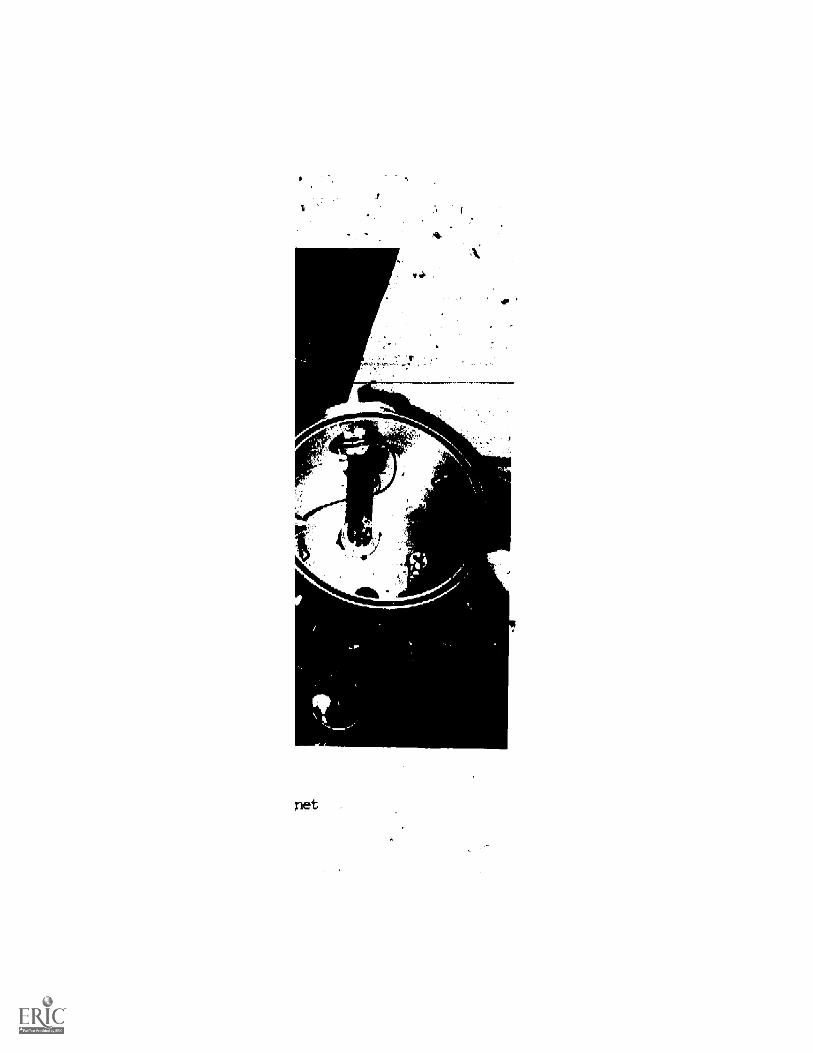
oe
net
a89
familiar with the accelerator and its operation should be involvedwith the experiments until the new users are familiar with theaccelerator parameters.
Figure 3 shows an overall schematic of the accelerator and theassociated electronics for this experiment. A scattering chamberof some sort has to be,constructed Or purchased for-this-experiment.Basically, the scattering chamber is a cylinder that mounts totheen# of the beam-tubing. It has in the followings a mounting'frame for the thin fpil which is our'target,' a movable solid statesurface barrier detector for measuring;the elastically scatteredions, an isolated Faraday cup for measuring the number of protons,'that impinge on the target for a given\measurement, and definingslits to adjust the size of the,beam'spbt on the target. Figure 4gives an artist's concept of a scattering chamber with the basicfeatures which are necessary for this experiment.
In this experiment we will simply record the number of scatteredparticles that come from the target at an angle e (see Figure 3). ,
From this information we will be able to calculate the foil thicknessin the chamber and compare the theoretical and experimental scatteringcross sections.
ES211211a.t
1. Low Voltage Accelerator
2. Scattering Chamber
3. Solid State Charged Particle Detector'
4. Detector Bias Supply
5. High Resolution Pre-amplifier
6. Spectroscopy Amplifier
7. Current Integrator
Multichannel Analyzer
9 Thin foils for thck,- s s mcasurement.s
Procedure
'1.- Set up the electronics as shown in Figure 3. -With an alphasource and a pulse genrator, calibrate the solid state detec-
t for so that the output pulses r,ange up to.200 keV. This pro-,cedure was out in an eurlierexperiment in thismarlal.We are assuming that the maximum 'energy of the acceleratorwhich is available for this experiment is 200 keV.
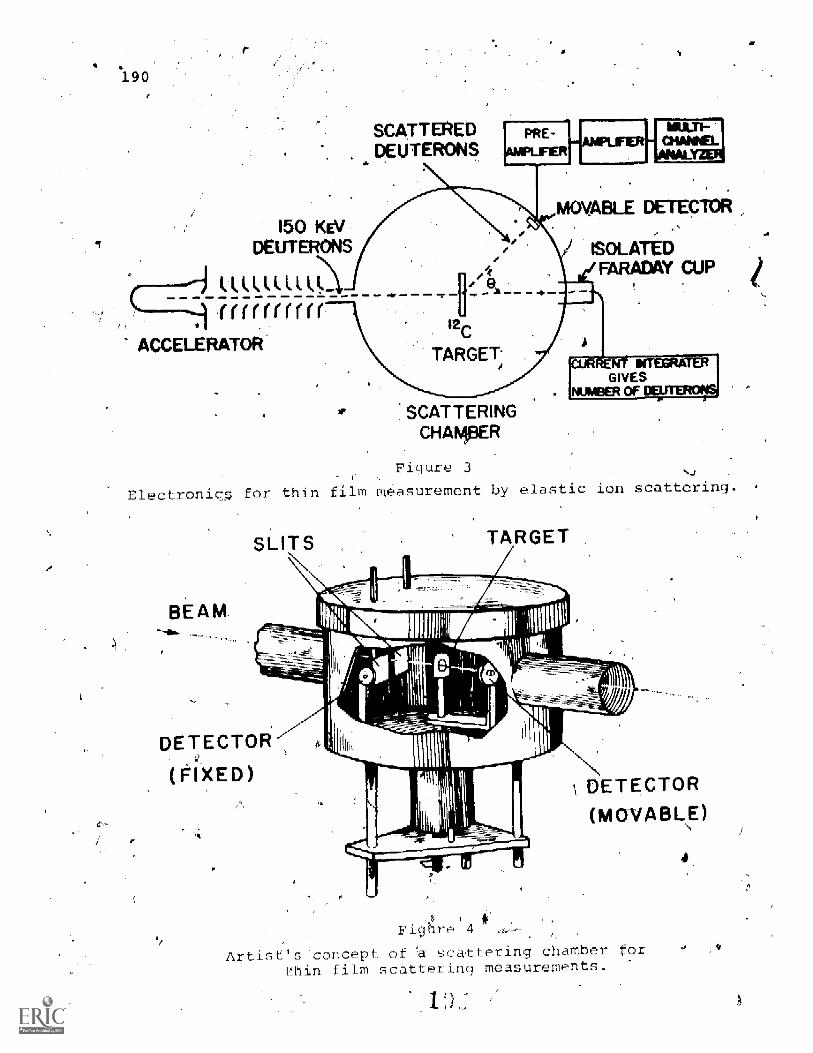
190
SCATTEREDDEUTERONS
150 KEVDEUTERONS
VABLE DETECTOR
OLATEDARADAY CUP
MUM(ACCELERATOR
12C
TARGET.
SCATTERINGCHAMEIER
Figure 3
Electroniq for thin film measurement by elan
BAM
SLITS TARGET
c ion scattering.
DETECTOR
(FIXED)
Artis
Fig re 14
DETECTOR
(MOVABLE)
's concept of a scattering chamberthin film scattering measurements.
for

191
Place the target-to be studied in the target osition. \Let'sassume that it is a thin gold foil (%100 ugm/ m -). Evacuatethe scattering chamber and adjust the beam of the acceleratorso that it will bombard a spot in the center of the target withan area of about 1 mm2. Set the movable detector at an angle8 400 and observe-the pulse height spectrum that is beingaccumulated in the multichannel analyzer. Pigure 5 shows atypical spectrum that was obtained in a similarexperiment.Note that the-only group that is seen is a single elasticallysca.ttered peak.
CHANNEL NUMBER
Figure 5
Pulse height spectrum for the _ (p,p)12 reactionat E = 150- keV and 0L = 30°.
3. Change the accelerator energy from 200 keV to 150 keV andrepeat the measurements in 2. Repeat at an incidentbeam energy of 100 keV.
4. Change to your second target and,Fepeat Procedures 2 and 3.
1
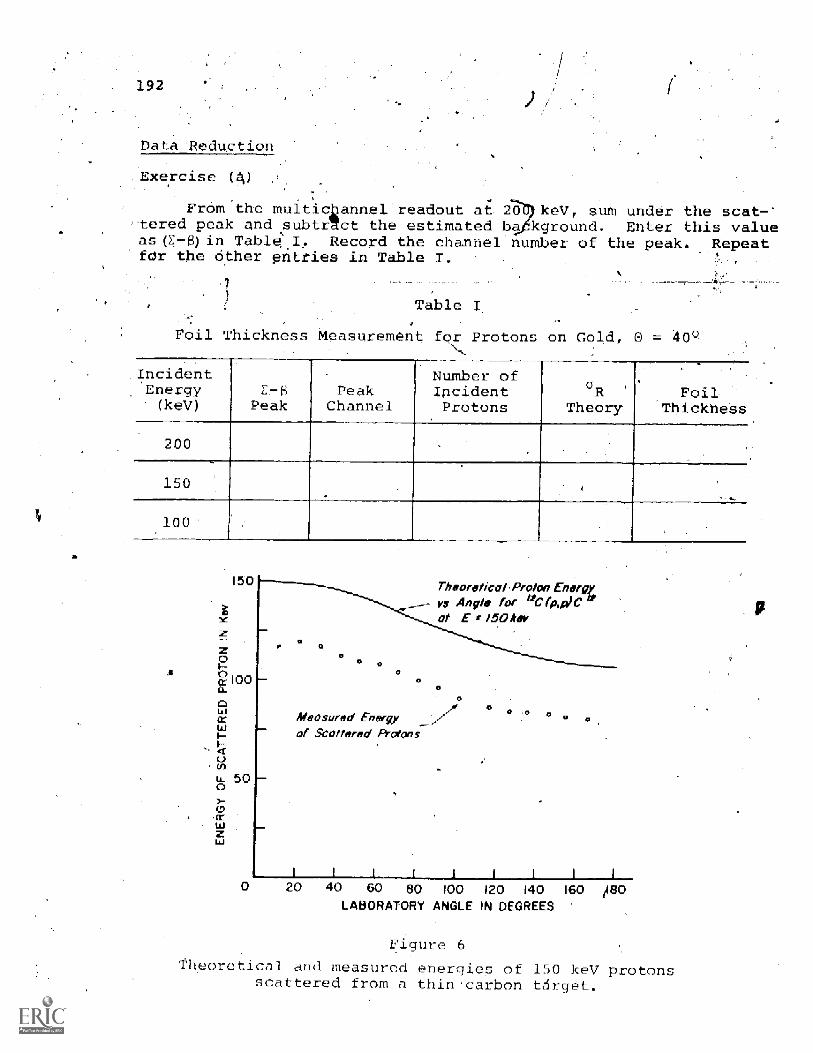
192
Data Reduction
Exercise (A)
From the multichannel readout at 20 keV, sum under the scat -`tered peak and subtrict the estimated b kground. Enter this valueas(E.) in Table I3 Record the channel number of the peak. Repeatfor the Other entries in Table I.
Table I
Foil Thickness Measurement for Protons on Gold, 0 =
IncidentEnergy(kV}
E,-6
PeakPeak
Channel
Number ofIncidentProtons
GRTheory
FoilThickness
200
150
100
I 0
0ck 100
Lairw
ca(fl
500
Cr
z4.1
Theoretical Proton Engrgvs Angle for 41C(p,i2,1C
E /50frev0
O
O
O
0Measured Energy
Scattered Protons
0
20 40 60 80 100 120 140 160
LABORATORY ANGLE IN DEGREES-80
Figure 6
Theoretical and measured energies of 150 keV protonsscattered from a thin carbon

93
Exercise (b)
From your energy calibration curve for the solid state detector,determine the energy of the peak for'eAch of the runs. Since we arescattering from .a heavy nuc/eus like gold, the kinematic energyloSs is small and the' scattered energy at 40 isappreximately theenergy of the accelerator. however, for lighter targets the situ-'ation is different. The incident projectile May experience ratherlarge_ kihematical energy losles_as well as energy lasses just dueto fihite target thicknesses. .Figure 6 shows a plot of what wouldbe expected from 150 keV protons'frOm a thin carbon/target. Notethat at-ascattering angle-of 400 the scattered proton,has a theore-ti Acal scattered energy of 140 eV. tThe Measured energy is-about 115`keV. The dE of 25 key is the avera0e energy thatthe;-proton-leses-igoing through-the carbon target. Although there is little- collisionenergy loss with a geld target, there is, of course, an-energy lossdue to the thiCkness of the gold foil as with carbon.
Exercise (-
Calcu_ to the target thicknessGil; the Rutherford scattering crosstheoretical formula:
dQk steradianEda
millibArns1.296. pL1L
lab-
for each of the runs as follows:section, is given by the following
2
'
sink Olab
when Zi = charge on the incident Particle (one for protons)
Z2 = charge on the target hucleus (79 for gold)
Flab = incident energy in MeV
-elab s measured angle, (40° in our case)
The measured cross section is given by
do 2
dS2 steradian, ,NnAQ
(1)
(2)
where t- = the sum under the scattered peak minus the background
N = number of target nuclei /cm
n = number of incident protons
AQ - solid angle in steradians of your detector
It can now be assumed that q (1) equals Eq (), hence:
dodOR 10-2 7
NhAS-2 (3)
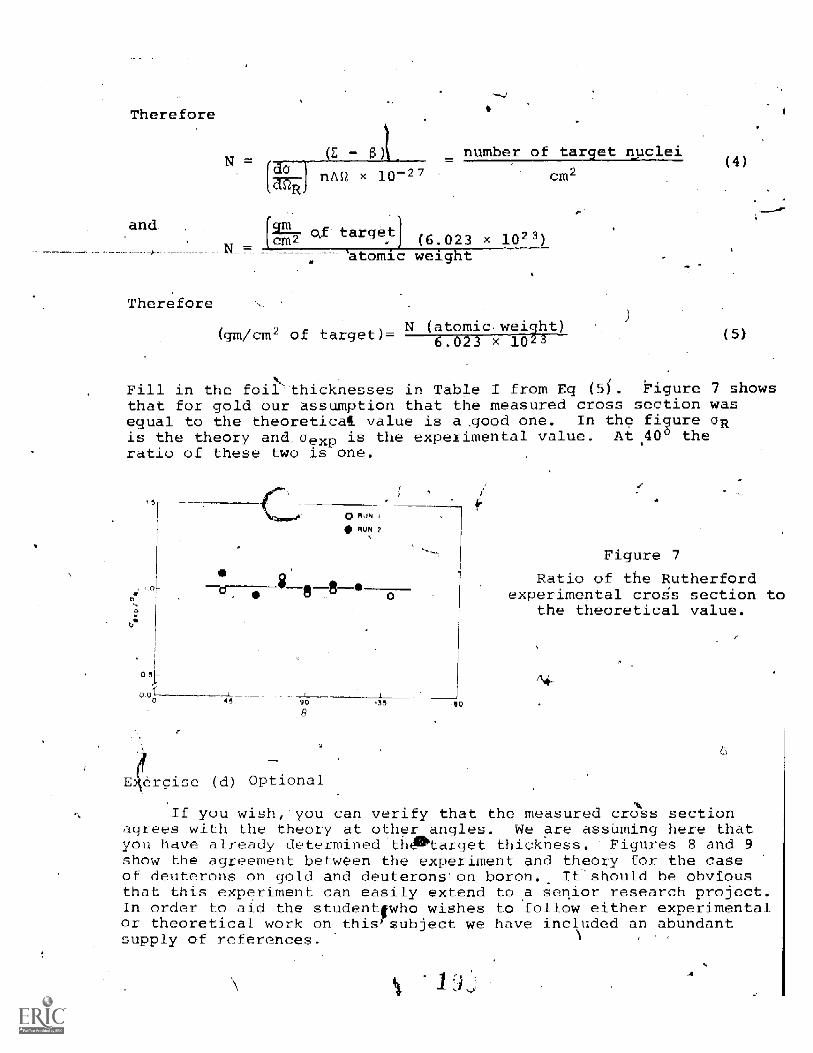
Therefore
and
Therefore
of target
atomic weight
number of target nuclei
N (atomic wei hcm2 of target)- 6.03 x
cm-
(5)
Fill in the foil thicknesses in Table I from Eq (5), Figure 7 showsthat for gold our assumption that the measured cross section wasequal to the theoretical( value=is a .good one In the figure aRis the theory and, clexp is the experimental value. At40e theratio of these two is one.
rcise (d) Optional
Figure 7
Ratio of the Rutherfordexperimental cros section to
the theoretical value.
If you wish, you can verify that the measured cross sectionagrees with the theory at other angles. We are assuming here thatyou have already determined th4Wtarget thickness. Figures 8 and 9show the agreement between the experiment and theory for the caseof deuterons on gold and deuterons'on boron.. It-should be obviousthat this experiment can easily extend to a senior research project.In order to aid the studenttwho wishes to follow either experimentalor theoretical work on this, subject we have included an abundantsupply of references.

4 10a5
5
p
050 100 120
LABORATORY ANGLE (DEGREES)
Figure 8
Measured and theoretical Rutherford scatteringcross section for deuteron* on gold.
io7
10
0
0 4C7-1--60 100 120 1
Se LABORATORY ANGLE (DEGREES)
Figure 9
Measured and theoretical Rutherford cresssections for deuterons on boron,---'
r.
180

Post-Test
1.1. why can only the number of particles passing through a thinfoil and striking the Faraday cup be used to determine thenumber of incident particles? Why shouldn't one consider .
those incident particles that arescattered frqm the foil?
1.2 What i the thickness in cm of a 100in inches? in microns (1 micron -4 10-
m2 thick gold foil?
1.3 If the,theore icai Rutherford differential scattering crosssection ,for prdtons on gold is 63.4 b/sr, what would thevalue be for protons on silver? for protoniton lead? Ifthe proton energy was changed from 2 MeV togi MeV, whatwould the values of the cross sections be for the l_ovetargets? ,
1.4 Assuming a 3 microampere beam of 200 key protons strikes aFaraday cup at the end of a beam line, how much _power Mustbe dissipated?
1.5 For a charged particle passing through a magnetic field,derive an,expression for the radius'of curvature as a func-tion of magnetic- field-strength, B; the rest mass energy,moc2; the kinetic energyT; and the charge of the particle,q
uter Pro -grams
A
GAUS -6 can be used to find the centroids cif the pulserbration ectra. It can also be used to find the elastic scatteredpeak position. LINEAR-6 can be used-to make the calibration ctirve.,The "Rutherford scattering" program will calculate the theoreticalRutherford scattering cross section for the experiment.
Additional References
11. E. C. Andrade, Rutherford and the Nature of the Atom, Doubleday
1964, p. 111.
2. J. L. Duggan, W. D. Adams, R. J. croggs, and L. S. Anthony,Am. J. Phys., 35, 631 (1967).
and Company, Inc., Garden City, N. Y.,
L Duggan, Am. J. Phys., 33, 312 (1965).
4. L. S. Anthony and J. L. Duggan, Am. J. Ph- 35, 194 (1967).
5. J. L. DwJggan, J. F. Yegge, and K. L. Ford, Am J. Phys., 35,-765 (1967).
6. K. B. Mather and P. Swan, Nuclear Scattering, Cambridge at theUniversity Press, Cambridge, 1958, p. 27.
197"
7. J.-B. Marion, "1960 Nuclear Data Tables, Part 3, NuclearReactiomsand Graphs," National Research Council, Superin-a_ndent of Documents, U. S. GovernMent Printing Office,ashtngton,,D. 1960.
8. J. J. Thompson, Proceedings of the Cambridge Phil. Soc.k.Vol. 1, p. 465 T910T7
9. H. _Geiger and E. MaSsden, Proceedings_of_the Royal Socitti(London) Vol. A82, p. 49571109).
10. Ernest Rutherford, "The, Scattering of Alpha Particles by Matterand'the Structure of the Atom," Phil Ma g.,- Vol. 21, p. 669(1911).
2
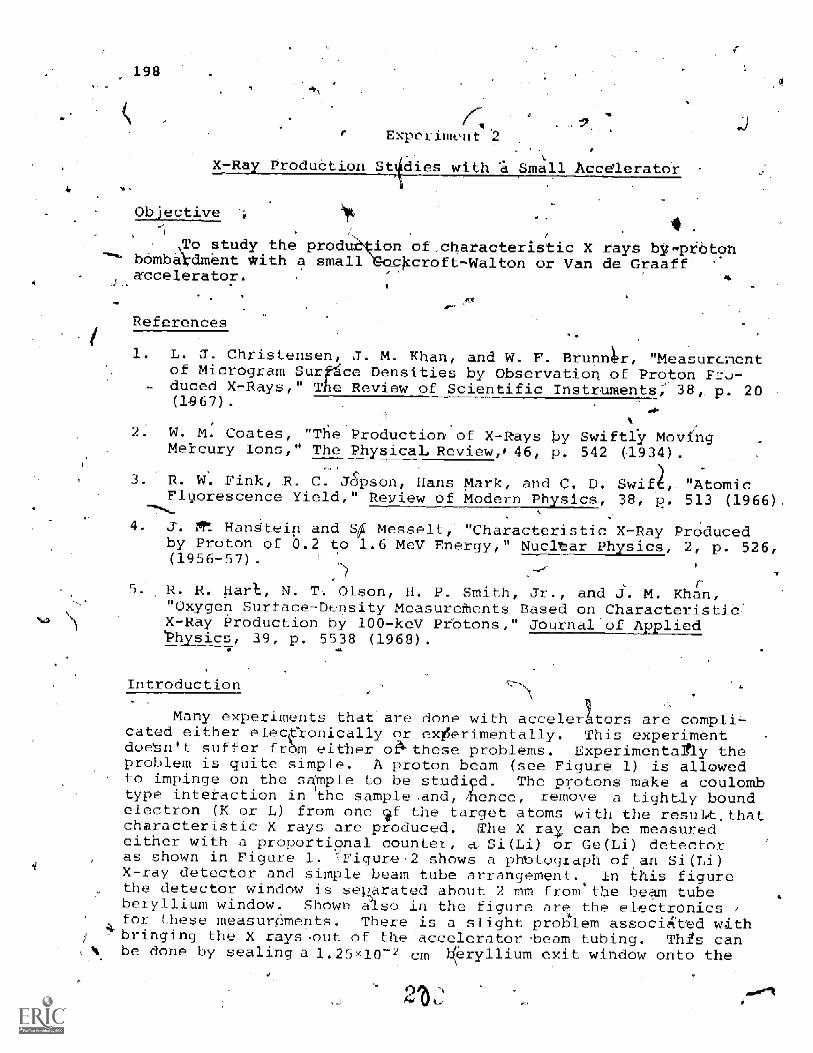
198
Expel inion t
X -Ray Production St dies witty= Small Accelerator
Objective
To study the prodbombadment *ith a smallaccelerator.
0on ofcharacterigtic X rays bit-proton
croft-Walton or Van de Graaff
References
1. L. J. Christensen, J. M. Khan, and W. F. Brunn r, "Measurnentof Microgram Su ce Densities by Observation of Proton F::o-duced X-Rays," Review of Scientific Instruments-;- 38 p. 20(1067) .
2. W. M. Coates, "The Production of X-Rays by Swiftly MovingMekcury Ions," The Physical, Review,146, p. 542 (1934) .
3 R. W. Fink, R. C. JJpson, Hans Mark, and C. D. Swi "AtomicFlyorescence Yield," 1RTii2HallfijiysA2, 38, R. 513 (1966)
4. J. Mt Hanstein and S Messelt, "Characteristic X-Ray Producedby Proton of '0.2 to 1.6 MeV Energy," Nuclear Physics, 2, p. 526,(1956-57).
5. R. R. Hart, N. T. Olson H. P. Smith, Jr., and J. M. Khan,"Oxygen Surface-Density Measureffients Based on CharacteristicX-Ray Production by 100-keV Protons," Journal of AppliedVhysics, 39, p. 5538 (1968).
Introduction
Many experiments that are done with accelerators are complicated either elecA-onically or ex erimentally. This experimentdoe'sn't suffer frT1 either oPk'these problems. Experimentally theproblem is quite simple. A proton beam (see Figure 1) is allowedto impinge on the sample to be studied. The protons make a coulombtype interaction in the sample .and, &nee, remove a tightly boundelectron (K or L) from one if the target atoms with the result thatcharacteristic X rays are produced. The X rah can be measuredeither with a proportional counter, a. Si(Li) or Ge(Li) detectoras shown in Figure 1. Figur.e-2 shows a phbtograph of an Si(Li)X-ray detector and simple beam tube arrangement. In this figurethe detector window is separated about 2 mm from the beam tubeberyllium window. Shown also in the figure are the electronics /
for these measurments. There is a slight problem associkted withbringing the X rays-out of the accelerator-beam tubing. Tills canbe done by sealing a 1.25x10⁻² cm h(eryllium exit window onto the
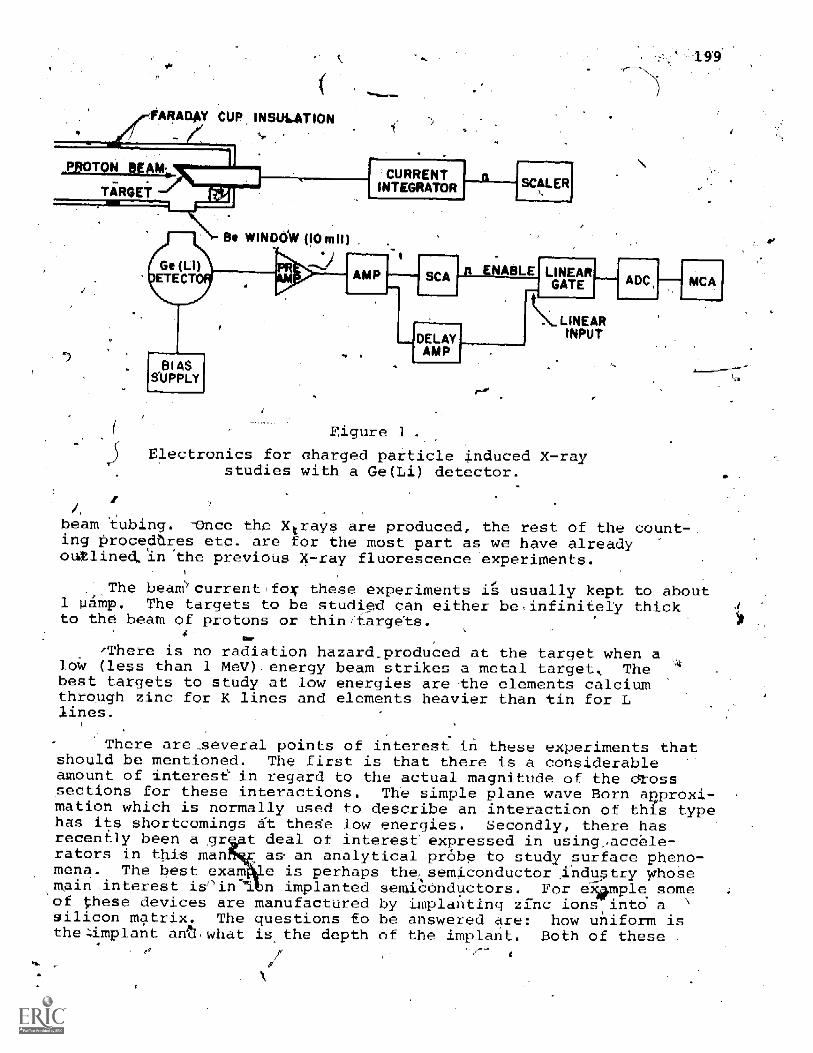
FARADAY CUP INSULATION
Electronics forstudies
ENABLE LINEARGATE
LINEARINPUT
Figure 1
harged particle induced X-rayith a Ge(Li) detector.
ADC
beam tubing. -lance the )(trays are produced, the rest of the count-_ing procedtres etc. are for the-most part as we have alreadyoutline: In -the previous X-ray fluorescence experiments.
CA
The beam''current,fox these experiments i usually kept to aboutamp. The targets to be studied can either be,infiniteIy thick
to the beam of protons or thinitarge'ts.
'There is no radiation hazard_ produced at the target when alow (less than 1 MeV). energy beam strikes a metal target, Thebest targets to study at low energies are the elements calciumthrough zinc for K lines and elements heavier than tin for Llines.
There are -several points of interest in these experiments thatshould be mentioned. The first is that there is a considerableamount of interest in regard to the actual magnitude of the dtosssections for these interactions. The simple plane wave Born avroxi-mation which is normally used to describe aninteraction of this typehas its shortcomings at thege low energies. Secondly, there hasrecently been a gr- t deal of interest expressed in using,.-accele-rators in .this Man as an analytical probe to study surface pheno-mena. The best exam ie is perhaps thesemiconductor .indLltry whosemain interest n implanted semiconductors. For e ple someof 'these devices are manufactured by implanting zinc ionnt6 asilicon matrix. The questions fo be answered are: how uniform istheimplant ant -hat is the depth of the implant. Both of these
1

pigure 2
am TUbe, X- Detector and Electronics for X-Ray asurements

203
problems can be's*.olvedwith charged .particle induced XvraY measure-ments.The unrmityan be determined by sitiPyling the lumber ofZn X rays.that-are prpducea function whefeth9 bedm isstriking the sample. Theldekhcan be me soured by observing thenumber of'X rays produced as 'a function Of bombarding energy. -Thelower energy ions only penetrate a few Angstroms \pato the surfaceana hence,a plot of 'the Zn IV, X-ray yield as a'f4hctiOn Of beamenergy will give the depth of the implant.
Equipment
_Low Energy Accelerator 'h X-Ray Target Assembly; CurrentDigitizer and Scaler
Si (Li) X-Ray Detector
Detector Bias Supply
4. Spectroscopy Amplifier
5. Multichannel Anal
6. Calibration Sources as follows: (all should be standard ±10%)
a) 10 oCi 57Cob) 1 oCi 241Amc) 10d) 10 5ICr
Procedure
1. Place the 10 -oCi'standard source in the position where thetarget will be when being bombarded with the beam. Accumu-late a spectrum for a time period such that reasonable statis-tics are obtained in the calibration lines of interest. Repeatfor the other standard sources listed in Table I. Fill in thepeak channel information in the table.
Remove the radioactive sources and place a thin iron foil inthe target positions, Set the beam current of the acceleratorat around 500 nAmps and allow it to impinge on the target withan incident energy of 150 keV. Collect a spectrum for a longenough period_of time to get reasonable statistics under theFe Ko, peak. Ihtegrate the beam current for each run. Figure 3shows a typical spectrum that was collected under similar con-ditions. Readout the multichannel analyzer. Repeat for the completerange of energies available with your accelerator (in 50 keVenergy increments).
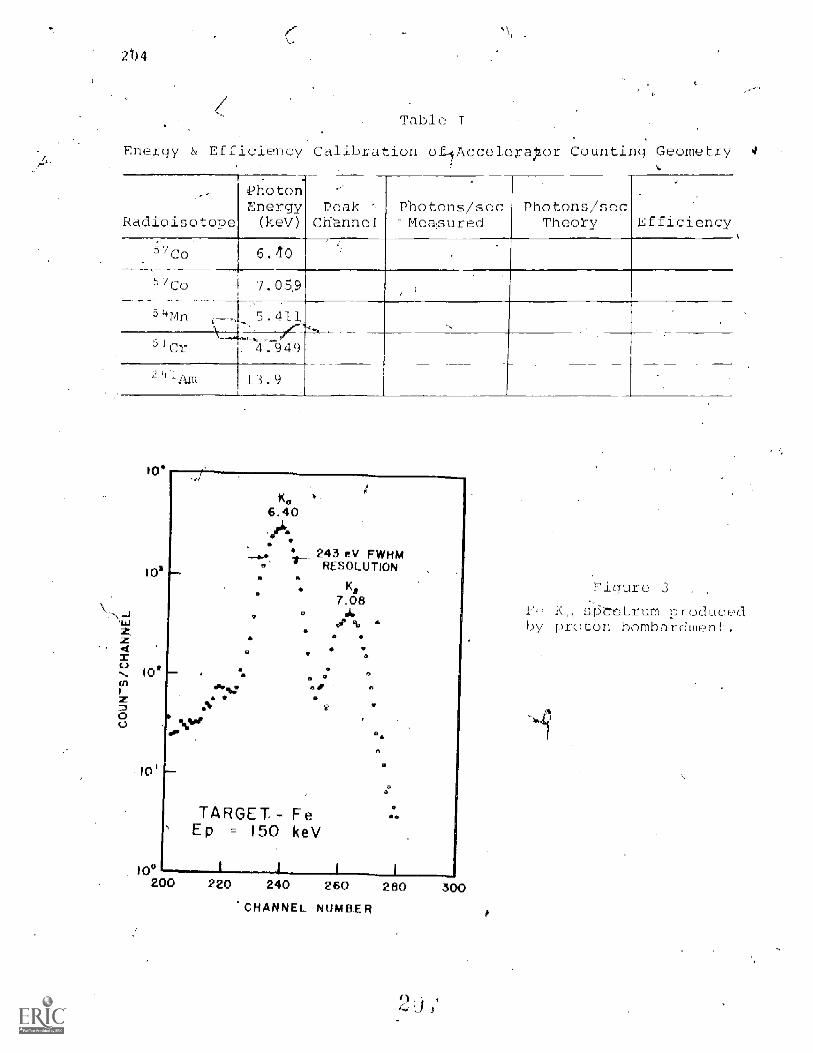
2#4
Table I
Energy & Efficiency Calibration Accelerl r Counting Geometry
Radioisotope
.
PhotonEnergy(key)
--
peakChannel
Photons /secMeasured
Photons/secTheory Efficiency
Co 6.40
57C0 7.0q9
54Mn 5.411,
"Cr d4. 49
21-1 13.9
10-
101
lor
10'
1 °200 220 240 260 280
243 eV FWHMRESOLUTION
K,7.08
%
TARGET- FeEp = 150 keV
CHANNEL NUMBER
300
Figure
spc-etrum produced_TJLon bombardment.
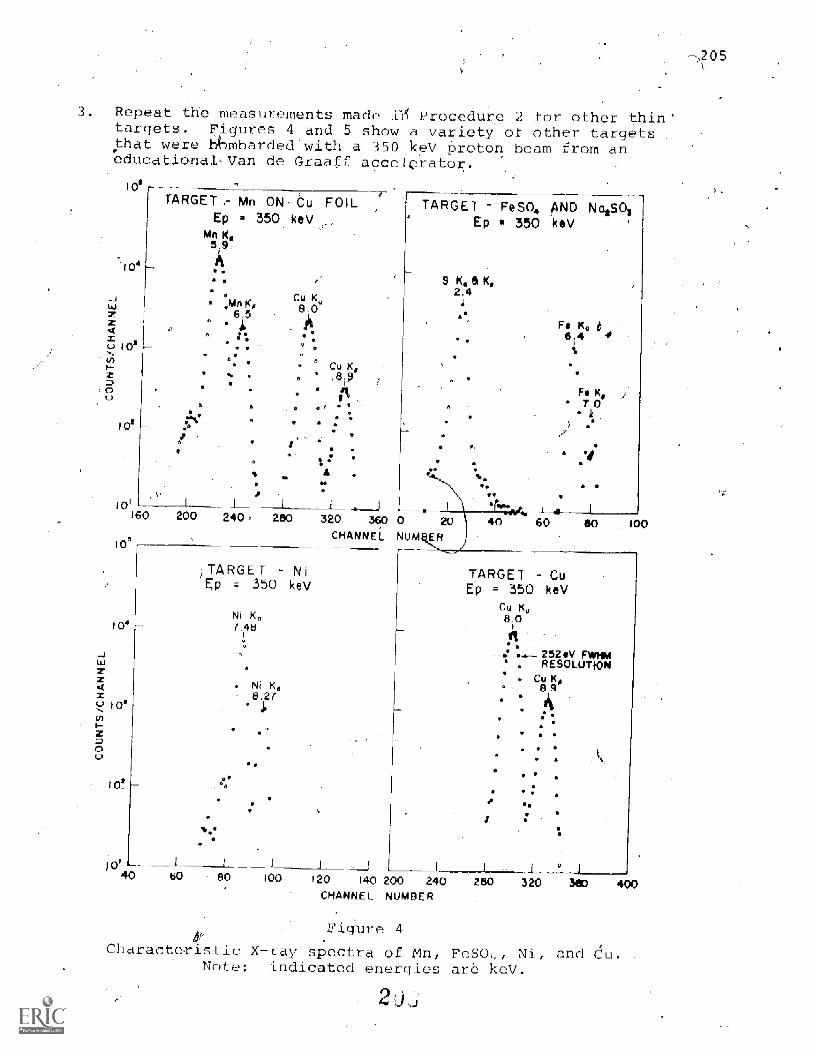
Repeat the measurements made A Procedure 2 for other thin'targets. Figures 4 and 5 show a variety of other targetsthat were blembarded'with a 350 key Proton beam from aneducational-Van de Graaff accelrator.
e
10
zzm(10-
z0
10
101160 200 240 280 20 360 0 20 40 60
CHANNEL NU_ MQB
TARGET Mn ON Cu FOILEp xi 350 keV
Mn K,5.9,
Cu Ka8.0
TARGET FeSO4 AND NoISOEp * 350 keV
K1 & K,2.4
Fe K, 66.4
Ids
104
)TARGET NiEp = 350 keV
Ni Ka7,48
wz
Ni K,z 8.27u 10'
z0
1 1 -- I 160 80 100 120
1
140 200 240CHANNEL NUMBER
TARGET - CuEp = 350 keV
Cu K08.0
252 eV FWHPARES0LUTI044
Cu Ka8.9
280
Figure 4
Charaetexistic X-ray spectra of Mn, FeSO4, Ni, and Cu.Note: indicated energies are key.
2

206
Ci KJ,K,1 K
A 14 3_4.
107
101'
10
_TARGET ON Cu FOILEp 4 350 keV
i 1_ 1
60 120 160 240CHANNEL NUMBER
OD
Cu8.
0
`Sc K44.1!'
.Sc
TARGET a ON Cu FOILE p . 5a keV
Cu
.90
11 1
0 40 SO 120 1 200 240 ZOO 320CHANNEL NUMBER
Figure 5
X-ray production spectra of KC1 1 Sc on copper
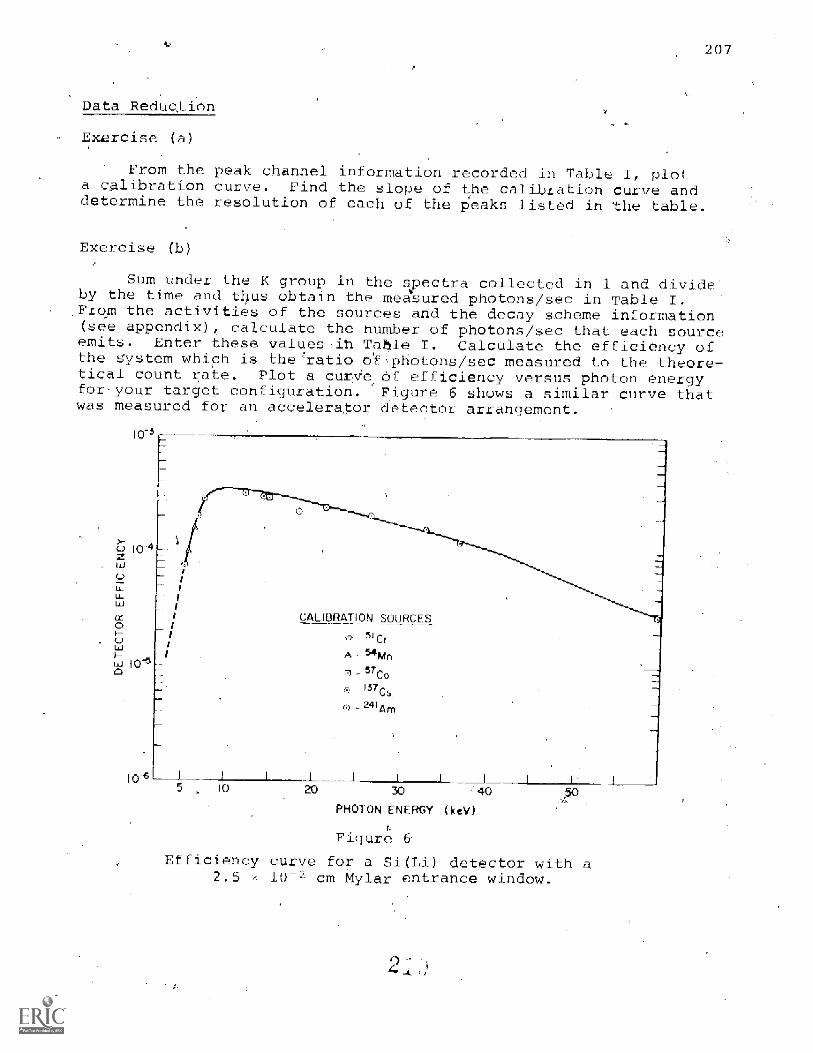
207
Data Reduction
Exercise (
From the peak channel information recorded in Table I, plota calibration curve. Find the slope of the calibration curve anddetermine the resolution of each of the peaks listed in the table.
Exercise (b)
Sum under the K group in the spectra collected in 1 and divide'by the time and thus obtain the measured photons/sec in Table I.From the activities of the sources and the decay scheme information(see appendix), calculate the number of photons/sec that each sourceemits. Enter these values-ih Table I. Calculate the efficiency ofthe System which is the 'ratio 6f,photens/sec measured to the theore-tical count rate. Plot a curVe of efficiency versus photon energyfor-your target configuration. Figure 6 shows a similar curve thatwas measured for an accelerator detector arrangeMent.
icr3
CALIBRATION SOURCES
,15_51cr
A "Nin- 57Co
-137Cs,
24IAm
5 30
PHOTON ENERGY ( keV)
Figure 6
Efficiency curve for a Si(Li) detector with a2.5 x 10-2 cm Nylar entrance window.
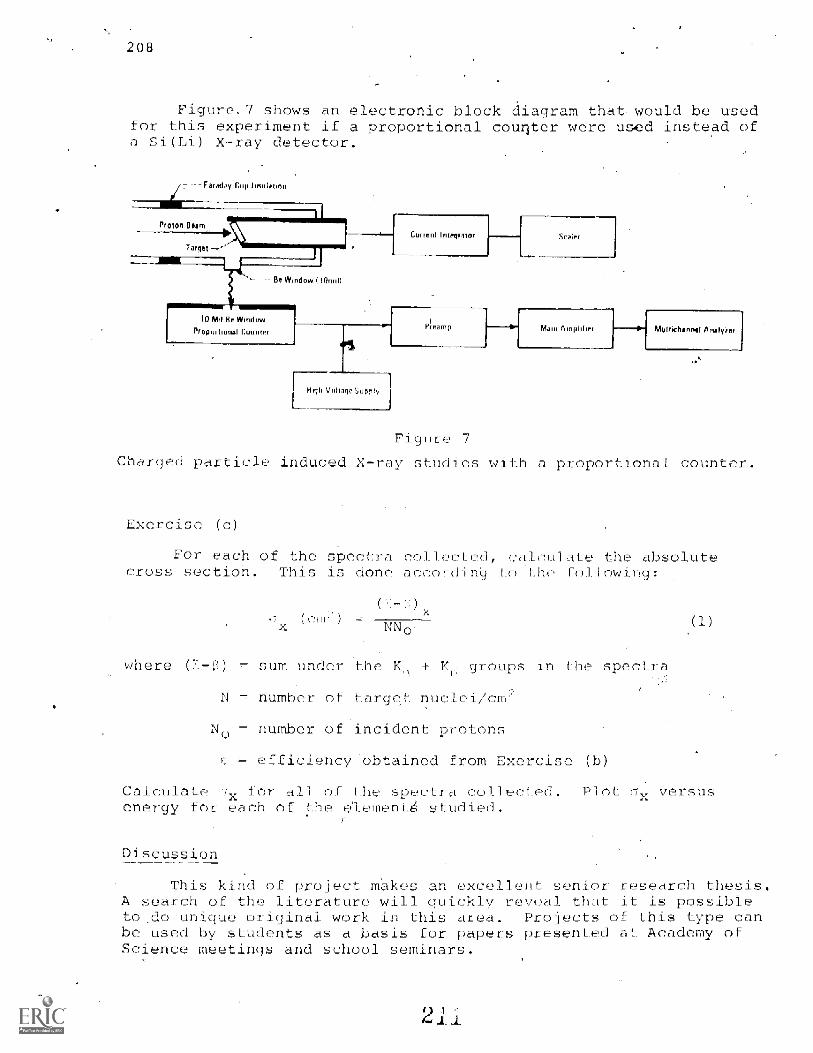
208
Figure.7 shows an electronic block diagram that would be usedfor this experiment if a proportional cour-lter were used instead ofa Si(Li) X-ray detector.
FANKIVICup MWKIri
Proton Beam
WWB@WindMPropMMWICOUntef
Cuft@MInteilMOr
HO Volt fie 50pnly
Piturnp
sae,
NiamAmflaw
Figure 7
Charged particle induced X-ray studies with a proportional counter.
Exercise (a)
For each of the spectra colleeted, i:alculate the absolutecross section. This is done accord mg to the following:
-V)
NN,7),
where sum under the K groups in the spectra
N = number of target nuclei
No number of incident protons
efficiency obtained from Exercise (b)
Calculate for all of the spectra collected. q_ versusenergy for each of the elementg studied.
Discussion
This kind of project makes an excellent senior research thesis.A search of the literature will quickly reveal that it is possible_to .do unique original work in this area. Projects of this type canbe used by students as a basis for papers presented at Academy ofScience meetings and school seminars.

Post -Test
209
2.1 Why do X-ray energies increase' uniformly with'uatbric number. Z,while. the energies of optical lines are'sofor adjacent elements in the periOdic table?
Computer Programs
GAUSS-6 can'be used to find the ventroidS of the ppa LINEAR-6can be used to least squares fit the calibration data.
Additional References
1. J. Chadwick, "The u Rays Excited by the PD Rays of Radium; yhil.Mag. 24, 594 (1912).
2. E. Merzbacher and H. W. Lewis, "X-Ray Production by Heavy ChargedParticles," Encyclopedia_ of Physic5, S. Fluggee editor, Vol. 34(Springer-Verlag, Berlin: 1958).
3. Jopson, Hans Mark and C. D. Swift, Phys. Rev. 127, 5, 1612(1962).
4. J. M. Khan and D. L. Potter, Phys. Rev. 133, A890 (1964).
M. Khan, D. L. Potter, and R. D. Worley, Phys. Rev. 1_34,A316 (1964).
6. J. M. Khan, D. Potter, and R. D. Worley, Phys. Rev. 135,A511 (1964).
7. J. M. Khan, D. L. Potter, and R. D. Worley, Phys. Rev. 136,A108 (1964).
J. M. Khan, E. L. Potter, and R. D. Worley, Ph-s. Rev. 139,A1735 (1965).
9, R. P. Sharma, B. V. Thosar, and K. G. Prasad, "X-Ray Yields fromK hell-ionization by 't Particles," Phys. Rev. 140, A1084 (1965).
10. J. M. Khan, D. L. Potter, and R. D. Worley, Phys. Rev. 145,23 (1966).
11. W. Brandt, R. Laubert, and I. Sellin, Phys. Rev. 151, 56 (1966).
12. J. M. Khan, D. L. Potter, R. D. Worley, and H. P. Smith,Phys. Rev. 148, 413 (1966).
13. B. Sellers, H. H. Wilson, and J. Papadopoulos, "Heavy ParticleExcitation of Low Energy Characteristic X-Radiation-Analyticaland Experimental Correlations," Proceedin of 2nd S mposiumon Low-Ener X- and amma-Sources and A. lications, QRNL- IIC -10,
576 (1967
210
414. C.J4. Marks, W. P. Saylor, and A; A. Stork, "X-Ray Anhlysis by
Proton-Bombardmeni-," Prpceedings-EafpaILITon Low-EnergyX-. and .Gamma-Sources- a d a2.lication§, ORNL-ITC-10, p. 587

211
ANSWERS TO QUESTIONS AND PROBLEMS
Pre-Test Answers
1.1 1 keV = 1000 eV
1 MeV = 106 eV
1 GeV = 109 eV
1.2 1 eV = 1502 x 10-"
1 eV = 1.602 x 10⁻¹⁹
E'2.1 f =
11.92 ,< 103 eV
erg
joules
77710-27 erg-sec
2.88 x 10¹⁸ sec-1
c
3 x 1010 cm/sec2.11 10 8 SeC-
1.04 x 10-8 cm
x 1.602 x 10-12 ergeV
3.1 The force is given by the familiar coulomb's law for pointcharges,
F = 1
4Hcc,q2
r2
where qi and ch are the electronic charges, r is the distanceseparating the proton and the electron and co is the permit-tivity of free space and has the value F:n.= 8.854 x 10⁻¹²cou12/n-m2.
The distance r is radius of the smallest Bohr orbit and isgiven by f
rme2
Multiplying both numerator and denominator by c2 and.._
rearranging gives

212
rmet c2
197.32r =
Hence,
_V 7 fermis
0.511 MeV137
= 0.529 x 10- cm.
F1
x 10-- cou_-
= 8,222 x 10-
(1.6 x cool)`CO. 529 x 1-71) 2
4.1 The magnetic force is given by the expression.
F © quB.
The velocity of a 150 keV proton is
5.1
2(150 103 eV (1.5 x 10⁻¹⁹ joule
36 - 106
1.67 x 10- kgm
msec
Therefore, the magnetic force is
F © (1.6 x 10 -I± cou1)(5.36 x 10⁶
(10-6 -xw'-7-'b"m2 gauss
= 5.15 x 10⁻¹¹ newton
-d Rut _4ford = 1.296sin -
H
0.6 x 10⁴ gauss)
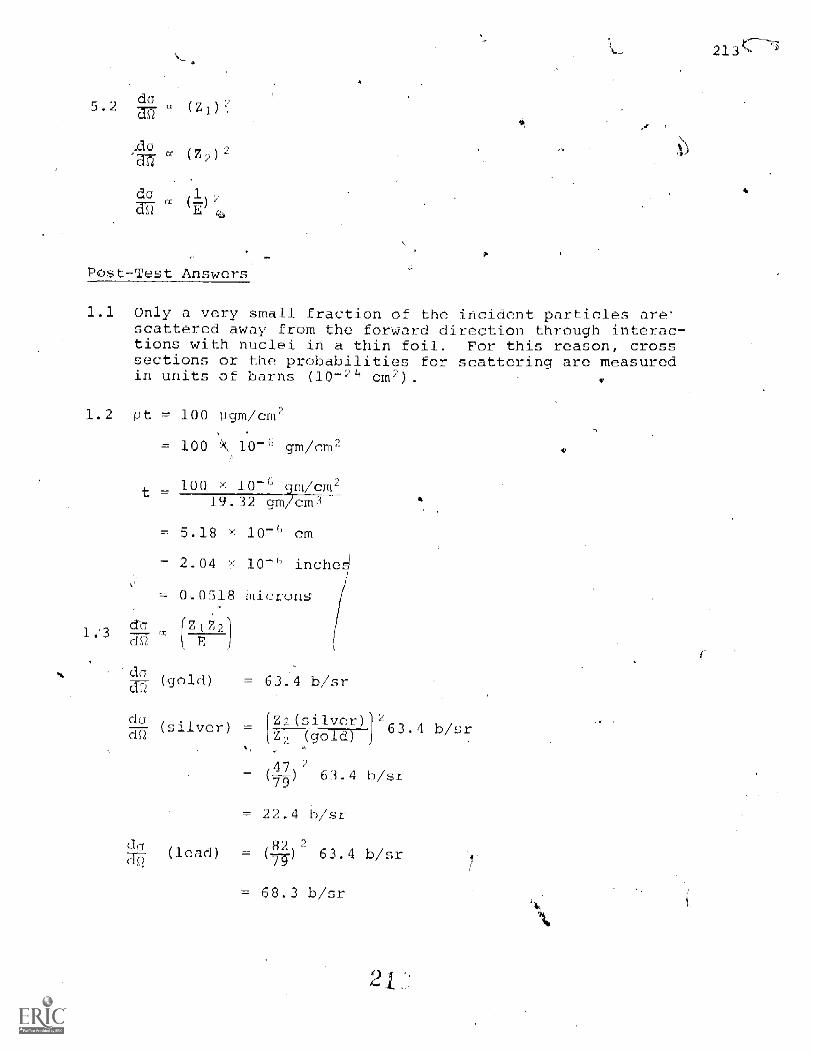
do5 2 ( Z )2,*
z,
Post7Test Answers
1.1 Only a very small fraction of the incident particles arescattered away from the forward direction through interac-tions with nuclei in a thin foil. For this reason, crosssections or the probabilities tor scattering are measuredin unit_ of barn (10- 24 cm2).
1.2 pt = 100 pgm c
1.3
= 100 X.. 10-6 gm. cm2
100 x 10=6 am/cm2t
l9.-327
5.18 x 10⁻⁶ cm
= 2.04 x10⁻⁶
0.0518 Microns:
do
do
dS-2
ild) = 63.4 b/s
silver Z2(silver63.4
47 2--) 63.4 b/sr79-
= 22.4 b/sr
do(lead)T7 63.4
68.3 b/sr
213--

214
For 1
di4
do
aV incidaat protons
old) 63.4
=. 4 (63.4 b/s:r)
253.5 b / s£.
silver) = 89.6 b /sr4
do(77 (lead) = 273.2 b/
.4 Power (3 10-'" ampere) 0. 10b eV)
0.6 watts
1.5 From Newton's- second law
ma = F
mu quB
quB
q9
The total relativistic energy of the charged -rticle may bewritten
or
But theenergy
oq = p'c
1P
c
total energyand the test
f
m-e4
maymass
me- = T m
-c"0
be written in terms of the kineticenergy
Squaring both sides of this expression gives
M T m2c40 0

Sub titutirg thein expression for thethe
Hence,
21 C2-
215
-entum p, results in
the radius of curv'atur_ __ay be written
T2
2.1- The:energy of the characterisic X rays depeuds on the bindingenergies of the electrons 1n the inner shells. With increasingatomic number Z, these binding energies increase rather uni--formly with increased nuclear charge and are very littleaffected by the periodic changes in the number of electronsin the outer shells.

217
APPENDIX LISTINGS
I Relations Concerning Sq2-2t4d121-22t2OLUse and
-a Nonexhaustive Radloisoto e Vendor File
II 121LosDeveloped for R Da his
III iFleadtorerator Facil ty Sharing Pro
4Absolute Disintegration Rates me of the Most
Commonly Used X-Ray and Gamma Ray Calibration
Sources
Ray _iti 1-Absorptior aid I ni s sloe iergie in KeV
VI ,Relative Sensitivities of Elements Neutron Activation
(Thermal)
VII major Gam-1mi Rays (b served in Net. ation
VIII General Textbook References for RadioiRadioisotope E
IX Government'Pro_ ZJITO that are Des 1. Colle-and UnlversltieswAth the Flundio -
tif12WPM011-7,
218
APPENDIX I
Regulations Concernin 'Safe Radioisot Use and hexhaustive
.Radioisotope Vendor File
All users of radioisotopes must follow regulations concerning
safe radioisotope use. A copy of Code of Federal Regulations,
Title 10 - atomic Energy, Chapter Pa Standards for
Protection Xgainst_Radiation, and Part 30 - Licensing of _Byproduct4
Materials should be obtained by all potential users. A free copy
can be obtained by writing:
Administrator for Nuclear EnergyEnergy Research and Development, AdministrationWashington., D. C. 20545
An exhaustive list of manufacturers that supply radioisotopes
for educational use can be found in the Isotope. Index, J. L.
Sommerville, Ed., Scientific Equipment Compan Publications__-
Department, P. 0. Box 19086, Indianapolis, Indiana 48219
(Price $2:00). Listed below are some names and addresses of a
few companies from the Index. All of these companies will be glad
to furnish upon request descriptive literature with regard to their
iso opes.

Abbott LaboratbriesRadio-PharliadqttlohlsAbbott Park _I
North Chicago;'Illinoi 60604
At,,ic Corpoi tion of America790 Fernando RoadSu ley, California 91352
Bio-Rad Laboratories1257 South 32nd Street 7
Richmond, California
Cambridge Nuclear. Corporation131 Portland StreetCambridge, Massachusetts 02139
Cherriftac Corporation
Radiochemical Division ofBaird-Atomic, Inc.
33 University RoadCambridge, Massachusetts 02138
General Radioisotope ProcessingCorporation
3600 San Ramon Valley BoulevardSan Ramon, California 945_3
New England Nuclear Co-mcwation575 Albany StreetBoston, assachusetts 02118
NuclearChieago Corporation3%3 East Howard AvenueDes Plaines, Illinois 60018
Nuclear Consultants Corporation0842 Manchester RoadSt. Louis, Missouri 63119
Nuclear Rf.--Ipnroh
Nuclea SuppliesP. 0. Box 312Encino, California 91316
219
Nuclear-Science and EngIneeringgorpOration
P.'0. Box 10901Fittburgh Pennsylvania 15236
Nucleonic Corpoit.iitipn of America196 Degraw StreetBrooklyn, NeW YOrk -11J31
The NucleusP. O. Box R'Oak Ridge, Tennessee 37830
ORTEC, Inc. .
100 Midland RoadOak Ridge, Tennessee 37830
Schwarz Bio-Research, Inc.MountaApview veniinOrangeburg, New York .1096,1'2
Squibb, F. R., & SonsRadiopharmaceutical DepytmentGeorges RoadNew Brunswick, New Jersey 08903
Tracerlab Inc.Technical Products Division1601 Trapelo RoadWaltham, Massachusetts 02081
U. S. Nuclear CorporationP. O. Box 208Burbank, Caalfornia 91503
Volk RadioThemica] Company8360 Elmwood Avenue
I

Appendix II
Pro rams Developed for Reducing Data in this Manual
General Remarks
*4v,
These programs have been written for the reduction of experiments
in this manual. In each case, adequate testing has been done to assure
the author that the program works. . at least when he runs The
programs have been written for the most part in Basic Language. It'should
be quite easy to modify a given Program so that can be used on the
computer in your school.
If programs can be used to reduce the data in these experiments, they
should be, since this makes =the whole experience more meaningful.
There are descriptions, instructions, and examples on the pages that
follow. Examine them carefully.
THERE ARE MANY WAYS FOR YOU TO LOUSE -UP A PROGRAM .
The most obvious of these is to input bum data No matter how clever
a programmer becomes, he can never provide for erroneous input . . . and
the poor computer is too dumb to know the difference. It treats everything
as Gospel. The result will be garbage . and you'd better bs. pie to
recognize it before you go bragging about your most recent discovery.
The best place for bum data to hide is in BIG data bloOks.' Edit these
efully with particular attention to the placement commas. Omission
of one comma can be a disaster .
substituted for a comma or vice versa.
Be sure that a decimal has not been
anspdsed numbers represent still
another trap and are among the more difficult input errors to find.
It i5 imperative that the data be placed, in the order described in the
Edit your input to running programs equal care. Mostly, an error
detected before'the'RETURN key is preA4ed while the RU OUT key can comea
to your reocue. Once RETURN is pr _ed, there is no recovery - Abort
the -n with CTRL /C and try again.
A truly effective way for user to program is to DELETE a line
number after loading the program, 'phi- be 4one quite innocently when=
he starts typing data before listing a
221
number and DATA statement .
now suddenly realizing his mistake, he pres es RETURN to try again. ZAP'.
There goes a line whose number happens to coincide with the data. Sometimes
this will be detected by the compiler . Most often not.
When you decide you've loused up a data line so badly that it roust be
retyped . use the ALT-MODE key instead of the RETURN. Don't try to
patch 4 piUtilated program, it is better to reload it and start again.
Lots of LuCk
222
P RAM NAME: LINEAR 6
This program computet a' linear least-squares fir o a set ofvariables of-X and Y.
INPUT
The sl4s intercept and their standard deviations are provided.The data is then examined to locate points which are statisticallyinvalid by application of Chauvenet's Criteria.
The user'has the option of imputing values of the independentvariable to obtain the corresponding dependent variable at theconclusion of the run.
It is necessary to prepare a data-block before
instructions for preparing the data block
ning the program.
etc" (see SPEC)
Input the number of data pairs when asked for by the running pro-gram.
OUTPUT
1. The type -.rid intercept
The s-111-1 rd deviation o
ChauvenuL's Reject Levelin standard deviationC The Residuals5. A refitting if point is rejected
OPTIONS
1. Input a, value of X to obtain the corresponding Y

.F NA E: LINEAR 6
RATIONALE
Slope, M
Intercept, B = (Ey - mEx)/N
Determinant, D = Ex2
Intercept Error, Y3 =
Slope Error, M2 D
Ey)2 /N D
Chauvenet's Reject Level, algorithm.C = 2 in(N/11) sigma
2.3
Residual/Y3 Si
(N - 1))1 2
223

224
HASI
NEV. C r. CLD--G
CLU Pl&Gi-AM NA :.--LINEPh 6
L I S 1 Is
1 >1 INS1LUA7I
4 7- IN E/11 L)A1
5 ihEM 1 XAMPLE
LINEAH LEA-_ _OUAh
6 FEM' 501 DA1A YI >1.2, YP,7 FEY' 502 11A4A Y3s Y3s :44s Y4, JAS, Y5
EM 11 ISIMPUh1AN1 1C, SEPAHA1E EACH9 HEM. 14 IS ALSO IMPUhTANI 1(.UMI1 1HE10 HEX FIE. SUHE 1U COUNI.YOUis EN1hY HAIhs11 HM THEIM MUST HE MOEIE THAN 1WL!!
INI "LINEWi LEASI1-506AhES Ph(JOh&v)"fNi
31 INT THE NV/4HE'. CO' DA1A", r AI1t3 IS
15 1J N>2 1HENPINT
37 !--'7TNT "MCkE DATA, RLIKASE.1!"3)4 HHINT HLIN15 DEIEHMINE A SlHA UH1 LINEA"40 STOP50 FGh 1=1 IC N
HEAL Y
LE1 =4'1,1-1-X
LET X2mY2+y.f:-=!110 LE1 S=S+X*Y-111-LEI<Y1=Y14-Y
IALLY
Y 1 111 A CUM-A A7 THL LN1..) OF Lr
127130135
LE1 V2=Y2+Y tyNEY1 I
40137 CI-AC, 235140 11-1 X=5Xl*Y1/%170 LEI P=:,1;4.11
L171 X-==:,./14
171 LE1 1 ==(Y1M175 i(A
1 ICEri "H1"0 LET- Y39rh((y 1TP/ND*MtP )lIN-2
LEI MP=Y3/50h_210 FLIN1 "UE(.is "DEVIAlIU4 "Y3f-)21 HINT:10 HEILIhN
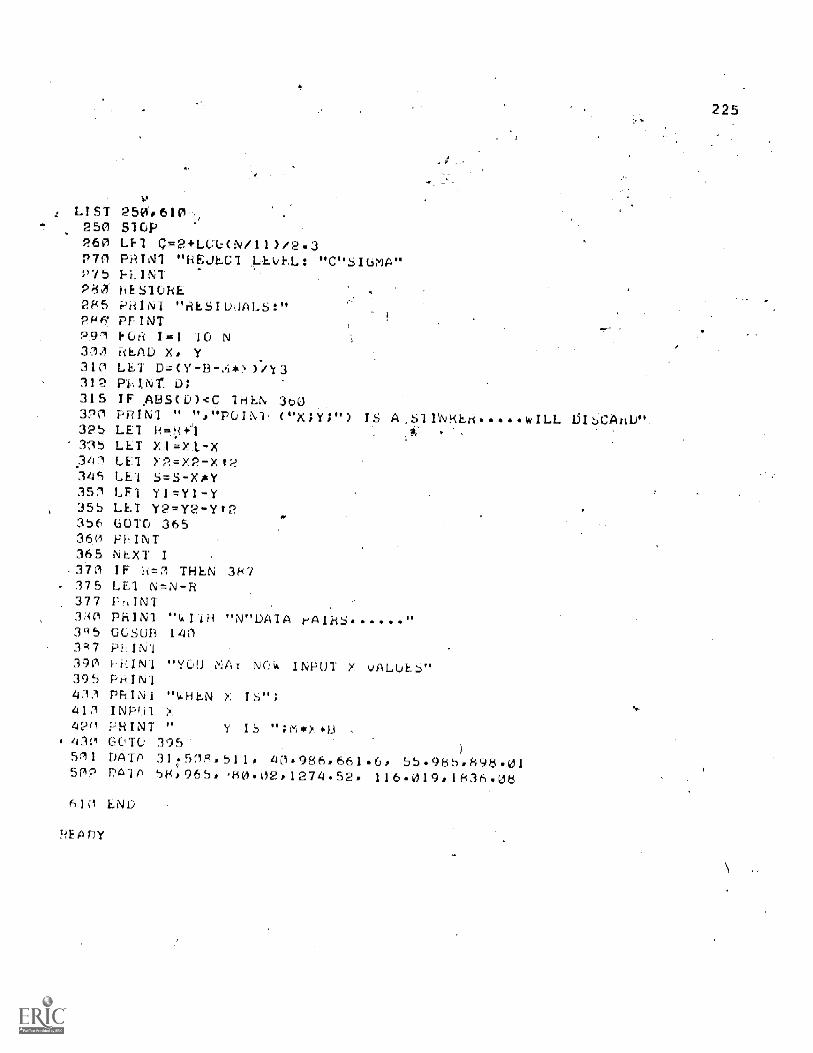
LIST250 Si260 LE- rz2+1-01.:(N/11)_2o3R70 PRIG] "REJEC11,-El,EL: "C"SIGP75 1-i
hES ORE2R5 PHINT "RESI1A)_P-46 PFINT291 FOh 1=1 TO N330 READ X, Y31C LET D=CY-B-312 012Nr 0;315 IF ABSCD)cC 'THEN 360320 PRIN1 " ","POIN.h c-x;yv.) IS A -N12 LEI liFti+
'335 LET X4=Xt-X341 LET Y2 =X2 -X t2345 LET S =S -XiY351 LEI YI=Y1`Y355 LEI Y2=Y2-Y'2356 GOTO 365360 HINT365 NEXT I
-370 IF h=0 THEN 387, 375 LEA N=N-B377 FRIN7T'AO PRIN1 ' " AlA PATHS3°5 OLSUb 1401'47 PhiN4390 hhIN1 "YOU INPUT Y VALUES"395 Ni413 PhIN1 "THEN411 INPU1 X421 PRINT ©
410 GOTO 395'511 DATA 31.508,511, 40..986/661.6, 55.985,898.01502 PA1A 54p965, 'RO. 2o1274,52, 116.019,1836.08
Y I
610 END
READY
LL CA D"
225
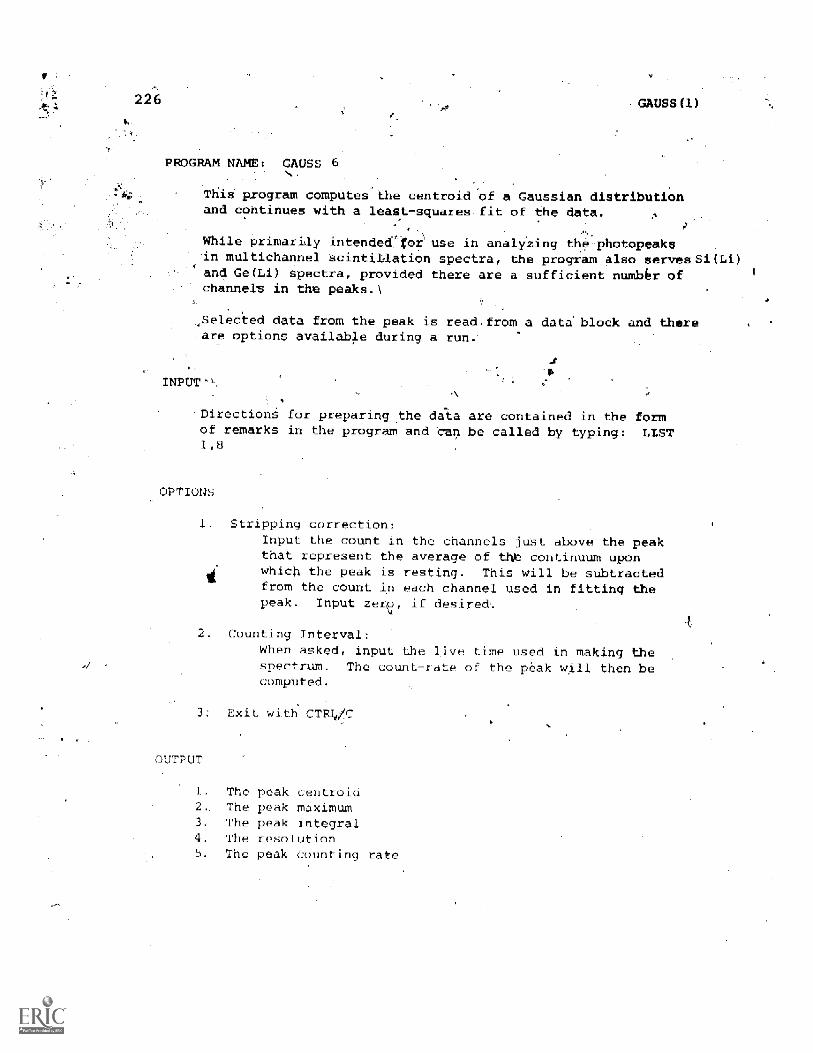
226
PROGRAM NAME: GAUSS 6
GAUSS (1)
This. program compUtes the centroid Of a Gaussian distributionand continues with a least squares fit of the data
While primarily intended7foe use in analyzing the-photopeakSin multichannel scintiLlation spectra, the program also serves Siand Ge(Li) spectra, provided there are a sufficient numb6r ofchannels in the peaks.\
,Selected data from the peak is read from a data block and thereare options available during a run.
INPUT
Directions for preparing=__ the data are contained in the formof remarks in the program and Can be wiled by typing: LIST1,8
OPTIONS
1. Stripping correction:Input the count in the channels just above the peakthat represent the average of th continuum uponwhich the peak is resting. This will be subtractedfrom the count in each channel used in fitting thepeak. Input z- if desired,.
Counting Interval:When asked, input the live time used in making thespectrum. The count -rate of the peak will then becomputed.
3. Exit with CTIR1,
OUTPUT
1. The peak centroid2, The peak maximum3. The peak integral
The resolution5. The peak C:ounting ra

GAUSS(4) 227
RATIONALE
xo = Exy2/Ey2
y0Exp[6(x-y21
b = --EXEY/N
(EX,Y2/N
yo = EXPNEy-SEX)/N1
Ey Yo
2 In n.5P
x channel n er
a count
centroid of peak
X (x-x-)2
,Y In y
N the number of data pairs
b the Gaussian constant,
y the count at the centroid, xa
Ey the integral of the Gaussian
the resolution
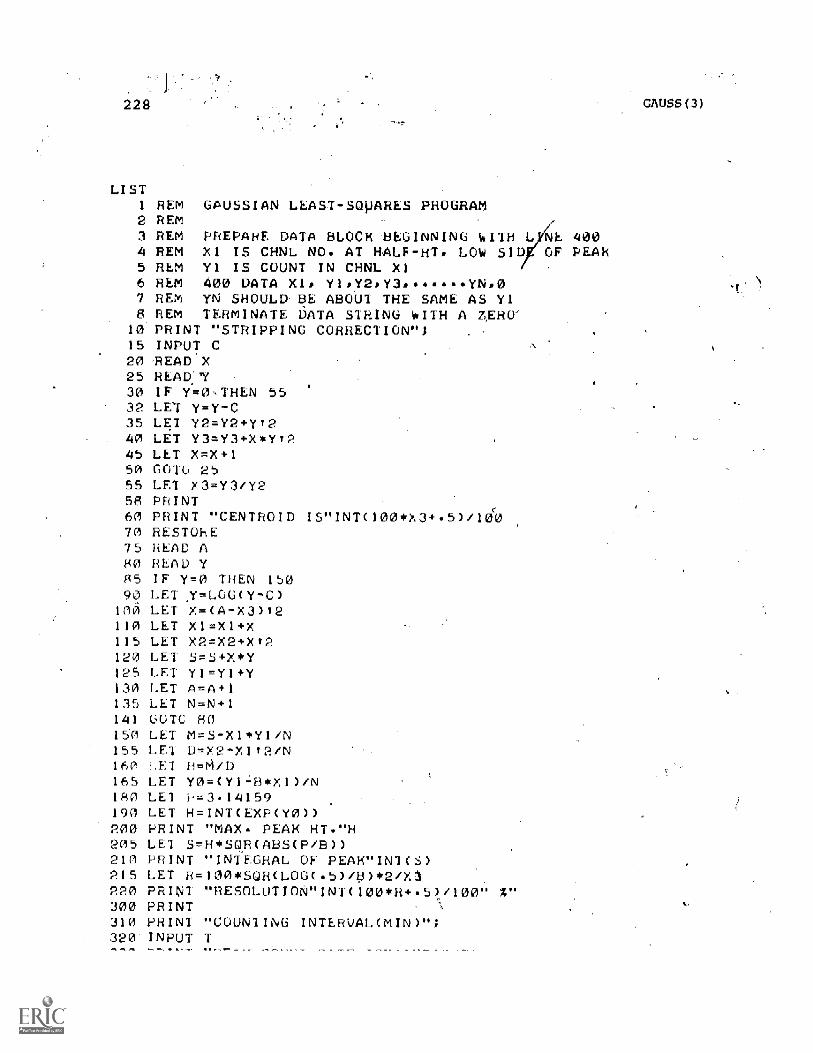
LIST
2
3
4
5
6
7
8101520253032354045505558607075SO8590
Inv)
110115120125130135141
1 501551 60165180190200205210215
REMREMREMREMREMREMREMREM
GAUSSIAN LEAST-SQUARES PROGRAM
PREPARE DATA BLOCK BEGINNING WITH L NE 400XI IS CHNL NO. AT HALF-HT, LOW SID OF PEAKYI IS COUNT IN CHNL XI400 DATA Xl. Y1.y2.Y3 YN.0YN SHOULD BE ABOU1 THE SAME AS YITERMINATE DATA STRING WITH A ZERO'
PRINT "STRIPPING CORRECTION";INPUT CREAD XREAD:"YIF Y=0,THEN 55LET Y=Y-CLET Y2=Y24.Yt2LET Y3=Y3+X*Yt2LET X=X+1GOTO 25LET X3=Y3/Y2PRINTPRINT "CENTROID IS"INT 00*x .5 I doRESTOREHEAD AREAD YIF y=0 THEN 150LET '''=LOG(y-c)LET X=(A-X3)T2LET XI=X1+XLET X2=X2+Xt2LET S =S +X *YLET y1=Y1-FYLET A=A+1LET N=N+1GOTH: 80LET Mr-S-X144Y1/NLET D=X2-X112/NLET f1=M/DLET Y0 =(Y17H*X1)/NLET F=3.14159LET H =INT(EXP(Y0))PRINT "MAX. PEAK HT."HLET SmHsSOR(ABS(P/B))PRINT "INTEGRAL OF PEAK"INTLET R=100*SOR(LOG(.5)/151)*2/
220 PRINT "HESCLUTION"INT(100*13 .5)/100" %"300 PRINT310 PRINT "COUNTING INTERVAL(MIN)";320 INPUT T
GAUSS 3 )
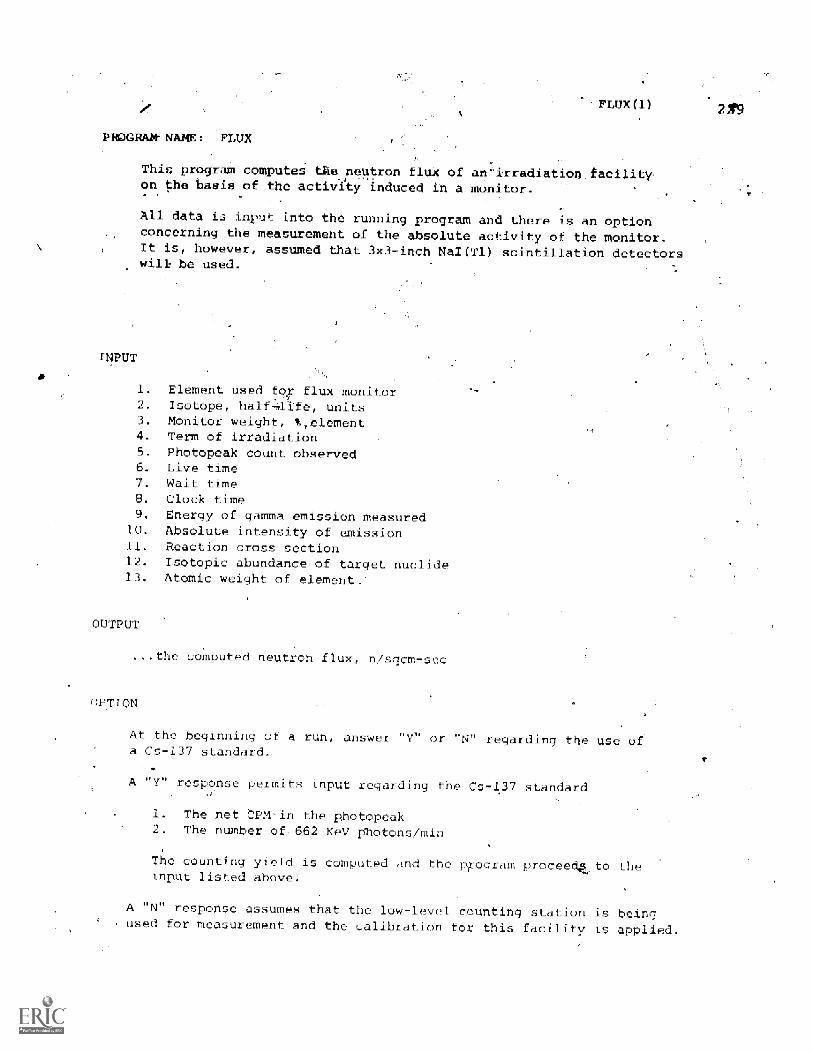
FLUX (1)
PROGRAM- NAME: FLUX
This program computes the neutron fluX of anirradiation_ acilitrOn the basis of the activity induced in a monitor.
All data is input into the running program and there is an optionconcerning the measurement of the absolute activity of the monitor.It is, however, assumed that 3x3-inch Nai(T1) scintillation detectorswill be used.
INPUT
1. Element used for flux monitor_
2. Isotope, half life, units3.. Monitor weight, %,element4. Term of irradiation5. Photopeak count observed6. Live time
Wait time8. Clock time9. Energy of gamma emission measured
10. Absolute intensity of emission11. Reaction cross section12. Isotopic abundance of target nuclide13. Atomic weight of element_-
OUTPUT
..the computed neutron flux, n/sqc -sec
OPTION
At the beginning of a run, answer "V" or "N" regarding the use oa Cs-137 standard.
A "Y" response permit, input regarding the Cs -1.37 standard
1. The net CPM in the photopeak2 The number of, 662 KeV photons /min
The counting yield is computed rind the p,roornm proceeinput listed above.
A "N" response assumes that the low-level counting station is beingused for measurement and the calibration for this facility is applied.
211.9

230
LISTPO PRINT AAS CS -137 STANDAkD COUNTENY'OR N25 INPUT A%-,30 IF AWf" THEN 40035 LET R=.089-40 PRINT45 ,PRINT "ELEMENT USED FOR FLUX MONITOR";50 INPUT E$55 PRINT "ISOTOPE, HALF -LIFE. UNIiS(MiNplih)60 INPUT i$,T,U$65 LEI L=LOG(2)/17A PRINT75 PRINT "MONITOR 11d1.(MG),2 "8( INPUT 6,P085 PRIN1 " TERM OF IRRADIAT ION90 INPUT 1595 LET S=1- X -L*15)100 PHINI COUN15 OBSEkVEU";105 INPUI N110 PRINT LIVE-TIME(MIN)";115 INPUT T3120 PRINT " IIME IN US;125 INPUT T-11130 IF US"MIN" THEN 170140 LET R=N/(T1*EYP(-L*T1))150 G010 200170 PRINT " CLOCK 1IME(MIN175 INPUT180 LEI N=N*T2/13185 LET R=N*L/(EXP(-L 11+12200 PF,INT230 PRINT "GAmmA EN1-1.1'y mEA5u1,ED( Eu),235 INPUT EiI240 LET E-E/1O00250 L1-1 'r=v,ET.9255 LEI ,o-p/(yal)* 00/60260 HANI "OLOs!_; :,ECIION(13265 INPU1 CP70 PRINT "A UNDoNCE CE 1A 1 NucL10E()";275 INPUT280 -! IN1 "filLmIC "ES;285 INPUT290 LET Nmck,/1.0 k e/100*6.0-3295 LEI F=i1/(N 1 -24*L-;)
.10 I-1.1NT
31.0 PhIN1 .1-LOX IS"1- NEuls. O' -5EC1 320 (A-
T
415 INPUT G
FLUX (3)
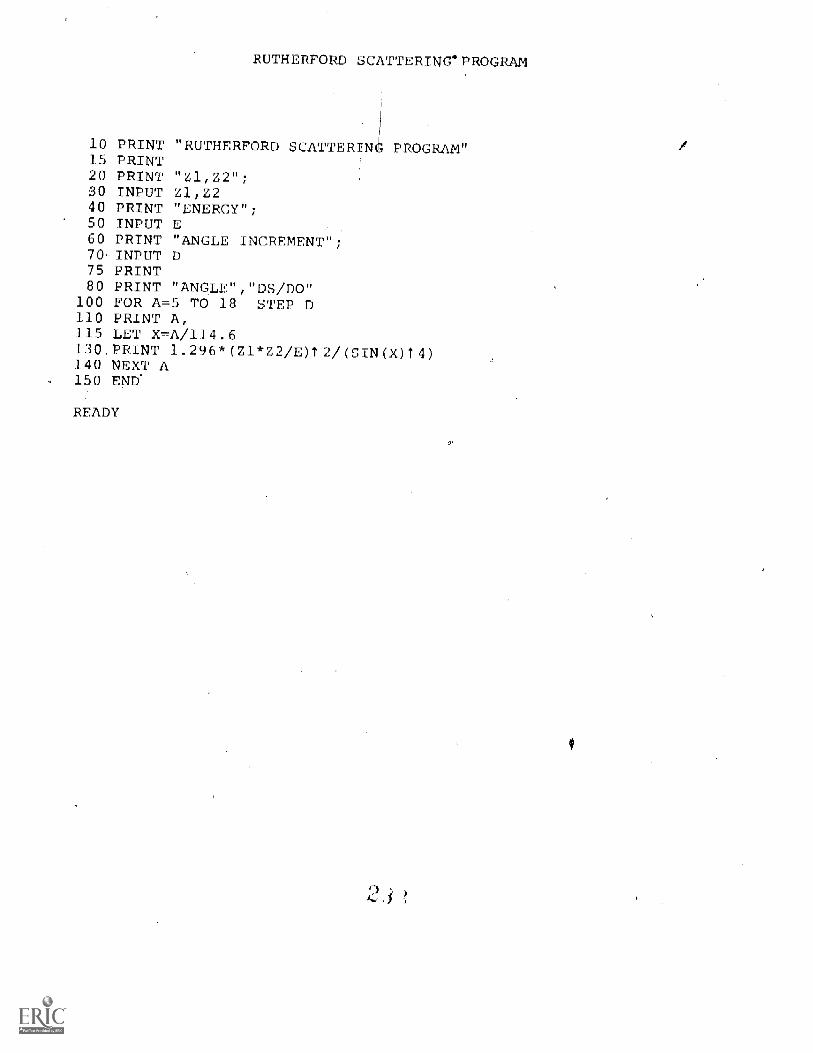
RUTHE ORD SCATTERING PROGRAM
10 PRINT "RUTHERFORD SCATTERIN PROGRAM"15 PRINT20 PRINT "Z1,Z2";30 INPUT 21,2240 PRINT "ENERGY";50 INPUT E60 PRINT "ANGLE INCREMENT";70 INPUT D75 PRINT80 PRINT "ANGLF","DS/DO"
100 FOR A--5 TO 18 STEP D110 PRINT A,115 LET X,---A/114.6130 PRINT 1.296*(Z1*Z2/E)t2/ (SIN(X)T4)140 NEXT A150 END'
READY
Appendix III
Reactor -d Accelerator c
The following list of colleges, universities, and institutes that
have expressed willingness to do collaborative work with their reactor
and accelerators. If ycu are interested in going to these facilities for
an experiment, tour, or demonstration, a letter of inquiry from your pro-
fesoor should be directed to the proper individual listed on the next few
pages.
The authors wish to express their appreciation to ORTEC, Inc. , Oak Ridge,
Tennessee and to the 0 ecial Projects Office, Oak Ridge Associated Universities,
for helping with the compilation of this information.
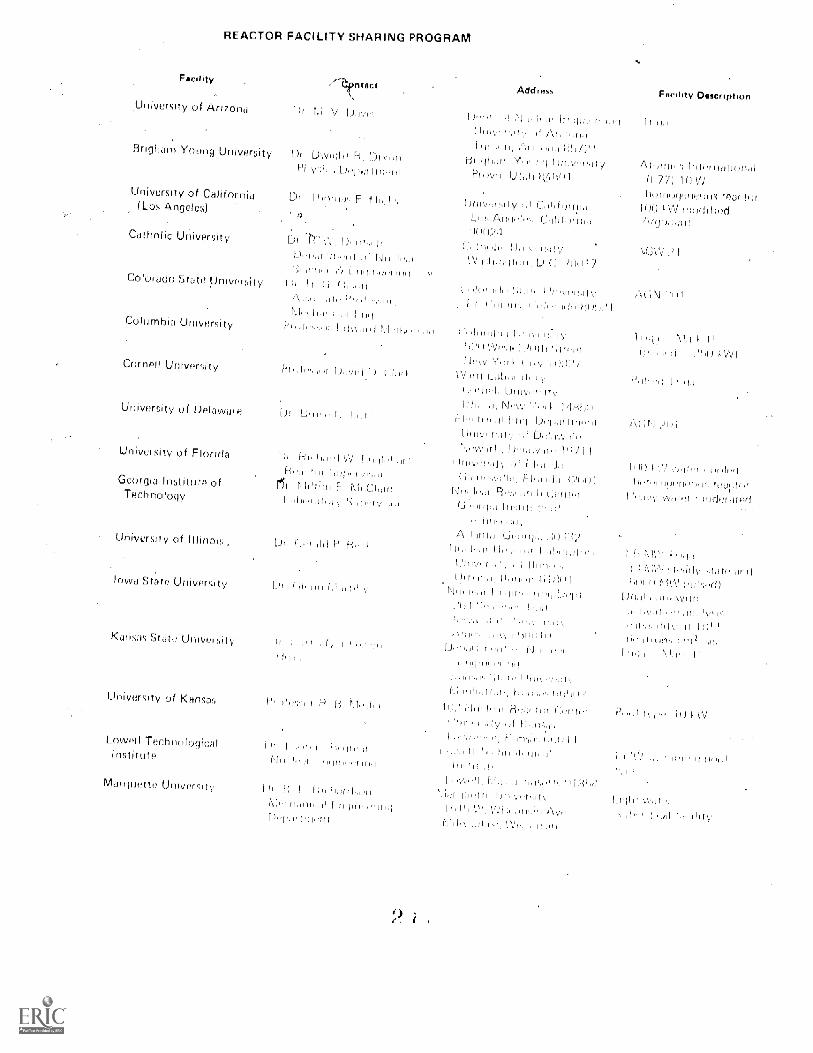
REACTOR FACILITY SHARING PROGRAM
Facility
Univerity of Arizona VI V 1),J),^n)
Brigham Young Univ r ity Dr 1..)11,(1 11
University of California(Los ,Angeles)
Catholic University
Colorado jt a Universi
Colu rnb University
Address Facility Description
[ I II If I rig,I
Yo+i+I+11,,h++Phyrar r,
l11,1)] )+){10 )1
DI III
D, R--
'111 1111111:111)11
Ii i )1'1,11
11.1111 A1 I 1111
F_. trlit UflIV1.-11,,,Li li ,1\111)01,!',,
thHI'f!11,`,.1J L. 111
7
ry
I 1.11111 1 -d11,
II, I rn, I, I;I (111114
,011)
+ +11, OO
n,r++1 Lot++++.41.,1,,
1.111111 I1 11r11%1
`r ` 1I 1.1u,
LI+ + It!, ,+I HI +co.++ I++ hi+1+1++.,1 I Hs, I D, I
1 ]111.% li++11 ++h 11 11++ If 1 HIS.
rr )1+ 1hi h
11 Fl +r + +1.1 i;_ IIII 1++ tor+ 111, tt1111 t111!31 1S Tilton L I 1111 NIl, I, 11 ,If. tlm+1ci)))),)CPI)1I +1++++,11++++
+ I ,"I ,1r1++,tt t+
I, hh +I ++),
ivol.1+11.1 C I +++++)+ () )
1),J I, It Ht I 11,f I ,I III r
+ I III+++++ .1+,++1\ dui]
11+1+1++ 1-11;1111lilt -1111 ;11/[' ['Jill IF I +kph+ I mu; I++++ [1+, ,+++,' + + 1
1 1 1 1 +
+ 1 +. 11.+ +++
'+++ rho III 1
I. Iv. + '1+ ++ +1+ +
Cornell University .t Dovicl
University 0 Delaware
University of Florida
Georgia Institute ofTechnology
University of Illinois,
Iowa St,ate -ity
Kan St (rimer my
University of Ka
Lowell TechnologicalInstitute
rvi ofersay
/1) 1())11/
11orhotrriPf!,116 11 LiI h7100 I1, °11 itiornfied
I +.1,1
++',
r
P
1 I h.' 1J++++,+, r
1 )11 111.11. 111111.
1111111111,,r11'..1`.,
fL,Ir III 11t,tfl 111,I fly' Ho, I,' tor 1.+++11r
If.11,yr,1t In+,.+ .1,11111+1
I ++ I + +',.+1+1r,,++ I 11. +1++++1,1++I flri,1
i.) 111 )1"IHii if
I rill)FII) IF If AI I ri,prir'rrr 1!, +++++111 +\+2++ -.1F1+ i 1 H. 'II 1.1 [HI,'[F'11.11 I
1%:111\V 111111 1' 1f1
II I.1 G.L111 II

Ulm/
REACTOR FACILITY SHARING PROGRAM (Continued)
Facility Contact
Ity of Mary 1,1rid
Massachusetts ristif TeChnOlOyy
111 ,111-01 if'ff 'If 1 f
(.,t1; 'fill I
if fif`lf
1`,1.1f1,fli!r
I 1
MiClitgan 5til University [n Li Vi`
.University of Mu:finial)
University of Missonci(Colombia)
University id Missouri(RolIa)-
University of Nevada
University of New
State University of
Address Gracility Description
p,10-., Maryland
f,11f,111
f111)11 / t11d\IV t 1, d
lf1(11111,(1/11 1
111,1 1.[Io 11,11. .11%
1 1 r1:11, III
111,1H1.,
11111V, +,I Hi fifff,If Ni\N !II
)!, I 1
I Irt 11111%'11111\ .11 Nil
I.l Hul'i',"11111
1 1 JOIVOI" MI1,,1)1111
1-1,111,1, M11.----../11f1111.)'111) I
kr I rtnef!!,i,Iry mai I lir Inor 1,1 ii rgrr[_ .if ;i11.),
for/\,(2,N 2WINI
tirik, CVIW
'21-10-L1N 1 m r, 11 lyiw
OXIC:0 ,1111I1 ,I111,r
I )1 A
I r II hull It
New York, (Buffalo)
Nevv Yuri' Univertity %'1,1 it If
I 1.'1 I f: I
()lire Univeriirly l lr i.i1.11h 111,111
1 '1 ill1111H
nt I,illtrnl,i 111 I II
I
I. '1 a
Old Dorninilirr University le I7 IliI r ;- ,1'1,, r,' 'ir tll',
Orficiou Suite University ri I I cicailayD. a r re fait
Pennsylvania IS r,adi 1-t
University (Jr. l Hf ff iiirHay
University irr Puerto RICO Dr RI '1.1
Purdue University
Reed (;olle( IHC olor
Rensselaer PHlytiq fulluInstitut!.
1_111.
1111,
11,,+ 11,1, l r 11,:11 1 [CI' fi IC r I C]'f
i'1 u4 E".;'111
II, ,v f 1,1.'1.1
()Fro Cirir,
c111 1111m,, .11,..
I'I di
I 111;,,,-
I 1 /IC C'( i[111 CC 1 C
1,1,)1.111,111 r itrir
';):1
-
I
p. 1 j
fiW' flu 1.r l\'.' if )(,..
13,,i\A.)
I a'
yin If' 'Jr,
I [ItI
1-Ike "
f ffi'c sr alie!! Cali
fla
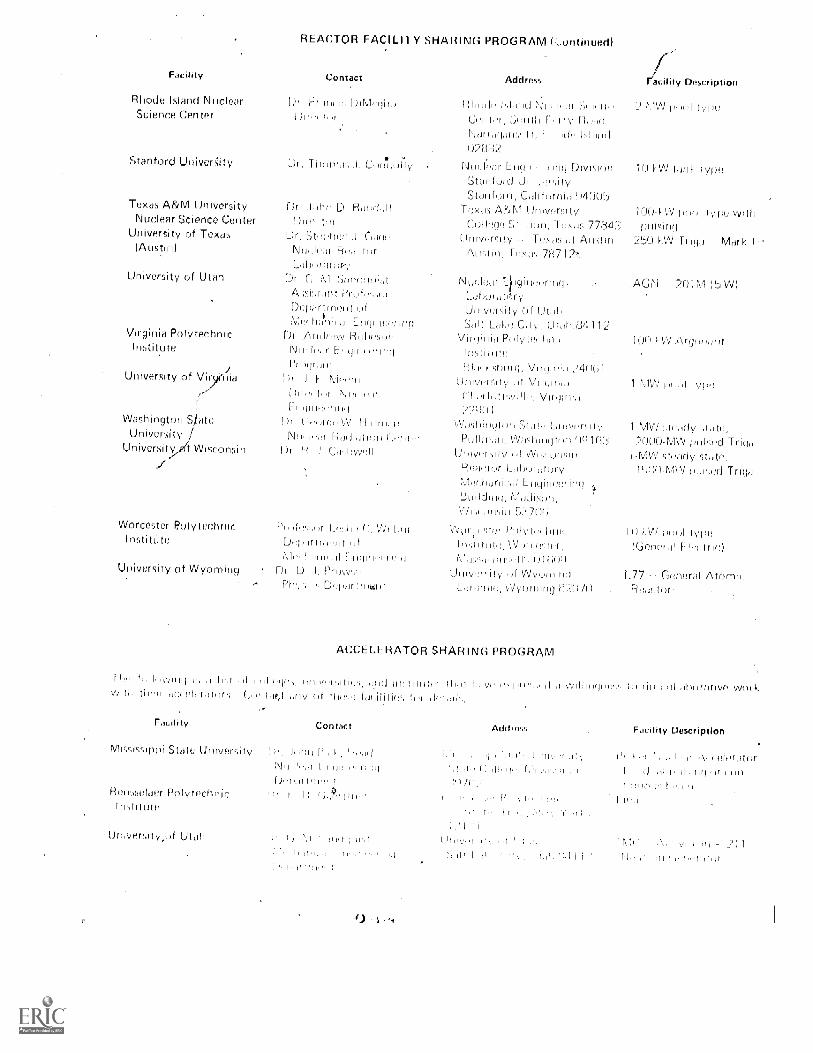
REACTOR FACILITY SHARING PROGRAM ( ntinued)
Facility Contact Address Facility DescriptiOn
Rhode Island Nuclear c, 11PM, rpit,Science Center Lkr,
Stanford Univers'ity L)r, Thomas .1. Conk noHy
Texas A&M University Dr. kin Ii RNuclear Science Center L)in`r t If
University of Texas it zrr a,iwn G,i(;p(Austin) Firsv for
Ldhohaor--,/
, MW i i nil typo';_;,,11111 [-Iry Hood
N,,Jrclikhrlt;,'It, Ff. (11. 1^11,111I1
7l tO.1141111- 111111f11f1f 1111111DIV1511)11 10-kW 1f11-1k TypeStant/Jul LIrir,,,,rsityStanfrwl, Laliforni,
Tuxas Iliovcry k 1 OLT I.VV irlrttl rypLrillr S 778=43 pulsr
Unry,q-siiy it Austin kW TrIqo Mark I-Austin, Icx,r. POI
University of Utah [ii CC. hi -I,irlrld c ' Nu( Ifs]; ;_ igriiei nnrl. .AC,1%1 2k) 1 (V1 ( ID 1.N)Asstst.,nt Pr; fu I,,Ihur,Jtctiry
trric1)1 nt l_InRwrsily ,',1 Ut,11rvirq 1),rir, ,d Eriquic,.(inu .._,.ill Laku Gift, Lit,t f- 1 1'2
HItt..vv Hi )ill''',,,f I VItilitli.] PHiy to, lair, iii ' If VI Aril it IiiitInstitute NitfIn.ir Eniptt,Ri mu lissututcf1111 H1,11 I ^-ibilr j. VIrtia)r.i 1
University of Virt iii t ((,,,,n, I__Iolvprsity ,,I V;101111 1 1 ffl\ff`J lit, d lylli1111., If .1 Ni; I, If C11.111,111W1111. Vir(ililui- f HirtP.,.I rrig
Dr II,,,t(c.11,1 Hum. dump() , Uiliv,q-sicv 1 MD) sh.orly siTtI\11,, If,11 Fif/I11,IIIIIII 1, OD Pullmml, VI,v-,iiirnittrm 'Y171;;,, 74)01) -(VIYV HikTI I H.' i
Di H I C,c I p . " . , , d 1 Urcv,h,dy . cl VVIs, orRin I 1\1V7 sH,Kly st,iteF-i.11(11fir L11,11_11flifiry 151)0-%IVV nul,,ucl (mud
Virginia Polytechnic
Washington StateUniversity)
UniversitysLf VVisconsin
Worcester eolytechruc Pr, ,or Vininstitute
University of Wyoming
LJcl,irlrirrit fit1,, ow HI L rUIIr1,A dint
L) .1,
welt
Lnuirwerinq 4Buildinq, Madison,
is, ,,,tts,tt
%NonI (I- pwil
Irp,;ichiW,Mg((r,tt.r, (61fn1111,11
m,n;,: moounivi4,,ov if L17 Gen, I Atmi
nrme.) t-3,--!1)7() f-it!dc,tor'
ACCELERATOR SHARING PROGRAM
11ff If f11,,V,1111,1 r, f1 f1111 11(11V"f1.1111'ff, I '.1I Ilh" 11111 Illy,' r,rr". (1 111,11flaffItlyf' workNJiiii thcir Tny
Facility contact
U!M/f11,,,,
Rensselaer Polytechni-
Ii verily tit tiro!,
Hir
('J.ffi H.
.'1
Address
ric,,,'r.11.,
fir,i .
1
I r ,1
Facility Description
,11,. I ril Irlf1I1f.
11 .1,,`,cr 1 itit
I if
APPNWTX 1V
Absolute Disintegration Rates for Some of the
Most Commonly Used X-Ray and
Gamma Ray Calibration Sources
These two tables give the latest pheton energy and photons emitted
per' decay for some of the most cemunnly used X-ray and gamna ray sources.
The Reference list at the end of the Appendix fr,lives the sources of data.
The author wishes to ex-press his appreciation to Dr. Richard W.
Fink, School of Chemistry, Georgia Institute of Technology, Atlanta,
Georgia, for allowing us to use his data prior to publication.

Standr_ird-1zation Sopeen
Nuclide Daughter Radiation
Am-241 Np-237
T-1/2 ----.,
1.58.10)d
Co-57
T-1/2 =2.710'10-d
Co-( 0
T-i/2 =10)d
T-1/2 -46.5g1
NnL J4
T-1/2 =
FC-57
N1-00
I" 1 1-21R
e-r-54
N K ray
I, K
LH X raw.;
L K rayh
/ ray
y ray
y rty
y ray
Photon -Enemy(Key)
y ray 13b.3
ray
ray
y raY
K _X ray0r_h
raY
. X
7:2.07
(a)
Photon arlitted Per'
DecaY
0.0635 + 0.0060 (b)
0.0M -(c)
0.202 + 0.004 (d)
0.050 0.001
0.025 + 0.0
0.359 + 0.006
H. 503 + 0.015 (e)
0.0)5 + 0.00? (r)
mo3 (f)
0:1075 + 0.003 (r)
Li. + 0. 000
rmH5 + ocx-Jo),
0.070 + 0.0022 (r)
o. m67 + U. )U10 (h)
o.o1345 + 0. 00008(h)
0.51 + 0.005 (r)
0.0177 + 0.005 (1)
0.027 + 0.002 (I)
0.8155 + 0.015
()_'flt) (%U(Y,' 01)

Table I, continued
Nuclide )aughter Radiation Photon Enerry(Key)
Photon Emitted PerPeray
Na-2J N(2-22 ,f ray 1,74.5') 0.qc-Y) + 0. 0002
T-1/2 =()50.3d
K ( MV;it+v
14.4 0.H40- + (.0032 (k)
T-1/2 = , y t1; :,+8.0)1 (1.(dil + 0.0071.0h6-10'd
y I'1,\J 1().() H.')A + 0.1)01
NucAlde
Table TT
L;tandardAzation Source
Pauftter Radiation
Ta-182
4e,
Photon Enerr,v(Kev)
:I_ 8y ray
y ray
y MY
ray
y ray
ray
y ray
y rUY
I My
( ray
ra,v
1U0.1
11 .
152.4
156.4
179.14
tH
Photon }Mutt-PA-PerDer,aY
18.5 (h)
100.0 (c)
13.')
ji.17
51.5
17'1.F),
23.3
10.
?p,
n(:.11

POOTNOTESTable I
M from the decay of Am-241 are spread from about 3 to 5.6 KeV.
Special caution should be exercised with gemanium detectors since
the K And K_ escape in germanium from the 13.9 KeV L of Am-241 fallsescape
within the M x-ray region of Am-241.
h. Ref. 1
c. All values other' than those footnoted are as given by IAEA, Vienna.
d. Ref. 2
e.. Calculating using X/1 14 Ref. 3
f. Using the data listed in Ref. 4
g. Using ay and y/dis. from Ref. 5 and w_ from Ref. 6.
h. Using K6/Kr, 0.2370 + 0.0048 from Ref. 7.
1. The origYnal values as supplied by IAEA, Vienna, have teen corrected
for the K_/K intensity ratio given in Ref. 7
j.
c.4
Computed using an average value of PKwK = 0.20 + 0.1 P.
P. Computed using PywK 0.6-00 -I- 0.0032 from Ref. 8.
FUOTNOiLSTable TT
a. All values given in this table are normalized to the 100.1 KeV y ray.
b. An average of values given in Ref:;. , and 10.
c. An average of values r..,1vn-fl in Refs 2, 2, and 10.
(Appendix TV)
1. E. I. Karttunen, Ph.D. Thesis, Georgia Institute of Technolorw,
Atlanta, Georgia (1971) arid E. I. Karttunen, H. U. Freund, and
R. W. Fink, Phys. Rev. A (1971) In press..
2. J. S. Hansen, Ph.D. Thesis, Georgia Institute of Technolorrx, Atlanta,
Georgia (1971) (Unpublished)
3. J. L. Campbell, P. O'Brien, and L. A. McNelleS, Nucl. Instr. and Meth.
22, 260 (1970)
4. H. U. Pred, and J. C. McGeorge, Z. Physik 238, 6 (1970)
5. H. H. Hansen, G. Dourentkal, A. LIpernol, W. van Per Eijk, and H.
Vaninbrouk_x, Z. Physik 218, 25 (1969)
9. W. i3ambynek, U. C,,rasemann, R. W. Fink, H. U. Freund, Hans Mark,
R. E. P. V. Rao, and C. D. Swift (to be published in Rev.
Modern Phys)
7. J. S. Hansen, H. U. Ftund, and R. W. Fink, Nucl. Phys. A142, 604 (1970)
8. H. H. Gratheor, J. W. -Hammer, and K. W. Hof Z Physik 225, 293 (1969)
9. W. P. Edwards, F. 5Dehm, J. Rogers, and E. J. Sappi, Nucl. Phys. 53, 97
(19653)
10. D. H. White, P. E. Birkett, and T. Thomson, Nucl. Instr. and Math. 77, 261
(1970)
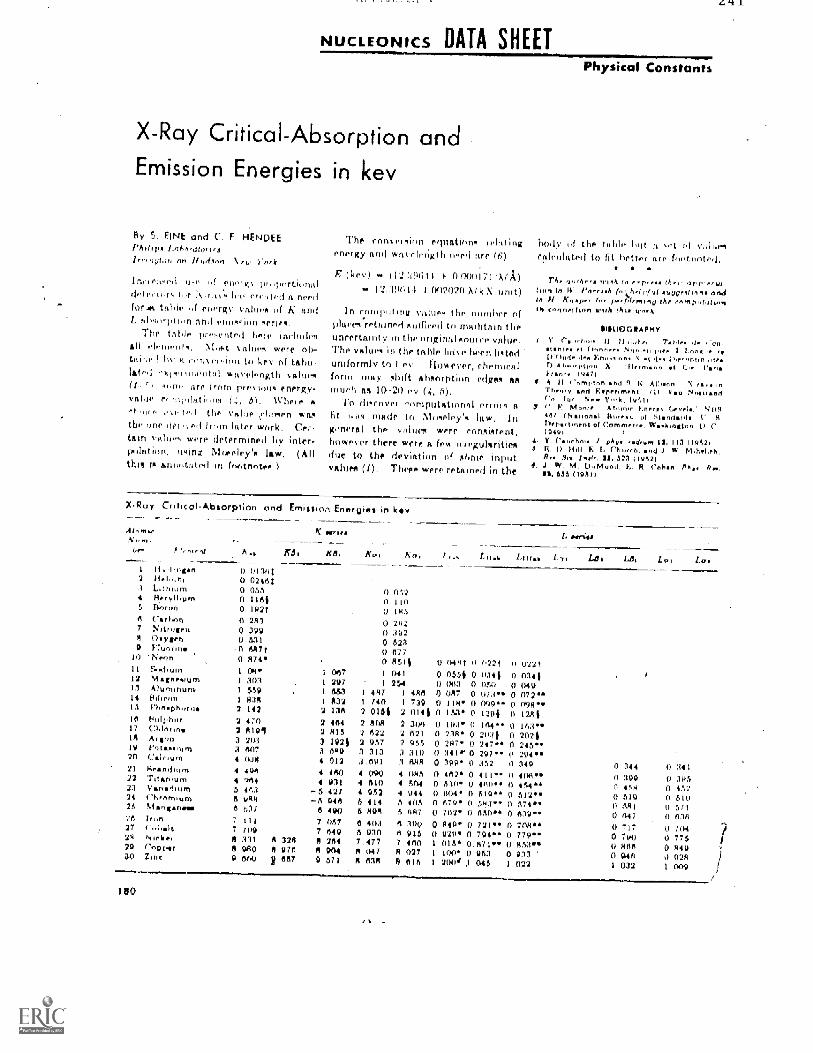
NUCLEON CS DATA SHEET
X-Ray Critical-Absorption a
Emission Energies in key
By 5 FINE and C. F. HENDEEPAilir,/ry,,worl MI ,/ti.,/ft rt.r. erk
In f';-01`,f II. 1,f 1'11,1 )1
Or, 11,1- :*..-FA1# fry: crf'of a needfor- t talos eheri{v valiwg of K andI. a1,11.,1,11.m and emission series.
The tAhle pre=ented 1)(0 (-( Includesall sk'ere
l : . , , ' , lfSCHf+fl ti) hPO'jai CO; `13111.11;11111tal wavelength .slues
.1.-q-11, are Isom previuns energy-vsl ti, N itydati,m, C... 51. Vlivie
es..1,-ted the val,ie 01-;(wen %Jo,the one =t,fi I n..m later work. Cer-tain were determined by Inter-r0Jation. Morieley's law. (Allthin Is ari otated Ira foutnntsss
X-Poy Critical-Absorption and
NE1P#(e ,e /(.6
11),1 ..ann 0 ui.2 11.1,ntri 0 (124131
Litho,(1-1 0 0554 tior011(orn 0 11617. Finrnn 0 192?
C10-10-,n 0 213:17 Narngen 0 3409
Otvilen 0 5.31Fltinrine 0 047
n 0 87411 .S=.1-i u 1 CPI.12 Nittnoonurn 1 30313 Munnnum. 1 53914 Bbron
1 9313IS i'l(n0phorn4 2 14218 14(410-1017 2 47017 CI.Inrint 2 14191
Arum 3 2031/ntamiu 3 607
30 Ctielures 4 (ma31 r,-,amtnim 4 40122 Titkriolf#1 4 7454
23 6`a,n0,11(*rTi 5 41'324 CliffOMiurf) 6 OH25 N.1404404,04 6 1',37
28 11,in 11127 Un'halt 7 709214 8 331 4 32A29 (.7-npv0tr 8 LIAO 13 978
9 660 5 657
The ronver,lon equation, relatingenergy and wavrIength ii,ed are (H)
E (ker) 11'2 :111,1t1 1100/171 A(A)12 11s; 1 I (1{12020 )tIk X unit)
In cnunputtruk vithIP*, nilinher ofplace, retained mullieed trl maititain theuncertatrit y in the original FourreThe values In the table have been leltaduniformly to I cv floaever, rherniralform may shift (31)40rpt100 edge., asMilrh As 10=-20 1'0 (4, 5),
To ill,enver eomputatinnal error, afit 1.(19 made to Mmieley's law. Jrgoneral the value?, were conAistent,however there were s fen IN PgulgritieAdue to the deviation of shale inputvalues (I). These were retained in the
Erni,Mon Energies in 1K sY
K ..r-144
KS. Kai Kr.,
ISO
1 067I 297
5.53I 8322 130
1/!.-;(I noO 1145
O 2/-12O 392O 823O 077O 8811
041I 25.4
4H-7 1 486I 740 I 7392 0161 2 014
Physical Constants
ilEnl I V Elf the table lait ,ct of valuescalculated to fit better are 1,031,00tini
* # *
TO. n0 * Frpreao rhr, drr-nran*,It'' l in 14 l'orr,01 t/,).din Ft A ri#1,er (1' tnenpurdip-*f# toonerhoO VOA (ht. idr/*
IIVIEDGRAPHY1 r' ,rho,* II /1.1;...n, Ta/./....
o lanIna .t lInnnre. I.r11104. 1#m Eno..on* X et de* 1.,enontndteatl )1......ption 1 (11rfrodon at C.ran.* 0147)
1 1 ..nrnidnn and /* 41`.*on 1 ta.*Theory and Earrrirylent (1) V.) Nt.at.andro In /qt.** rn.k, WI)
$ Mn" e Atom, knere. Loyeic. /tins447 (Nt41,0101 14of#.1 nl StAhmlufffiejoaftrorOt #(. Comm..,.. Waaa,fition S1 C(#491
* Catirhoto 1, ()An *ad...., 19. 113 (1052/9. 13 11 11(11: E: ("huren and
Hr. 421 11957)VV. 44 Liti14n04. Cohan Phi,. R0*.
e t. 445 (19511
L 3,4r###
L11#1, 1411## 1,11 us. 1,13k Le, to*
O M81 0 0221 0 02210 0513 0 0141 1) 0341O 043 0(150 00490 1187 0 073" 0 072"0 118. 0(x19" 0094"O 1714 (1 1291 0 1281
2 464 2 308 2306 0 103. 0 164" 0 183"2 818 2 622 2 621 0 238* 0 2031 0 20213 1021 2 957 2 31,3 0 187 0 247" 0 245"3 819 3 313 3 310 1) 34 0 797 0 7944 012 3,691 3 6814 0 399* 0 352 0 3494 460
4 0316 4275 9448 400
7 0677 649R 26413 9049 671
4 0904 6104 9528 4146 496
6 4011 0307 477A 047
8 83A
4 0854 3044 1/445 40.5
0 _16
7 4604 0278 815
O 4024 0 411" Ii 406"O 810* 0 48044 0 484"O 4411. 0 ('141" 0 517"O 070* 0 NO.' 0 574..O 762. 0 650" 0 139"0 449 0 73i e 0 70s.O 9104 0 794.4 0 770"1 015. 0 671" 0 883"1 1 0 0331 200 1.046 1.022
O 344 0 341
O 399O 458O 619O 8R1
647
O 717O 790O 8611
O 948I 032
O 3954!,2
(1 510O 871O 636
O 704O 775O 849O 92M1 009
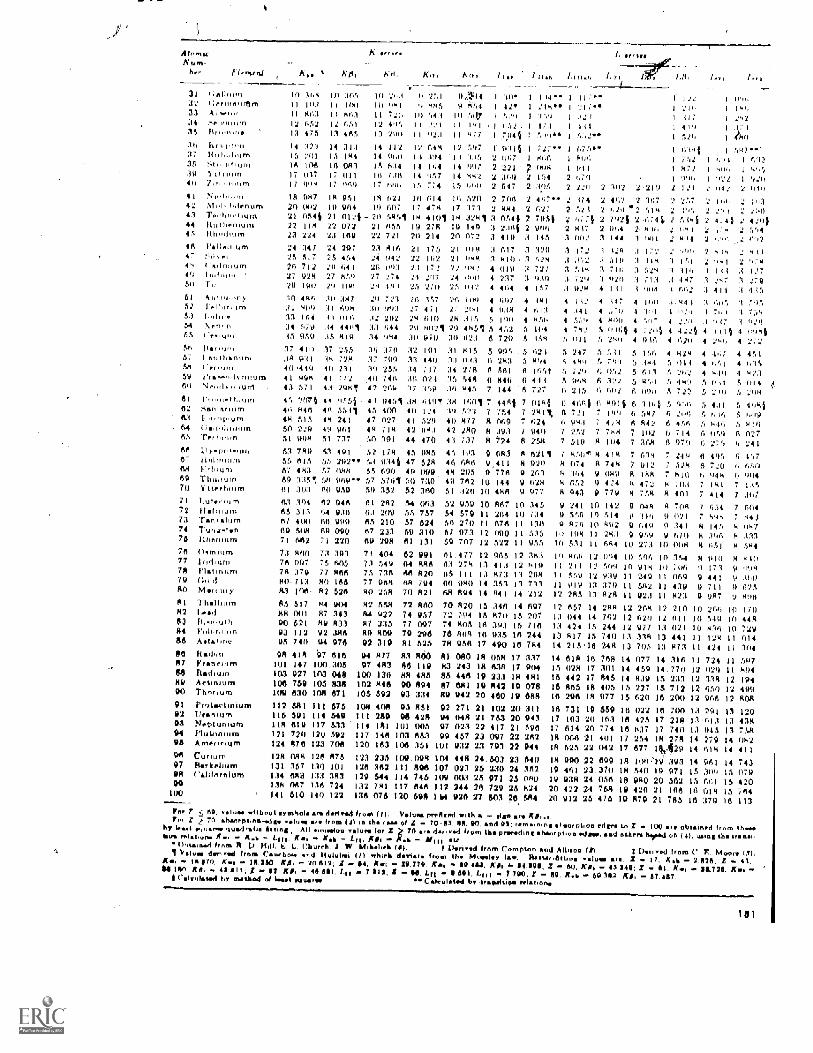
Atomte
31
32
3314
35
37
1539
mtni
4142 51,1,1,1enurn43 Tei Miletitint
44 Rutherilum116031136.
4744 f'r,Inloro40 16161,6
MP70
71
727374714
76777179
Al
142
4]
84
86
813
87
ga8990
l'rf.filett66fflS..7,1101141I-. -1 1plurn
AhommTer 1690
411.ntu.9t6
ErbioniThuliumYttPrhill.mhurrrfifirm11simumT411141851TtIngltell
R1it f1,11111
(:).MIUM1(1di1IM114(i1)11181GoldMercury
Thallium1.#44)11.4, 11th
11,6(166
V ran 4-111ffiRadiumActiniumThAriurn
91 Protaintinium92 Uranium93 Neptunium94 Tititomlufm
Arnortrium
909798poleo
CuriumRot kehurnCnItteitniturri
II) 364 Ii)11 1(1) 11
1 1 116.1 I I12 1152 17
13 475 13
14 32315 20116 1041
17 (1:37
17 664
14
15
16
17
I
15411 Kfv1 A," 1 11.4 1,-(1t-365 10 -.1,1 9 2711 oiti4 I Ao. I 1 A4.* I 11:..too to 941 9 **5 9 4'54 I 424 I 71844 1 117463 11 77% HI 514,1 lir :'titt 1 I I.')
I 321651 12 4qA 11 .!21 11 141 1 1 17-1 I 414465 13 290 II 442,1 11 877 1 7944 ! %99** I 552.4
311
144083nil
909
14 112
14 91.1)
IA 83416 71617 (.61,
12 644 12 797tA A94 11 115
14 14 14 09;14 957 44 44215 774 15 6110
2
2
2
931406722136q547
1 72744 675**1 460 )
2 098 I Oil
2 154 2 6;02 405 2 220
I4 947 IN 951 14 621 III 614 16 570 2 706 220 4412 19 964 19 607 17 47S 17 373 2 444 1
21 0544 21 0124 -20 5858 18 4105 14 3241 3 0.544 272 114 22 072 71 655 19 278 IV 149 j 2:164 213 774 2j 169 22 771 20 214 2)1 072 3 419 3
24 347 24 297 23 Alfi25 517 25 454 24 94226 712 211 641 26 90127 9214 27 859 27 27419 190 29 1041 '24 141
21 17522 10224 17274 70725 770
2 1117
f 7.71
2 219 2
/141, 1=1.;
172 I 06,710 I 186117 I =82419 I 179526 1 4780
6944 I n44744
7717 1 1.64I
472 I I SIi5
096 1 '77 1 970124 4 1142 2 1.11
46744 2 174 2 461 2 367 2 77:7627 2 2 629 '2 514 = 1651681 2.1471 2 7921 2 -674t 7 511)
966 2 817 2 964 2' 41 2 h"145 3 102 3 144 3 1411 7 414
21 014 3 617 3 32921 0,44 .1 410
21 "42 4 019 3 72724 000 4 717 3 93925 642 4 464 4 157
1 177 3 17143 3 3W .1 519
3 5114 3 ;IA:4 7211 4 9261 978 4 111
30 4146 .111 347 29 771 26 357 26 100 4 1,147
31 809 11 694 30 !493 27 471 77 2181 4 91433 164 13 016 31 292 2 610 24 315 5 19034 570 34 4461 34 644 29 4025 29 4451 5 45245 954 35 419 34 944 30 970 30 62.1 5 720
17 411)38 01140 41041 ogm43 571
37 2551. 72440 21141 77243 7941
45 2074 44 954446 1446 46 5!,1546 515 44 24150 229 49 V61
9114 31 7.17
61 759 rt 40155 015 55 20267 443 57 COO
69 3155 5.11 9694141 3(13 AO 950
62 94631: 'A 936
67 400 AA 09059 5491 60 09(171 661 71 220
73 440 73 39176 097 75 (1015
714 370 77 AAA80 -713 AO 165AA 100. 82 626
85 817 44 90486 001 87 34390 421 89 83393 112 92 38695 740 51:4 976
PR 4114 97 515101 147 100.305103 927 100 048106 769 105 838109 630 108 4571
112 SRI III 675116 591 114 549Ill Aig 117 833121 724) 120 592124 147A 123 70A
12R 0,414
131 357134 nel134 047141 alo
126 475130 101111 3143
136 724140 122
16 37R 3237 799 3339 235 34
40 746 3642 269 37
4 .041
4 6144 4565 1045 354
191 31 R15 5 995440 33 013 A 283 5717 34 228 6 Mn 6021 :41, 548 0 846 6359 AA 845 7 144 .6
41 9451 38 1104. 34 1601 7 4441 745 400 40 124 10 571 7 754 7
47 027 41 520 40 877 R 069 7
44 714 42 ORA 42 280 R 19150 391 44 470 43 737 R 724 g
52 1714 45 PM 45 1935,1 9344 47 578 40 64655 690 49 009 44 20557 5761 II) 7140 49 76259 352 51 360 51 320
RI 242 54 06363 209 55 75765 210 57 57467 233 49
69 296 61
71 404 6273 549 6475 738 A877 9614 rtliIRO /54 70
42 554/44 927RI 33589 1409
142 3114
04 R7797 443100 136102 1440
105 592
108 44145
111 2114 141117 1461241 163
173 735126 362129 644132 741136 075
310111
9911486
820794811
52 9595-4 57956 27057 97350 767
64.477'74
65 III06 940AM 1494
9 0143 4
9,411770
6214941654
443727
0144741%624
910254
6311920261
4 112
4 A4I4 5%04 7475. 011
5 2475 44,E
5 -95 946 215
3 1723 1143 574'4 713
904
4 117 4
4 570 4
4 8181 4
5 0 164 4
1411 4
1 1511 1163 487i 66:
2 166 2 1611'1 2 10041 1 4794
a_ is
2 9.1A 1 ti
3 7873 414
2 4$.17 47P4
3 1.--3 2793 435
Pa) 4.441 A 611, 1 7950,1 4 679 A 7..1 1 74
:-0,7 4 1 ')(7 3 9267201 4 421 4 1114 4 0:041916 4 610 4 286 4 277
5 511 5 1565 746 5 3.46 052 5 6116 122 56 667 6 090
6 46010 721 7
A 1043 7
7 252 7
7 519
4 424 4 41.7
5 011 4 6515 767 4 4411
5 449 5 6i45 712 5 710
4911 A 3111 % 9%6146 6 547 47 706
474 6 R42 6 456744 7 102 6 714194 7 364 6 979
7 85641 4 414 7 634A 974 8 748 7 912
164 9 089 0 18810 144 g 6214 R 657 9 474 A 472-10 446 0 977 4 943 9 779 4 75*
10 807II 764II 07612 09012 527
10 345 9 241 10 142 9 04410 734 V 556 16 514 0 316Il 13)1 w 67n 10 R02 14 64011 535 10 104 II 24A 9 95911 955 10 531 11 684 10 271
12 905 12 38413 413 12 41913 873 13 26414 353'13 73314 441 14 212
72 RAO 70 470 IS 346 14 69714 957 72 794 15 870 15 20777 097 74 405 16 193 IS 71670 298 76 868 16 935 In 244RI 525 78 9.544 17 490 16 744
43 1400 81 080 IR 0514 17 33786 119 83 243 18 638 17 444814 485 85 446 19 233 AR 48190 894 87 6141 19 842 19 07893 314 R9 942 20 460 19 ORR
95 1451 92 271 21 102 20 31196 428 04 6414 21 153 20 943101 005 97 023 22 417 21 596103 651 99 467 23 097 22 2621044 351 101 032 23 193 22 044
109.098 104 448 24.603 23 640111 896 107 023 25 230 24 352114 746 109 60,1 25.971 25 080117 e46 112 244 26 729 75 814120 594 114 926 27 603 26 844
10 469 12 004 10 !.96II 711 17 509 IO 918II 559 12 939 II 249II 910 13 379 11 54212 245 1.1 1124 II 1423
12 657 14
13 044 1411 424 151.1 R17 15
14 215'15
14 614 IA15 074 1715 442 1716 RA5 18la 296 IR
2149 12 264762 12 070244 12 Q77740 11 3314248 13 765
7 7497 24
7 1410
8 1034 401
S 7049 0211) 341
67010 008
10 35410 7i8A
II 0614
II 43911 823
6
4 4514 6154 4115 014 (1.
T. 704411 5 4044
636 5 66V446 S 4.16
A 027175 6 =41
6 495 6 4%76 720 h 66 944 6 9047 141 7 1357 414 7 36;
7 614 7 6047 894 7 4414 145 4 141,7
H 396 4 333M 651 8 584
$ 910 49 173 9 6949 441 11 3699 711 9 6259 107 8 sw6
12 210 10 266 10 17012 All 10 549 16 44413 021 III 436 10 72913 441 11 124 II 61413 973 II 424 II 304
744 14 077 14 316 11101 14 459 14.770 12845 14 1439 15 733 I)405 is 277 IS 712 12977 15 620 16 200 12
7240291384574
966
II 597II 49412 194
17 49912 404
16 731 19 559 16 022 18 700 13 201 13 12017 103 20 163 le 425 17 218 13'613 13 41417 614 20 774 Id 817 17 740 13 045 13 75418 060 21 4)11 17 254 18 274 14 779 14 082114 7.27. 23 042 17 877 140129 14 614 14 411
18 990 22 699 IA 166'19 393 14 961 14 74319 461 27.370 IR 540 19 971 15 306 15 0714
IV 938 24 056 18 9140 20 567 15 561 15 42020 422 74 764 IV 426 21 160 16 018 15 75420 912 28 476 19 479 21 785 Id 379 10 113
PA. 60 .0,mo alIhnut ryg-0,81, 4,4 ,1.n..8 from t) Voluaa pr*Flwl -with e = .Ire are 414/1...v., Z 7n oboorptme-rwlis womft are from (4) to the 'moo of Z 70-61. 413. 913. 963 96; rwitinining siiin,trition od{e. 431 Z - 100 are obtatoyd from the*,by larm,i 4romorm quarlrmtio Igtme, All .rmloefoo volute In, a 70 are d. -.d Irmb the Frormalme Sh*orpt+04 44E;(0, end other* hoped or. (O. '44MTIR t64 ,,44#=1494 mlatmmt = K.4 - L,,,, Km, = /fact - Nil Rrb = Aitt1 str.4pq..,46.4 from R Hal 5: L ('bur.-h. 1. W 9419414r9 fill 1151ri r 9d from Compton 4E14 Mbloo (1) 1 (3ertwod from C. r Mn... 1.4)v.).. tintisne1 imiTt Co4th3.4 4.4 /Winn.. in whirl. dowisto from thr 54.1.414y Ia., Firttar-tltuor 4,+1, Z - 17. KO, 2 825, Z - 43.= 48670. Ka* ta 150. 1(4, = 26 5123 14, Kai = 14.77n g*, 29.4143 AO. 6 14.246, Z 344). K.. = 43 349: Z -81, 11726,1710 414, - 43 6111 Z - Si KO, - 48 511. 1.11 7 413; OS. Lri - 1 591. L111 7.744}: Z - 69. 69 3132 KZ, = 67.497,I Cale..14444 Sr mothe41 .4 145904 4.99,4,40 *4 Calculated by Arsimitios nnintinnn
181

4 't
Reda
APTIMIX VI
v- Sensitivities of Elemen Neutron Acti
This tabulation should be quite useful to schools that have either
an Isotopic Neutron Source (i.e. Pu-Be) or a small Of-252 Neutron Source.
The numbers are eqUally valid for thermalized accelerator neutron sources.
Information in regard to unknowns which are given in the activation
yols experinnts in this manual can also he extracted from this table.
Experimentally determined sensitivities are relative to Aluminum.
Thus, if 1-milligxam of Aluminum can be measured, then the irradiation
and counting system is capable of measuring the listed quantities of
elements in milligram.
In each case, the reaction product and gaarrn energy have been F-e-
lected which give the best interference-free sensitivity.
Irradiation to saturation is assumed for nuclides having half-lives
in seconds or minutes. An overnight (16-hour) irradiation is assumed
for the longer lived nuclides.
Measurements .of the activities were made with NaT(T1) scintillation
detector's. Sensitivity was assigned on the basls of the amount of element
required to provide a discharge court rate of 100 net Count per minute in
the photobeak indicated for the product nuclide.
The listed relative sensitivities would he'approximately the some with
measurement using Cle(L1) detectors. LO'nger counting nerios are made nee-
because of lower effielencY; and, hence, very short-llved activities
can be expected to show a decreased sensitivity. The higher r&olution of
the Ge(1,1), however, )n an advantage when interferences are present.
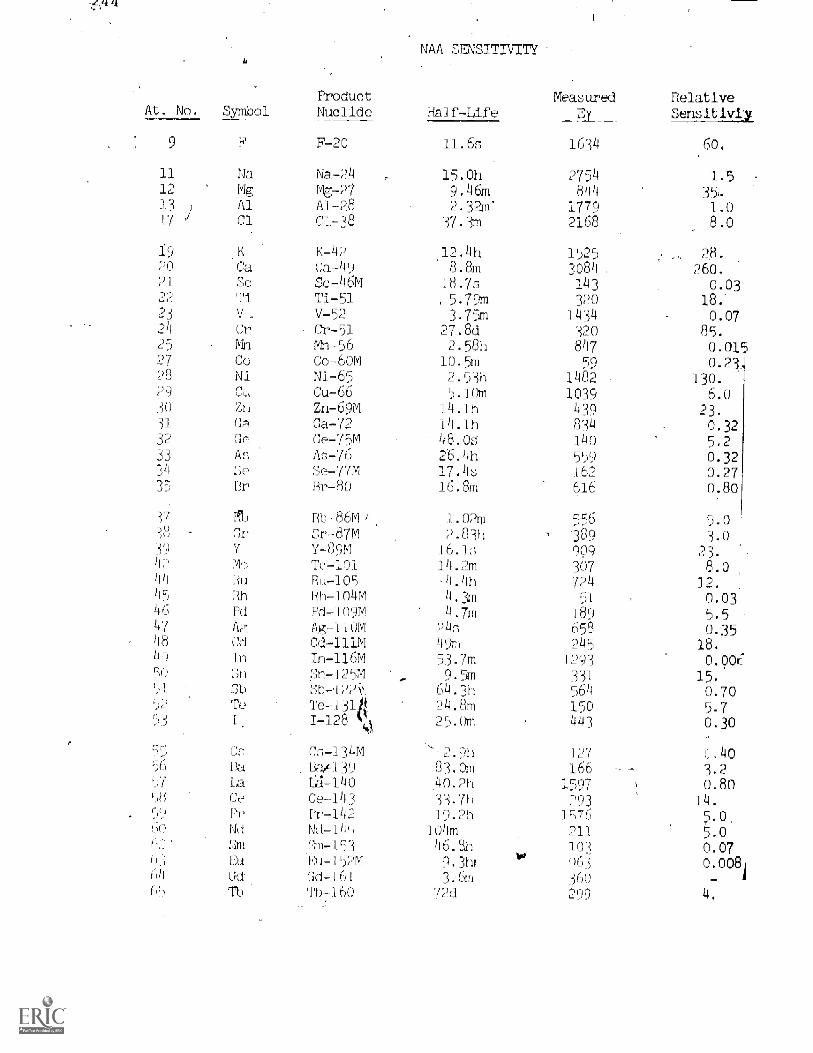
At. No. bol
NAA SaISITMTY
Product Measured RelativeNuclide Half-Life SensitivIy
F F-20 11.6s 1634 (30.
11 Na Na-24 15. Oh 2754 1.512
.
Mg Mg-27 9.46m 844,
35,13 ; Al A1-28 2.32m' 1779 1.017 / Cl (71-38 37. 2168 8.0
ic.) K K-42 12.40 1525: 28.
20 Ca Ca-4() 8.8m 3084 250.21 ,;(2 Sc-46m 18.7o 143 0.0322 Ti Ti-51
, 5-79m 320 18.73 V V-52 3.75m ] 434 0.0724 Cr Cr-51 27.8d 320 85.5 Mn mn-55 2.588 847 0.01
27 co Co-SON 10.m 59 0.2328 Ni Ni-65 (2.53h 1482 130.$1) ju Cu-bb 9.10m 1039 6.030 Zn Zn-EOM 14.1h 430 23.31 (1a 0a-72 14.1h 834 0.3232 0t- (le-75M 48.0:1 140 5.233 A= A:1-76 26.4h 559 0.3230 Lle :',p-77M 17.41 152 0.2735 Br Pr-80 i6.8m 616 0.80
-',7 ;11; Rh-86M, 1.(1h 556 5.038 Cr r-lr-87M 2.830 ' 389 3.039 Y Y-8OM 16.1; 909 23.4 ' Me To-101 14.7m 307 8.0114 Rh Rh-105 4.4h 724 12.4c; HI-1 kh-104m 4.m 51 0.034b CU Pd-109M 4.7m 18Q 5.547 AF Ap--11UM NIn h58 0.3548 I'd Cd-111M Liqm 7145 18.4 + In In-116M 93.7m 120)) 0.005ro I :in Sri-125M 9.5m 381 15.'d ".-lh a)-1221 5143h 564 0.70
To To-131 24.8m 150 5.7;,H 1 I-128 25.Dm 443 0.30
y, C: P.---134M 2.90 127 ( .402 6 B:i. BaA13q 83.0m 1(36 3.2
La 1.-1-140 40.2h 1507 0.80H8 LP CP-143 33.7h 703 14.
10. Zli l_q7h 5.0H) NI Nut- [14) 104m 211 5.0h ' Lim ',111-153 46.8h 103 0.07n ; Eu Fu-152M q.ku 0(33 0.00864 (Id lici-lhl i.(mi $60 A
00 'Ph 'M)7160 72d 790 4.
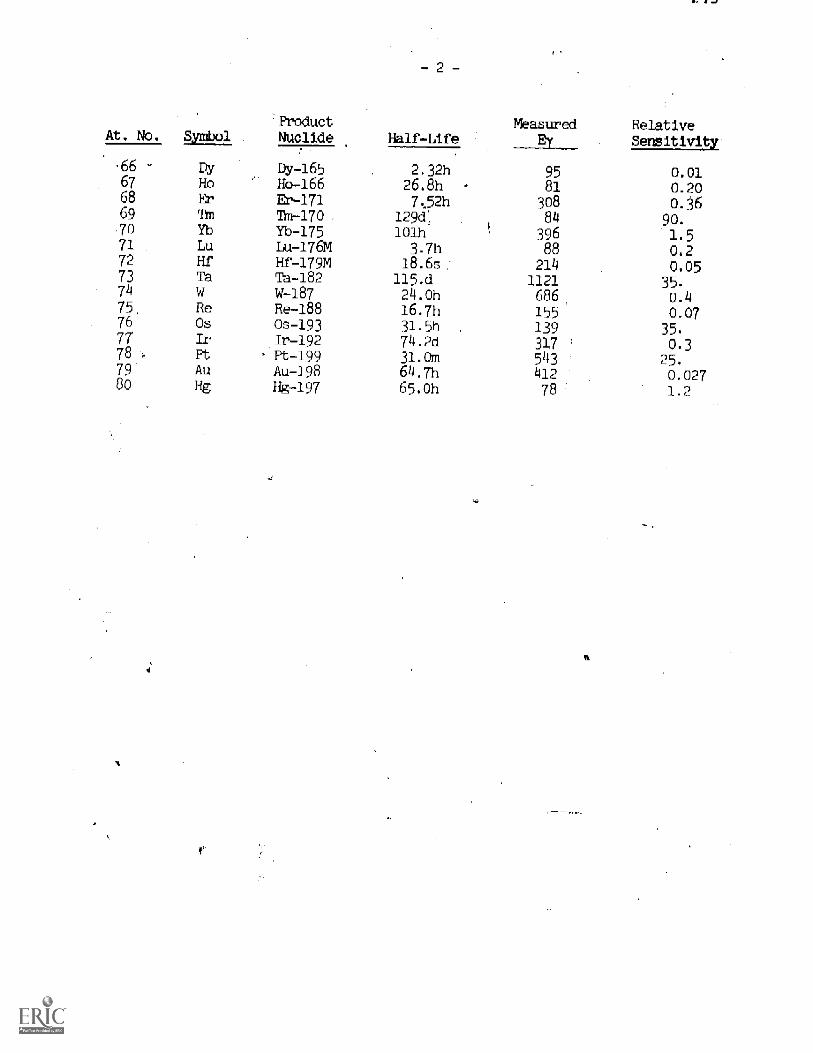
At No.ProductNuclide Half-Life
1
Measured RelativeSensitivity
.66 -
6768
69,70
7172
7374
75,76
7778
7980
DyHo
TmYbLuHfTa
ReOsirPt
Au
Hg
Dy-165Ho-166Er-171TffiH170
Yb-175Lu-176MHf-179MTa-182W-187Re-188Os-193Ir-192Pt-I99Au-198Hg-197
2.32h26.8h7.52h
129d10Th
3.7h18.6s
115.d24.0h16.7h31.5h74.2d
31.0m64.7h65.0h
9581
30884
39688
2141121686155139
31754341278
0.010.200.36
90,
1.50.20.05
35.0.40.07
35,
0.325.
0.0271.2
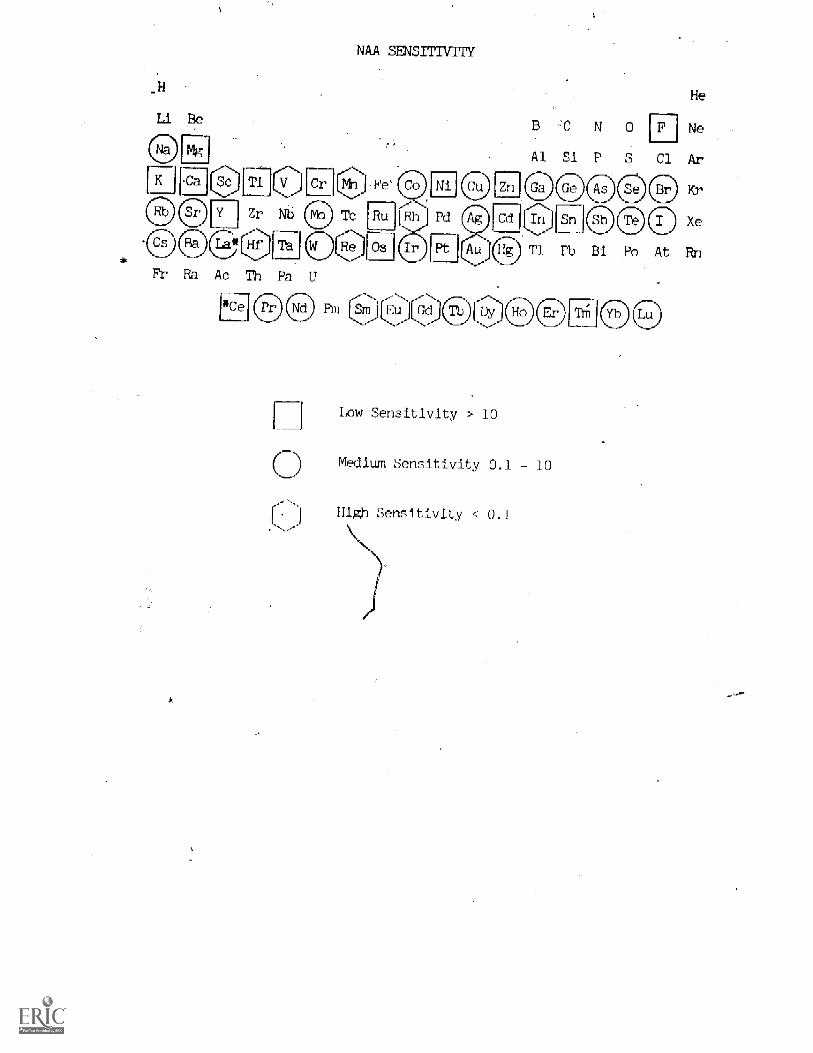
NAA SENSITTVITY
Lct-C
He
Ne
LI Low Sensitivity > 10
(i)Medium Se _ itivity 0.1 - 10
High Sensitivity 0.1
APPENDIX VII
orGaria_sObserved in Neutron Activation Ana_
Thp following table includes only those nuclides most frequently
observed as products of neutron bombardments. It is ordered acc©r3ing
to increasing energy of a prominent gamma ray, designated as EI, emitted
in the decay of the nuclide.
If the nuclide is present, it is highly likely that El will show an
appreciable intensity in the spectrum and it thus serves as a key to the
identity of the nuclide. The half -life sand associated gammas sbould than
be consulted for confirmation.
The last column shows the sensitivity relative to that for aluminum,
assuming that 'an adequate iradiation has been performed. This too, Can
be of help in eliminating unlikely prospects and confirming an identifi-
cation.
fl
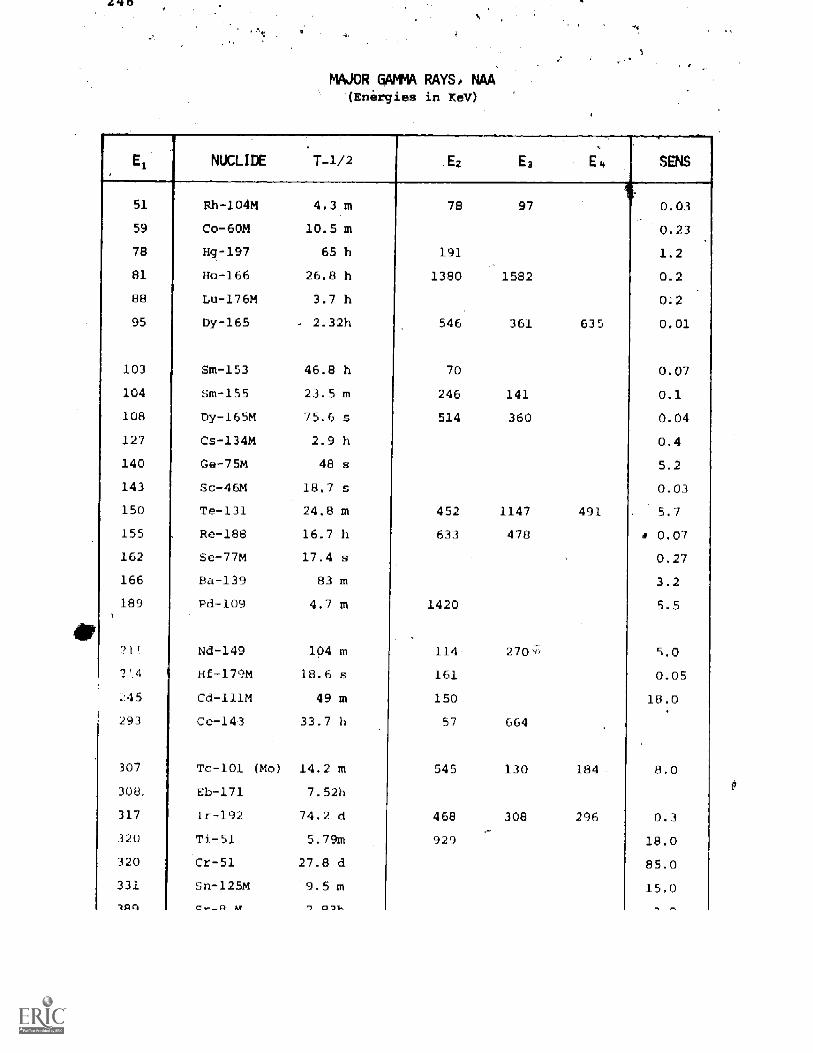
hq
MAJOR QAMMA RAYS, NM(Energies in KeV)
NUCLIDE T-1 /2 E3 E SENS
51 Rh-104M 4.3 m 78 97 0.03
59 Co-60M 10.5 m 0.23
78 Hg-197 65 h 191 1.2
81 Ho-166 26.8 h 1380 1582 0.2
88 Lu-176M 3.7 h 0;2
95 Dy-165 _ 2.32h 546 361 635 0.01
103 Sm-153 46.8 h 70 0.07
104 Sm-155 23.5 m 246 141 0.1
108 Dy-165M 75.6 s 514 360 0.04
127 Cs-134M 2.9 h 0.4
140 Ce -75M 48 s 5.2
143 Sc-46M 18.7 s 0.03
150 Te-131 24.8 m 452 1147 491 5.7
155 Re-188 16.7 h 633 478 0 0.07
162 Se-77M 17.4 s 0.27
166 Ba-139 83 m 3.2
189 pd -109 4.7 m 1420 5.5
211 Nd-149 104 m 114 27(21 5.0
2e1 I Hf-179M 18,6 s 161 0.05
.45 Cd-111M 49 m 150 18.0
293 Ce-143 33.7 h 57 664
307 Tc-101 (Mc) 14.2 m 545 130 184 8.0
308. Eb-171 7.52h
317 Ir-192 74.2 d 468 308 296 0.3
320 Ti-51 5.79m 929 18.0
320 Cr-51 27.8 d 85.0
331 Sri -125M 9.5 m 15.0
lAci C,,-1/ PA 9 011,
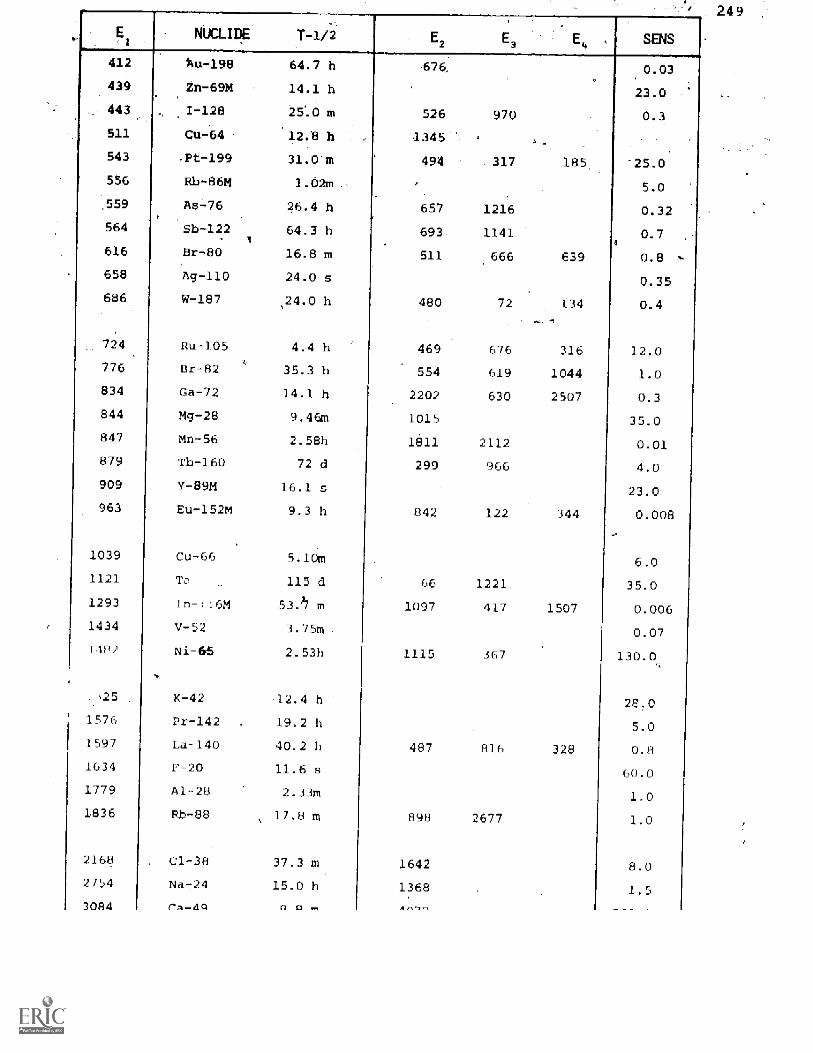
249
NUCLIDE 1-1/2 E2 SENS
412
439
-198
-62m
64.7 h
14.1 h
-676, 0.03
23.0443 1-128 25'.0 m 526 970 0.3
511 Cu -64 12.8 h 1345
543 ,ft-199 31.0'm 494 .317 185 -25.0
556 12b-86M 1.02m 5.0
559 As-76 26.4 h 657 1216 0.32
564 Sb-122.
64.3 h 693. 1141 0.7
616 8r-80 16.8 m 511 666 639 0.8
658 Ag-110 24.0 s 0.35686 W-187 24.0 h 480 72 134 0.4
724 Ru-105 4.4 h 469 676 316 12.0
776 8r-82 35.3 h 554 619 1044 1.0
834 Ca -72 14.1 h 2202 630 2507 0.3
844 Mg-28 9.46m 1015 35.0
847 Mn-56 2.58h 1811 2112 0.01
879 Tb -160 72 d 299 966 4.0
909 Y-89M 16.1 s 23.0
963 Eu-152M 9.3 h 842 122 344 0.008
1039 Cu-66 5.10m 6.0
1121 Ta 115 d 66 1221 35.0
1293 --i!6M 53.'27 m 1097 417 1507 0.0061434 V-52 3.75m 0.07
140 Ni-65 2.53h 1115 367 130.0
25 K-42 12.4 h 22.0
1576 Pr-I42 19.2 h 5.0
1597 La-140 40.2 h 487 816 328 0.8
1634 F-20 11.6 s 60.0
1779 A1-22 2.33m 1.0
1836 Rb-88_17.8 m 898 2677 1.0
2168 C1 -38 37.3 m 1642 8.02754 [4a -24 15.0 h 1368 1.53084 raLla a a w. Ar-,-,

15th
A1'PI,N1)1 X VII I
iorra I it! rem
1. G. D. Chase and ,1. b. L. Rainowitz; Prince: )pl - of Radiois otope Mettho-
dology,,Thied ed., Burgess Publishing Co., Minneapolis, 1967.
R: T. Overman and H. M. Clark14w Yark, 1960.
icisOtope Techn , McGraw-Hill,
Norman-Raclin, "Basic Radioisotope Experiments for the ChemistryCurriculum", U.S.A.E,C., TB) No. 6374,'amailable from the Office ofTechnical Services, Washington, D. C.
G. D. Chase, S. Rituper, and J. W. Sulcoski, Experiments in NuclearScience, Burgess Publishing Co. 426 South Sixth Street, Minneapolis,Minnesota 55415.
5. H. J. _ wier W. J. Gemmill, "Fitoloy EXperiments in Nucleoniavailable frOm the NUcleus Instrument Co., Post Office R, OakRidge, Tennessee 37830.
6. W. J. Price; Nuclear RadiaNew York, 19
7. J. M. Taylor, "SemicondWashington, 1963.
Second ed.,
t- rio p,,teInovs" Butterworth,
8. F. S. Goulding, "A Survey of the Application and Limitations of Various,Types of Detectors in Radiation Energy Measurements", lEE NuclearScience, NS-11(3) 177, June 1964.
L. buF an, W. D. Adams R. J. 'oggs; "Cheriments for the Modern Physics Laboratorysics, Vol. 35(7), p. 63], 1967.
Particle Detectorerican Journal of
10. Samuel Glasstone, Sourcebook on Atomic Energy, Van Nostm Co.,Princeton, N.J., 1967.
11. Gregory Choppin, Nuclei and Radioactivity, Reniamin Press 1964.
12. D. Taylor, The Measurements of 4adioisetopes Jolter Wiley & Sons, N.Y., 195
13. R. T. Overman, Basic Concepts in Nuclear Chemistry, Reinhold Publishing CoN.Y., 1963
14. Allison P. Casarett, Radia,ion.BioloL Prentice Hall, Engl ood Cliffs,N.J.

APPENDIX IX
GoVernment Programs that. are Designed to. Help Colleges and
Universities with the Funding of Educational Scientific Eiui
Three agencies of the United States Government have had programs
to assist colleges in the procurement of scientific equipment for
instructional purposes. These programs-are-in addition to the
various research, grant programs conducted by a number of agencies
that nclude the purchase of research equipment. Of course, use of
suc_ instructional equipment for student and staff research
enco aged, and it is important that the quality of the equipment
be such that both functions may be served.
Atomic Energy Commission (Surplus Equipment Program)
For current information write to:
Administrator for Nuclear EnergyEnergy Research and Development AdministrationWashington, D. C. 20545
National Science Foundation
For current information write to:
Instructional Scientific Equipment ProgramDivision of Undergraduate Education in ScienceNational Science FoundationWashington, D. C. 20550
United States f_ _ ice of Education
Title VI of the Higher Education Act of 1965 is administeredby the United States Office of Education, which offers supportthrough matching-fund grants to institutions for the purchaseof equipment to improVe the quality of classroom instruction.It is pertinent to note that Title VI directs that considerationsbe given to enrollment pressures and the financial needs of theproposing institution.
252
'flu.:; Pr Orraill i L been dularn nptNi in I ;Ilih a way 1,1".11, it. itlVA Vet h( h
the U. S. Office of. Educaticrl grid U.* :;tate goverrunents. Fri gerioral, the
states et tip their own priority and evaluation criteria, as well a; the
schedule for closing dates and awards. Final evaluation is made by the
Office of Education and the grant is made directly by thetOffice of Edu-
cation to the school.
rnfor_matiorn on this program should be requested from the appropriate
state agency that is rsponsible for higher education. This might be the
State Department of Education, a ssion on Higher ucatlon, or a cc M-
parable offiCe. Requests made for informatic should include requests
copies of the pertinent information on criter and on the format or the
proposal itself. Information regarding the grant orwram may also be ob-
tained from the following:
Chief, College Equipment 4ant SectionBureau of Higher 7ducationUnited States Office of Education400 Maryland AvenueWashington, D. C. 20203
The closing dates from October 19 to loo- 15 in various
Contact your lccal office for information on this
In order to take 1 h any 0 1. n prOpe: _ must. he
wri 1 by the principal investi exp1a' n i ri J. what, he hpp(s what hn
plans Li do and Iii: propo -I will benefit or -,dt_tcat.1(
The experiments in this manual will help to answer the questic
"IRILa man be de
In writing I_ ar
familiarity with basic radioisotope ne, ur
Rielear :,mistry?"
ninr, (Thal the reader some
In thP it it Appendix
(Appendix at ond of the Manual we h-ive tnelnded s rr7c val i.it,l infor-
mation in mTrArd to 1 ic i and Federal rerulation for Isotope use. A

PERIODIC T BLE OF THE ELEMENTS
GROUPIA1,1792
A4 72427219'a tA 11017443-.T
11147-S49'..4
4*.1411,1Nykle-242116.042-.1.4A24716000r6A
'.** 761247610-A
Al 210113624,12111716116,4
A.19112.69d)t,T
14,131112411(a12371224W
2p1549-#ah.2014.94119a.,
2191314010-A29
112(34119-,e
C 161 117-
C. 4111310'yX131 16444-47143411-,s
Table of Radioactive IsotopesCd 115434M-A
Co 1411220r,,'141132102-,71144315411 -A
21613.1ke.S7241913021.,7272311932),
WhIII4110-
CE 213(3191m243191391")247119121
C-. 54171911,270201427910-A
112761,
1341120211-,s130,410'0a-1371202/9--,e
C. d4(12-1419.2'r..4
751120416A3T23414349
la 121(14/2-A13711191P,1
Ps 3311411( le 140148 rra N 21 1-441Axiadir,,le 17/410'901-A4
P1447P. 23513111.17714.1440-,.
Al. 22(14.111J-aPf 223(134r/7R
WI ISThellkea-
Mt 25619003.0
0'.,Pill. 232":439i242311.14443300,05:11'ikIZ:
159111alr..41
I ir A'
7111.141A-aI. 226(162004a
(4 73111111334:10-141 431121311' , le foil 1 knoo-,
iti. loos-day.?
M 111143411-aA- 3441410'91A166137612-0
Ile Ig 217172.IOyk7 Is 23213124
0. 191113,10-a0-14 1,0147112t1)11,07,,,
Al 161427.311P-a
1 129(10AW.,9 2314144r S 32111419-inum P. a3400016, II 12712.11416%cA'A
12116041P-4
*Feb 1°01°132(1111714:43::4-
le 111130414
I. 41414110-,T1 192(7144-4 I. 7511334009 401I0NIA.,
Fa 14712.644P la 11.1451oc3(4Apltl-q12.41141.0',7
la 11311 19dkla,.-
Sr 90171e1eSO(21d1Pvl
SNIMILyT. 1/211151/ -,T
TT, 14172610-1.
To' P9121.10,y1p.T7110fr*Ilk
i. 127(93ePTh 23211.44110111.,7
22611.91N=
20441S11194Tw 1701134419-,4-
2211143el0ykke29224121e14:91144(4,17235q.1e101210470233114e10'414,7
W 11517$41P
90(bilera175(4.241).710(314119(7.e'
631434111c9..7
9$163411P:14."9219.101.71p.y
166.617 mcwrao mina*, Wham lateawa ayMa mom "mine Msdh Pm am 11. 0421111111 11w..
1.S. 6, d 0.6 r mod 0* Nook 66.140 Mm. dell .11'wen sdlway. The aria dwertale We mak 44dwir 0,4 ,4.*$ amides aa. Serve es leir4.
.4141 111114 l 1.410.10. aspenIsda es*. Sf oxewewee Waal
A* awanal y smile re,K K4441441 co 4- Yeemal elmimes smrm.
VIIIA
VA A5 10.111 11.0111
At= -1431.110
11133137
04700rt(4.3413,FInfirine
44161110
ArIVB VI3 vale IS IIB 01t30,39,102
2271
44.9541147
-131=137.3 Krakin, 1.411
1.. Maaa,44,antonym*
4 02.906 100.4
13131"044704.44194143,
19717 49 114.134 63130
IC
06001 144.010141henlins W404.30
Peladium ad lam
7.11 11113014.1"3.13,'
1,41117m17.717030
Tinf4.4441s1
Anti1444P.A.13,901 31 134.11
1912
1.00
87 (13 1336)
01.1361160
0104n330
9 (117)
(441.4d43.NefiliMM
11.1107147441
Taaolum 01mis41171.111n.now. 136411730W
11101
3. IA1 -
7 13614 91 1gj 14.11
4 "31 '11433' 141).5ett.61. i 0411101 143 90103401
85 10 86 12"- 1-6111)
At '42 R_n01341601407 1441-'0''0.'.:.Minting 94e00
58 140.1
1461 _LI
..47
90 231.0314
3130130 7
vm,,,,,
7
313$0,373 p
9 1311)
_111301
117i3.4
4tirrA
14124
3037,,,,
__,
230.02
13111 . _
ttrlf.4"
61 (47,- '
I
s,:141:31,4.,,,,,
1337
37
tis
ih.ipt,t--'..'
62 ,503,1100 'a1712 Sm
(,.
D n n1,12,1
11,717,;.:
1
f
EU1st:1,4:p=
5 ,.-6 3 1 3,
i4.$
TZiii"
4 '3 r:'771: V aeptvg;pa,,p;
9i. (3471
'7. 3
''t.t..;.'''
1111466
l'j7': To1st...vier
97 04,1
'041..t,:"
i 43 0
3400 '-07
.".5. D.gy.1,0,r111.1,,7,..
671.4,303100 _ '1"-1 Ho
101.41:16,3,444;,,
99 (13
=
ilr,."izi'...
3,67.24
$
1.03 Er'It 3.,1140
1"51
--- Ftlintz."'
69140.934_ 3,2
.. TmI Klit113.1:30
1 01 125k
=
,,r.:;:d1v:..'
70 I
7771; YE,171141'737060
1 02 1334)
=
"azz,;.'
174.97
$
iNtioinelt..6,11
137)
--_.
ra-m,.".7i'7..!
98 (211
--
ti,N,n'..,"
NOUS:
11) Ned -,e141
114.1 00s.
-1107111.
Cbudim - vynee1k01. 9r4pet41.
(2) lewd spel 1047, 12, ( 1 ilelkOn noll 06114 011461 W43 hove.(31 Vakes k, seisms show% am fm IIr11id4 14 9441141
501
min -WELCHSARGENTWELOi SaENTIP1C COMPANY7300 LINDER AVENUE, SKOKIE, ILLINOIS 60076
=OP * mum Imo 4 MEW
11110913111 * 1111111131, 1.1. * 1IYi10, 31111. . 22-2-11741, =V 1:: I
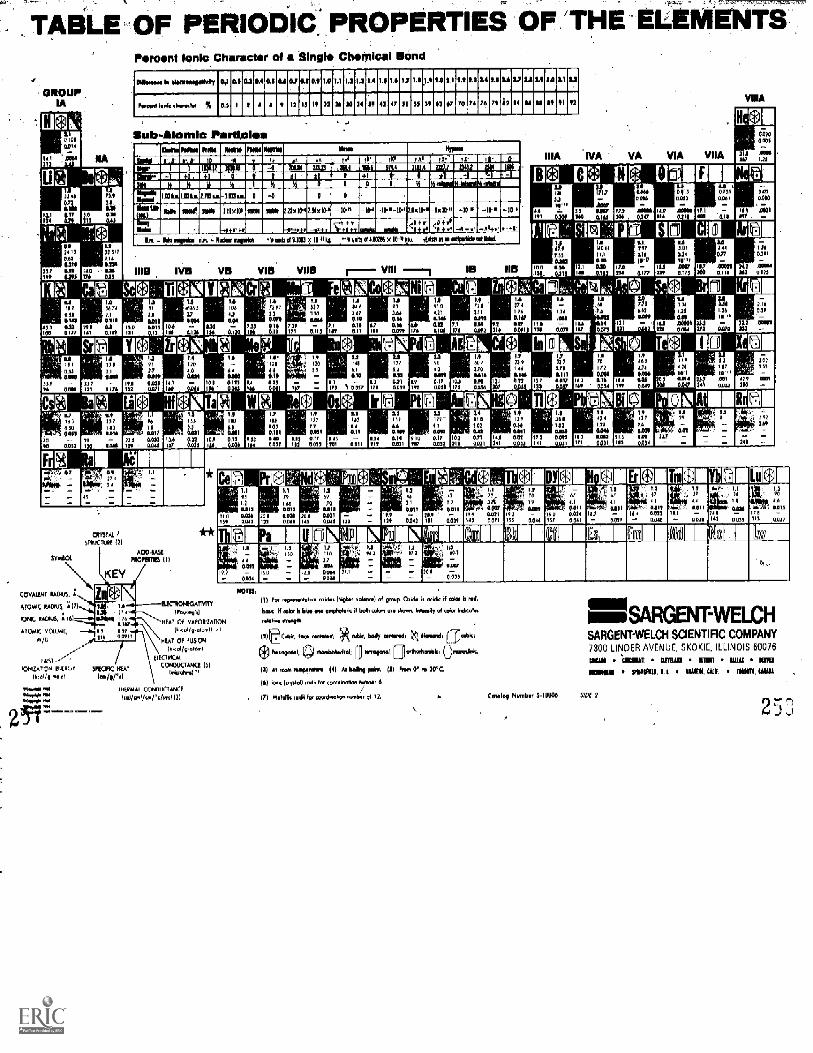
TABLET OF PERIOOIC:PROrERTPES -ELEMENTS
GROUPIA
Percent Ionic Character of a Single Chemical Bond
PartWleePIM
WilmmwrnmrmasizaMmummutvillEnuninNEVIN
minelit2 vn-7-rzlnINEIIIIETAIWffrlitrAllr9MVJMETTIMiaffamnuartmminKIMIIMIMMNImwmrisiMINEDUnimommarst .1 _E"'IlBleireMMMINKMMULiMMENWIMMIU=L:tL_-7=7
FltE.A-1:Mi= 0
I WA-aMI6
.. -30-1 -4}-1 Ifts 23 li -1(011:2 -0
MP MINISEWIPMI _:.ERIMINI- nimbi - rum .1 1 i 70 3 01 8 r Md.
ww
IIIB IVO VII VIIB VIII IB I
IIIA NA VA VIA
07330041
11017.1 0.3aiu _
797010Olt
041aa 0.11174 0101
104
4401!
A 013ia 00411
lad01400320033
477 .M01
Lai M 11(3 Pt ELI IV 34 1.1.
COVALB41
MOW 440616.
IOW 66DI16, ; 161
CI1YITAI
iroucue (714(10.6ASt
460(161TE1 111
KEY
All
ATOMIC 4011.165 .
W/7
711101
IONIZATION FITTITGT
1690li4.3o41
1 011
1 0611
11.0134
(21
13
6010 I0647 133
II30
a
iii_
GO10 0 1141143 0.041
b 15
0.0 1-9
7 17
0033
iiWPM
1
, IIDY
-1
0
_
II
0.941
1.,..,
a
1157-0
II.7-
1I
01111-0034
'11,
1.3
1
0.
fi 040
Tm EDE
IIII I- 1
II.
-55
ill115
1.1
013-
0 N. EICI IN 2_
--
M
700
y
--
007
6.073
Cu Vro Id
-A
7-On
0 - 3- -
KAT OF VAPORIZATION
1177014 010311 4)
404T Of 13141064
Nicol/giala
330774.701onAsadoad
ocava
5PE00c',A5 CONZATCTA74CR (5)
011071/13r01
1
4101440 CONIXICTANCE
i003/0033/04/'0001 i3)
50752 :
(3) for 667641404644 41i466 Die* 44larA1) of ardap. TURN a wick if 6461 a rod.
RRATT c irfit4 blir 4441oraptiatatic 4 4614 Wan re 14444 Werirty 6f toke Imilcotrys
dr.VA
Cirk, fire
rli
(4) Ai 07031a pad TR) 1
TGA 0000-90ian NARTAr
coordiranion /0716er of 12.
isme SARGENT-WELCHSARGENT-WELCH SCIENTIFIC COMPANY7300 LINDER AVENUE, SKOKIE. ILLINOIS 60076
MOM 'MOTO cumin 0 KNIT lati PIM
MOM f j6164,111. 6.1. 651(5 CAIN. TINT!, UAW
0614106 Mamba 5-11106 SO4 2
2