cleantechorbite aluminae inc. (tsx: ort) buy · pdf file17-09-2012 · 65-70%...
TRANSCRIPT

Philip Shen, (949) [email protected]
Matt Koranda, (949) [email protected]
Sales (800) 933-6830, Trading (800) 933-6820
COMPANY NOTE | EQUITY RESEARCH | September 17, 2012
Cleantech
Orbite Aluminae Inc. (TSX: ORT) | EORBF - $2.80 - OTCQX | Buy
Initiation of Coverage
Stock Data
52-Week Low - High $1.26 - $3.79Shares Out. (mil) 180.10Mkt. Cap.(mil) $505.03-Mo. Avg. Vol. 21,11612-Mo.Price Target $10.00Cash (mil) $60.2Tot. Debt (mil) $2.4
EPS $
Yr Dec —2011— —2012E— —2013E—Curr Curr
1Q (0.02)A (0.02)A (0.03)E2Q (0.01)A (0.03)A (0.02)E3Q (0.02)A (0.05)E (0.01)E4Q (0.03)A (0.05)E (0.03)E
YEAR (0.08)A (0.17)E (0.09)E
Revenue ($ millions)
Yr Dec —2011— —2012E— —2013E—Curr Curr
1Q 0.0A 0.0A 7.5E2Q 0.0A 0.0A 11.3E3Q 0.0A 0.0E 19.5E4Q 0.0A 0.0E 27.0E
YEAR 0.0A 0.0E 65.3E
4.504.003.503.002.502.001.501.00
Oct
-11
Nov
-11
Dec
-11
Jan-
12
Feb-
12
Mar
-12
Apr
-12
May
-12
Jun-
12
Jul-1
2
Aug
-12
Sep
-12
0.350.3
0.250.2
0.150.1
0.050.0
PriceVol (m)
EORBF One-Year Price and Volume History
EORBF: Slaying the Bayer; Initiating with aBuy and $10 PTOrbite Aluminae has developed an innovative, closed-loop, acid recoveryprocess that efficiently extracts alumina, other metals (hematite, MgO), andrare metals (scandium, gallium). Unlike the Bayer process, Orbite’s aluminaproduction does not produce any toxic waste. The company is already in JVor licensing discussions with RUSAL and Nalco and is poised to disrupt theglobal alumina industry.
■ Initiating coverage on Orbite with a Buy and $10PT. Orbite has developeda novel chemical process that unlocks the potential of aluminous clays atan attractive cost structure and without any red mud waste. The strategicimplications for the alumina industry are potentially far reaching. We expectthe industry to be disrupted and Orbite to be a prime beneficiary. As a result,we are initiating coverage with a Buy.
■ Bayer vs. Orbite: Orbite wins. Management is targeting an alumina coststructure of $210/tonne vs. the 125 year old Bayer process of ~$265/tonneas a global average. Not only does Orbite avoid the production of red mudwaste, but it also can use red mud as an input. The Bayer process is only65-70% efficient at refining alumina, resulting in 10-30% alumina in the mud.Thus, Orbite’s technology can serve as a way to remediate red mud sitesthroughout the world, while generating attractive ROI for waste site owners.
■ B/S fully funded to bring 1,500tpa HPA facility online by YE’12. With$60mn of cash, management has the capital required to build its 1,500tpaHPA facility. Production is targeted to begin in Q1’13, and we see a clearpath ahead. Concurrently, Orbite is finalizing the BFS for its 540,000tpa SGAplant, which we expect to start production in 2015.
■ By-products to drive attractive SGA margins. Although SGAperformance could yield top tier financial performance in the aluminaindustry, we expect the revenues from by-products (hematite, rare metals,etc) to drive substantial margin expansion and financial performance asthese by-products are produced with little to no incremental cost.
■ Partnerships on the horizon. RUSAL and Nalco are each discussing eitherJV or licensing agreements with Orbite, which we view as positives. RUSALmay invest $25mn in Phase 1 of the SGA plant.
■ What could go wrong? We view solid execution as the key success factorsince Orbite is pre-revenue. It is critical for the company to meet or exceedexpectations for capital costs, operating costs, and product quality. Anymaterial delays or hiccups in the chemistry could serve as a downside riskto shares.
Important Disclosures & Regulation AC Certification(s) are located on page 69 to 70 of this report.Roth Capital Partners, LLC | 888 San Clemente Drive | Newport Beach CA 92660 | 949 720 5700 | Member FINRA/SIPC
Page 2 of 70
ORBITE ALUMINAE INC. (TSX: ORT) Company Note - September 17, 2012
INVESTMENT THESIS We are initiating coverage of Orbite Aluminae with a Buy rating and a $10 price target. Orbite Aluminae has developed a novel set of chemical processes that we believe is poised to disrupt the ~$30bn alumina industry, as it expects to produce alumina at an attractive cost structure ($210/tonne vs. global average of $265/tonne) and not leave behind a toxic residue. Moreover, the technology can process a variety of inputs, such as abundant aluminous clays, low grade bauxite, fly ash, and even red mud, in contrast to the traditional Bayer process, which requires high grade bauxite ore. In addition to alumina, Orbite expects to produce a variety of by-products, such as hematite, rare metals, and rare earths that can generate meaningful revenue for little to no incremental cost, thereby driving margin expansion and return on capital. The key to the technology is its closed-loop, acid recovery process. The fundamental key to Orbite’s chemical process is that it recycles the hydrochloric acid used to leach and separate the metals from the clay. Although the process requires more energy than the Bayer process, it is overall more cost efficient compared with the Bayer process as (1) the feedstock is less expensive and (2) it uses much less reagent. Importantly, Orbite’s technology does not create any toxic red mud waste. In order to recycle the hydrochloric acid (HCl), all metals, which are converted into chloride form, must be concentrated and extracted, resulting in a number of valuable by-products. Orbite’s alumina production technology, in our view, serves as a material threat—and opportunity—to incumbent producers. The strategic implications for the alumina industry of a successful Orbite and proven technology are far reaching. If the company demonstrates its ability to scale the technology and meet its capex, opex, and quality targets, the technology will at once threaten and capture the interest of the alumina industry. On the one hand, Orbite will launch into the top tier of the industry cost structure with a new refining process that has a much more attractive return on capital profile, and threaten the alumina establishment. On the other hand, the company will have demonstrated a technology that can remediate a significant portion of the world’s 3bn tonnes of red mud waste, potentially relieving the industry—and the world—of this hazardous waste. While access to high grade bauxite is becoming increasingly limited, aluminous clays, Orbite’s primary input, are “inexhaustible” according to the USGS. Aluminous clays are in abundance throughout the world and often in close proximity to aluminum smelters. Most of the bauxite ore is found near the equator and far from smelters located in the northern hemisphere. Orbite has secured an aluminous clay deposit in Québec that has over one billion tonnes of feedstock located within 1,000km of 11 smelters. Orbite will first bring a 1,500 tpa HPA plant online in 2013 and then construct a 540,000 tpa SGA facility targeting 2015 production. Once the company brings online its HPA plant, we believe Orbite will have demonstrated its ability to scale its innovative chemical process. Additionally, despite the low production volumes, we expect this plant to drive company revenues with attractive gross margins of ~50+% off ASPs ranging between $40-150k/tonne depending on the grade (4N-6N). Management is targeting a 2015 start for the SGA plant. In addition to 540,000 tpa of SGA, the company will produce the following by-products—hematite, scandium, gallium, among many others. A number of partnerships are on the horizon. Earlier this year, RUSAL, the largest aluminum producer in the world, and Orbite signed an MoU to develop Orbite’s first SGA facility. Management expects the plant to be built in three phases. RUSAL could invest $25mn in the first phase of the plant. Nalco, the largest integrated aluminum company in Asia, is also open to investing in the SGA plant. Additionally, Nalco and Orbite are discussing potential licensing agreements for the technology to be used in Asia.
Orbite Aluminae (TSX: Orbite; OTCQX: EORBF) Buy

Page 3 of 70
ORBITE ALUMINAE INC. (TSX: ORT) Company Note - September 17, 2012
Orbite can also unlock the potential of rare metals, such as scandium. Through the recycling of HCl, rare metals, such as scandium and gallium are concentrated and extracted. Thus, the separation of these elements are at little to no incremental cost. Given the attractive pricing of a number of rare metals, nearly all of the revenue generated drives margin expansion. Going forward, the company may also serve as a rare metal and rare earth processor for other companies that have ore or concentrate, but a challenged means to separate the elements. What could go wrong? The reality of the current situation is that Orbite is a pre-revenue company that has developed a promising technology. In our view, one of the key sources of downside risks is in the company’s ability to execute. It will be critical for the company to meet or exceed expectations for capital costs, operating costs, and product quality. Any material delays or hiccups in the chemistry could serve as downside risk to shares. Moreover, as the HPA facility is brought online, we will be looking for off-take agreements—a lack of agreements could also serve as downside risk. Our model has built in conservatism, and we establish a $10 PT. Our forecast assumes that Orbite’s chemical processes work and are cost effective. We assume reasonable margins, but leave meaningful room for upside. We assume that the HPA plant successfully launches in 2013 and that the company commissions two SGA facilities by 2018. We use current market level ASPs, which we view as conservative, for nearly all end products, which are down between 20-60% of what the company assumed in its NI 43-101. Given these assumptions, we forecast revenues to reach $941mn by 2018 and with an EPS of $1.11. Applying a DCF analysis with a 15% WACC, we arrive at our price target of $10. CATALYSTS Orbite is poised to demonstrate that its closed-loop, acid recovery alumina refining technology is economic and effective. The HPA facility is expected to be completed by YE’12, and we expect off-take agreements to be announced ahead of HPA production. As we frame out stock catalysts below, we expect most of the near-term catalysts to be driven by (1) the company’s business development progress for both HPA and SGA and (2) the progress in constructing of its HPA facility. Upside catalysts
• HPA facility built and brought online as scheduled. In regards to the HPA facility, it is all about execution, in our view. On the one hand, management needs to create demand and sell the HPA. On the other hand, the team must also deliver a facility to meet this demand.
• Off-take agreement announced for HPA. Orbite’s HPA facility is scheduled to be completed by YE’12 and should be generating revenue starting in Q1’13. We are looking for off-take agreements to be announced over the next 6-12 months.
• Business development activities beyond HPA. As the company demonstrates that its alumina refining process is economical and effective, we expect the pace of business development activity to pick up. There could be a variety of activities including off-take agreements for SGA, licensing of a subset of technologies to companies throughout the world, and various JV investments from industry players.
• Completion of SGA feasibility study. Following Orbite’s prefeasibility study finalized earlier this year, management expects the SGA Bankable Feasibility Study (BFS) to be completed by YE’12 or Q1’13. While the contents of this study could serve as a positive or negative, we see more upside with the publication of this study as we expect the study to enable other activity such as closing off-take agreements.
• Complete agreement with RUSAL. RUSAL is the largest aluminum producer in the world and has signed an MoU with Orbite to develop a JV in the first SGA plant. While this JV has not been finalized, we expect the relationship to be formalized soon.

Page 4 of 70
ORBITE ALUMINAE INC. (TSX: ORT) Company Note - September 17, 2012
• Finalize agreements with Nalco. Nalco is India’s largest aluminum producer and one of the largest in the world. The company asked Orbite to test some red mud to assess the economics and effectiveness of extracting alumina while remediating the red mud.
• Takeout potential. The company has potentially developed a game-changing process, which could represent an attractive opportunity to large and well-capitalized incumbents, such as Alcoa and Rio Tinto Alcan. At some point, these companies may try to acquire a large or even controlling stake.
Downside risks
• Poor execution or delays. Orbite is sufficiently capitalized with $60mn of cash on its balance sheet as of Q2’12 and has a line of sight to completing its HPA facility. If the HPA construction is delayed meaningfully, we see this as a downside catalyst.
• Weaker-than-expected demand for HPA. If management has difficulty generating demand for its HPA and does not sell a meaningful portion of its HPA production, this would result in a negative scenario.
• Unexpected permitting or environmental issues. The management team, in our view, has a keen understanding of the permitting process required for both of its HPA and SGA facilities. The HPA facility is nearly fully permitted, so there is likely less risk here, but the SGA facility is still nearly a year away from securing all of its permits.
• Greater-than-expected cash burn. In our view, cash conservation is important in spite of a healthy cash balance as of June 30, 2012. Overhead has grown ahead of revenue generation, so we believe prudence is important as Orbite ramps up its HPA production.
• Excessively dilutive equity capital issuances. As Orbite moves into the design, engineering, and construction phases for its mine and production facilities, substantial amounts of capital will be required. We acknowledge that future equity raises are likely required. If, however, the company relies on equity raises more-than-expected to generate capital, this could dilute current shareholders more-than-expected.
• IP theft or technology replication. Although we believe that Orbite may be the first company to have economically extracted alumina out of red mud, we also believe that others are attempting to do this. We see the theft of IP or replication of Orbite’s technology as a material risk.

Page 5 of 70
ORBITE ALUMINAE INC. (TSX: ORT) Company Note - September 17, 2012
COMPANY OVERVIEW Orbite Aluminae (TSX: ORT; OTCQX: EORBF) is a Canadian resources and technology company that focuses on the production of high-purity alumina (HPA), smelter grade alumina (SGA), and value-added by-products such as rare metals. Orbite has developed a potentially disruptive alumina extraction alternative to the Bayer process, the 125 year-old method currently used to extract alumina from bauxite ore that produces a toxic residue. Orbite’s patented technology can produce alumina (1) using a variety of inputs, including aluminous clays, low grade bauxite, and red mud; (2) at lower cost than conventional producers; and (3) with no hazardous by-products. Orbite owns the rights to the Grande-Vallée property, a resource that contains more than one billion tonnes of aluminous clay. The company expects to complete construction of its 1,500 tpa HPA facility in Cap-Chat, Québec by year end 2012, and is targeting 2015 for its 540,000 tpa SGA plant. Orbite is headquartered in Montreal and was founded in 1983. Orbite has an ambitious business model centered on refining alumina without producing toxic by-products. The company has developed a novel and unique set of technologies to process High Purity Alumina (HPA) and Smelter Grade Alumina (SGA) that produces limited to no toxic by-products in contrast to the industry standard, which outputs nearly two tonnes of bauxite residue (“red mud”) for every tonne of alumina produced. Orbite started its technology development in 2005, and produced its first HPA sample on a pilot scale in 2007. Orbite’s technology can cost-effectively process non-traditional inputs, such as aluminous clays, and even red mud, to produce its HPA and SGA. We expect the company’s SGA process to also yield valuable by-products, such as hematite and rare metals (including scandium and gallium). As the company gains commercial success, management may license its technology to incumbent players. Exhibit 1: Orbite’s business model is ambitious and is expected to generate a number of revenue sources.
• HPA PlantNameplate: ~1.5k tpa vs. WW demand of ~10k tpaCapex: ~$40mnExpected start: Q1’13
• SGA PlantNameplate: 540,000 tpaCapex: ~$650mn, ~$1,200/tonneCost structure: ~$210/tonne vs. industry avg ~$265/tonneExpected start: Q1’15
ORT Business Model: Overview
(A) ResourceInputs
• Grande-Vallée Clay>1bn tonnes
• Red Mud3bn tonnes WW120mn tonnes produced annually
• Low Grade BauxiteConsidered low grade if silica content exceeds 10%
• Fly Ash>300mn tpa WWAlumina content between 17-26%
• Other ResourcesNephelineKaolin (20-30% alumina content)
Refining Technology:(B) HPA and (C) SGA
(D) Revenue Sources/Outputs
• HPA: 1.5k tpaBy Products:
Rare metals & earths: tpa TBD
• SGA: 540k tpaBy Products:
Fe2O3:190k tpaSiO2: 1.2mn tpaMgO: 28k tpaMixed oxides: 104k tpaRare metals & earths: 1k tpa
• Licensing RevenuesSGARare earth processing
ORT s alumina (HPA & SGA’ refining technology does not result in any toxic residue or
red mud
Source: Orbite NI 43-101 and company presentations; ROTH Capital Partners.

Page 6 of 70
ORBITE ALUMINAE INC. (TSX: ORT) Company Note - September 17, 2012
The company is poised to disrupt the $30bn global alumina industry. We expect Orbite to disrupt the alumina industry as the company (1) has alumina production technology that does not produce toxic by-products and that unlocks non-traditional alumina resources, such as aluminous clay and even red mud; and (2) can produce HPA and SGA at attractive cost structures. Orbite’s HPA facility is expected to come online in Q1’13 at margins management claims are significantly better than industry standard. The company’s first SGA facility, expected to come online in Q1’15, is targeting production costs of $210/tonne vs. industry average of $265/tonne. In 2011, according to the International Aluminum Institute (IAI), 92mn tonnes of alumina (SGA, chemical, and HPA) were produced on a global basis. We estimate that HPA production was ~10,000 tonnes, representing a market value of approximately $500mn, while SGA production was ~86mn tonnes, representing a market value of approximately $30bn, for an estimated total market HPA and SGA market size of ~$31bn.
Exhibit 2: We expect both Orbite’s HPA and SGA cost structures to be well below industry average.
Global SGA Cost Curve
Orbite SGA Cost Structure: $210/tonne
Global Average: $265/tonne
Source: Orbite; CRU; Hydro (Q3’11, Oct’11); ROTH Capital Partners estimates.
Exhibit 3: SGA represents the vast majority of global alumina production.
SGA, 93.56%
Chemical , 6.42%HPA, 0.01%
Global 2011 Alumina (Al2O3) Production92mn tonnes
Source: International Aluminum Institute; ROTH Capital Partners estimates.
Not only does Orbite’s alumina refining technology not produce any toxic by-products, such as red mud… Current alumina industry best practices permit production of bauxite residue—a toxic by-product commonly known as red mud. Alumina producers over the past 125 years have used the Bayer process to produce more than 95% of the world’s alumina. The Bayer process requires a substantial amount of caustic soda (NaOH) and outputs more than one tonne of red mud for every tonne of alumina produced. This red mud typically has an alkaline pH of 13 and poses a material threat to people and the environment. There are red mud spills and accidents on an annual basis in spite of efforts by companies to contain and mitigate risk. Globally, there is approximately 3bn tonnes of red mud, and the industry produces 120mn tpa. Orbite, on the other hand, has developed a closed-loop, acid recovery process that recovers 99.95% of the hydrochloric acid employed in both its HPA and SGA facility, preventing the acid from being released into the environment. For a more detailed discussion on red mud, please see the appendix.

Page 7 of 70
ORBITE ALUMINAE INC. (TSX: ORT) Company Note - September 17, 2012
Exhibit 4: Red mud represents an environmental hazard…
Source: dailymail.co.uk (Accessed: Aug’12).
Exhibit 5: …with spills and accidents happening regularly. Date Location Company Description Damage
5/26/12 ChinaGuangxi Huayin Aluminum Co.
• Nine site leaks since 2008; most recent accident started on May 26th. • Sludge covered farmland and homes in Jingxi county.• Refinery was closed on 8/21/12 and fined approximately $15,000 because it failed to get its environmental protection facilities approved.
• 670,000 square meters covered.• 43 homes affected.• 240 people affected.
5/16/11 India Vedanta
• Heavy rain caused red mud pond to leak into a village in the evening.• Company repaired the leak and cleaned up most of the red mud by the following morning.
• One death from factory pollution.
4/5/11 India Vedanta• Heavy rainfall cracked the red mud pond wall. • Red mud leaked into water bodies and the Vansadhara River.
• Leaked for three hours.
10/4/10Ajka,
HungaryMAL Co
• Lagoon wall broke releasing one mn tonnes of red mud over several Hungarian cities. • Over 40 sq km impacted and wave measured one to two meters high.
• Company fined $648mn. • Gov't paid $166mn for clean up and reconstruction. • Ten people killed. • >150 injured.
4/27/09 Brazil Alunorte• Heavy rainfall caused red mud to leak into the Murucupi River.
• Fined almost $10mn. •15 court cases are pending.
8/20/08Jonquiere, Quebec
Rio Tinto Alcan• PGS Industrial Group was working on red mud pipeline while Rio Tinto was passing red mud through it resulting in leak.
• Fined $50k. • Subcontractor (PGS Industrial Group) fined $15k.
7/6/07Jonquiere, Quebec
Alcan• Transport pipe ruptured and leaked red mud into the Saguenay River.
• 1,200 cubic meters.
Source: Various news sites; ROTH Capital Partners.
…but the technology can also use red mud as an input, thereby remediating red mud sites. The Bayer process is only 65-70% efficient in processing bauxite ore into alumina. As a result, red mud contains between 10% and 35% alumina content. Orbite’s SGA processing technology, however, is 85-95% efficient in extracting alumina. Given the expected low operating costs of Orbite and high efficiencies, the company can economically recover the remaining alumina in many red mud sites, providing an attractive return on capital for the lagoon owners, while remediating the waste site over time, thereby mitigating community and environmental risks. Exhibit 6: While red mud is considered waste, the residue contains a meaningful mix of alumina (10-35%).
0.0%
10.0%
20.0%
30.0%
40.0%
50.0%
60.0%
70.0%
Alumina Hematite Sodium Oxide Calcium Oxide Magnesium Oxide
Red MudMix of Elements and Minerals
NALCO -- Low NALCO -- High Red Mud Project -- Low Red Mud Project -- High
Source: Nalco; Orbite; Red Mud Project; ROTH Capital Partners.
(A) Resource Inputs One of the unique attributes of the Orbite alumina refining technology is that it can process a variety resource inputs. Historically, low silica bauxite has been the primary source of alumina via the Bayer process. We believe Orbite has unlocked many other sources of alumina. The technology can economically process aluminous clays, low-grade bauxite ore, and even red mud. We view this flexibility as a material competitive advantage and a key point of differentiation as Orbite enables the (1) unlocking of aluminous clays that may be in much

Page 8 of 70
ORBITE ALUMINAE INC. (TSX: ORT) Company Note - September 17, 2012
closer proximity to smelters vs. bauxite or alumina shipped from the equator; (2) remediation bauxite residue, i.e. red mud; and (3) economic processing of low grade bauxite (i.e. high silica content). Orbite is positioned to unlock the potential of aluminous clays. Aluminum is the third most common element (8%) in the earth’s crust after oxygen and silicon. Of the metals, it is the most common metal in the earth’s crust. Aluminum is found in many types of clay, soil, and rocks throughout the world. Industry, however, is not able to economically separate the aluminum found in clay and other sources as they contain high silica content. The Bayer process, which produces over 95% of the world’s alumina required for aluminum, cannot economically process material that has silica content above 10%. Orbite has developed a closed-loop, acid recovery process that can cost effectively leach the alumina from clays and other sources, thereby unlocking the potential of aluminous clays. Often these clays are located in close proximity to aluminum smelters compared with existing bauxite resources. ~63% of smelters are located in the Northern Hemisphere, while most of the bauxite resources are located in close near the equator and away from smelters. Our industry sources suggest shipping costs from Jamaica to Québec are high at ~$17 per tonne of bauxite and ~$20 per tonne of alumina.
Exhibit 7: The vast majority of bauxite resources are located near the equator...
Source: Roskill; Hydro (Q3’11, Oct’11).
Exhibit 8: …while ~63% of aluminum smelting is in the Northern Hemisphere, which results in high transportation costs…
Source: Wikipedia (Accessed Aug’12).
Kaolin—rich with alumina—clays are located close to many smelter clusters. The majority of aluminum smelters (~63% of global capacity) are located in the Northern Hemisphere. Significant deposits of kaolin clays, known as kaolinite, are in many of these same locations. For example, economically accessible kaolinite can be found in Japan, Germany, Ukraine, England, Spain, and the U.S. in substantial quantities. Kaolinite is a potential substitute for bauxite as it may contain high alumina content of ~38%. The clay has a constructive silica-to-alumina ratio of 1:1. While other clays often contain alumina, they may have a less beneficial silica-to-alumina ratio of 2:1. Orbite has secured the mining rights to over one billion tonnes of aluminous clays on the Gaspé Peninsula, in Québec, Canada. The company’s flagship property is located close to the town of Grande-Vallée and is only 120 kilometers away from Cap-Chat, which is where Orbite’s HPA facility is located. The future SGA plants will be located on or near the Grande-Vallée mine, which will provide easy access to deep water ports located in the towns of Grande-Vallée and Gaspé. In Sep’12, Orbite received its mining lease from Québec’s Ministère des Ressources naturelles et de la Faune. The lease gives Orbite the right to mine an initial 90 hectares representing ~70mn tonnes of its Grande-Vallée site for 20 years. We expect the mine lease to be renewed relatively easily and the company to increase its volume rights over time.

Page 9 of 70
ORBITE ALUMINAE INC. (TSX: ORT) Company Note - September 17, 2012
Exhibit 9: Orbite’s HPA plant is located in Cap-Chat and will process aluminous clay from Grande- Vallée.
Source: Orbite presentation (Jul’12). The Grande-Vallée property gives Orbite a logistical advantage. Situated on the Gaspé Peninsula in eastern Québec, Orbite’s flagship resource and future SGA plant have the potential to supply alumina to nine Québec smelters located within an average of ~400km of the property. Two additional smelters located nearby in New York are approximately 1,000km away and three more in Iceland are ~2,600km away. Operating at full capacity, we estimate these plants could represent ~8mn tonnes of alumina demand, representing ~9% of global demand, or nearly 15 times the 540,000 tonnes of SGA per annum that Orbite plans to produce. We expect Orbite’s value proposition to be compelling to most of these plants, as they currently import alumina from distant countries, such as Jamaica, Brazil, and Australia.

Page 10 of 70
ORBITE ALUMINAE INC. (TSX: ORT) Company Note - September 17, 2012
Exhibit 10: Approximately 7% of the global aluminum capacity is located near Orbite’s clay deposit. Aluminum Smelter Production Capacity
Close to Québec
Company 2010 Distance to
Grandé Vallée1,000s tonnes of Al km
Québec
Baie-Comeau Alcoa 385 200Sept-Iles Aluminerie Alouette 572 150Beacancour Aluminerie de Becancour Inc 413 600Deschambault Aluminerie Lauralco Inc 260 550Alma Rio Tinto Alcan 435 500Arvida Rio Tinto Alcan 172 375Grande-Baie Rio Tinto Alcan 215 350Laterriere Rio Tinto Alcan 235 375Shawinigan Rio Tinto Alcan 100 625Total or Avg Distance 2,787 414
% of global capacity 5.2%
NY
Massena East Alcoa 125 975Massena West Alcoa 130 975Total or Avg Distance 255 975
% of global capacity 0.5%
Iceland
Fjardaal Alcoa 346 2,800Grundartangi Century Aluminum Corp 260 2,500Straumsvik Rio Tinto Alcan 183 2,500Total or Avg Distance 789 2,600
% of global capacity 1.5%
Total or Avg Distance 3,831 963
% of global capacity 7.2%
Global aluminum production capacity 53,500
Source: Natural Resources Canada; Alcoa; Artic Economics; USGS; ROTH Capital Estimates. Economic access to the alumina in aluminous clays could be disruptive. The USGS refers to aluminous clays as essentially an “inexhaustible” 1 resource. The following represents a more detailed USGS view regarding aluminous clays in the U.S.:
“Bauxite is the primary raw material used in the production of alumina on a commercial scale in the United States. However, the vast U.S. resources of clay are technically feasible sources of alumina. Other domestic raw materials, such as alunite, anorthosite, coal wastes, and oil shales, offer additional potential alumina sources.
Although it would require new plants using different technology, alumina from these nonbauxitic materials could satisfy the demand for primary metal, refactories, aluminum chemicals, and abrasives.” 2
Orbite can process the alumina industry’s waste (red mud) and extract the remaining alumina. Bauxite residue, or red mud, is a highly alkaline and hazardous waste by-product created by the Bayer process, while producing alumina. This by-product is considered a major problem in the aluminum industry. Moreover, to our knowledge, there are no other technologies commercially available to address this problem. Orbite has tested a number of red mud samples. The company has effectively processed the red mud and extracted the alumina. In Jun’12, management published some successful results using the red mud and achieved as high as 92% extraction of the company’s alumina. As discussed earlier, red mud typically contains 10-35% alumina as the Bayer process is only 65-70% efficient in extracting alumina, while Orbite’s technology is 85-95% efficient.
1 USGS, E. Lee Bray, Mineral Survey: Mineral Commodity Summaries (Jan’12) p. 27 2 USGS, Bray, Mineral Commodity Summaries (Jan’12) p. 27

Page 11 of 70
ORBITE ALUMINAE INC. (TSX: ORT) Company Note - September 17, 2012
Exhibit 11: Orbite successfully extracted 92% of Naco’s alumina from the company’s red mud.
Source: Orbite press release (June 27, 2012).
Red mud waste throughout the world could represent six years of global annual aluminum demand. According to the Red Mud Project, there are currently three billion tonnes of red mud throughout the world. Additionally, the industry is creating 120mn tonnes of red mud waste annually as it processes bauxite ore. If all of the existing red mud were processed by Orbite’s technology, the industry could produce roughly 600mn tonnes of alumina, which roughly equates to 300mn tonnes of aluminum. Compared with 50mn tonnes of global aluminum demand per year, the industry could produce enough aluminum from the red mud waste sites to meet roughly six years of global aluminum demand. Orbite can also unlock the potential of low-grade bauxite. Anecdotally, our industry sources have indicated that much of the high grade bauxite ore (i.e. low silica content) has been consumed, and the industry is using increasingly larger volumes of low grade bauxite ore. Despite high alumina content (30-55%), alumina refiners limit their processing of low grade bauxite as it degrades the economics for an already challenged industry. Orbite’s technology leaches alumina content with hydrochloric acid and can unlock the alumina in low grade bauxite, resulting in better economics for alumina producers with bauxite resources. Low grade bauxite may also serve as a complement to low grade alumina red mud. We believe that Orbite’s technology is economically feasible when alumina grades are 18% or better. A meaningful number of red mud locations may have alumina content that is less than 18%. Despite this, Orbite’s technology could still economically process the red mud if low grade bauxite is readily available as it often is. If low grade bauxite, which typically has high silica content and high alumina content, is mixed with the red mud, the resultant input could achieve a greater than 18% alumina blend.

Page 12 of 70
ORBITE ALUMINAE INC. (TSX: ORT) Company Note - September 17, 2012
The power industry’s waste—fly ash—contains economic amounts of alumina. In the U.S. alone, coal-fired power plants generate ~71mn tons of fly ash waste on an annual basis. Of the annual global output, ~35% of it is reused. The top four most common reuses of fly ash are; (1) concrete production, (2) structural fills, (3) grout production, and (4) waste stabilization and solidification. Utilities and plant operators In the U.S. spend more than $500mn per year to manage and dispose of the fly ash. According to the American Society for Testing and Materials, there are two different classes of fly ash: Class C and Class F, which contain ~17% and ~26% alumina, respectively. We believe Orbite’s technology can economically unlock the alumina content in the fly ash by generating attractive returns on investment. Most of the fly ash produced is considered Class F. Exhibit 12: Fly ash contains as much as 26% alumina on average.
0%
10%
20%
30%
40%
50%
60%
Silica Alumina Hematite Calcium
Fly Ash Content by Class
Class C Class F
Source: USGS; ROTH Capital Partners. Our analysis suggests that coal-fired power plants could turn the ~$13/tonne spent on fly ash into an attractive return on investment using Orbite’s technology. Industry sources indicate that coal-fired power plants spend a minimum of $13/tonne to dispose of fly ash on site. Additionally, it may cost $2.50/tonne for every mile the fly ash is transported to an off-site location. For a plant that produces one million tonnes of fly ash per year, we estimate the capital costs to be ~$225mn. Our back-of-the-envelope analysis suggests an Orbite plant built to extract alumina from fly ash could generate roughly an eight year payback or 10-20% return on capital using class F fly ash, which has greater alumina content.

Page 13 of 70
ORBITE ALUMINAE INC. (TSX: ORT) Company Note - September 17, 2012
Exhibit 13: Class F fly ash has attractive returns and an eight year payback period.
Return on Fly Ash Content Unit Initial Cost Class F
Annual Costs
Fly ash produced 1,000s of tonnes 1,000 Content
Alumina (SGA) 26%Hematite 7%Extraction amounts
Alumina (SGA) 1,000s of tonnes 239 Hematite 1,000s of tonnes 64 Price
Alumina (SGA) $/tonne 330 Hematite $/tonne 80 Revenue
Alumina (SGA) $ 1,000s 78,936 Hematite $ 1,000s 5,152 Total revenue 84,088
% of ORT SGA facility production 41%
Capex/Depreciation $ 1,000s 204,082 8,963 Licensing $ 1,000s 20,000 Operating expenses $ 1,000s 40,917 Royalty (7%) $ 1,000s 5,886 Total costs $ 1,000s 224,082 55,766
EBIT $ 1,000s 28,322
Payback period years 8
Return on capital 13%
Source: USGS; Orbite press release; NI 43-101; ROTH Capital Partners estimates. (B) HPA: Poised to Validate Orbite’s Ability to Scale We expect the HPA plant to come online in 2013. High purity alumina (HPA) is considered a specialty metal and has limited demand of ~10,000 tpa compared with ~86mn tpa of Smelter Grade Alumina (SGA). HPA primarily serves as an insulating substrate in high tech applications and a grinding material in industrial applications. One of the key demand growth drivers is the LED industry, which we estimate consumes the majority of the synthetic sapphire material that is grown with HPA. According to some estimates, certain portions of the LED market are growing at greater than 20% CAGRs, including the LED lighting segment. The HPA production facility will be located in Cap-Chat, Québec on the Gaspé Peninsula. The company is in the process of converting its pilot plant into a commercial scale HPA facility. We expect the HPA plant to validate Orbite’s alumina refining process. Management expects to bring 1,500 tpa of nameplate HPA capacity online in 2013. The capex required for the HPA plant is expected to be ~$40mn, but the net capex could only be $30mn after factoring in local tax credits. With a cash balance of $60mn as of June 30, 2012, Orbite is well capitalized to complete the construction of this facility. Aluminous clay from Grande-Vallée will serve as the primary HPA resource input. For more information regarding Orbite’s position in the HPA industry, please see our Industry Overview section. (C) SGA: Poised to Reinvent the Alumina (and Rare Metals) Industry Orbite’s expected SGA cost structure places it in the top tier of alumina producers. Smelter grade alumina (SGA) is an intermediate product ahead of the production of aluminum. The global average production cost is approximately $265/tonne, and this compares with Orbite’s projected cost of $210/tonne, representing a ~25% cost advantage. Achieving this cost structure would put the company in the top quintile of production costs throughout the world. Moreover, the company would be able to do this without production of toxic red mud waste, which represents material value creation by eliminating the negative externalities of the red mud as well as capital and operating costs of red mud facilities.

Page 14 of 70
ORBITE ALUMINAE INC. (TSX: ORT) Company Note - September 17, 2012
Capital costs for Orbite’s facility range between $1,000-$1,200/tonne. This is inline with current industry capex levels for the Bayer process. Valuable by-products convert a mediocre return on capital story into an attractive one. On a stand-alone basis, Orbite’s SGA plant may generate a return on capital of mid-to-high single digit percentages. Relative to industry incumbents, this is actually at the high end of the range. On an absolute basis, we would argue that these returns are not attractive as they are likely well below the cost of capital and more poignantly highlights how challenged the alumina industry currently is. Orbite, however, has a key point of differentiation: its closed-loop, acid recovery process enables the concentration and harvesting of a number of valuable products, which are essentially produced with little to no incremental cost. Some of these by-products may have low value, while others can dramatically improve the company’s return on investment profile. More specifically, the SGA process is expected to produce scandium, gallium, and a number of rare earths. Despite falling prices, the rare metals and earths revenue stream could drive as much as one third of the revenue mix, thereby supporting attractive gross margins and overall financial performance. For more information regarding Orbite’s SGA refining technology and market position, please see the Industry Overview and Technology sections. (D) Revenue Sources and Outputs Orbite has a complicated—yet simple—business model. The company has developed a new technology for processing aluminous feedstocks into alumina. Simplistically, we would describe Orbite as having three major sources of revenues: (1) HPA plant; (2) SGA plant; and (3) Licensing. As discussed earlier, the company has its own resource—aluminous clay from the Grande-Vallée region—and management expects to process this clay via its HPA and SGA facilities. The HPA and SGA plants, however, produce a number of by-products, which have a variety of end-markets. Given the innovation in Orbite’s technology and its ability to process red mud waste, we expect alumina producers throughout the world to license Orbite’s technology over time. In general, we would characterize the HPA plant as one having low volumes, but attractive pricing and margins with growing end markets. We expect the HPA plant to produce several grades of high purity alumina including 4N, 5N, and 6N, with different pricing for each grade. Recently in Aug’12, the company issued a press release stating that the company could commercially produce rare earths as early 2013. We see this as a potential source of revenue upside for the HPA plant. SGA plant could have one of the best cost structures in the alumina industry on a relative basis… If we consider just the SGA output in Orbite’s SGA plant, then Orbite’s cost structure of $210/tonne would likely be at the head of the alumina industry’s cost curve, which has an average of ~$265/tonne. In spite of this attractive relative position, on an absolute basis, we still see mediocre returns on capital for this product line alone—perhaps mid to high single digit ROIC—likely due to low alumina pricing. Of course, in making these direct comparisons between the Orbite’s SGA technology and the industry standard Bayer process, we must note that Orbite’s technology does not produce tonnes of toxic red mud waste. Incumbents—unlike Orbite—must set aside capital and operating budgets for red mud processing, storage, and remediation. In our view, this is real value that is not captured in the company’s cost structure and represents a material negative externality.

Page 15 of 70
ORBITE ALUMINAE INC. (TSX: ORT) Company Note - September 17, 2012
…though we expect rare metals and earths to drive financial performance. Orbite’s SGA process produces a variety of valuable by-products that companies operating the Bayer technology do not have. Specifically, the SGA technology is expected to produce rare earths, rare metals, hematite, magnesium oxide, silica, and mixed oxides. Of these products, the most compelling by-products are rare metals such as scandium and gallium and rare earths. These products will likely drive a meaningful amount of revenue, and margin expansion. Licensing could serve as an attractive source of revenue, though visibility is limited. Given the innovative nature of Orbite’s technology, we expect to see licensing revenues going forward. The company will likely focus its licensing efforts on its SGA technology given the low volumes of HPA sold annually. The structure of these revenues would likely require some up-front payments and then an annual royalty of between 5-10% of customer revenues. The company has publically announced that it is in discussions with Nalco to potentially license its technology. Although this could be an important set of revenues for the company over time, we lean on the HPA and SGA facilities as providing the greatest visibility into the potential growth of the company in the near term.
Exhibit 14: We see HPA and rare earths/metals as key drivers of Orbite’s revenue, with additional upside potential from licensing. Orbite Business Model
(1) HPA (2) SGA (Volumes for single plant) (3) Licensing
Product Volumes ASPs Revenue Product Volumes ASPs Revenue(000s tonnes) (per tonne) (CAD in mn) (000s tonnes) (per tonne) (CAD in mn)
HPA (4N, 5N, 6N) 1,500 $80,000 $120 SGA 540 $330 $178 • Likely have an upfront fee
Rare earths & metals TBD TBD Fe2O3 190 $80 $15 • Annual royalty (5-10%) based
SiO2 1,200 $25 $30 on revenues
MgO 28 $400 $11Mixed oxides 104 $5 $1Rare earths & metals 1 $175,500 $176
Total $120 Total $411 TBD
Source: Orbite NI-43-101; ROTH Capital Partners estimates.
(E) Business Development Although Orbite is developing and building two facilities—one producing HPA and the other producing SGA—business development comprises a number of other products. In addition to SGA, the SGA plant will produce the following by-products: Hematite (Fe2O3), Silica (SiO2), Magnesium Oxide (MgO), mixed oxides, rare earths (Ce, Pr, Nd, Pm, Eu, Gd, Dy, and Er), and rare metals (Sc, Ga, Y, and La). In our view, one of the most important near term goals is to establish off-take agreements for the company’s HPA plant, which is expected to be commissioned by the end of 2012. Amalgamet has a potential global distribution agreement for HPA with Orbite. In 2007, Orbite and Amalgamet Metal Coproration (AMC) signed an agreement that gives AMC the potential to distribute Orbite’s HPA product from the Cap-Chat facility on a global basis. AMC is based in London, was formed in 1929, and has grown to a global trading and manufacturing company. AMC trades, distributes, and manufactures non-ferrous metals in 11 countries. RUSAL is the first major to pursue a direct relationship with Orbite. In Mar’12, Orbite and RUSAL signed a non-binding memorandum of understanding (MoU) with the goal of developing Orbite’s first SGA production facility. Management expects the plant to be developed over three phases. RUSAL could invest CAD 25mn in Phase 1 with the right to participate in the subsequent two phases. RUSAL agreed to supply know-how and specialists for the development and operation of the plant. In exchange, RUSAL will be able to test its feedstock at the SGA facility.

Page 16 of 70
ORBITE ALUMINAE INC. (TSX: ORT) Company Note - September 17, 2012
Nalco is exploring options to invest in Orbite’s plant as well as license its technology. Orbite and National Aluminum Company Limited (Nalco) entered into a MoU in Jun’12 to explore opportunities to invest in Orbite’s SGA plant and in licensing Orbite’s technology to process Gibbsite, Boehmite, and also red mud. Nalco is a government owned enterprise based in India and is the largest integrated aluminum complex in Asia with an alumina production capacity of 8mn tpa. Orbite has already tested Nalco’s red mud with favorable results, which demonstrates the potential of the technology to economically remediate red mud sites throughout the world, while producing valuable revenue streams such as alumina. We estimate that Nalco produces approximately 10mn tonnes per year of red mud from its alumina production.
Page 17 of 70
ORBITE ALUMINAE INC. (TSX: ORT) Company Note - September 17, 2012
TECHNOLOGY How does Orbite’s technology work? One of the key principles behind Orbite’s technology is closed-loop, acid recovery. In order to refine alumina—whether from the traditional Bayer process or Orbite’s—a reagent of extraction is required—typically either caustic soda (NaOH) or in Orbite’s case, hydrochloric acid (HCl). The caustic soda or acid are meaningfully expensive at about $200 and 300/tonne, respectively. One of the keys to Orbite’s expected tier one margins is due to its technology: By developing a closed-loop, HCl recycling process, Orbite can reduce its reagent consumption materially. (The other key to Orbite’s margin is access to inexpensive aluminous clay unlocked by the HCl vs. expensive bauxite ore). Not only does the Bayer process use more reagent, but, it also requires the companies to deploy capex and set aside opex to maintain red mud waste, the caustic soda is left behind as a residue. Orbite’s process results in no toxic waste. Orbite’s process uses HCl to refine alumina and harvest a number of by-products. To refine alumina, Orbite starts by mining aluminous clays that are easily accessible, which translates into low mining and feedstock costs. The clay is ground into particle sizes measured in microns, and then fed into a leaching tank, where the clay is mixed in with HCl. During the leaching process, the first by-product to be recovered is silica. The leaching process dissolves all of the soluble parts of the clay into chloride form, but the silica falls to the bottom as it is insoluble. The next product to be recovered is the alumina. The aluminum chloride is precipitated out and it begins to crystallize. The alumina is harvested during the calcination step. Approximately 60% of the HCl is recycled during the calcination step as gaseous HCl is captured. The “liquor” or “spent acid” then goes through a number of acid recovery systems, which result in a variety of by-products such as hematite, rare metals and earths, and magnesium oxide. In the exhibit below, we present a simplified block diagram of Orbite’s process to extract SGA.
• Clay Preparation Plant (CPP). This step prepares grinds, dries, and classifies the clay ahead of the leaching process.
• Acid Leaching Plant (ALP). This process separates out the silica and crystalizes aluminum chloride by bubbling concentrated HCl gas from the recovery system.
• Alumina Calcining Plant (ACP). This step converts the aluminum chloride into oxide form, which is alumina, while recycling nearly 60% of the HCl.
• Acid Recovery Plant (ARP). This section of the plant recovers the remaining HCl and at the same time concentrates and recovers other by-products, such as hematite, rare metals and earths, and magnesium oxide.

Page 18 of 70
ORBITE ALUMINAE INC. (TSX: ORT) Company Note - September 17, 2012
Exhibit 15: SGA refining produces a number of by-products are harvested in Orbite’s acid recovery loop.
Source: Orbite NI 43-101. The leaching process converts metals into chloride form and separates the silica. One of the general principles of Orbite’s process is that it applies high temperature and pressure leaching to dissolve all of the soluble metals and elements of the clay into chloride. The metals start in an oxidized state, i.e. Al2O3, but the high temperature, pressurized HCl, and other reaction conditions convert the metals into a chloride form, i.e. AlCl3. Orbite has set up this reaction so that silica is insoluble and falls out. The equations below provide a sense for the chemical process by metal:
• Al2O3 + 6 HCl � 2 AlCl3 + 3 H2O; • Fe2O3 + 6 HCl � 2 FeCl3 + 3 H2O; • MgO + 2 HCl � 1 MgCl2 + H2O; • Sc2O3 + 6 HCl � 2 ScCl3 + 3 H2O; … etc.
Alumina is separated next; 60% of HCl is recovered during alumina production. After leaching and removal of silica, the aluminum chloride is separated from the rest of the solution by the bubbling of highly concentrated HCl gas, which given the operating conditions renders the AlCl3 insoluble and the AlCl3 begins to crystalize. SMS-Siemag, one of Orbite’s engineering companies, has successfully tested this process in a pilot facility in Vienna, Austria. The tests were run continuously for two months and yielded more than 95% recovery of the Al2O3. Once crystallized, the AlCl3 is converted into alumina (or Al2O3) during the calcination step. The calcination step is also the most important acid recovery loop as it recovers ~60% of the HCl. The calcination takes place in a large circulating fluid bed, which is proven technology, employing Outotec technology. This thermal energy requirements of this step are approximately 15 GJ/tonne of Al2O3. The following equation captures the calcination reaction:
• 2 (AlCl3 * 6H2O) � 1 Al2O3 + 6 HCl + 9 H2O.

Page 19 of 70
ORBITE ALUMINAE INC. (TSX: ORT) Company Note - September 17, 2012
Hematite is recovered third with an additional 30% of HCl recycled. Hematite is separated via low temperature hydrolysis (separation of chemical bonds by the addition of water). During this process, HCl is also released and recycled. This process of separating hematite and recycling HCl has been proven by SMS-Siemag. SMS-Siemag has developed a similar large scale plant currently operating at a Thyssen Krupp facility in Mobile, AL. The thermal energy requirements for this step are estimated to be 14 GJ/tonne of Al2O3.
The equation below highlights the hematite separation and HCl recovery: • 2 FeCl3 + 3 H2O � Fe2O3 + 6 HCl.
Rare metals and earths are concentrated and separated using known processes. As the hematite is separated, there is an opportunity to concentrate rare metals and earths. Orbite expects to separate the rare metals and earths using a proven set of technologies known as countercurrent solvent extraction. When management released its NI 43-101, it expected to capture ~75% of the rare metals and earths. In a recent press release, Orbite now anticipates achieving an 85% recovery rate. Finally, the remaining acid is recovered along with magnesium and other oxides. Magnesium and remaining oxides are separated via a pyrohydrolysis step. The technologies required here are very well known and off-the-shelf equipment is available. The thermal energy requirement of this step is one to two GJ/tonne Al2O3. The following equations represent the reactions that take place during the pyrohydrolysis step:
• MgCl2 + H2O � MgO + 2 HCl; • Me-Cl2 + H2O � Me-O + n HCl.
Exhibit 16: 99.75% of the HCl used in Orbite’s alumina refining is recovered and reused.
~60% of HCl
recovered
~30% of HCl
recovered
~10% of HCl
recovered
Trace levels of
HCl recovered
Source: Orbite NI-43-101; ROTH Capital Partners.
Page 20 of 70
ORBITE ALUMINAE INC. (TSX: ORT) Company Note - September 17, 2012
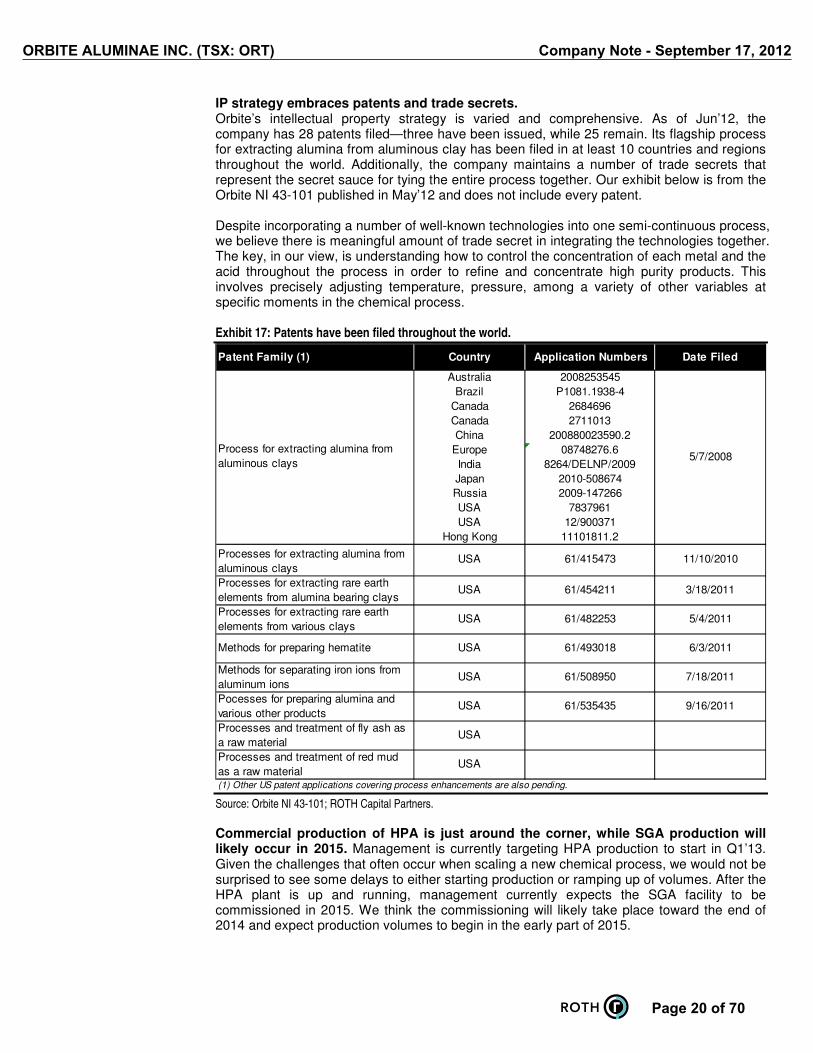
IP strategy embraces patents and trade secrets. Orbite’s intellectual property strategy is varied and comprehensive. As of Jun’12, the company has 28 patents filed—three have been issued, while 25 remain. Its flagship process for extracting alumina from aluminous clay has been filed in at least 10 countries and regions throughout the world. Additionally, the company maintains a number of trade secrets that represent the secret sauce for tying the entire process together. Our exhibit below is from the Orbite NI 43-101 published in May’12 and does not include every patent. Despite incorporating a number of well-known technologies into one semi-continuous process, we believe there is meaningful amount of trade secret in integrating the technologies together. The key, in our view, is understanding how to control the concentration of each metal and the acid throughout the process in order to refine and concentrate high purity products. This involves precisely adjusting temperature, pressure, among a variety of other variables at specific moments in the chemical process. Exhibit 17: Patents have been filed throughout the world.
Patent Family (1) Country Application Numbers Date Filed
Australia 2008253545Brazil P1081.1938-4
Canada 2684696Canada 2711013China 200880023590.2
Europe 08748276.6India 8264/DELNP/2009Japan 2010-508674Russia 2009-147266USA 7837961USA 12/900371
Hong Kong 11101811.2
Processes and treatment of fly ash as a raw material
USA
Processes and treatment of red mud as a raw material
USA
(1) Other US patent applications covering process enhancements are also pending.
Process for extracting alumina from aluminous clays
5/7/2008
Processes for extracting alumina from aluminous clays
USA 61/415473 11/10/2010
Processes for extracting rare earth elements from alumina bearing clays
USA 61/454211 3/18/2011
Processes for extracting rare earth elements from various clays
USA 61/482253 5/4/2011
Pocesses for preparing alumina and various other products
USA 61/535435 9/16/2011
Methods for preparing hematite USA 61/493018 6/3/2011
Methods for separating iron ions from aluminum ions
USA 61/508950 7/18/2011
Source: Orbite NI 43-101; ROTH Capital Partners. Commercial production of HPA is just around the corner, while SGA production will likely occur in 2015. Management is currently targeting HPA production to start in Q1’13. Given the challenges that often occur when scaling a new chemical process, we would not be surprised to see some delays to either starting production or ramping up of volumes. After the HPA plant is up and running, management currently expects the SGA facility to be commissioned in 2015. We think the commissioning will likely take place toward the end of 2014 and expect production volumes to begin in the early part of 2015.

Page 21 of 70
ORBITE ALUMINAE INC. (TSX: ORT) Company Note - September 17, 2012
Exhibit 18: Orbite expects production to start at the HPA facility in early 2013. ORT Development Schedule Status
Q1 Q2 Q3 Q4 Q1 Q2 Q3 Q4 Q1 Q2 Q3 Q4 Q1 Q2 Q3 Q4 Q1 Q2 Q3 Q4
Produced first tonne of 4N HPA Completed Feb'11
Aluminum produced and tested from SGA Completed May'11
Extracted SGA from bauxite Completed Jul'12
SGA facility NI 43-101 Completed May'12
HPA facility construction permit Completed May'12
Produced first 5N HPA Completed Jun'12
Process testing on red mud Completed Jun'12
HPA facility (1.5k tpa of HPA) Exp Start Q1'13 Construction --> Production --->
SGA facility feasibility study Exp Q1/Q2'13
SGA facility (540k tpa of SGA) Exp Start Q1'15 Construction ---> Production --->
2011 2012 2013 2014 2015
Source: Orbite; ROTH Capital Partners estimates.
Bayer vs. Orbite: Orbite wins The Bayer process is the traditional method of refining bauxite into alumina. Currently, bauxite is used as the raw feedstock in alumina production due to its high Al2O3
grade, and low silica content. In the Bayer process, four tonnes of crushed bauxite are required to produce two tonnes of Al2O3. Bauxite typically contains ~30-55% alumina. In order to extract alumina from bauxite, refineries traditionally use what’s known as the the Bayer process, a 125-year old method comprising four basic steps: (1) Digestion – ground bauxite is mixed with sodium hydroxide (NaOH) and heated in large pressurized tanks; (2) Clarification – the resulting mixture, containing sodium aluminate, is then passed through a filtration system and cooled; (3) Precipitation – the remaining solution collects and solidifies into aluminum hydroxide crystals; (4) Calcination – once the crystals reach a certain size they are passed to the final stage, which involves heating the collected crystals to more than 960°C to remove all water, leaving only alumina. While the Bayer process produces alumina in an efficient manner, the primary drawback is that it produces a toxic byproduct known as bauxite residue (red mud). Exhibit 19: The conventional Bayer process produces alumina along with a toxic byproduct: red mud.
Source: Redmud.org (Accessed: Jul’12).
Although Orbite’s process consumes more energy than the Bayer process… While Orbite’s technology recycles and reuses its hydrochloric acid, it comes at a relatively high cost of energy. Management, in its NI 43-101, indicated that its process needs 34 GJ/tonne of SGA produced, compared with the Bayer process of 14 GJ/tonne. The high intensity of energy required is primarily driven by the alumina calcination step (15GJ/tonne) and the hematite recovery step (14 GJ/tonne).

Page 22 of 70
ORBITE ALUMINAE INC. (TSX: ORT) Company Note - September 17, 2012
Exhibit 20: Orbite’s energy consumption is more than double the Bayer process.
Energy Consumption
Bayer Process vs. Orbite
Tonnes
produced (000s)GJ/tonne
Africa & Asia (Except China) 6,836 16NA 5,344 12SA 13,809 10Oceania 20,124 11Europe 10,242 15China 28,955 19Global weighted average energy consumption 14
vs. Projected Orbite energy consumption ~33 GJ
…which is more than double (+136%) the global average energy consumption.
Source: Orbite NI 43-101; International Aluminum Institute; ROTH Capital Partners. …we estimate overall production costs are 20% less than the Bayer process. Orbite’s NI 43-101 highlights operating costs of $210/tonne. As of Q1’12, the global average SGA production cost was $265/tonne. Thus, Orbite’s targeted $210/tonne cost structure is approximately 20% better. Moreover, we estimate that Orbite’s cost structure is in the top quintile of global alumina producers. Exhibit 21: Orbite’s cost structure is approximately 20% below the global alumina cost curve.
Global SGA Cost Curve
Orbite SGA Cost Structure: $210/tonne
Global Average: $265/tonne
Source: Orbite; CRU; Hydro (Q3’11, Oct’11); ROTH Capital Partners estimates.
Capital costs, however, are roughly the same between the two. Orbite’s capital costs are estimated to be $500mn in its NI 43-101. Management qualified the estimate and indicated that this projection could be +/-30%. Using the high end of this estimate, we arrive at $650mn for a unit capex of $1,200/tonne. For the Bayer process, unit capex ranges between $900 and $1,500/tonne depending on technology and geographic location.

Page 23 of 70
ORBITE ALUMINAE INC. (TSX: ORT) Company Note - September 17, 2012
INDUSTRY OVERVIEW Orbite’s unique refining technology allows the company to produce a variety of outputs that serve a diverse array of end markets. The exhibit below highlights Orbite’s various outputs: (A) HPA, (B) SGA, (C) Rare metals and earths, (D) Hematite, (E) Silica, and (F) Magnesium oxide. We will cover each product in individual sections below. Exhibit 22: Orbite’s process provides for a variety of products serving diverse end markets.
• HPA PlantNameplate: ~1.5k tpa vs. WW demand of ~10k tpaCapex: ~$40mnExpected start: Q1’13
• SGA PlantNameplate: 540,000 tpaCapex: ~$650mn, ~$1,200/tonneCost structure: ~$210/tonne vs. industry avg ~$265/tonneExpected start: Q1’15
ORT Business Model: Overview
ResourceInputs
• Grande-Vallée Clay>1bn tonnes
• Red Mud3bn tonnes WW120mn tonnes produced annually
• Low Grade BauxiteConsidered low grade if silica content exceeds 10%
• Fly Ash>300mn tpa WWAlumina content between 17-26%
• Other ResourcesNephelineKaolin (20-30% alumina content)
Refining Technology:HPA and SGA
Revenue Sources/Outputs
• HPA: 1.5k tpaBy Products:
Rare metals & earths: tpa TBD
• SGA: 540k tpaByproducts:
Rare metals & earths: 1k tpaFe2O3:190k tpaSiO2: 1.2mn tpaMgO: 28k tpaMixed oxides: 104k tpa
• Licensing RevenuesSGARare earth processing
ORT s alumina (HPA & SGA’ refining technology does not result in any toxic residue or
red mud
(A)
(B)
(C)(D)(E)(F)
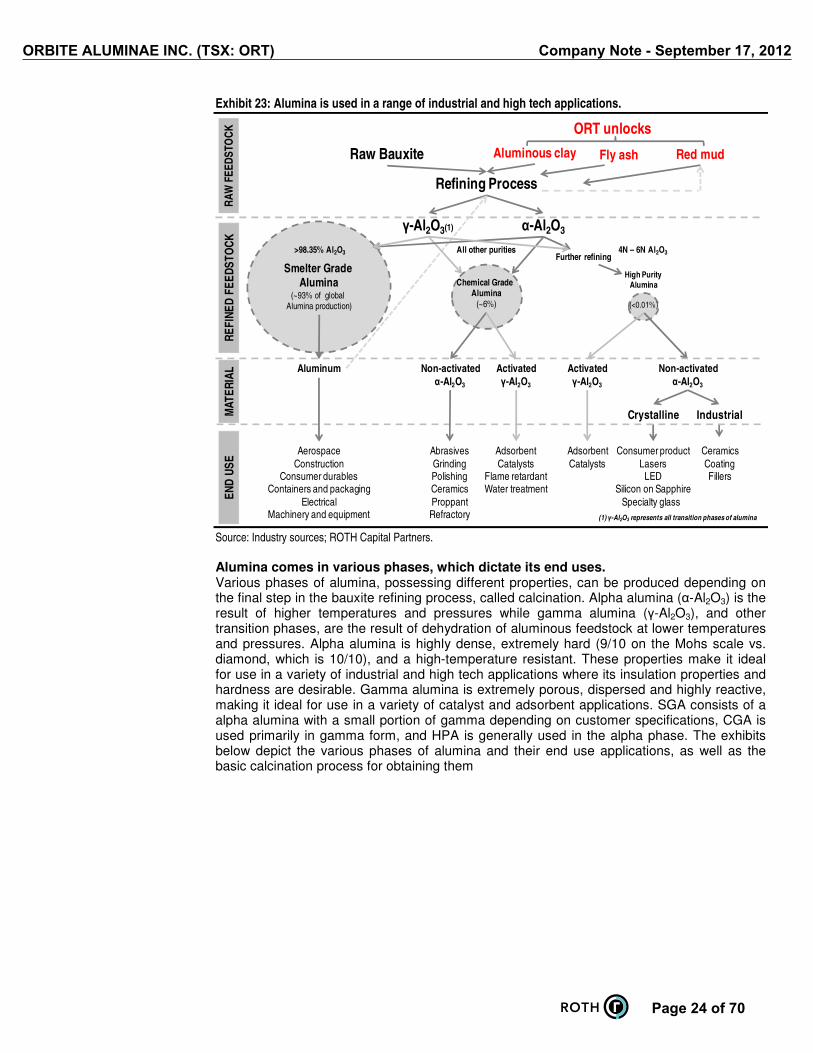
Source: Orbite; ROTH Capital Partners. Alumina (Al2O3) can be classified into three primary categories: HPA, SGA, and CGA. High purity alumina (HPA, >99.99% or 4N Al2O3) is a low volume, highly specialized form of alumina with range of industrial and high tech end uses, while smelter grade alumina (SGA, >98.4% Al2O3) is a high volume commodity used in the production of primary aluminum. Finally, chemical grade alumina (CGA, all other purities other than SGA and HPA) can be used on its own or mixed with other elements to produce a variety of materials used in industrial processes. In 2011, we estimate HPA comprised less than 0.01% of the global alumina supply, or about 10,000 tonnes. According to the International Aluminum Institute, SGA made up more than 93.6% of global production, while CGA comprised roughly 5.7%. Orbite can potentially disrupt the alumina industry. Orbite’s refining technology can produce SGA and HPA with little to no waste byproduct. Moreover, the company has the ability to process nonconventional aluminous resources such as clay, red mud, low grade bauxite, and fly ash, along with conventional raw feedstock like bauxite. The exhibit below highlights the variety of materials and material flows of alumina, from bauxite production to end uses.
Page 24 of 70
ORBITE ALUMINAE INC. (TSX: ORT) Company Note - September 17, 2012
Exhibit 23: Alumina is used in a range of industrial and high tech applications.
High Purity Alumina
(<0.01%)
Smelter Grade Alumina
(~93% of global Alumina production)
Chemical Grade Alumina
(~6%)
Raw Bauxite
Refining Process
Aluminum Non-activatedα-Al2O3
Crystalline Industrial
ORT unlocks
Aluminous clay Red mud
AdsorbentCatalysts
Flame retardantWater treatment
Consumer productLasers
LEDSilicon on Sapphire
Specialty glass
Non-activatedα-Al2O3
>98.35% Al2O3 4N – 6N Al2O3All other purities
AerospaceConstruction
Consumer durablesContainers and packaging
ElectricalMachinery and equipment
AbrasivesGrindingPolishingCeramicsProppantRefractory
Activatedγ-Al2O3
γ-Al2O3(1) α-Al2O3
CeramicsCoatingFillers
Further refining
(1) γ-Al2O3 represents all transition phases of alumina
RA
W F
EE
DS
TOC
KR
EF
INE
D F
EE
DS
TO
CK
EN
D U
SE
MA
TE
RIA
L Activatedγ-Al2O3
AdsorbentCatalysts
Fly ash
Source: Industry sources; ROTH Capital Partners. Alumina comes in various phases, which dictate its end uses. Various phases of alumina, possessing different properties, can be produced depending on the final step in the bauxite refining process, called calcination. Alpha alumina (α-Al2O3) is the result of higher temperatures and pressures while gamma alumina (γ-Al2O3), and other transition phases, are the result of dehydration of aluminous feedstock at lower temperatures and pressures. Alpha alumina is highly dense, extremely hard (9/10 on the Mohs scale vs. diamond, which is 10/10), and a high-temperature resistant. These properties make it ideal for use in a variety of industrial and high tech applications where its insulation properties and hardness are desirable. Gamma alumina is extremely porous, dispersed and highly reactive, making it ideal for use in a variety of catalyst and adsorbent applications. SGA consists of a alpha alumina with a small portion of gamma depending on customer specifications, CGA is used primarily in gamma form, and HPA is generally used in the alpha phase. The exhibits below depict the various phases of alumina and their end use applications, as well as the basic calcination process for obtaining them

Page 25 of 70
ORBITE ALUMINAE INC. (TSX: ORT) Company Note - September 17, 2012
Exhibit 24: Various phases of Al2O3 possess unique properties…
Activated Al2O3
Aluminous feedstock
Catalyst
PolishingGrindingRefractoryAbrasion resistance
Petroleum refineryAutomotive
Non-activated Al2O3
γ-Al2O3 (also χ, δ, η)
• Porous; • Highly dispersed; • Highly reactive
α-Al2O3 (also υ, θ)
• Highly dense; • Hard (9/10 on Mohs scale);• High temp resistant
Adsorbent
Petroleum crackingIndustrial gasFluoride treatmentAir purification
Synthetic CrystallineMaterial
Sapphire Ruby
Industrial Material
Infrared devicesConsumer product
LED waferSilicon on Sapphire GlassCeramics
CalcinationHigher temperature
and pressureLower temperature
and pressure
PH
AS
E &
PR
OP
ER
TIE
SE
ND
US
EM
AT
ER
IAL
CL
AS
SIF
ICA
TIO
N
Source: Industry sources; ROTH Capital Partners.
Exhibit 25: …which are derived during the calcination stage.
Source: Wefers and Misra (1987); Levin and Brandon (1998); Ruberto (2001).
(A) High Purity Alumina (HPA) HPA is low volume... HPA is generally defined as alumina that has been refined to a purity of 99.99% (4N) or 99.999% (5N) Al2O3. This compares with smelter grade alumina used in aluminum smelting of ~98.4%. Currently, HPA is commercially available in 4N and 5N purities, and is produced in extremely low volumes globally. Deliveries are quoted in denominations as low as 500 grams, but can take place in volumes exceeding several hundred tonnes depending on customer specifications and needs. We estimate roughly 10,000 tonnes of HPA were produced in 2011, less than 0.01% of overall alumina production. …but high value. Although HPA represents a small fraction of total production, it is considered the highest value segment of alumina by weight. HPA pricing varies considerably depending on volume, purity, grain size and other properties. Public pricing data shows a wide range from $10,000 to $500,0000/tonne. Based on industry sources, primary price quotations, information provided by Orbite, and our conservative pricing assumptions, we estimate 4N pricing to average $20,000/tonne, while 5N pricing is likely closer to $80,000/tonne. Orbite is poised to add 1,500 tpa in high quality HPA capacity to the ~10,000 tpa market. We expect Orbite to begin production by Q1’13, starting at a run rate of ~375 tpa, and eventually ramping to 1,500 tpa later in the year. At the full run rate of 1,500 tpa, this would place Orbite among the top five largest producers of HPA globally. Moreover, management expects to produce extremely high quality and consistent HPA primarily in the 4N to 5N range, with a smaller fraction comprised of 6N purity. According to management, consistency of production in HPA is critical as a number of suppliers currently produce varying purities of HPA on a “take it or leave it basis,” which leads to higher reject rates in end products like sapphire boules. Due to its expected low cost structure and high quality of production, Orbite management believes its HPA can garner gross margins of 50% or more, which we view as highly attractive.

Page 26 of 70
ORBITE ALUMINAE INC. (TSX: ORT) Company Note - September 17, 2012
Exhibit 26: Orbite’s pilot plant, located in Cap-Chat, Québec, is now being converted to the front-end of HPA plant.
Source: Orbite presentation (Aug’12).
Exhibit 27: Orbite is constructing this facility behind the pilot plant to house the leaching process.
Source: Orbite presentation (Aug’12).
We view three factors as critical to success in the low volume, highly specialized HPA industry… HPA producers include the ability to (1) produce high quality HPA products tailored specifically to customer needs on a consistent basis; (2) produce HPA at a low cost; and (3) access customers with growing demand profiles in high value end markets. The exhibit below lists, to our knowledge, the major producers of HPA, their capacities, and specialties. Exhibit 28: HPA industry players include major chemical conglomerates and smaller niche producers.
Company Specialty 2012E Capacity (1) Notes
Baikowski Group Technical ceramics; polishing; coatings; synthetic crystalline
NA Producing HPA via modified Bayer process since 1982
BASF Catalysts NA Primarily cites catalyst solutions on company website
Chalco Ceramics 2,000 Chinese alumina analyst from Asian Metals says production is ramping from ~1k tpa to 3k tpa in 2013
CoorsTek Synthetic crystalline NA Most alumina capacity not HPA according to spec sheets
Hebei Pengda Synthetic crystalline; ceramics; grinding; fluorescent powders
2,000 Company website claims HP is China's largest volume supplier of 4N and 5N HPA; 7,000 tpa in quoted capacity; in our view, this seems high given overall market of ~10k tpa and likely includes lower purities; we give full credit for the company's claims of 2,000 tpa of HPA for sapphire
Inframat Synthetic crystalline NA Quoting prices of ~$15,000/tonne of HPA at higher volumes
Jing Rui Nano Nano HPA 3,000 Presentations claim 3k tpa capacity, making Jing Rui the largest HPA supplier if true
Posco Synthetic crystalline 0 Ramping production in FY'13 to 2,000 tpa; 4N5 material, JV with KC, a sapphire production company in Korea; both companies making a joint investment of 50bn KRW
Sasol Catalysts; adsorbents NA Most alumina production cited on company website looks like CGA, not HPA
Sumitomo Synthetic crystalline; ceramics; grinding
2,600 Often quoted as one of the largest HPA producers in the world; a number of white papers written by Sumitomo scientists on HPA applications
UOP (Honeywell) Adsorbents; catalysts NA UOP is a Honeywell company primarily focused on catalyst and adsorbent markets; reliable information is unavailable on purity levels
Zibo Xinmeiyu Synthetic crystalline; substrates NA Website claims to produce 5N5 HPA for a variety of applications
(1) NA used if reliable source of capacity information unavailable
Source: Company filings, press releases and websites; ROTH Capital Partners.

Page 27 of 70
ORBITE ALUMINAE INC. (TSX: ORT) Company Note - September 17, 2012
…which Orbite is currently executing on with its HPA business. The company has already signed a letter of intent with Amalgamet Canada, the Canadian subsidiary of Almalgameted Metal Corporation, a global supplier of non-ferrous metals and other products. Management expects to produce high quality HPA at one of the lowest cost structures in the industry, with gross margins of more than 50%. Finally, the company is focusing its HPA product toward high growth potential end markets like sapphire boule production, which produces components that go into LEDs and RF chips. While execution on these strategies remains, preliminary efforts by management appear promising. High purity alumina (HPA) supply is difficult to pin down. In order to quantify the market, we took a bottom-up approach to estimating HPA production capacity. We believe demand tracks closely with production capacity given the low volume nature of the industry. Using publicly available information and speaking with industry sources, we estimate the size of HPA demand to be 12,500 tpa by YE’12. The chart below summarizes major suppliers of HPA by market share. We estimate that four major suppliers provide nearly 80% of the HPA supply. The remainder is marked as unknown, although we list several companies in our previous exhibit that likely contribute to that figure. Exhibit 29: We estimate that the top four HPA suppliers represent ~70% of global supply.
Chalco16%
Habei Pengda19%
Jing Rui Nano24%
Sumitomo20%
Unkown24%
2012E HPA CapacityTotal = ~12,500 tonnes
Source: Company press releases, websites, and filings; ROTH estimates. HPA demand growth will likely come from a subset of high tech end uses. It is difficult to quantify end market demand due to the lack of public data, but our discussions with industry sources suggest a large majority of HPA applications utilize non-activated alumina. We estimate more than 90% of all HPA demand is for α-Al2O3, and the majority of this is used in synthetic crystalline material for high tech applications like LEDs, semiconductors, silicon on sapphire in telecom applications, and optical lasers.

Page 28 of 70
ORBITE ALUMINAE INC. (TSX: ORT) Company Note - September 17, 2012
Exhibit 30: HPA is a critical building block in a number of industrial and high tech materials.
Activated Al2O3
HPA (4N, 5N, 6N)
Catalyst
PH
AS
E &
PR
OP
ER
TIE
SE
ND
US
EM
AT
ER
IAL
CeramicsCoatingsFillers
Petroleum refineryAutomotive
CL
AS
SIF
ICA
TIO
N
Non-activated Al2O3
γ-Al2O3 (also χ, δ, η)
• Porous; • Highly dispersed; • Highly reactive
α-Al2O3 (also υ, θ)
• Highly dense; • Hard (9/10 on Mohs scale);• High temp resistant
Adsorbent
Petroleum crackingIndustrial gas
Fluoride treatmentAir purification
Synthetic CrystallineMaterial
Sapphire Ruby
Industrial Material
Infrared devicesConsumer product
LED waferSilicon on Sapphire
GlassCeramics
Likely drivers of demand growth
Source: Industry sources; ROTH Capital Partners. Sapphire end markets are poised to experience significant growth in the medium term. We believe synthetic sapphire holds a great deal of potential in high tech applications and will likely increase in prevalence, resulting in an increase in demand for quality HPA. Sapphire is used in a number of high-tech applications, including micro-sensors, semiconductors and specialty glass. Sapphire has two important properties that make it desirable for use: (1) it is extremely hard, which makes it shatter and scratch-resistant and (2) it is an excellent electrical insulator, which makes it ideal as a substrate for use with semiconductors. One of the fastest growing segments incorporating sapphire technology is LED wafers.

Page 29 of 70
ORBITE ALUMINAE INC. (TSX: ORT) Company Note - September 17, 2012
Exhibit 31: HPA is the basic material in sapphire boules, which are used in LED applications.
Source: Rubicon (2009). Several segments of the LED market are set to grow rapidly over the next five years. A large majority of LEDs (industry estimates range to greater than 90%) currently incorporate sapphire wafers with a thin layer of semiconductor material, such as silicon or gallium-nitride, to produce light. LEDs have seen rapid growth trajectories, with early growth coming primarily from mobile devices and backlighting applications for televisions and computing displays. As growth in these applications levels off to more normal run rates, several major segments of the LED market are still forecast to grow at high CAGRs over the coming five years. According to Strategies Unlimited, the lighting segment is forecast to grow at nearly a 20% CAGR through 2016. LED pricing continues to fall on increased efficiencies and ramping production, which will likely spur increasing demand for LEDs in a range of applications, which in turn, increases demand for sapphire and alumina. Exhibit 32: LED penetration is poised for continued strong growth in lighting and automotive applications.
Mobile23%
Backlight TV/Monitor24%
Lighting16%
Sign11%
Auto9%
Others17%
Revenue from Packaged LEDs by Application, 2011Total: $12.5bn
Source: Strategies Unlimited (2012); ROTH Capital Partners.

Page 30 of 70
ORBITE ALUMINAE INC. (TSX: ORT) Company Note - September 17, 2012
Orbite is well-positioned to capitalize on strong demand for sapphire from LEDs. As LED technology is adopted into more applications, wafers have grown larger. Two-inch sapphire wafers incorporated into LEDs have become the industry standard, while there are increasing uses of four, six and eight-inch wafers. As the diameter of wafers grows, the thickness must grow as well, requiring more sapphire material, and thus, more alumina. We believe that Orbite is well-positioned to capitalize on this trend of larger sapphire substrates being incorporated into more LED technologies.
(B) Smelter Grade Alumina (SGA) SGA is the primary refined feedstock used in the production of aluminum (Al). Over 90% of the world’s production of alumina goes into producing SGA, by far the largest end use among all forms of alumina. Al can be broken down into two subcomponents of production: primary and secondary. Primary Al production refers to the smelting of SGA into Al. Secondary production consists of recycling of aluminum to produce new products. We estimate roughly 80% of the global aluminum supply is created from primary production annually vs. 20% from recycling and alloy additives. Smelter grade alumina (SGA) is used to produce primary aluminum. After bauxite is refined into an alumina with a purity of at least 98.4%, the material is then taken to a smelter to be converted to aluminum. The most common process for converting SGA to aluminum is called the Hall-Heroult process. During the process, alumina is electrolytically reduced by dissolving the material in a 1,000 degrees Celsius cryolite bath and reacting it with carbon. Approximately two tonnes of alumina are put through this process for every tonne of aluminum produced. Exhibit 33: Four tonnes of bauxite produce two tonnes of SGA which produces one tonne of Al.
• Bauxite• Aluminous clay
• Rolled• Cast• Extruded
Material/Input
• 4 tonnes Bauxite• 2 tonnes Alumina
• Bauxite is processed into alumina via the Bayer process
• The resulting SGA is shipped to an aluminum smelter
• Molten SGA is dissolved in a nearly 1,000° C cryolite bath
• Large amounts of electrical current are passed through the material until it hardens to become Aluminum
• 2 tonnes SGA• 13,000 kWh electricity
• SGA• Electricity
• 1 tonne Al
• The resulting Aluminum material can be further machined or formed to create Al that is usable in a range of end products
Output
Quantity
Process
• Alumina• Red mud
• Aluminum• Emissions
(PFCs and CO2)
Raw Materials&
Feedstock
Production Flow
Al Smelting
AlProcessing
• Aluminum
Source: The Aluminum Association; ROTH Capital Partners.

Page 31 of 70
ORBITE ALUMINAE INC. (TSX: ORT) Company Note - September 17, 2012
SGA production is generally characterized by high capex, low operating margins, and thus, low return on capital. We estimate alumina facilities in Asia to cost roughly $900/tonne of installed capacity, while Europe and North American alumina plants cost $1,000-1,500/tonne. Orbite expects its SGA facility to cost $1,000–1,200/tonne, putting the company inline with industry standards. Given the commoditized nature of SGA, producers tend to compete on the basis of price, which, in turn, generally erodes operating and cash flow margins. We estimate 2011 EBITDA for Alcoa and Rio Tinto to be $72/tonne and $39/tonne of production respectively, while Orbite could produce SGA at an EBITDA of ~$100/tonne. This would place industry EBITDA margins in the 10-20% range vs. Orbite of ~30%. Considering just SGA revenues, we expect Orbite to produce superior return on capital vs. average alumina producers. In the exhibit below, we estimated ROC for Alcoa and Rio Tinto’s alumina divisions and compared them to Orbite’s potential ROC using management cost structure targets and capex of $1,200/tonne. Our back-of-the-envelope calculations suggest that SGA is a low-to-mid single digit return on capital business at best for Alcoa and Rio Tinto. Excluding additional by-products from its SGA plant, we expect Orbite to generate better performance of mid-to-high single digit returns. Adding by-product revenues would boost Orbite’s ROC metrics substantially. Exhibit 34: Back-of-the-envelope calculations suggest Orbite can generate superior ROC from SGA only. Return on Capital Metrics Alumina Production (FY'11) EBITDA/tonne ROTHe capex/tonne ROCUnits tonnes (1,000s) USD/tonne USD/tonne %
Alcoa 16,200 $72 $1,200 6.0%
Rio Tinto Alcan 9,200 $39 $1,200 3.3%vs.
Orbite (1) NA $100 $1,200 8.3%(1) Orbite ROC metrics based on management target of $210/tonne cost of production and ROTHe opex 15% of sales and D&A 10% of sales
Source: Alcoa FY’11 10K; Rio Tinto FY’11 10K; Hydro presentation (Aug’12); ROTH estimates.
Aluminum producers tend to integrate alumina into their production… The exhibit below shows the 2011 production of major western producers of alumina and aluminum. High-volume players in the industry tend to be vertically integrated, supplying the majority of their SGA needs in-house, while small to medium sized aluminum producers must procure alumina from outside sources. Exhibit 35: Most major western Al producers are vertically integrated.
8,100
4,600
3,800
3,100
2,000
3,500
3,900 4,100
2,000
1,200 1,300
900 700
500
0
1,000
2,000
3,000
4,000
5,000
6,000
7,000
8,000
9,000
Alcoa Rio TintoAlcan
UC Rusal Norsk Hydro BHP Billiton Dubal AluminumBahrain
Century Vedanta
ton
nes
(1,0
00s)
Production in Al Equivalents ex China, 2011
Alumina Aluminum
Source: Hydro presentation (Aug’12); ROTH Capital Partners.

Page 32 of 70
ORBITE ALUMINAE INC. (TSX: ORT) Company Note - September 17, 2012
…due to the significant role alumina plays in the cost structure of Al production. It is common for major aluminum producers to vertically integrate due to the significant role alumina plays in aluminum production costs. The exhibit below shows a basic primary aluminum cost structure broken out by five categories. At 36% of costs, alumina plays a material role in determining the profitability of Al smelters. Exhibit 36: Alumina makes up more than 35% of the cost of production for Al smelters.
Alumina36%
Energy26%
Raw Material20%
Labor6%
Other Costs12%
Primary Aluminum Cost Structure
(1) Data for primary Al production is the average of Alcoa and Rusal
Alumina represents more than 1/3of the cost of Al production.
Source: Bloomberg; ROTH Capital Partners. Low cost + proximity = Orbite advantage vs. incumbents. We believe Orbite’s low cost, combined with its proximity to several Al smelters will result in strong demand for the company’s SGA product. Most, if not all, of the Al smelters located in Québec currently import alumina from distant countries like Jamaica, Brazil, and Australia, which we believe adds a non-trivial amount to Al production costs. As a low cost producer ($210/tonne targeted cost structure vs. industry average of $265/tonne), within 1,000km of more than 7% of global Al production, we believe Orbite is poised to help drive increased margins at Al smelters in Québec. SGA pricing is currently ~$330/tonne, and typically sells for 15-20% of the LME spot price. Australian alumina pricing over the last five years suggests a somewhat wide range of $220-500/tonne. For conservatism, we model a long term SGA price of roughly $330/tonne, which is about 17.5% of Al pricing at $1,900/tonne. At this price, we expect Orbite to generate ~$175mn in annual revenues from its SGA at full production. Given its low cost structure and various by-products that enhance margins, we believe Orbite is poised to generate solid margins from its SGA unit. Primary Al smelters have historically contracted long term alumina supply based on a percentage of the price of Al on the London Metal Exchange (LME), generally 12-14%. In recent years, major alumina producers have supported a decoupling of alumina pricing from aluminum, arguing that contract pricing should be based on an alumina index. Due to this phenomenon, as more contracts come due, most industry analysts expect contract and spot prices to converge. We conducted our own analysis in the exhibit below, which displays spot pricing data for Al from the LME and the Australian alumina export price index, and suggests that alumina is typically sold at 15-20% of the price of Al.

Page 33 of 70
ORBITE ALUMINAE INC. (TSX: ORT) Company Note - September 17, 2012
Exhibit 37: SGA has historically sold for ~15-20% of the LME Al spot price.
10%
15%
20%
25%
30%
0
500
1,000
1,500
2,000
2,500
3,000
3,500
Sep
-07
No
v-0
7
Jan
-08
Mar
-08
May
-08
Jul-
08
Sep
-08
No
v-0
8
Jan
-09
Mar
-09
May
-09
Jul-
09
Sep
-09
No
v-0
9
Jan
-10
Mar
-10
May
-10
Jul-
10
Sep
-10
No
v-1
0
Jan
-11
Mar
-11
May
-11
Jul-
11
Sep
-11
No
v-1
1
Jan
-12
Mar
-12
May
-12
Jul-
12
Alu
min
a/A
l
US
D/to
nn
e
Al and Al2O3 Market Pricing
LME Al Spot Price Australian Alumina (98.5%min) Al2O3/Al
Alumina pricing stays withina range of ~15-20% of the LME Al spot price
Source: Asian Metal; Bloomberg; ROTH Capital Partners.
SGA demand is largely a function of Al production at a 2:1 alumina to Al ratio. For more than 25 years, the alumina-to-aluminum production ratio has remained at a relatively constant two tonnes of alumina input for every tonne of aluminum output. The exhibit below depicts annual alumina and aluminum production figures from the International Aluminum Institute. From 1985 onward, aluminum smelters have taken approximately two tonnes of alumina to create one tonne of aluminum. SGA is a direct feedstock used only in the production of Al, and thus, increasing Al consumption is a direct driver of alumina demand. Exhibit 38: Since 1985, the alumina/aluminum production ratio has remained stable at 2:1.
1.0
1.5
2.0
2.5
3.0
0
10,000
20,000
30,000
40,000
50,000
60,000
70,000
80,000
90,000
100,000
FY'74 FY'75 FY'76 FY'77 FY'78 FY'79 FY'80 FY'81 FY'82 FY'83 FY'84 FY'85 FY'86 FY'87 FY'88 FY'89 FY'90 FY'91 FY'92 FY'93 FY'94 FY'95 FY'96 FY'97 FY'98 FY'99 FY'00 FY'01 FY'02 FY'03 FY'04 FY'05 FY'06 FY'07 FY'08 FY'09 FY'10 FY'11
Alu
min
a/A
lum
inu
m R
atio
ton
nes
(1,
000s
)
Alumina/Aluminum Historical Production
Primary Aluminum production Smelter grade alumina Alumina/Aluminum Ratio
Source: International Aluminum Institute; ROTH Capital Partners.
We see demand for Orbite’s technology in emerging markets, where Al growth is strongest. Al demand in the coming decades will likely be driven by emerging markets. Fast developing nations like Brazil, Russia, India, and China are building out their Al industries in

Page 34 of 70
ORBITE ALUMINAE INC. (TSX: ORT) Company Note - September 17, 2012
order to meet ramping demand for the product in a variety of end uses. These countries are generally interested in building out primary sources of domestic Al production, at a low cost. This means low cost domestic sources of alumina will likely be desirable to supplement primary Al capacity. Orbite’s technology, which can produce SGA and value-added by-products from a variety of aluminous resources, without hazardous red mud, will likely be attractive in developing nations. Moderate overall growth in Al demand over the next 15 years masks higher growth in emerging markets, a positive for Orbite. Over the medium to long term, global demand for Al will likely grow at a steady CAGR of 4.2%. This consistent growth, however, masks some important phenomena behind growth in Al demand that are notable: (1) GDP growth in emerging markets will be the primary driver of aluminum demand; and (2) the growth in aluminum demand from emerging markets will also increase demand on primary production, in turn, increasing demand for alumina. We view both of these trends as positives for Orbite. Exhibit 39: Al demand is expected to grow at a 4.2% CAGR from 2006 through 2025.
0
20,000
40,000
60,000
80,000
100,000
120,000
140,000
2006 2015E 2020E 2025E
Al t
on
nes
(1,0
00s)
Global Al Demand (2006-2025) (1)
Twenty Most Populous Countries RoW
119,000
91,900
58,70054,000
Al demand grows at a 4.2% CAGRfrom 2006 through 2025
(1) Includes both primary and secondary Al
Source: USGS (2010); ROTH estimates.
Exhibit 40: Emerging markets will likely deliver >8% CAGRs…
0
10,000
20,000
30,000
40,000
50,000
60,000
2006 2015E 2020E 2025E
Al t
on
nes
(1,0
00s)
Emerging Market Al Demand
Brazil Russia India China
11,820
17,976
38,100
53,160
8.2% CAGRfrom 2006-2025
Source: USGS; ROTH Capital Partners.
Exhibit 41: …while developed market Al demand remains flat .
0
10,000
20,000
30,000
40,000
50,000
60,000
2006 2015E 2020E 2025E
Al t
on
nes
(1,0
00s)
Developed Market Al Demand
US Germany Japan
15,180 15,750 16,180 16,480
0.4% CAGRfrom 2006-2025
Source: USGS; ROTH Capital Partners.
Orbite’s clean alumina refining technology has an inherent advantage in developing countries. With a technology capable of processing low grade aluminous resources while producing no hazardous red mud by-product, we believe Orbite possesses a critical advantage vs. incumbents when it comes to building out Al and alumina production capacity

Page 35 of 70
ORBITE ALUMINAE INC. (TSX: ORT) Company Note - September 17, 2012
in developing nations. Orbite is demonstrating this advantage, signing MoUs with potential partners RUSAL (the world’s largest Al producer headquartered in Russia), and Nalco (India’s largest aluminum producer). We believe that as greater demand for alumina in emerging markets kicks in, the advantages of Orbite’s refining technology will become even more apparent to countries looking to develop sustainable domestic Al industries. Securing a reliable source of alumina for primary Al production is critical to these markets, and Orbite’s technology is capable of processing a variety of low grade aluminous resources to meet this demand. Why is demand for Al growing faster in emerging markets? Al consumption tends to increase as GDP per capita grows, driving increased demand. As developing nations like Brazil, Russia, India and China continue to grow, their consumption of Al on a per capita basis is likely to follow a particular growth pattern. The chart below depicts GDP purchasing power and 2006 Al consumption, both on a per capita basis. Al consumption generally follows a logistic regression pattern, beginning with low consumption at lower levels of GDP per capita, but increasing rapidly as income grows, and eventually capping out just above 30kg/capita. For simplicity, we fit a linear regression line to the data to demonstrate the high correlation between the two variables. Note that the R-squared is 91%, demonstrating that GDP per capita is highly explanatory of Al consumption. Exhibit 42: Actual production demonstrates that GDP/capita is highly explanatory of Al consumption.
R² = 0.91
0.0
5.0
10.0
15.0
20.0
25.0
30.0
35.0
0 5,000 10,000 15,000 20,000 25,000 30,000 35,000 40,000 45,000
Al c
on
sum
pti
on
/cap
ita
GDP purchasing power per capita
2006 Al Consumption and GDP per Capita
Germany U.S.
China
Japan
France
Russia
India Brazil
Thailand
Turkey
Source: USGS (2010); ROTH Capital Partners.
Why will emerging markets likely demand more Al from primary production? Developing nations tend to utilize Al in longer life-cycle applications like infrastructure projects (electrical grid projects can last more than 20 years) and construction (in-service terms for buildings can be greater than 30 years), decreasing the availability of scrap Al for recycling. A significant amount of recycled Al comes from shorter lifespan end uses like packaging and transportation. This means that developing nations that demand the most Al will also likely soak up a significant amount from primary sources, generating more demand for alumina.

Page 36 of 70
ORBITE ALUMINAE INC. (TSX: ORT) Company Note - September 17, 2012
Exhibit 43: China uses Al in longer lifecycle applications…
Construction40%
Durable goods11%
Electrical12%
Machinery and equipment
8%
Packaging9%
Transportation18%
Other2%
China Al Consumption by End Use
Source: USGS (2011); ROTH Capital Partners.
Exhibit 44: …while the U.S. has a vast feedstock of secondary Al.
Construction12%
Durable goods
7%
Electrical8%
Packaging27%
Transportation34%
Other4%
US Al Consumption by End Use
Machinery8%
Source: USGS (2011); ROTH Capital Partners.
(C) Rare Metals & Rare Earths Orbite is poised to introduce a new supply of rare metals and rare earth oxides that are critical to a number of applications. Due to diverse metallurgical, electrical, magnetic, catalytic, and chemical properties, rare metals and earths are used as essential building blocks in many high technology components and as process-enablers in industrial applications. Rare metals, such as scandium (Sc) and gallium (Ga), often occur in deposits with rare earths, and are produced in extremely low quantities on a global basis. Sc can be incorporated into Al material to create high-strength alloys, while Ga is used in integrated circuits and semiconductor devices. Permanent magnets made from rare earths help run motors in electric vehicles and generate electricity in wind turbines, while fluid cracking catalysts incorporate rare earths in a variety of catalytic applications. For several of these elements, especially rare metals, Orbite will likely be one of the few primary global suppliers. In our view, with over 100 tonnes of rare metals being added to the global supply, Orbite is set to unlock a significant amount of pent up demand for these valuable materials. Scandium At just a 0.1% to 0.5% alloy mix, scandium can increase the strength of Al by 2-5x… When alloyed with Al, Sc can increase the strength of the aluminum alloy by 2-5x. Strengthened Sc-Al alloys are primarily used in aerospace and military applications. In fact, one of the first documented uses of Sc-Al alloys was for Russian military submarine-launched ballistic missiles. Sc-Al alloy was used in the nose cone of these missiles to allow them to penetrate thick polar ice-caps without incurring damage. Additionally, Sc can improve the integrity in welded Al structures, by eliminating excessive grain growth that occurs when welding Al components. This strengthens the bond between joined Al materials, making Sc-Al alloys useful in a number of sectors that utilize welded Al, such as the automotive industry. …though only 400kg is produced each year… The challenge, however, has historically been a lack of access to Sc supply. Information on supply is inconsistent, but Sc supplier Skyspring indicates that only 400kg of Sc production occurs each year. According to Avalon Rare Metals (AVL), Sc oxide is currently produced in extremely low volumes of 4-8 tpa. In fact, a large portion of the world’s supply of Sc is believed to come from stockpiles located in Russia that were generated during the Cold War. …Orbite can add ~48 tpa, potentially unleashing greater demand. According to Orbite, more than 100 patents involving uses for Sc have been filed in the last 50 years. By adding more than 10x the current market supply of Sc, we believe Orbite is

Page 37 of 70
ORBITE ALUMINAE INC. (TSX: ORT) Company Note - September 17, 2012
poised to unlock significant demand for Sc in automotive, aerospace, and military applications. A larger volume of high strength Sc-Al alloys utilized in automotive applications could help automakers significantly lighten vehicles, improving fuel efficiency, while adding strength to enhance safety. In the aerospace industry, Sc can improve the strength of aircraft fuselages by allowing for stronger welds without the need for metal treatment. The military could be interested in a variety of applications for Sc, including use in missiles, aircraft, and vehicles. Orbite could generate $72mn each year from scandium alone… At full production, we estimate an Orbite SGA plant could derive more than $72mn in revenue each year from Sc, representing over 40% of the revenue stream from rare metals and earths. We believe this estimate is reasonable, and even leaves room for upside if pricing stabilizes at a high level over the long term. Exhibit 45: Orbite could generate ~$72mn in revenue from scandium at 48 tpa.
Gallium14.1%
Scandium41.2%
Yttrium5.3%
Lanthanum4.4%
Cerium4.6%
Praseodymium2.3%
Neodymium8.0%
Samarium0.8%
Europium6.4%
Gadolinium0.9%
Dysprosium11.1%
Erbium0.8%
Orbite Rare Metals & Earths Revenue (FY'16)Total = $175mn
Only 48 tpa of Sccould result in>$72mn in annualrevenue for Orbite
Source: Asian Metal; ROTH Capital Partners. …and at just $1,500/kg vs. current prices of $4,000/kg. If Orbite is successful at introducing additional Sc supply of ~48 tpa (vs. 400kg of current supply), we believe there could be significant pricing pressure on the metal initially. As a result, we built some conservatism into our estimated long-term price of $1,500/kg. Even at this relatively modest price, Orbite can drive significant revenues with its production of Sc.

Page 38 of 70
ORBITE ALUMINAE INC. (TSX: ORT) Company Note - September 17, 2012
Exhibit 46: Sc can garner as much as $4,000/kg due to niche demand and the lack of global production.
-20%
0%
20%
40%
60%
80%
100%
120%
140%
160%
0
1000
2000
3000
4000
5000
6000
Nov
-10
Dec
-10
Jan-
11
Feb-
11
Mar
-11
Apr
-11
May
-11
Jun-
11
Jul-1
1
Aug
-11
Sep
-11
Oct
-11
Nov
-11
Dec
-11
Jan-
12
Feb-
12
Mar
-12
Apr
-12
May
-12
Jun-
12
Jul-1
2
Aug
-12
YoY
∆
Sc
Oxi
de,
US
D/k
g
Scandium (Sc) Oxide 99.5% minAverage Monthly Price, China (1)
Sc Oxide Px YoY ∆ (1) Sc oxide pricing converted from RMB to USD at 6.4 RMB/USD
Source: Asian Metal; ROTH Capital Partners.
Gallium Orbite is poised to become one of the world’s largest primary Ga suppliers. Producing 76 tpa at full capacity, Orbite would add roughly 35% to the 2011 primary supply of Ga. At a historically modest $325/kg, we estimate Orbite could derive roughly $25mn in revenue each year from Ga alone. This represents a significant portion of the revenue stream from rare metals and rare earths, and comes at virtually no incremental cost of production given cost estimates in Orbite’s NI 43-101. We expect Ga consumption to grow at a healthy rate given mobile device and LED demand growth. In the U.S. and other developed countries, it is estimated that roughly 60% of Ga is used in gallium-arsenide (GaAs) wafers that go into integrated circuits in mobile devices like smart phones and tablets. These devices are reliant on the power saving and amplification properties of GaAs integrated circuits. Gallium-Nitride (GaN) is a semiconductor material, which is deposited onto substrates such as sapphire and used in high brightness LEDs. This use accounts for more than 35% of the consumption of Ga in the U.S. Remaining uses include solar energy, magnetic materials, and other niche applications. Given the growth trajectories of mobile devices and LEDs, we expect sustained and increasing demand for Ga in the foreseeable future.
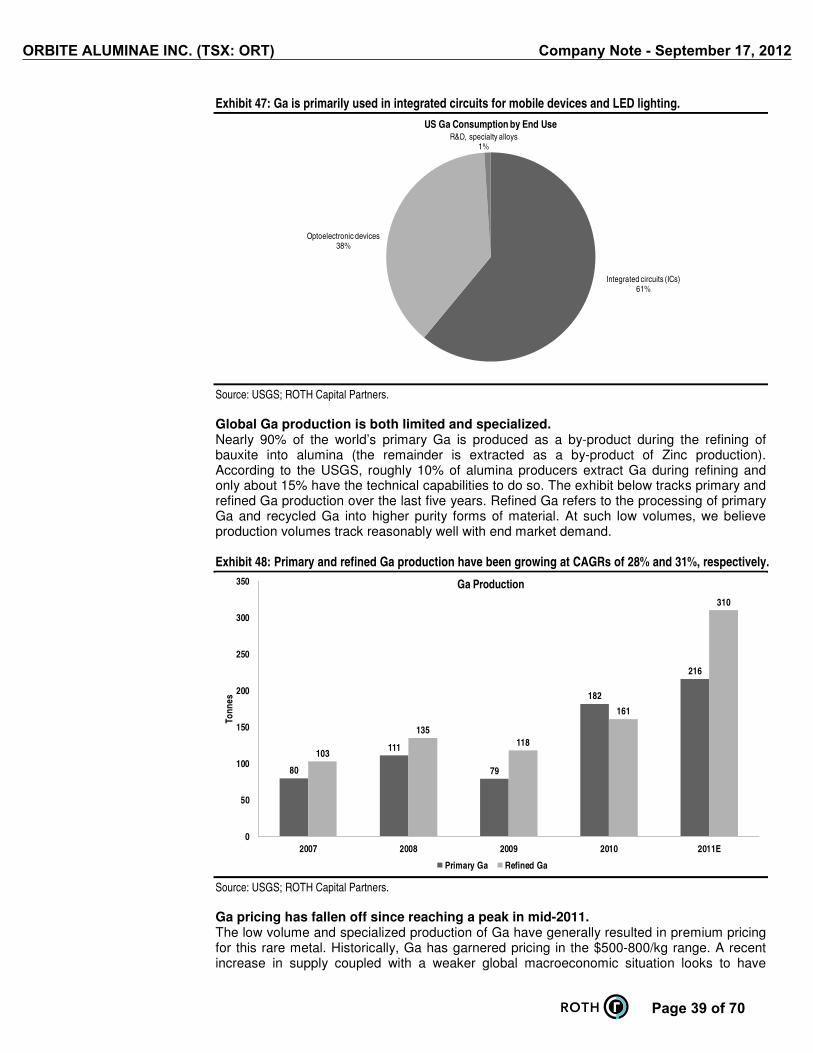
Page 39 of 70
ORBITE ALUMINAE INC. (TSX: ORT) Company Note - September 17, 2012
Exhibit 47: Ga is primarily used in integrated circuits for mobile devices and LED lighting.
Integrated circuits (ICs)61%
Optoelectronic devices38%
R&D, specialty alloys1%
US Ga Consumption by End Use
Source: USGS; ROTH Capital Partners. Global Ga production is both limited and specialized. Nearly 90% of the world’s primary Ga is produced as a by-product during the refining of bauxite into alumina (the remainder is extracted as a by-product of Zinc production). According to the USGS, roughly 10% of alumina producers extract Ga during refining and only about 15% have the technical capabilities to do so. The exhibit below tracks primary and refined Ga production over the last five years. Refined Ga refers to the processing of primary Ga and recycled Ga into higher purity forms of material. At such low volumes, we believe production volumes track reasonably well with end market demand. Exhibit 48: Primary and refined Ga production have been growing at CAGRs of 28% and 31%, respectively.
80
111
79
182
216
103
135
118
161
310
0
50
100
150
200
250
300
350
2007 2008 2009 2010 2011E
Ton
nes
Ga Production
Primary Ga Refined Ga
Source: USGS; ROTH Capital Partners.
Ga pricing has fallen off since reaching a peak in mid-2011. The low volume and specialized production of Ga have generally resulted in premium pricing for this rare metal. Historically, Ga has garnered pricing in the $500-800/kg range. A recent increase in supply coupled with a weaker global macroeconomic situation looks to have

Page 40 of 70
ORBITE ALUMINAE INC. (TSX: ORT) Company Note - September 17, 2012
depressed pricing since mid-2011. As Orbite looks to introduce roughly 76 tonnes of Ga each year by 2016, we see the potential for further price erosion in the Ga market. In turn, however, we believe lower pricing has the potential to unlock hidden sources of demand in the integrated circuit and semiconductor industries.
Exhibit 49: Annual Ga pricing has ranged from $500 to 700/kg…
530
579
449
600
700
0
100
200
300
400
500
600
700
800
2007 2008 2009 2010 2011E
$/kg
Ga Pricing (1)
(1) Ga pricing based on USGS estimates of average value of US imports of 6N and 7N Source: USGS; ROTH Capital Partners.
Exhibit 50: …but has dropped off significantly in FY’12.
0
200
400
600
800
1,000
1,200
$/kg
Ga 99.99%min US
Source: Asian Metal; ROTH Capital Partners.
Rare Earths Orbite could become the first new western source of rare earth oxides (REOs) after Molycorp and Lynas; China dominates supply. From the 1980s through the 2000s, Chinese producers—enjoying a much lower cost structure vs. global competitors—boosted output by more than 300%, while other countries reduced production to minimal levels. This massive shift in production resulted in China capturing more than 95% of the global REO production market by 2008. In recent years, REOs have reentered the spotlight in developed countries, which are beginning to view these elements as strategically important for their use in cleantech and military applications. A number of junior mining companies are targeting production of REOs in the next five years, and we believe Orbite, with REO separation capabilities at both its HPA and SGA facilities, is uniquely positioned to assist them in bringing supply to market. While initial volumes may be low when compared to overall supply of REOs, we believe the Orbite process can eventually be scaled by adding additional plants to supply a larger amount of processing capacity. Exhibit 51: China has dominated REO supply since the 1980s, but Orbite could change this phenomenon.
Source: USGS.

Page 41 of 70
ORBITE ALUMINAE INC. (TSX: ORT) Company Note - September 17, 2012
Today, there are a number of critical factors driving the rare earth industry. Key drivers in the rare earth industry include the following: (1) supply is dominated by Chinese companies that produce rare earths as a byproduct from other minerals and metals production; (2) China has continued its efforts to control its rare earth oxide (REO) exports; (3) a number of junior mining companies are developing resource properties in order to fill potentially increasing global demand for REOs; (4) an oversupply of total REOs masks a potential shortage in critical, medium and heavy REOs (neodymium, dysprosium, terbium, europium, and yttrium); and (5) Demand for these critical REOs will likely be driven by a range of cleantech applications. Orbite’s REO revenues from the SGA plant could generate $78mn at 850 tpa… By Q1’15, Orbite plans to begin production of rare earths from its own resource property, producing ten REOs at its SGA plant. At full capacity in FY’16, we estimate the SGA plant can generate $78mn in revenues each year, with 69% coming from the critical REOs neodymium (Nd), dysprosium (Dy), europium (Eu), and yttrium (Y).
Exhibit 52: We expect that modest production volumes of critical REOs like Nd, Dy, Eu, and Y…
Yttrium13%
Lanthanum18%
Cerium38%
Praseodymium5%
Neodymium16%
Samarium3%
Europium1%
Gadolinium3%
Dysprosium2% Erbium
1%
Orbite REO Production (FY'16)Total = 850 tpa
Source: Orbite NI 43-101; ROTH Capital Partners.
Exhibit 53: …will likely make up a material portion of revenues from REOs, ~69% of the expected $78mn.
Yttrium12%
Lanthanum10%
Cerium10%
Praseodymium5%
Neodymium18%
Samarium2%
Europium14%
Gadolinium2%
Dysprosium25%
Erbium2%
Orbite REO Revenue (FY'16)Total = $78mn
Source: Orbite NI 43-101; Asian Metal; ROTH Capital Partners estimates.
…while Orbite’s HPA plant processing capabilities could drive upside. We believe there is potential upside to our estimates as we have not factored in Orbite’s ability to process REOs at its HPA facility. Management has not yet disclosed estimates on volumes from this facility, but we believe they could drive material upside to our estimates. Orbite’s resource property has a high concentration of HREOs. We view the ability to supply the world with critical HREOs as a key success factor for small producers of REOs outside of China. As a result, exposure to HREOs is critical, and Orbite’s Grande Vallée resource has significant exposure to these elements. In the exhibit below, we calculated the HREO/TREO ratio for twelve REO projects outside of China that are either planning to come online or ramp production through 2016. Orbite has the third highest exposure to HREOs among these projects.

Page 42 of 70
ORBITE ALUMINAE INC. (TSX: ORT) Company Note - September 17, 2012
Exhibit 54: Orbite has the third highest HREO/TREO ratios among producers coming online by 2016.
37.4%
22.5% 22.4% 22.0%
11.3%
7.8%7.2%
3.4% 3.3% 2.8%
0.5% 0.0%0.0%
5.0%
10.0%
15.0%
20.0%
25.0%
30.0%
35.0%
40.0%
Strange Lake(Quest)
Dubbo (Alkane) Grande Vallée(Orbite)
Nechalacho(AVL)
Kvanefjeld(Greenland
Minerals andEnergy)
Steenkampskraal(Great Western)
Zandkopsdrift(Frontier Rare
Earths)
Nolans Bore(Arafura)
Bear Lodge(Rare Element
Resources)
Mt Weld (Lynas) Mountain Pass(Molycorp)
Wigu Hill(Montero)
HR
EO
/TR
EO
Rare Earth Producers HREO/TREO
ORT has the third highest HREO/TREO ratio of all producers coming online through 2016
Source: Technology Metals Research; ROTH Capital Partners.
World rare earth oxide (REO) supply remains dominated by China. Despite major new rare earth projects coming online from Molycorp and Lynas, global supply of REOs remains dominated by China. We see this phenomenon continuing in the near term given long lead times required for rare earth projects. In our view, this single geographic sourcing remains a large overhang on demand for REOs. Given a larger, more stable supply of REOs outside of China, we believe demand would become more robust, and we expect demand to accelerate as ROW supply comes online, especially for critical HREOs.
Exhibit 55: REO supply remains dominated by China…
China94%
ROW6%
2011 REO ProductionTotal = 104,000 tonnes
Source: IMCOA; ROTH Capital Partners estimates.
Exhibit 56: …which limits exports with tariffs and quotas.
61,821 59,643
56,939
-4%
-5%-12%
-40%
0%
2%
-50%
-45%
-40%
-35%
-30%
-25%
-20%
-15%
-10%
-5%
0%
5%
10%
0
10,000
20,000
30,000
40,000
50,000
60,000
70,000
2006 2007 2008 2009 2010 2011Yo
Y ∆
ton
nes
of r
are
eart
h o
xid
e (R
EO
)
Chinese REO Export Quotas
H1 H2 Export Quota Total YoY ∆
50,145
30,258 30,246 30,996
2012
Source: MOFCOM; ROTH Capital Partners.
ROW supply is set to accelerate in the next five years… Several major REO producers are poised to ramp production over the next five years, including Molycorp’s Mountain Pass facility in California, and Lynas’ Mount Weld property in Australia. Several junior companies are also vying to reach the production stage, including Avalon Rare Metals (AVL, Buy), in our view, a leader among ROW projects focused on providing critical HREOs.

Page 43 of 70
ORBITE ALUMINAE INC. (TSX: ORT) Company Note - September 17, 2012
Exhibit 57: ROW REO producers are set to come online over the next five years.
109,000 98,000 95,000
105,000 110,000
125,000
135,000
3,460
6,100 6,600
14,600
22,100
33,250
46,710
0
20,000
40,000
60,000
80,000
100,000
120,000
140,000
160,000
180,000
200,000
2010 2011 2012E 2013E 2014E 2015E 2016E
ton
nes
of r
are
eart
h o
xid
e (R
EO
)
Total Rare Earth Oxides (TREO) Supply and Demand
China Supply ROW Supply Total Demand
ROW supply set to increase at a >50% CAGR 2011-2016
Source: IMCOA; ROTH Capital Partners estimates.
…giving the appearance of equilibrium, which masks shortages in individual REOs. By 2016, according to IMCOA, critical HREOs including Nd, Eu, Dy, Tb and Y will be in tight supply or even shortage. These rare earths are used in a variety of applications, but the majority of the increase in demand from these materials stems from cleantech applications. Nd and Dy, for instance, are used in permanent magnet motors that go into motors for plug-in hybrid and electric vehicles, and generators that are used in wind turbines. Eu, Tb and Y are used in fluorescent lighting and other phosphor applications. The exhibit below shows 2016 demand over supply to demonstrate surpluses or shortages of individual REOs. We believe Orbite is well positioned to deliver additional HREO supply from its own resource property, while potentially assisting several junior rare earth companies in processing their supply. This could assist in mitigating some of the imbalance in the critical HREOs below. Exhibit 58: The TREO supply/demand balance masks and imbalance in individual REOs.
81.3%84.6%
135.0%
113.8%
142.9%
130.0%
0.0%
20.0%
40.0%
60.0%
80.0%
100.0%
120.0%
140.0%
160.0%
Ce Nd Eu Dy Tb Y
Dem
and
/Su
pp
ly
2016 Demand/Supply Dynamics
Demand exceeds supply above this line
Source: IMCOA; ROTH Capital Partners.

Page 44 of 70
ORBITE ALUMINAE INC. (TSX: ORT) Company Note - September 17, 2012
Pricing has come down substantially since hitting all-time highs in late summer 2011... Several factors played into this decrease, including a slight easing of Chinese export quotas, new ROW supply sources from Molycorp and Lynas, as well as a softening in demand caused by the overall macroeconomic environment. Pricing for LREOs has dropped more significantly than for HREOs due to the continued tight supply-demand dynamics of the latter. We see continued tight supply, and even shortages for critical HREOs, keeping prices for these elements relatively higher than their LREO counterparts. We view this as a material positive for Orbite given its exposure to HREOs like Nd, Dy, Eu and Y. The exhibits below show pricing over the past two years for La, a LREO, and Dy, a HREO. Note how the drop in pricing for La has been more severe. We believe this is representative of LREOs vs. HREOs as a whole.
Exhibit 59: La is down 83% from its high in Jul’11…
-100%
100%
300%
500%
700%
900%
1100%
1300%
1500%
1700%
1900%
0
20,000
40,000
60,000
80,000
100,000
120,000
140,000
160,000
Jul-0
9
Sep
-09
Nov
-09
Jan-
10
Mar
-10
May
-10
Jul-1
0
Sep
-10
Nov
-10
Jan-
11
Mar
-11
May
-11
Jul-1
1
Sep
-11
Nov
-11
Jan-
12
Mar
-12
May
-12
Jul-1
2
YoY
∆
La
Oxi
de,
US
D/m
t
Lanthanum (La) Oxide 99% minAverage Monthly Price, FOB
La Oxide Px YoY ∆
Source: Asian Metal; ROTH Capital Partners.
Exhibit 60: …while Dy is down 54% from its Aug’11 high.
-100%
0%
100%
200%
300%
400%
500%
600%
700%
800%
0
500
1,000
1,500
2,000
2,500
Jul-0
9
Sep
-09
Nov
-09
Jan-
10
Mar
-10
May
-10
Jul-1
0
Sep
-10
Nov
-10
Jan-
11
Mar
-11
May
-11
Jul-1
1
Sep
-11
Nov
-11
Jan-
12
Mar
-12
May
-12
Jul-1
2
YoY
∆
Dy
Oxi
de,
US
D/k
g
Dysprosium (Dy) Oxide 99% minAverage Monthly Price, FOB
Dy Oxide Px YoY ∆
Source: Asian Metal; ROTH Capital Partners.
…but still remains elevated vs. historical pricing. Prices for both LREOs and HREOs remain elevated vs. their ten year moving averages. La is nearly 43% above its ten year moving average while Dy remains almost 250% above its ten year moving average. We would expect this deviation from historical pricing to continue, especially for HREOs that remain in tight supply. We view this as a positive for suppliers of HREOs like Orbite.
Exhibit 61: La remains 43% above its ten year moving avg…
-100%
100%
300%
500%
700%
900%
1100%
1300%
1500%
1700%
1900%
0
20,000
40,000
60,000
80,000
100,000
120,000
140,000
160,000
Ap
r-01
Sep
-01
Feb
-02
Jul-
02
De
c-0
2
May
-03
Oc
t-0
3
Mar
-04
Au
g-0
4
Jan
-05
Jun
-05
No
v-0
5
Ap
r-06
Sep
-06
Feb
-07
Jul-
07
De
c-0
7
May
-08
Oc
t-0
8
Mar
-09
Au
g-0
9
Jan
-10
Jun
-10
No
v-1
0
Ap
r-11
Sep
-11
Feb
-12
Jul-
12
YoY
∆
La
Oxi
de
US
D/m
t
Lanthanum (La) Oxide 99% min Average Monthly Price, FOB
La Oxide Px YoY ∆ Source: Asian Metal; ROTH Capital Partners.
Exhibit 62: …while Dy is ~250% above its ten year moving avg.
-100%
0%
100%
200%
300%
400%
500%
600%
700%
800%
0
500
1,000
1,500
2,000
2,500
Ap
r-01
Sep
-01
Feb
-02
Jul-
02
De
c-0
2
May
-03
Oc
t-0
3
Mar
-04
Aug
-04
Jan
-05
Jun
-05
No
v-0
5
Ap
r-06
Sep
-06
Feb
-07
Jul-
07
De
c-0
7
May
-08
Oc
t-0
8
Mar
-09
Aug
-09
Jan
-10
Jun
-10
No
v-1
0
Ap
r-11
Sep
-11
Feb
-12
Jul-
12
Yo
Y∆
Dy
Oxi
de
US
D/k
g
Dysprosium (Dy) Oxide 99% minAverage Monthly Price, FOB
Dy Oxide Px YoY ∆ Source: Asian Metal; ROTH Capital Partners.

Page 45 of 70
ORBITE ALUMINAE INC. (TSX: ORT) Company Note - September 17, 2012
(D) Hematite (Fe2O3) At full production, Orbite plans to produce ~189,000 tonnes of high purity hematite. Following alumina, hematite is the first by-product to be produced in Orbite’s acid recovery system. We forecast revenues of ~$15mn, and expect an incremental amount of COGS, as the production of hematite requires a non-trivial amount of energy for the hydrolysis reaction. At 99.5% purity, we expect Orbite to sell its hematite into value-added markets… According to its NI 43-101, Orbite expects to produce hematite at significantly higher purity than most hematite currently in the market. Hematite is typically used in a range of industrial applications, but the overwhelming majority (~98%) is used in steel production, which requires a hematite with ~50% iron content on average, typically hematite ore. We expect Orbite to sell its high purity hematite into niche markets, such as magnet fabrication and electric motor manufacturing. …allowing the company to command a premium for its hematite over standard iron ore. Our back-of-the-envelope estimate suggests Orbite could sell its hematite for more than a 50% premium to the hematite used in steel production. In our model, for conservatism, we do not give full credit for this potential premium, and instead, use just $80/tonne, which is roughly equivalent with current iron ore pricing. We believe this represents a source of potential upside to our model. Iron ore and steel prices have been trending down, but we believe Orbite will command more for its hematite. Iron ore prices, which are largely driven by macroeconomic forces, hit a recent peak in Feb’11 at $185/tonne and have since dropped by ~55%. Iron ore and steel prices have both shown sharp declines over the past year driven in part by a general deterioration of steel demand in the face of global macroeconomic difficulties. We believe steel and iron ore prices could remain depressed over the near term due to the negative macroeconomic outlook.
Exhibit 63: The price of iron ore (at 61% min iron) has declined by ~55% since Feb’11.
-60%
-50%
-40%
-30%
-20%
-10%
0%
10%
20%
30%
$0
$20
$40
$60
$80
$100
$120
$140
$160
$180
$200
Dec
-06
Mar
-07
Jun-
07
Sep
-07
Dec
-07
Mar
-08
Jun-
08
Sep
-08
Dec
-08
Mar
-09
Jun-
09
Sep
-09
Dec
-09
Mar
-10
Jun-
10
Sep
-10
Dec
-10
Mar
-11
Jun-
11
Sep
-11
Dec
-11
Mar
-12
Jun-
12
Sep
-12
YoY
Gro
wth
Iro
n O
re U
SD
/ton
ne
Iron Ore PricingUSD/tonne
Iron Ore Growth
Source: Asian Metal; ROTH Capital Partners.
Exhibit 64: Cold rolled steel (.5mm) prices are down ~29% since peaking at $1,140/tonne in Jul’08.
-25%
-20%
-15%
-10%
-5%
0%
5%
10%
15%
$0
$200
$400
$600
$800
$1,000
$1,200
Jul-0
8
Sep
-08
Nov
-08
Jan-
09
Mar
-09
May
-09
Jul-0
9
Sep
-09
Nov
-09
Jan-
10
Mar
-10
May
-10
Jul-1
0
Sep
-10
Nov
-10
Jan-
11
Mar
-11
May
-11
Jul-1
1
Sep
-11
Nov
-11
Jan-
12
Mar
-12
May
-12
Jul-1
2
Sep
-12
YoY
Gro
wth
Ste
el U
SD
/ton
ne
CR Steel PricingUSD/tonne
Steel Growth
Source: Asian Metal; ROTH Capital Partners.
(E) Silica (SiO2) and maybe Metallurgical-Grade Silicon (MG-Si)? Orbite expects each SGA plant to produce ~1.2mn tonnes of silica annually. Silica is the first by-product to drop out following the separation of alumina in the SGA facility. It also has the greatest volumes of production. Silica pricing, however, is quite low at $25-35/tonne. For conservatism, we use a $25/tonne ASP, and this results in approximately $30mn of silica revenues per year. The purity of this silica is quite high at 97%. Given our high level understanding of the Orbite’s chemical process, we hypothesize that Orbite may be

Page 46 of 70
ORBITE ALUMINAE INC. (TSX: ORT) Company Note - September 17, 2012
able to convert the silica into a more valuable product in the form of metallurgical-grade silicon, which is at least 98.5% pure silicon. Silica is exposed to a number of industrial end markets with petroleum and glassmaking being the largest. In 2010, overall demand for silica in the US was 30mn tonnes. The petroleum end market consumed 40% of overall demand, while glassmaking used 26% of 2010 demand. In our view, silica is a product that has relatively mature set of end markets that are likely driven by overall GDP growth. Exhibit 65: US silica demand driven by petroleum (40%) and glassmaking (26%).
Glassmaking25.8%
Foundry 10.3%
Abrasives 1.5%
Chemical 2.6%
Fillers0.8%
Building products7.1%
Ceramics0.3%
Filtration0.8%
Petroleum40.1%
Recreational2.2%
Engine0.2%
Other, ground silica0.1%
Other, whole grain6.2%
Silicon, ferrosilicon0.6%
Filtration, silica gravel0.2%
Other, gravel 1.1%
Silica Usage Mix2010 U.S. Demand = 29.9mn tonnes
Source: USGS; ROTH Capital Partners.
With some additional opex and capex, we hypothesize that Orbite could create a much more valuable product—metallurgical-grade silicon (MG-Si). In Orbite’s acid leaching step, the reaction parameters are set up to drop SiO2 out as an insoluble. We believe that the reaction parameters could be changed such that the Si could be converted into a chloride. Once in chloride form, we think there may be known and established processes for converting the silicon chloride into a pure metal, or pure Si. Typically, industry processes high-grade silica through an electric arc furnace with coal, wood, and charcoal to produce metallurgical-grade silicon. The following equation highlights the silicon separation through the electric arc furnace: SiO2 + 2 C � Si + 2 CO. Metallurgical-grade silicon is 98.5% pure, and represents a high value product, which sells for approximately $2,700/tonne according to Asian Metal. Aluminum casting and chemical industry drive ~95% of the demand for MG-Si. We estimate more than 50% of the demand for metallurgical-grade silicon in the U.S. comes from aluminum casting. The silicon is alloyed with aluminum to create a variety of end products including cookware, car wheels, aircraft fittings, and pump casings. The chemical industry consumes roughly 45% of metallurgical-grade silicon to produce products such as automotive grease, shampoos, paint, glass sealants, and toothpaste. Less than 5% of the metallurgical-grade silicon produced is refined even further to create a high-purity product called polycrystalline silicon, which is used in solar cells and semiconductors.
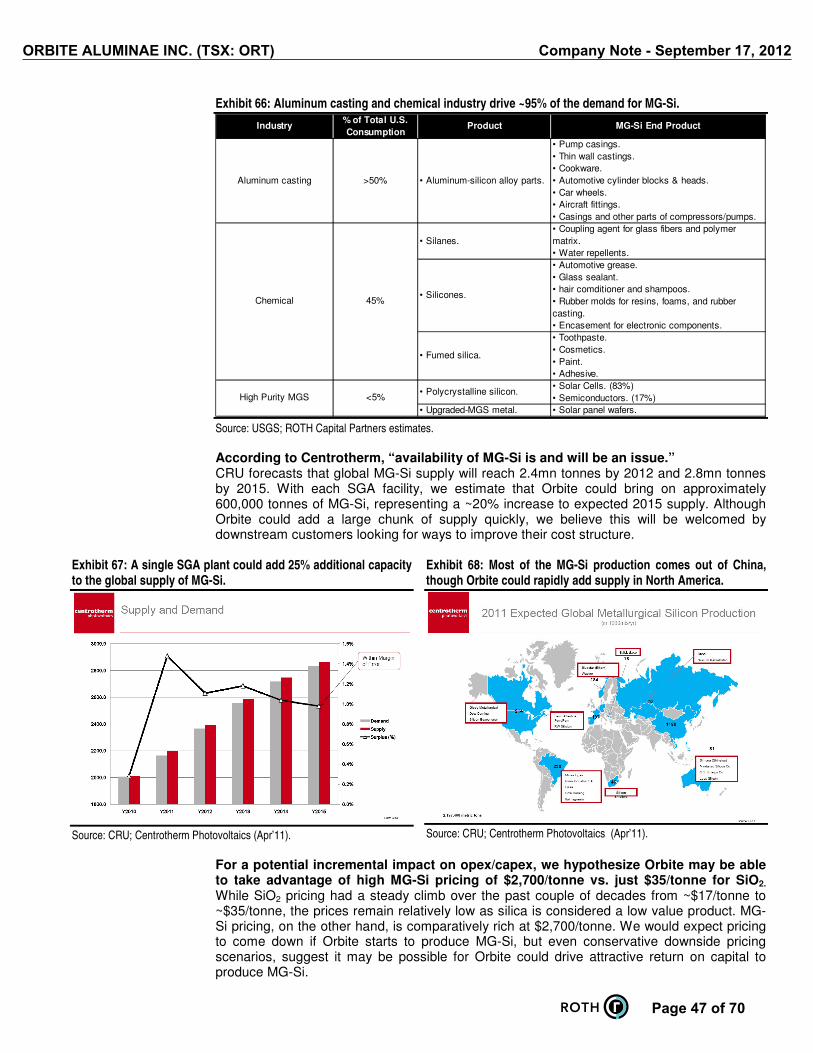
Page 47 of 70
ORBITE ALUMINAE INC. (TSX: ORT) Company Note - September 17, 2012
Exhibit 66: Aluminum casting and chemical industry drive ~95% of the demand for MG-Si.
Industry% of Total U.S.
ConsumptionProduct MG-Si End Product
Aluminum casting >50% • Aluminum-silicon alloy parts.
• Pump casings.• Thin wall castings.• Cookware.• Automotive cylinder blocks & heads.• Car wheels.• Aircraft fittings.• Casings and other parts of compressors/pumps.
• Silanes.• Coupling agent for glass fibers and polymer matrix.• Water repellents.
• Silicones.
• Automotive grease.• Glass sealant.• hair comditioner and shampoos.• Rubber molds for resins, foams, and rubber casting.• Encasement for electronic components.
• Fumed silica.
• Toothpaste.• Cosmetics.• Paint.• Adhesive.
• Polycrystalline silicon.• Solar Cells. (83%)• Semiconductors. (17%)
• Upgraded-MGS metal. • Solar panel wafers.High Purity MGS <5%
Chemical 45%
Source: USGS; ROTH Capital Partners estimates.
According to Centrotherm, “availability of MG-Si is and will be an issue.” CRU forecasts that global MG-Si supply will reach 2.4mn tonnes by 2012 and 2.8mn tonnes by 2015. With each SGA facility, we estimate that Orbite could bring on approximately 600,000 tonnes of MG-Si, representing a ~20% increase to expected 2015 supply. Although Orbite could add a large chunk of supply quickly, we believe this will be welcomed by downstream customers looking for ways to improve their cost structure.
Exhibit 67: A single SGA plant could add 25% additional capacity to the global supply of MG-Si.
Source: CRU; Centrotherm Photovoltaics (Apr’11).
Exhibit 68: Most of the MG-Si production comes out of China, though Orbite could rapidly add supply in North America.
Source: CRU; Centrotherm Photovoltaics (Apr’11).
For a potential incremental impact on opex/capex, we hypothesize Orbite may be able to take advantage of high MG-Si pricing of $2,700/tonne vs. just $35/tonne for SiO2.
While SiO2 pricing had a steady climb over the past couple of decades from ~$17/tonne to ~$35/tonne, the prices remain relatively low as silica is considered a low value product. MG-Si pricing, on the other hand, is comparatively rich at $2,700/tonne. We would expect pricing to come down if Orbite starts to produce MG-Si, but even conservative downside pricing scenarios, suggest it may be possible for Orbite could drive attractive return on capital to produce MG-Si.

Page 48 of 70
ORBITE ALUMINAE INC. (TSX: ORT) Company Note - September 17, 2012
Exhibit 69: SiO2 pricing is relatively low…
-5%
0%
5%
10%
15%
20%
25%
$0
$5
$10
$15
$20
$25
$30
$35
$40
1996 1997 1998 1999 2000 2001 2002 2003 2004 2005 2006 2007 2008 2009 2010
YoY
Gro
wth
Sili
ca U
SD
/ton
ne
Silica PricingUSD/tonne
Silica Growth
Source: USGS; ROTH Capital Partners.
Exhibit 70: …compared with MG-Si, representing an opportunity.
-6%
-4%
-2%
0%
2%
4%
6%
8%
$0
$500
$1,000
$1,500
$2,000
$2,500
$3,000
$3,500
$4,000
$4,500
Jun
-09
Au
g-0
9
Oct
-09
Dec
-09
Feb
-10
Ap
r-10
Jun
-10
Au
g-1
0
Oct
-10
Dec
-10
Feb
-11
Ap
r-11
Jun
-11
Au
g-1
1
Oct
-11
Dec
-11
Feb
-12
Ap
r-12
Jun
-12
Au
g-1
2
Yo
Y G
row
th
MG
-Si U
SD
/to
nn
e
MG-Si PricingUSD/tonne
MG-Si Growth
Source: Asian Metal; ROTH Capital Partners.
(F) Magnesium Oxide (MgO) For each SGA plant, Orbite expects to produce ~28k tpa of MgO. One of the last by-products produced from the Orbite process is magnesium oxide (MgO). The company expects to produce 28k tpa for each SGA facility. Since the NI 43-101 was published, pricing for 97% MgO has not changed much and remains around $400 per tonne. Using this price, we forecast ~$11mn of revenue for each SGA plant. In the U.S., the steel industry uses 56% of MgO production. The four primary industries that consume MgO are (1) steel; (2) environmental; (3) agricultural; and (4) chemical. According to the USGS, the steel industry consumes ~56% of U.S. MgO demand. MgO is primarily used as a refractory material, one which is physically and chemically stable at high temperatures, in the steel production industry. MgO has a very high melting point of more than 2,800°C making it ideal to hold the over 1,500°C molten iron during steel production. Other industries, including manufacturing, construction, and pharmaceutical, use MgO for its acid neutralization or insulation properties in a diverse range of end products including rubber, cement, and antacids.
Exhibit 71: MgO is used in a variety of end markets.
Industry MgO Usage
Steel• Refractory for molten steel and other ferrous metal production.
Envrionmental
• Wastewater treatment as an acid neutralizer.• Stack-gas scrubber to clean industrial gas streams.
Agricultural
• Animal feed as a source of magnesium ions.• Fertilizers as a source of essential magnesium.
Chemical • Reaction intermediate.
Manufacturing• Rubber pruduction as a filler and acid acceptor.• Insulating filler for semi-conductors.
Construction • Oxychloride and oxysulfate cements.
Pharmaceuticals • Antacids.• Ointments.
Source: USGS; ROTH Capital Partners.
Exhibit 72: Steel is a key source of MgO consumption.
Steel, 56%Envrionmental, 18%
Agricultural, 13%
Chemical, 11%
Other, 1%
MgO Industry Usage Mix 2010 Global Consumption = 12.8mn tonnes
Source: USGS; ROTH Capital Partners.

Page 49 of 70
ORBITE ALUMINAE INC. (TSX: ORT) Company Note - September 17, 2012
We expect Orbite to produce MgO at 97% grade, resulting in much better pricing. Since Jan’11, MgO with 90% purity has decreased by more than 45% vs. a 2% price increase for 97% pure MgO. The price for MgO with a minimum of 90% purity has declined from its high of $455/tonne to $245/tonne over 15 months. On the other hand, the price for MgO with 97% purity has actually grown by 2% since Jan’11.
Exhibit 73: 90% MgO prices are down 45% since 2011…
-20%
-15%
-10%
-5%
0%
5%
10%
15%
20%
$0
$100
$200
$300
$400
$500
$600
$700
Jan
-11
Feb-
11
Mar
-11
Ap
r-11
May
-11
Jun-
11
Jul-1
1
Au
g-11
Sep
-11
Oct
-11
No
v-11
Dec
-11
Jan
-12
Feb-
12
Mar
-12
Ap
r-12
May
-12
Jun-
12
Jul-1
2
Au
g-12
Sep
-12
Yo
Y G
row
th
Mg
O 9
0% U
SD
/mt
MgO 90% min Average Monthly Price, FOB
MgO 90% min Growth
Source: Asian Metal; ROTH Capital Partners.
Exhibit 74: …while 97% MgO pricing has remained stable.
-2.0%
-1.5%
-1.0%
-0.5%
0.0%
0.5%
1.0%
1.5%
2.0%
2.5%
$0
$100
$200
$300
$400
$500
$600
$700
Jan
-11
Feb-
11
Mar
-11
Ap
r-11
May
-11
Jun-
11
Jul-1
1
Au
g-11
Sep
-11
Oct
-11
No
v-11
Dec
-11
Jan
-12
Feb-
12
Mar
-12
Ap
r-12
May
-12
Jun-
12
Jul-1
2
Au
g-12
Sep
-12
Yo
Y G
row
th
Mg
O 9
7% U
SD
/mt
MgO 97% min Average Monthly Price, FOB
MgO 97% min Growth
Source: Asian Metal; ROTH Capital Partners.

Page 50 of 70
ORBITE ALUMINAE INC. (TSX: ORT) Company Note - September 17, 2012
FINANCIAL CONDITION As of Q2’12, Orbite had over $60mn in cash and cash equivalents on its balance sheet. Over the near term, we expect this cash balance to be sufficient to enable the company to bring its HPA plant online while finishing its bankable feasibility study for is SGA plant expected to be commissioned sometime in 2014. Following the completion of the HPA plant, we expect Orbite to need to raise additional capital to finance the construction of its SGA plant. Management has guided SGA capex plans to be $500mn, +/-30%. Conservatively, we would consider the high end of this range, which is $650mn. We would expect its capital structure to embrace a combination of equity and debt. At the end of Q2’12, Orbite had 180mn shares outstanding. With 12.4mn warrants outstanding (at a weighted average strike price of $3.67) and 13.9mn options outstanding (at a weighted average strike price of $1.38), the company’s latest diluted share count is 206.5mn shares. Orbite has limited long-term debt of $2.3mn at the end of Q2’12. Aluminerie Alouette converted its $1mn loan plus $56k of accrued interest into 780k Class A shares in the Q2’12 period. Capital Raises In Jul’11, Orbite raised gross proceeds of $57.5mn through a bought-deal private placement. The placement represents 18mn special warrants for Class A shares at $3.20 per special warrant. Each special warrant comprises one class A share plus half a share purchase warrant, which have since expired in Jul’12. Proceeds from this capital raise are expected to fund the Cap-Chat conversion to an HPA production facility. In Nov’10, Orbite raised $12.2mn through a private placement of 27mn units at a price of $.45/unit. Each unit consisted of one Class A share and half of a Class A share purchase warrant. The roughly 2mn remaining warrants can still be used to purchase Class A shares at $.85/share until Nov’12. In Oct’10, Orbite raised $705,000 through a private placement of 470 units. Each unit was sold for $1,500 and comprised of (1) 8,000 flow-through Class A shares ($.15/share), (2) 2,000 non flow-through Class A shares ($.15/share), and (3) 5,000 Class A purchase warrants ($.21/share for 12 months).

Page 51 of 70
ORBITE ALUMINAE INC. (TSX: ORT) Company Note - September 17, 2012
RECENT DEVELOPMENTS During the last nine months, Orbite has been actively engaged on a number of fronts. Management has been focusing efforts and company resources on bringing HPA into commercial production, while continuing to move its proposed SGA plant through the NI 43-101 and BFS process. The exhibit below highlights key developments and milestones year-to-date.
Exhibit 75: Recent developments at Orbite. Date Milestone/Event Description
9/6/12Received mining lease for Grande Vallée
property
• Issued by Québec's Ministére des Ressources naturelles et de la Faune. • 20 yr mining lease for Grande-Vallée site.• Allows for the mining of ~70mn tonnes of clay.
8/28/12Announced HPA facility construction
ahead of shedule by 7-10 days• Management update on the HPA facility indicated that Orbite was 7-10 days ahead of schedule on construction.
8/8/12Produced first North American heavy rare
metals/earths from aluminous clay
• Orbite extracted scandium, gallium, yttrium, neodymium, dysprosium, and cerium from Grande-Vallée clay.• All elements were extracted at >93% purity except yttrium (87.47%).• Management believes Orbite is on pace for third party separation of rare metals/earths by 2013 and production from its own resource property by 2014.
8/1/12 Announced red mud treatment technology• Management claims Orbite offers the only commercially viable solution to eliminate red mud.• Patented process converts the red mud into dry neutral residue, that is 10% of the volume of its original state.• Orbite plans to license this technology to alumina producers.
6/29/12Produced first 5N HPA commercial
samples
• Produced with 99.999% (5N) purity.• Pre-tested by the independent laboratory Evans Analytical Group.• Samples have been requested by >12 potential customers.
6/28/12Confirmed rare metals/earths processing
capability at HPA plant• Management expects to produce rare metals/earths at its HPA facility by 2013.
6/27/12 Signed MoU with Nalco
• Provides for the evaluation of Orbite's technology on Nalco's ores, primarily gibbisite and boehmite.• The agreement also provides for the evaluation of Orbite's technology on Nalco's red mud waste. • These evaluations could lead to potential investment by Nalco in Orbite's SGA plant, as well as licensing agreements.
6/27/12Independent laboratories tested ORT's
process on red mud with positive results• Independently tested by AGAT Laboratories and Evans Analytical Group.• Achieved an overall recovery rate of 92.4% following remediation.
6/21/12Scandium, gallium, and yttrium were extracted at greater rates than PEA
• Extraction resulted in min oxide yields for Ga, Sc, and Y of 93.86%, 93.11%, and 87.47% respectively.• Evaluated by CMI-UVK GmbH.
6/14/12Began construction of the Cap-Chat HPA
plant• Orbite announced that construction started on 5/29/12, with full commissioning planned for Dec'12.• Total expected capex of $26-30mn.
5/31/12 Filed revised PEA • PEA confirmed the economic results for the SGA plant.
4/24/12 Aquired new property claims• Acquired 952 claims covering 543.2km².• Properties are between Cap-Chat and Québec.
4/17/12Confirmed rare metals/earths content in
Grande-Vallée clay.• Results were based on 3 series of samples from '07-'11.• All samples were from Grande-Vallée site.
4/10/12Confirmed hydrothermal process for SGA
plant• Hydrothermal process will be used at the SGA plant for the hydrochloric acid recovery technology.• Based on test results from SMS Siemag and ThyssenKrupp.
3/30/12 Audited the Jan'12 SGA plant's PEA
• Independent audit conducted by Roche and geologist Alex W. Knox.• Confirmed the validity of the Jan'12 PEA's conclusions. • Confirmed that there was no evidence of fraudulent or exaggerated claims regarding the rare metals/earths quantities in the PEA.
3/28/12 Signed MoU with UC RUSAL• Formed a JV between Orbite and UC RUSAL to construct the first SGA plant.• UC RUSAL will test its raw materials at SGA plant using Orbite's technology.• UC RUSAL has the option to invest $25mn into the first phase of the SGA plant.
3/15/12 Opened principal laboratory in Laval• To support development efforts for both HPA and future SGA facilities.• Services will include hight purity chemical analysis, quality control, and process development.
3/8/12Launched the conversion of Cap-Chat
plant to an HPA production facility• Finalized basic engineering phase.• Expected to commission by YE'12.
1/12/12 Filed PEA for SGA plant• Prepared by Genivar.• SGA plant is projected to produce 540k tpa of SGA, plus by-products, which include rare metals and others.• SGA plant is expected to realize a 65% IRR with a payback period >18 months.
Source: Orbite press releases; ROTH Capital Partners.

Page 52 of 70
ORBITE ALUMINAE INC. (TSX: ORT) Company Note - September 17, 2012
EARNINGS OUTLOOK Despite being a pre-revenue company, there are high expectations for Orbite. Management has developed what we believe is a disruptive chemical process and technology for the alumina and the rare metals/earths industries. Fundamentally, we assume Orbite meets its cost, capex, and quality targets, demonstrating its technology is viable and effective. Given this assumption, we currently forecast a scenario that we believe is realistic and serves as a base case for what to expect ahead. We highlight below some additional assumptions embedded in our base case. Key Assumptions: Base Case
• High purity alumina plant. Despite prior expectations for an earlier start, we assume the plant starts to generate revenue in Q1’13. We ramp up volumes as we go through the year from 1 tpd in Q1’13 to 3 tpd in Q3’13 and finally 4 tpd by the beginning of Q1’14.
• Smelter grade alumina plant. Although management indicated in its NI 43-101 that it expects capex of $500mn for its SGA plant, management also believes the accuracy of this capex budget could be off by +/-30%. For conservatism, we assume an additional $150mn (+30%) in capex for a total of $650mn, or $1,200/tonne. We give credit to the management team for a Q1’15 commercial start date, though this could be pushed back by a number of factors.
• SGA expansion. In total, management has expectations to build ten SGA plants in the Grand-Vallée region given the smelting capacity of Québec. In our model, we assume a total of two plants come online—one in 2015 and the other in 2017. We use capex of $650mn for each plant.
• Licensing. We assume no licensing revenues, though we believe this could be a substantial source of revenues. The company is already in discussions to license its technology to Nalco, and we would not be surprised if there were others that have not been publically disclosed. For conservatism, however, we do not include this potential high margin revenue stream given a lack of visibility into the process.
• Rare earth concentrate processing. Orbite recently announced in Aug’12 that it expects to produce rare earths as early as 2013. We expect this to be an extension from the company’s HPA plant, and this serves as a new development and source of revenue and margin upside. Again, for conservatism, we have not included the value of this potential revenue stream as we do not yet have much color on volumes or source of concentrate.
• Capital structure. Currently, the company has ~$60mn of cash on its balance sheet. With an estimated quarterly cash burn of ~$10mn for opex, remaining capex for the HPA facility, and additional expenses for the SGA bankable feasibility study, the company may need to raise additional capital over the near to medium term.

Page 53 of 70
ORBITE ALUMINAE INC. (TSX: ORT) Company Note - September 17, 2012
Despite an HPA plant and two SGA facilities, rare metals and earths potentially represent more than one third of revenues. In our base case, we forecast HPA to drive approximately $120mn in revenues, while each SGA plant could generate ~$178mn in annual revenues at full capacity. Although Orbite has been billed as an alumina company as it plans to produce both high purity and smelter grade alumina, a meaningful source of revenues could come from rare metals and earths. Not only does Orbite’s innovative acid recovery process unlock alumina, but it also concentrates rare metals and earths in its acid recovery system. Using reasonable pricing assumptions, we forecast rare metals and earths to represent more than one third of total revenues by 2018, with scandium accounting for the largest share. Exhibit 76: We forecast one HPA and two SGA plants to generate ~$940mn in revenues by 2018 with rare metals and rare earths representing slightly more than one third of the revenue mix. Business Model Units FY'12E FY'13E FY'14E FY'15E FY'16E FY'17E FY'18E
CAD in millions (unless otherwise noted) Dec-12 Dec-13 Dec-14 Dec-15 Dec-16 Dec-17 Dec-18
(A) Company Summary
HPA C$ in mn 0.0 65.3 120.0 120.0 120.0 120.0 120.0SGA C$ in mn 0.0 0.0 0.0 57.9 178.1 200.4 356.2
Fe2O3 C$ in mn 0.0 0.0 0.0 4.9 15.1 17.0 30.3
SiO2 C$ in mn 0.0 0.0 0.0 10.0 30.7 34.6 61.4
MgO C$ in mn 0.0 0.0 0.0 3.6 11.1 12.5 22.3Mixed oxides C$ in mn 0.0 0.0 0.0 0.2 0.5 0.6 1.0
Sc2O3 C$ in mn 0.0 0.0 0.0 23.4 72.2 81.2 144.3Ga2O3 C$ in mn 0.0 0.0 0.0 8.0 24.7 27.8 49.5Y2O3 C$ in mn 0.0 0.0 0.0 3.0 9.3 10.5 18.6La2O3 C$ in mn 0.0 0.0 0.0 2.5 7.7 8.6 15.3CeO2 C$ in mn 0.0 0.0 0.0 2.6 8.1 9.1 16.2Pr5O11 C$ in mn 0.0 0.0 0.0 1.3 4.0 4.5 8.1Nd2O3 C$ in mn 0.0 0.0 0.0 4.5 14.0 15.7 28.0Sm2O3 C$ in mn 0.0 0.0 0.0 0.4 1.3 1.5 2.6Eu2O3 C$ in mn 0.0 0.0 0.0 3.7 11.3 12.7 22.5Gd2O3 C$ in mn 0.0 0.0 0.0 0.5 1.6 1.8 3.3Dy2O3 C$ in mn 0.0 0.0 0.0 6.3 19.4 21.9 38.9Er2O3 C$ in mn 0.0 0.0 0.0 0.5 1.4 1.6 2.8
Rare earths & metals C$ in mn 0.0 0.0 0.0 56.9 175.0 196.9 350.0Total revenues 0.0 65.3 120.0 253.5 530.6 582.0 941.3
HPA NA 100% 100% 47% 23% 21% 13%SGA NA 0% 0% 23% 34% 34% 38%
Fe2O3 NA 0% 0% 2% 3% 3% 3%
SiO2 NA 0% 0% 4% 6% 6% 7%
MgO NA 0% 0% 1% 2% 2% 2%Mixed oxides NA 0% 0% 0% 0% 0% 0%
Sc2O3 NA 0% 0% 9% 14% 14% 15%Ga2O3 NA 0% 0% 3% 5% 5% 5%Y2O3 NA 0% 0% 1% 2% 2% 2%La2O3 NA 0% 0% 1% 1% 1% 2%CeO2 NA 0% 0% 1% 2% 2% 2%Pr5O11 NA 0% 0% 1% 1% 1% 1%Nd2O3 NA 0% 0% 2% 3% 3% 3%Sm2O3 NA 0% 0% 0% 0% 0% 0%Eu2O3 NA 0% 0% 1% 2% 2% 2%Gd2O3 NA 0% 0% 0% 0% 0% 0%Dy2O3 NA 0% 0% 2% 4% 4% 4%Er2O3 NA 0% 0% 0% 0% 0% 0%
Rare earths & metals NA 0% 0% 22% 33% 34% 37%Revenue mix NA 100% 100% 100% 100% 100% 100%
Source: Orbite; ROTH Capital Partners estimates.

Page 54 of 70
ORBITE ALUMINAE INC. (TSX: ORT) Company Note - September 17, 2012
Our base case uses a reasonable set of pricing assumptions. Although we use the standard production volumes that the company provides, we have adjusted product ASPs given the realities of the current commodity pricing environment. For example, while Orbite’s NI 43-101 uses $425/tonne, $200/tonne, and $600/kg for SGA, hematite, and gallium, respectively, we only use $330/tonne, $80/tonne, and $325/kg, respectively, more reflective of current pricing. Exhibit 77: While our production volumes are largely in line with management expectations, we’ve ratcheted down our ASPs across the board. Business Model Units FY'12E FY'13E FY'14E FY'15E FY'16E FY'17E FY'18E
CAD in millions (unless otherwise noted) Dec-12 Dec-13 Dec-14 Dec-15 Dec-16 Dec-17 Dec-18
HPA 000s tonnes 0.0 1.0 1.5 1.5 1.5 1.5 1.5SGA 000s tonnes 0.0 0.0 0.0 175.4 539.7 607.2 1,079.4
Fe2O3 000s tonnes 0.0 0.0 0.0 61.5 189.3 213.0 378.6
SiO2 000s tonnes 0.0 0.0 0.0 399.3 1,228.6 1,382.2 2,457.3
MgO 000s tonnes 0.0 0.0 0.0 9.0 27.8 31.3 55.6Mixed oxides 000s tonnes 0.0 0.0 0.0 33.8 104.1 117.1 208.2
Sc2O3 tonnes 0.0 0.0 0.0 15.6 48.1 54.1 96.2Ga2O3 tonnes 0.0 0.0 0.0 24.7 76.1 85.6 152.2Y2O3 tonnes 0.0 0.0 0.0 35.7 109.7 123.4 219.4La2O3 tonnes 0.0 0.0 0.0 50.8 156.2 175.7 312.4CeO2 tonnes 0.0 0.0 0.0 105.1 323.3 363.7 646.6Pr5O11 tonnes 0.0 0.0 0.0 13.1 40.4 45.5 80.8Nd2O3 tonnes 0.0 0.0 0.0 45.5 139.9 157.4 279.8Sm2O3 tonnes 0.0 0.0 0.0 8.6 26.4 29.7 52.8Eu2O3 tonnes 0.0 0.0 0.0 1.6 4.9 5.5 9.8Gd2O3 tonnes 0.0 0.0 0.0 6.8 20.9 23.5 41.8Dy2O3 tonnes 0.0 0.0 0.0 6.0 18.5 20.8 37.0Er2O3 tonnes 0.0 0.0 0.0 3.3 10.0 11.3 20.0
Rare earths & metals 000s tonnes 0.0 0.0 0.0 0.3 1.0 1.1 1.9Total production 000s tonnes 0.0 1.0 1.5 680.9 2,092.0 2,353.3 4,182.5
HPA ASP C$/kg $0 $80 $80 $80 $80 $80 $80SGA ASP C$/tonne $0 $0 $0 $330 $330 $330 $330
Fe2O3 ASP C$/tonne $0 $0 $0 $80 $80 $80 $80
SiO2 ASP C$/tonne $0 $0 $0 $25 $25 $25 $25
MgO ASP C$/tonne $0 $0 $0 $400 $400 $400 $400Mixed oxides ASP C$/tonne $0 $0 $0 $5 $5 $5 $5
Sc2O3 C$/kg $0 $0 $0 $1,500 $1,500 $1,500 $1,500Ga2O3 C$/kg $0 $0 $0 $325 $325 $325 $325Y2O3 C$/kg $0 $0 $0 $85 $85 $85 $85La2O3 C$/kg $0 $0 $0 $49 $49 $49 $49CeO2 C$/kg $0 $0 $0 $25 $25 $25 $25Pr5O11 C$/kg $0 $0 $0 $100 $100 $100 $100Nd2O3 C$/kg $0 $0 $0 $100 $100 $100 $100Sm2O3 C$/kg $0 $0 $0 $50 $50 $50 $50Eu2O3 C$/kg $0 $0 $0 $2,300 $2,300 $2,300 $2,300Gd2O3 C$/kg $0 $0 $0 $78 $78 $78 $78Dy2O3 C$/kg $0 $0 $0 $1,050 $1,050 $1,050 $1,050Er2O3 C$/kg $0 $0 $0 $140 $140 $140 $140
Rare earths & metals ASP C$/kg $0 $0 $0 $180 $180 $180 $180
Source: Orbite; ROTH Capital Partners estimates.
ASPs since the Nov’11 PEA have declined dramatically, though scandium serves as a potential buffer. Since the company’s PEA released in Nov’11, prices for the products that the company plans to produce are down across the board. SGA ASPs are down 22%, hematite ASPs are down 60%, and nearly all rare metals and earths ASPs are down between 20% and 60%. Scandium, however, is the single metal that has demonstrated resilience and even upside potential. Scandium pricing on Asian Metal is currently around $4,000/kg, compared with Orbite’s estimate of $1,500, highlighting how unique and rare this element is. If we adjust scandium’s pricing to $4,000/kg, revenue potential is down only 7% vs. down 27% if we maintain scandium at $1,500/kg. Scandium, in our view, will likely be a critical piece to Orbite’s story going forward.
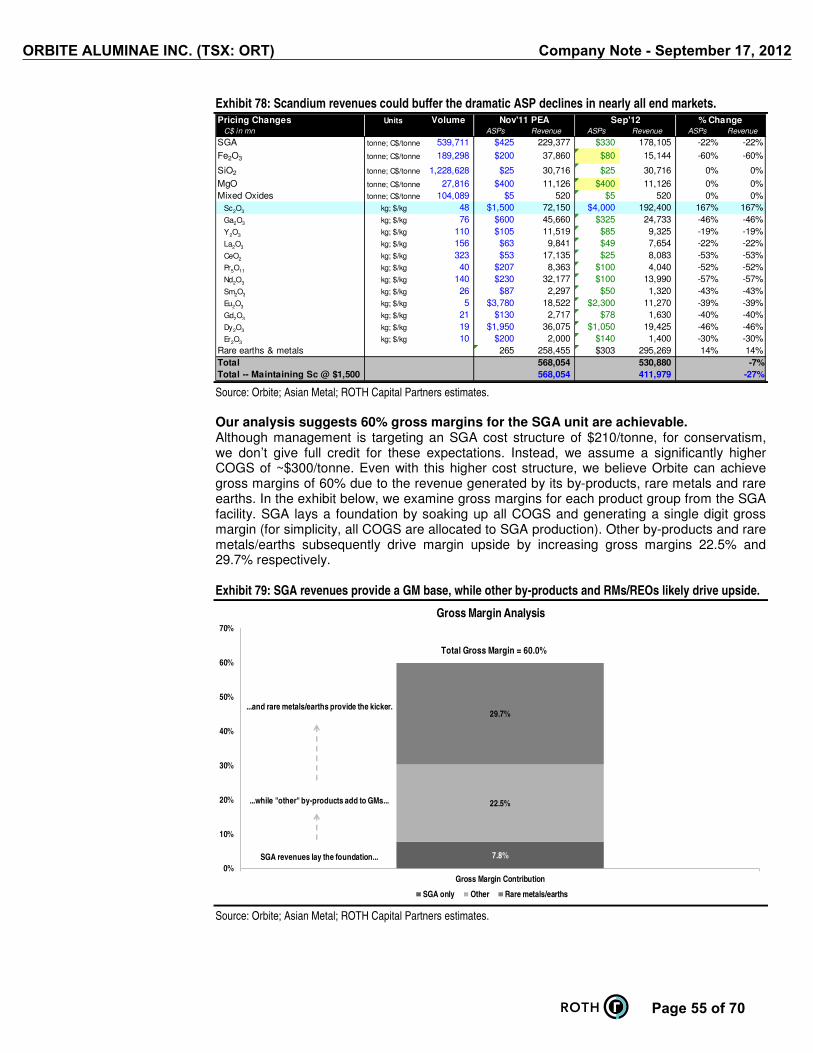
Page 55 of 70
ORBITE ALUMINAE INC. (TSX: ORT) Company Note - September 17, 2012
Exhibit 78: Scandium revenues could buffer the dramatic ASP declines in nearly all end markets. Pricing Changes Units Volume Nov'11 PEA Sep'12 % Change
C$ in mn ASPs Revenue ASPs Revenue ASPs Revenue
SGA tonne; C$/tonne 539,711 $425 229,377 $330 178,105 -22% -22%
Fe2O3 tonne; C$/tonne 189,298 $200 37,860 $80 15,144 -60% -60%
SiO2 tonne; C$/tonne 1,228,628 $25 30,716 $25 30,716 0% 0%
MgO tonne; C$/tonne 27,816 $400 11,126 $400 11,126 0% 0%Mixed Oxides tonne; C$/tonne 104,089 $5 520 $5 520 0% 0%
Sc2O3 kg; $/kg 48 $1,500 72,150 $4,000 192,400 167% 167%Ga2O3 kg; $/kg 76 $600 45,660 $325 24,733 -46% -46%Y2O3 kg; $/kg 110 $105 11,519 $85 9,325 -19% -19%La2O3 kg; $/kg 156 $63 9,841 $49 7,654 -22% -22%CeO2 kg; $/kg 323 $53 17,135 $25 8,083 -53% -53%Pr5O11 kg; $/kg 40 $207 8,363 $100 4,040 -52% -52%Nd2O3 kg; $/kg 140 $230 32,177 $100 13,990 -57% -57%Sm2O3 kg; $/kg 26 $87 2,297 $50 1,320 -43% -43%Eu2O3 kg; $/kg 5 $3,780 18,522 $2,300 11,270 -39% -39%Gd2O3 kg; $/kg 21 $130 2,717 $78 1,630 -40% -40%Dy2O3 kg; $/kg 19 $1,950 36,075 $1,050 19,425 -46% -46%Er2O3 kg; $/kg 10 $200 2,000 $140 1,400 -30% -30%
Rare earths & metals 265 258,455 $303 295,269 14% 14%Total 568,054 530,880 -7%
Total -- Maintaining Sc @ $1,500 568,054 411,979 -27%
Source: Orbite; Asian Metal; ROTH Capital Partners estimates.
Our analysis suggests 60% gross margins for the SGA unit are achievable. Although management is targeting an SGA cost structure of $210/tonne, for conservatism, we don’t give full credit for these expectations. Instead, we assume a significantly higher COGS of ~$300/tonne. Even with this higher cost structure, we believe Orbite can achieve gross margins of 60% due to the revenue generated by its by-products, rare metals and rare earths. In the exhibit below, we examine gross margins for each product group from the SGA facility. SGA lays a foundation by soaking up all COGS and generating a single digit gross margin (for simplicity, all COGS are allocated to SGA production). Other by-products and rare metals/earths subsequently drive margin upside by increasing gross margins 22.5% and 29.7% respectively. Exhibit 79: SGA revenues provide a GM base, while other by-products and RMs/REOs likely drive upside.
7.8%
22.5%
29.7%
0%
10%
20%
30%
40%
50%
60%
70%
Gross Margin Contribution
Gross Margin Analysis
SGA only Other Rare metals/earths
Total Gross Margin = 60.0%
SGA revenues lay the foundation...
...while "other" by-products add to GMs...
...and rare metals/earths provide the kicker.
Source: Orbite; Asian Metal; ROTH Capital Partners estimates.

Page 56 of 70
ORBITE ALUMINAE INC. (TSX: ORT) Company Note - September 17, 2012
We forecast HPA to drive revenue growth, and SGA to flip earnings positive. Orbite’s technology is novel, and we expect it to be disruptive. One of the key factors is due to the attractive economics of the company’s processing technology. By recycling over 99% of the hydrochloric acid used, the company can extract alumina more cost effectively than the Bayer process. As a result, we expect attractive margins and in turn a rapid transition to positive earnings. In the HPA business, we conservatively forecast 50% gross margins, though we acknowledge that there may be meaningful upside to our estimate. This business could drive ~$120mn in revenues at full scale operations. While the SGA product margin itself may not be as strong as HPA, the SGA segment operations will likely benefit from the variety of valuable by-products refined via the acid-recovery process, which should drive revenue growth with limited to no associated COGS. While our base case builds in low gross margins for the SGA product, margin expansion is made possible from the revenue growth of rare metals and earths as well as hematite and other by-products. We view the variety of commodity outputs and specialized rare metal elements as valuable diversification that could help shield the company from the extremes of an economic cycle. To drive the revenue growth ahead, the company must deploy roughly $650mn in capex per SGA plant for a total of $1.3bn. While we assume debt will be used to finance some of these expenditures, the company may also need to issue equity. The equity could potentially come from a number of sources, including JVs with industry partners. For simplicity, we assume pure equity issuance of $300mn over the next three years. Exhibit 80: HPA gross margins have upside potential beyond 50%, while SGA margin expansion will likely be driven by rare metal revenues.
Earnings Outlook FY'12E FY'13E FY'14E FY'15E FY'16E FY'17E FY'18E
CAD in millions (unless otherwise noted) Dec-12 Dec-13 Dec-14 Dec-15 Dec-16 Dec-17 Dec-18
Revenue 0.0 65.3 120.0 253.5 530.6 582.0 941.3YoY growth NA NA 84% 111% 109% 10% 62%
Gross profit 0.0 32.6 60.0 140.1 306.4 337.2 552.8Gross margin 0% 50% 50% 55% 58% 58% 59%
Net income (29.7) (19.7) (27.0) 19.0 135.7 145.4 295.5Net margin NA -30% -23% 8% 26% 25% 31%
EPS ($0.17) ($0.09) ($0.11) $0.08 $0.51 $0.55 $1.11YoY growth -117% 45% -24% 166% 578% 7% 103%
Wt avg share count -- diluted 179.4 215.1 237.6 253.3 266.5 266.5 266.5
Source: Orbite; ROTH Capital Partners estimates.

Page 57 of 70
ORBITE ALUMINAE INC. (TSX: ORT) Company Note - September 17, 2012
VALUATION We establish a price target of $10 driven by attractive FCFs. Using a DCF valuation approach, we establish a price target of $10 for Orbite. This price target is based on a single HPA plant, two SGA plants, and no licensing revenues, for conservatism. We expect Orbite’s closed-loop, acid recovery process to be cost effective and to yield attractive margins and return on capital. As a result, the free cash flow generation is attractive, and the company could use this cash flow to open new plants to further drive earnings and valuation upside. Management’s goal is to construct 10 SGA facilities in the Grande-Vallée region alone. Applying a 15% discount rate, to free cash flows we arrive at our price target of $10. Exhibit 81: Our $10 price target assumes one HPA and two SGA plants operating at full capacity in FY’18.
DCF Valuation FY'12E FY'13E FY'14E FY'15E FY'16E FY'17E FY'18E
CAD in millions (except per share data) Dec-12 Dec-13 Dec-14 Dec-15 Dec-16 Dec-17 Dec-18
Net Income (29.7) (19.7) (27.0) 19.0 125.8 145.4 295.5EBITDA (24.2) (2.8) 49.0 153.9 347.4 411.2 532.8
EBIT (29.3) (11.4) 5.0 66.1 220.4 247.2 452.8Tax Rate 0.0% 0.0% 0.0% 27.0% 27.0% 27.0% 27.0%
Less: Tax 0.0 0.0 0.0 17.8 59.5 66.7 122.20.0
EBIT* (1-Tc) (29.3) (11.4) 5.0 48.2 160.9 180.4 330.5Add: D&A 5.1 8.6 44.0 87.8 127.1 164.0 80.0Less: Increase in WC 60.1 (17.2) (1.9) (49.3) (16.4) (32.8) (32.8)Less: Capex (24.0) (110.0) (280.0) (280.0) (330.0) (320.0) (80.0)
FCFF 11.9 (129.9) (232.9) (193.2) (58.5) (8.4) 297.7
Terminal Value 2,297.0
Discount Rate 15%Growth Rate 2%Years 0.50 1.50 2.50 3.50 4.50 5.50 6.50PV of FCF 11.1 (105.8) (165.3) (119.6) (31.5) (4.0) 122.1
Enterprise value 2,004.0Add: Cash 60.1Less: Debt 2.4
Equity value 2,066.5
Weighted avg shares 215.0Equity value per share $9.61
Source: Orbite; ROTH Capital Partners estimates.
We see meaningful potential in the upside case. In our base case model, we factor in revenues from HPA, SGA and the range of by-products that are expected to be produced at Orbite’s SGA plant. We do not give credit, however, for several additional sources of revenue that could drive meaningful upside. Below, we highlight sources of potential upside.
• Licensing. We have not factored licensing, which we see as a realistic source of revenues, into our base case scenario. The company has already publically announced the exploration of licensing arrangements with Nalco. Given the 3bn tonnes of red mud throughout the world, there are a number of alumina producers, in our view, that would consider licensing a technology that not only remediates the red mud waste, but also generates an attractive return on capital in the meantime.
• Pricing. Another key source of upside is in our scandium pricing. While our model only uses $1,500/kg, actual pricing according to Asian Metal is more than $4,000/kg. Every $1,000/kg of additional scandium pricing equates to ~$1.50 per share of upside.
• Rare earth production and HPA plant. In regards to the HPA facility, Orbite has publically announced that it expects to be a producer of rare earths in 2013. We have not factored in this potential revenue or margin upside.

Page 58 of 70
ORBITE ALUMINAE INC. (TSX: ORT) Company Note - September 17, 2012
• Margins. We use a conservative HPA margin of 50% though there could be upside. Likewise with SGA, we use a low 8% gross margin while management is targeting an implied 40% gross margin.
Downside case will likely be driven by delays, higher-than-expected cost structure or capex, and another leg down in commodity pricing. For a company that is pre-revenue, the management team has set a high bar of expectations—high margins, strong cash flow generation, and a variety of by-products. The downside case is likely driven primarily by (1) delays; (2) poor execution resulting in lower-than-expected margins; (3) a much higher-than-expected capex plan; or (4) poor product quality. Additionally, if commodity prices for Orbite’s end products all take another leg down, this could drive further downside risk. Our sensitivity analysis results in a valuation range from $5 to $16/share in a variety of scenarios. We believe this demonstrates a meaningful margin of safety has been baked into our assumptions. We conducted two separate sensitivity analyses based on firm operations, varying our base case scenario by pricing and gross margins. In our pricing sensitivity analysis, a $100/tonne shift in SGA pricing moves share price by $1/share, while each $1,000/kg change in Sc moves per share value for Orbite by ~$1.50/share. While this demonstrates that share price is highly sensitive to material price fluctuations, we believe the important takeaway stems from the extreme downside pricing scenario of $0/kg for Sc and $250/tonne of SGA. Even in this highly negative scenario, Orbite looks attractively valued at its current levels (~$6/share vs. current share price of ~$2.80). For the margin analysis, a 5% shift in SGA margins changes valuation by ~$1.20/share while a 10% change in HPA margins moves Orbite per share value by $0.50/share. We believe our base case scenario is already substantially more conservative than management targets and still see a margin of safety in all but the worst case scenarios for gross margins.
Exhibit 82: A $4,000 Sc price results in ~$4/share in upside while an $120/tonne increase in SGA pricing would add ~$2/share.
Valuation Sensitivity Table -- Pricing
SGA Pricing
9.61$ $250 $300 $330 $400 $450
$4,000 $12.08 $12.95 $13.47 $14.68 $15.54$3,000 $10.54 $11.41 $11.92 $13.14 $14.00$2,000 $9.00 $9.86 $10.38 $11.59 $12.46$1,500 $8.23 $9.09 $9.61 $10.82 $11.69$1,000 $7.46 $8.32 $8.84 $10.05 $10.92
$500 $6.69 $7.55 $8.07 $9.28 $10.15$0 $5.91 $6.78 $7.30 $8.51 $9.37S
can
diu
m P
ricin
g
Source: Orbite; ROTH Capital Partners estimates.
Exhibit 83: If management hits GM targets of >70% for the SGA unit, this could drive more than $2.50/share in upside.
Valuation Sensitivity Table -- Margins
HPA Margins
9.61$ 30% 40% 50% 60% 70%
75% $12.34 $12.80 $13.26 $13.72 $14.1870% $11.12 $11.58 $12.04 $12.51 $12.9765% $9.91 $10.37 $10.83 $11.29 $11.7560% $8.69 $9.15 $9.61 $10.07 $10.5355% $7.50 $7.93 $8.40 $8.86 $9.3250% $6.28 $6.72 $7.18 $7.64 $8.1045% $5.06 $5.53 $5.96 $6.42 $6.89
SG
A M
arg
ins
Source: Orbite; ROTH Capital Partners estimates.
For our third sensitivity analysis, we varied our discount and terminal growth rates to check our discounted cash flow assumptions, resulting in a valuation ranging from $7/share to $14/share. Each 1% move in the discount rate results in a move of ~$0.60/share, while changing the terminal growth rate assumptions by 0.5% moves our valuation by ~$0.40/share. We believe Orbite is attractively valued even in the most conservative DCF scenario ($7/share vs. current share price of ~$2.80)
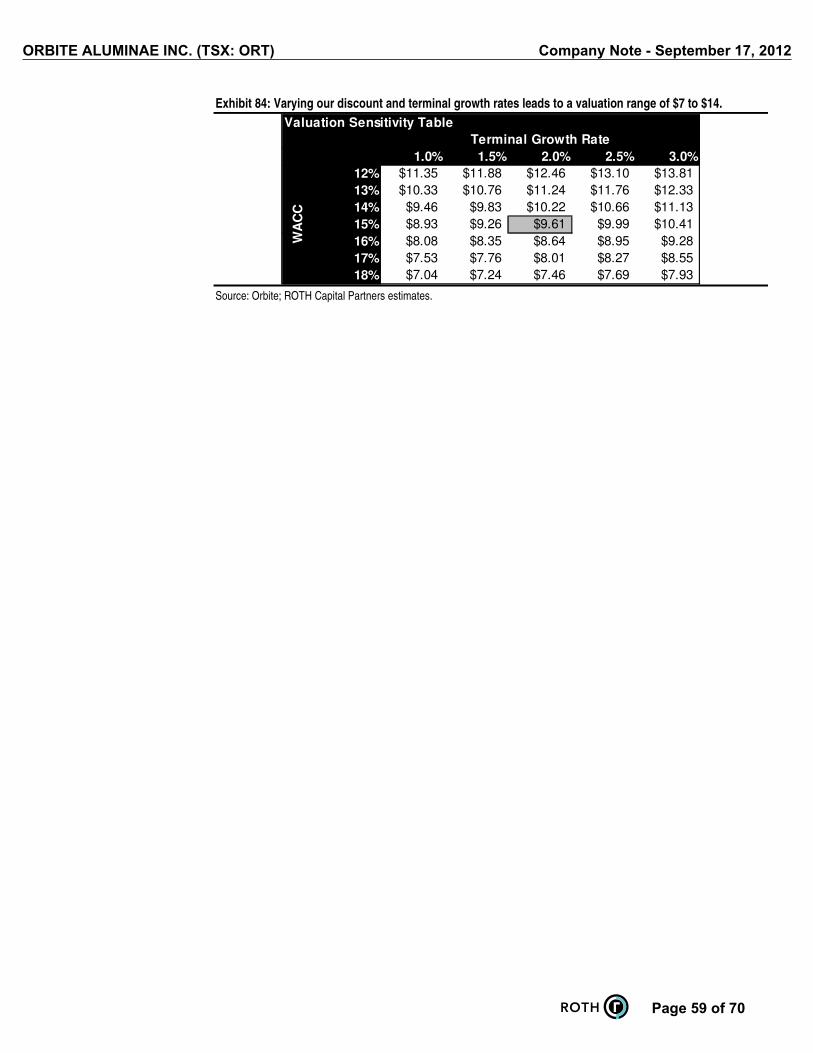
Page 59 of 70
ORBITE ALUMINAE INC. (TSX: ORT) Company Note - September 17, 2012
Exhibit 84: Varying our discount and terminal growth rates leads to a valuation range of $7 to $14.
Valuation Sensitivity Table
Terminal Growth Rate
9.61$ 1.0% 1.5% 2.0% 2.5% 3.0%
12% $11.35 $11.88 $12.46 $13.10 $13.8113% $10.33 $10.76 $11.24 $11.76 $12.3314% $9.46 $9.83 $10.22 $10.66 $11.1315% $8.93 $9.26 $9.61 $9.99 $10.4116% $8.08 $8.35 $8.64 $8.95 $9.2817% $7.53 $7.76 $8.01 $8.27 $8.5518% $7.04 $7.24 $7.46 $7.69 $7.93
WA
CC
Source: Orbite; ROTH Capital Partners estimates.

Page 60 of 70
ORBITE ALUMINAE INC. (TSX: ORT) Company Note - September 17, 2012
MANAGEMENT Orbite’s management team has extensive experience in the mining industry and technology innovation. The team has expertise in bringing technologies to market, developing chemical technologies, and the chemical engineering required to implement the technologies at scale.
Exhibit 85: We believe management has the required expertise to bring its disruptive alumina refining technology to market.
Manager Biography
Richard Boudreault
President, CEO and Director
• Worked in venture capital specializing in material and industrial technologies at Sofinov.• Held technology-related positions at Oerlikon Aerospace and the Canadian Space Agency.• Fellow of the Canadian Academy of Engineering.• Masters in Engineering, Cornell University; MBA, Université de Sherbrooke.
Jacques Bédard
VP Finance and CFO
• Over 25 years of international financial management experience in the high technology, multimedia, and medical device sectors.• Held the position of VP of Finance and CFO for Softimage and ART.• Held senior financial management positions with Microsoft.• Bachelors in Business Administration (accounting), Université du Québec à Montréal.
Joël Fournier
Chief Scientific Officer
• Founder and director of the Centre d'Etudes des Procédés Chimique du Québec (CÉPROCQ), a Montreal-based technology transfer research center.• Published over 40 papers, authored four patents, and completed more than 30 industrial research projects• Ph.D. in Chemistry and Physics, Université de Sherbrooke; Post-Doctorate, INRS Energy and Materials Institute.
Denis Primeau
Chief Engineer
• Over 20 years of experience in the chemical, petrochemical, and other mining-related industries.• Played a large role in the development of a plant for the enrichment of minerals and the recycling of hydrochloric-based materials for Rio Tinto.• Bachelors in Chemical Engineering and MBA, Université de Sherbrooke.
Yves Noël
VP Sales and Marketing
• Over 20 years of experience in sales and marketing for high value-added, specialized fine chemicals, and high purity products.• Held sales and marketing positions with Akzo Nobel, Sandoz, and Clariant.• Successfully negotiated trade agreements with AbitibiBowater, Gildan, Dow, and Rio Tinto as well as with various global distribution partners.• Bachelors in Applied Science in Chemical Engineering; MBA, Université du Québec à Montréal.
Guy-Louis Boucher
VP Sustainability
• Extensive experience in legal affairs and sustainable development.• Held top executive positions including VP, Sustainable Development and VP, Legal Services and Environmental Affairs for Domtar.• Holds a license in civil law and is a member of the Québec Bar.• Bachelors in Business Aministration, University of Ottawa.
Jonathan Labranche
Director Legal Affairs
• Practiced corporate law, representing large businesses at various stages of development and providing consulting on financing, M&A, and investor relations.• Member of the Québec Bar since 2000.• Bachelor of Law, Université de Montréal.
André Lemieux
Director for Community Relations
• Over 15 years experience in community relations.• Taught at the Université du Québec à Rimouski.• Ph.D. in urban studies, Université du Québec à Montréal and Institut national de la recherche scientifique.
Marc Filion
Advisor
• Held President and COO position for Société Générale de Financement du Québec (SGF Mineral).• Held Senior VP, Investments for Mines, Minerals, and Materials position for SGF.• Held Chairman of the Board position for Aluminerie Alouette where he was involved in the development, financing, and construction for the aluminum smelter's Phase II expansion.• Bachelors in geology, École Polytechnique at Université de Montreal; MBA, École des Hautes Études Commerciales in Montréal, Québec/ Ph.D. in Economic Geology and Geostatistics, Royal School of Mines, Imperial College, London, England.
Pierre Després
Advisor
• Public affairs and communications expert with experience working with leading Canadian firms.• Held VP, Communications for Alcoa Global Primary Products.• Held board of director positions for Conseil du Patronat du Québec and the Fédération des chambres de commerce du Québec.• Law degree, Université Laval.
Source: Orbite press releases; ROTH Capital Partners.

Page 61 of 70
ORBITE ALUMINAE INC. (TSX: ORT) Company Note - September 17, 2012
APPENDIX Overview of Red Mud Red mud is hazardous waste from the Bayer process… The Bayer process produces a toxic residue from bauxite during traditional alumina extraction known as red mud. Red mud is toxic because it contains the sodium hydroxide (NaOH) that was added in the process in order to separate alumina from the ore. On the pH scale from 0 to 14 (7 being neutral), red mud has a highly alkaline pH of between 12 and 13. To put this into perspective, red mud’s toxicity is somewhere between ammonia (12 pH), and bleach (13 pH). In Oct’10, there was a spill in Hungary of about one million cubic meters of red mud. The disaster killed 10 people and wounded as many as 150 more. Exhibit 86: The disaster in Hungary spilled one million cubic meters of red mud, killing 60 ppl and injuring 600 more.
Source: rsc.org (Augl’12).
…that is growing at an alarming rate. Australia’s national science agency, the Commonwealth Scientific and Industrial Research Organisation (CSIRO), estimates that it took 93 years for the global red mud inventory to reach one billion tonnes by 1985 and only 15 years to double to two billion tonnes by 2000. By 2007, the global red mud inventory reached an estimated 2.7bn tonnes and is growing at 119mn tpa. CSIRO also estimates that the inventory will likely reach four billion tonnes before 2015 because of the decreasing doubling time.

Page 62 of 70
ORBITE ALUMINAE INC. (TSX: ORT) Company Note - September 17, 2012
Exhibit 87: Red mud volumes are expected to reach four billion tonnes by 2015.
Source: Review of Current Bauxite Residue Management, Disposal and Storage: Practices, Engineering and Science (BRaDD, May’09).
There are four primary methods for dealing with red mud waste… The methods for mitigating red mud are (1) marine dumping; (2) lagooning; (3) dry stacking; and (4) dry disposal. Marine dumping consists of discharging the red mud onto the sea bed offshore from the alumina producers via pipelines. This method is currently being phased out due to the destruction it causes to underwater ecosystems. Lagooning entails piping the red mud into large reinforced pools. This method was heavily used because it was viewed as inexpensive. However, alumina producers have discovered that this method is actually quite expensive due to site rehabilitation and closing costs. In an attempt to bring down costs, alumina producers have started to use the dry stacking method. This method consists of pumping 45-55% solidified red mud to the storage site then allowing it to dry to 62-65% solid. Dry disposal is the final method of red mud mitigation. As opposed to dry stacking, this method requires the red mud to be transported by truck or conveyer to the storage site because it is too solid to pump (>65% solid). Both of these dry methods have much lower associated environmental contamination risks, require only 60% as much storage volume as lagooning, and are less wasteful due to alumina and caustic soda recovery. Most importantly, dry storage of red mud is actually less expensive than lagooning when you factor in all costs and benefits.

Page 63 of 70
ORBITE ALUMINAE INC. (TSX: ORT) Company Note - September 17, 2012
Exhibit 88: Lagooning has become less common recently…
Source: Review of Current Bauxite Residue Management, Disposal and Storage: Practices, Engineering and Science (BRaDD, May’09). [Brandon]
Exhibit 89: …as dry stacking is considered more economical.
Source: Review of Current Bauxite Residue Management, Disposal and Storage: Practices, Engineering and Science (BRaDD, May’09). [Brandon]
Storing red mud is expensive, but it is a challenge to quantify the costs and risks. On an outbound basis, we reached out to nearly 100 industry participants throughout the value chain, including academia, but we were challenged in quantifying the capital costs, annual operating costs, and remediation of a red mud facility. Companies keep the costs (and risks) confidential as red mud represents a potentially large liability. We spoke to industry experts that understand the science, but obtaining details regarding cost structure was a different matter. Capital costs include piping, control rooms, equipment, lagoon or reservoir construction, among other expenses. We would expect operating expenses to not be non-trivial either, especially if there is a breach or accident.

Page 64 of 70
ORBITE ALUMINAE INC. (TSX: ORT) Company Note - September 17, 2012
VALUATION
■ Forecasting free cash flow through FY’18 and applying a discounted cash flow analysis, we establish a $10price target while using a 15% WACC.
■ Risks that would prevent shares of Orbite from reaching our price target include (1) slower-than-expectedramp or delays in HPA production; (2) delays with the company’s SGA project; (3) higher-than-expectedcapital expenditures during the development and construction phases; (4) weaker-than-expected productquality; and (5) lower-than-expected pricing in global markets for Orbite’s products.
RISKS
■ Technical risk. Several steps in Orbite’s process may present challenges to the economic production ofalumina and byproducts, including but not limited to the preparation of the clay input material, silica filtration,and the closed-loop acid recovery systems.
■ IP risk. If Orbite is not able to protect its intellectual property using a combination of global patents andtrade secrets, a rival company could develop a competitive process.
■ SGA scalability. Detailed engineering and design work are still required to build Orbite’s SGA productionprocess. Any challenges or technical difficulties in scaling the company’s closed-loop production processcould create significant delays and push out full scale production.
■ HPA scalability. The company may experience difficulty in scaling up its HPA production process to severaltonnes per day at its Cap Chat facility. This could delay production and negatively affect earnings.
■ Product quality. The company may be unable to scale its process to produce the expected quality andpurity of minerals and metals.
■ Management talent. Orbite relies on several key members of its management team to develop andimplement its technology. Any departure by key members, such as Chief Science Officer Joel Fournier,represents a material risk in our view.
■ Business development. Given the low global production volumes of some of Orbite’s expected byproducts,marketplaces for these materials are less developed and require additional investment in the customerprocurement process.
■ Fuel supply. Orbite’s processing technology requires a substantial amount of energy from a fuel supplysuch as natural gas. Infrastructure development near the SGA plant is necessary before production cancommence as there is currently no production facility for the delivery of natural gas in the Gaspe region.
■ Electricity infrastructure. According to the company’s NI 43-101,Orbite will need access to an industrialscale electricity source at its SGA facility, which is currently unavailable at the proposed site.
■ Permitting delays. Orbite will need to obtain several permits for the mine site and production facilities beforethe company can begin production. Any significant or protracted delays could push out the production dateof the HPA or SGA facilities and negatively impact earnings.
■ Implementation of Bill 14. The bill subjects all mining projects and mineral treatment plants to anenvironmental impact assessment without regard to production threshold. The associated consultations andpublic hearings from the assessment could cause a material delay in Orbite’s projects.
■ Market prices of minerals and metals. Orbite’s profitability is directly related to the prices of theminerals and metals it will produce, which are set by global markets and primarily determined by globalmacroeconomic conditions.
■ Higher-than-expected capital expenditures. Orbite expects to spend approximately $500mn (+/- 30%)to develop its first SGA facility. Increases in cost outside of the expected range could decrease return oninvested capital metrics.
COMPANY DESCRIPTION
Orbite Aluminae (TSX: ORT; OTCQX: EORBF) is a Canadian resources and technology company that focuseson the production of high-purity alumina (HPA), smelter grade alumina (SGA), and value-added by-productssuch as rare metals. Orbite has developed a potentially disruptive alumina extraction alternative to the Bayer

Page 65 of 70
ORBITE ALUMINAE INC. (TSX: ORT) Company Note - September 17, 2012
process, the 125 year-old method currently used to extract alumina from bauxite ore that produces a toxicresidue. Orbite’s patented technology can produce alumina (1) using a variety of inputs, including aluminousclays, low grade bauxite, and red mud; (2) at lower cost than conventional producers; and (3) with no hazardousbyproducts. Orbite owns the rights to the Grande-Vallée property, a resource that contains more than one billiontonnes of aluminous clay. The company expects to complete construction of its 1,500 tpa HPA facility in Cap-Chat, Quebec by year end 2012, and is targeting 2015 for its 540,000 tpa SGA plant. Orbite is headquarteredin Montreal and was founded in 1983.
MENTIONED COMPANIESAvalon Rare Metals (AVL – Buy – $2.29)

Page 66 of 70
ORBITE ALUMINAE INC. (TSX: ORT) Company Note - September 17, 2012
Orbite Aluminae Inc. Philip Shen, Roth Capital Partners
(TSX: ORT) [email protected], 949 720-7198
Income Statement FY'11 Q1'12 Q2'12 Q3'12E Q4'12E FY'12E Q1'13E Q2'13E Q3'13E Q4'13E FY'13E FY'14E FY'15E FY'16E FY'17E FY'18ECAD in millions (except per share data) Dec-11 Mar-12 Jun-12 Sep-12 Dec-12 Dec-12 Mar-13 Jun-13 Sep-13 Dec-13 Dec-13 Dec-14 Dec-15 Dec-16 Dec-17 Dec-18
HPA unit 0.0 0.0 0.0 0.0 0.0 0.0 7.5 11.3 19.5 27.0 65.3 120.0 120.0 120.0 120.0 120.0SGA unit 0.0 0.0 0.0 0.0 0.0 0.0 0.0 0.0 0.0 0.0 0.0 0.0 133.5 410.6 462.0 821.3Total revenues 0.0 0.0 0.0 0.0 0.0 0.0 7.5 11.3 19.5 27.0 65.3 120.0 253.5 530.6 582.0 941.3
YoY growth NA NA NA NA NA NA NA NA NA NA NA 83.9% 111.2% 109.4% 9.7% 61.7%
COGS 0.0 0.0 0.0 0.0 0.0 0.0 3.8 5.6 9.8 13.5 32.6 60.0 113.4 224.3 244.8 388.5Gross profit 0.0 0.0 0.0 0.0 0.0 0.0 3.8 5.6 9.8 13.5 32.6 60.0 140.1 306.4 337.2 552.8
Gross margin NA NA NA NA NA NA 50.0% 50.0% 50.0% 50.0% 50.0% 50.0% 55.3% 57.7% 57.9% 58.7%
Selling & marketing 0.0 0.0 1.0 1.5 2.5 2.0 2.5 3.0 3.5 11.0 12.0 22.0 32.0 34.0 40.0% of sales NA NA NA NA NA NA 26.7% 22.2% 15.4% 13.0% 16.9% 10.0% 8.7% 6.0% 5.8% 4.2%
R&D charges, net of gov't help 2.9 1.4 3.6 4.5 4.5 13.9 4.5 4.5 5.0 5.0 19.0 25.0 32.0 32.0 32.0 32.0% of sales NA NA NA NA NA NA 60.0% 40.0% 25.6% 18.5% 29.1% 20.8% 12.6% 6.0% 5.5% 3.4%
General and adminstrative charges 3.4 2.6 3.2 3.5 3.5 12.8 3.5 3.5 3.5 3.5 14.0 18.0 20.0 22.0 24.0 28.0% of sales NA NA NA NA NA NA 46.7% 31.1% 17.9% 13.0% 21.5% 15.0% 7.9% 4.1% 4.1% 3.0%
Total operating expenses 12.0 4.0 6.8 9.0 9.5 29.3 10.0 10.5 11.5 12.0 44.0 55.0 74.0 86.0 90.0 100.0% of sales NA NA NA NA NA NA 133.3% 93.3% 59.0% 44.4% 67.4% 45.8% 29.2% 16.2% 15.5% 10.6%
EBIT (12.0) (4.0) (6.8) (9.0) (9.5) (29.3) (6.3) (4.9) (1.8) 1.5 (11.4) 5.0 66.1 220.4 247.2 452.8Operating margin NA NA NA NA NA NA -83.3% -43.3% -9.0% 5.6% -17.4% 4.2% 26.1% 41.5% 42.5% 48.1%
Interest income/(expense) 0.3 0.2 0.1 (0.1) (0.1) 0.1 (0.1) (0.1) (0.1) (8.0) (8.3) (32.0) (40.0) (48.0) (48.0) (48.0)Other income (0.1) (0.0) (0.5) 0.0 0.0 (0.6) 0.0 0.0 0.0 0.0 0.0 0.0 0.0 0.0 0.0 0.0EBT (11.5) (3.8) (6.1) (9.1) (9.6) (29.7) (6.4) (5.0) (1.9) (6.5) (19.7) (27.0) 26.1 172.4 199.2 404.8Income taxes 0.1 0.0 0.0 0.0 0.0 0.0 0.0 0.0 0.0 0.0 0.0 0.0 7.0 46.5 53.8 109.3
Effective tax rate 0.0% 0.0% 0.0% 0.0% 0.0% 0.0% 0.0% 0.0% 0.0% 0.0% 0.0% 0.0% 27.0% 27.0% 27.0% 27.0%
Net income -- Continuing (11.6) (3.8) (6.1) (9.1) (9.6) (29.7) (6.4) (5.0) (1.9) (6.5) (19.7) (27.0) 19.0 125.8 145.4 295.5Net margin NA NA NA NA NA NA -84.7% -44.2% -9.5% -24.1% -30.2% -22.5% 7.5% 23.7% 25.0% 31.4%
Extraordinary items/Non-recurring items 0.0 0.0 0.0 0.0 0.0 0.0 0.0 0.0 0.0 0.0 0.0 0.0 0.0 0.0 0.0 0.0Discounted operations 0.0 0.0 0.0 0.0 0.0 0.0 0.0 0.0 0.0 0.0 0.0 0.0 0.0 0.0 0.0 0.0Net income -- Reported (11.6) (3.8) (6.1) (9.1) (9.6) (29.7) (6.4) (5.0) (1.9) (6.5) (19.7) (27.0) 19.0 125.8 145.4 295.5
EPS -- Continuing, diluted shares ($0.08) ($0.02) ($0.03) ($0.05) ($0.05) ($0.17) ($0.03) ($0.02) ($0.01) ($0.03) ($0.09) ($0.11) $0.08 $0.47 $0.55 $1.11YoY growth -38.5% -33.1% -144.9% -236.8% -74.0% -116.6% -49.0% 34.1% 83.4% 44.6% 44.8% -24.2% 166.1% 528.4% 15.5% 103.2%
Extraordinary items/Non-recurring items $0.00 $0.00 $0.00 $0.00 $0.00 $0.00 $0.00 $0.00 $0.00 $0.00 $0.00 $0.00 $0.00 $0.00 $0.00 $0.00Discounted operations $0.00 $0.00 $0.00 $0.00 $0.00 $0.00 $0.00 $0.00 $0.00 $0.00 $0.00 $0.00 $0.00 $0.00 $0.00 $0.00EPS -- Reported ($0.08) ($0.02) ($0.03) ($0.05) ($0.05) ($0.17) ($0.03) ($0.02) ($0.01) ($0.03) ($0.09) ($0.11) $0.08 $0.47 $0.55 $1.11
Weighted average shares -- Basic 152.2 178.5 178.7 180.1 180.1 179.4 200.1 220.1 220.1 220.1 215.1 237.6 240.1 240.1 240.1 240.1Weighted average shares -- Diluted 152.2 178.5 178.7 180.1 180.1 179.4 200.1 220.1 220.1 220.1 215.1 237.6 253.3 266.5 266.5 266.5
Source: Company filings and press releases; ROTH Capital Partners estimates.

Page 67 of 70
ORBITE ALUMINAE INC. (TSX: ORT) Company Note - September 17, 2012
Orbite Aluminae Inc. Philip Shen, Roth Capital Partners
(TSX: ORT) [email protected], 949 720-7198
Balance Sheet FY'11 Q1'12 Q2'12 Q3'12E Q4'12E FY'12E Q1'13E Q2'13E Q3'13E Q4'13E FY'13E FY'14E FY'15E FY'16E FY'17E FY'18ECAD in millions (except per share data) Dec-11 Mar-12 Jun-12 Sep-12 Dec-12 Dec-12 Mar-13 Jun-13 Sep-13 Dec-13 Dec-13 Dec-14 Dec-15 Dec-16 Dec-17 Dec-18
Surplus funds 37.2 19.5 19.5 104.7 93.8 168.4 111.2 111.2 46.3 20.5 97.0 53.5 316.1
Cash & cash equivalents 8.3 5.5 0.1Total cash 8.3 5.5 0.1 37.2 19.5 19.5 104.7 93.8 168.4 111.2 111.2 46.3 20.5 97.0 53.5 316.1Short-term investments 65.5 62.9 60.1 0.0 0.0 0.0 0.0 0.0 0.0 0.0 0.0 0.0 0.0 0.0 0.0 0.0Accounts receivable 0.0 0.0 0.0 4.9 7.4 12.8 17.8 17.8 19.7 70.4 87.2 121.0 154.7Exploration funds 0.0 0.0 0.0 0.0 0.0 0.0 0.0 0.0 0.0 0.0 0.0 0.0 0.0 0.0 0.0 0.0Taxes recoverable/Sales taxes & other receivables 0.4 1.9 1.7 1.7 1.7 1.7 1.7 1.7 1.7 1.7 1.7 1.7 1.7 1.7 1.7 1.7Inventories 0.0 0.0 0.0 1.8 2.8 4.8 6.7 6.7 7.4 22.6 27.6 37.8 47.9Investment tax credits and other assistance receivable 1.4 1.3 3.3 3.3 3.3 3.3 3.3 3.3 3.3 3.3 3.3 3.3 3.3 3.3 3.3 3.3Prepaid expenses and deposits 0.3 0.4 0.3 0.0 0.0 0.0 0.5 0.7 1.2 1.6 1.6 1.8 5.5 6.7 9.2 11.7Total current assets 76.0 72.0 65.5 42.3 24.5 24.5 116.9 109.7 192.2 142.3 142.3 80.3 123.9 223.6 226.5 535.5PPE 5.8 6.1 9.1 18.2 26.4 26.4 30.1 33.6 81.9 127.8 127.8 363.8 556.0 758.9 914.9 914.9Patents 0.2 0.3 0.3 0.3 0.3 0.3 0.3 0.3 0.3 0.3 0.3 0.3 0.3 0.3 0.3 0.3Mining properties 0.1 0.2 0.2 0.2 0.2 0.2 0.2 0.2 0.2 0.2 0.2 0.2 0.2 0.2 0.2 0.2Exploration and evaluation assets 5.0 8.6 8.6 8.6 8.6 8.6 8.6 8.6 8.6 8.6 8.6 8.6 8.6 8.6 8.6 8.6Total assets 87.1 87.1 83.8 69.6 60.0 60.0 156.1 152.4 283.3 279.2 279.2 453.2 689.1 991.7 1,150.6 1,459.5Necessary to finance 0.0 0.0 0.0 0.0 0.0 0.0 0.0 0.0 0.0 0.0 0.0 0.0 0.0
Accounts payable and accrued liabilities 2.5 4.1 5.2 0.0 0.0 0.0 2.5 3.7 6.4 8.9 8.9 9.9 30.1 36.9 50.4 63.9Short-term portion of LTD 0.0 0.0 0.0 0.0 0.0 0.0 0.0 0.0 0.0 0.0 0.0 0.0 0.0 0.0 0.0 0.0Deferred revenue 0.1 0.1 0.0 0.1 0.1 0.1 0.1 0.1 0.1 0.1 0.1 0.1 0.1 0.1 0.1 0.1Total current liabilities 2.7 4.2 5.2 0.1 0.1 0.1 2.6 3.8 6.5 9.0 9.0 10.0 30.2 37.0 50.5 64.0Deferred revenue 0.4 0.4 0.0 0.0 0.0 0.0 0.0 0.0 0.0 0.0 0.0 0.0 0.0 0.0 0.0 0.0Convertible debentures 0.4 0.4 0.0 0.0 0.0 0.0 0.0 0.0 0.0 0.0 0.0 0.0 0.0 0.0 0.0 0.0Interest payable on convertible debentures 0.0 0.0 0.0 0.0 0.0 0.0 0.0 0.0 0.0 0.0 0.0 0.0 0.0 0.0 0.0Derivative financial instruments 0.0 0.0 0.0 0.0 0.0 0.0 0.0 0.0 0.0 0.0 0.0 0.0 0.0 0.0 0.0 0.0LTD 2.3 2.3 2.4 2.4 2.4 2.4 2.4 2.4 132.4 132.4 132.4 132.4 332.4 502.4 502.4 502.4Deferred income taxes 0.7 1.3 1.4 1.4 1.4 1.4 1.4 1.4 1.4 1.4 1.4 1.4 1.4 1.4 1.4 1.4Total liabilities 6.5 8.6 8.9 3.9 3.9 3.9 6.3 7.6 140.3 142.7 142.7 143.7 364.0 540.7 554.2 567.7Total equity 80.6 78.5 74.9 65.8 56.2 56.2 149.8 144.8 143.0 136.5 136.5 309.5 325.1 450.9 596.3 891.8Total liabilities and equity 87.1 87.1 83.8 69.6 60.0 60.0 156.1 152.4 283.3 279.2 279.2 453.2 689.1 991.7 1150.6 1459.5Source: Company filings and press releases; ROTH Capital Partners estimates.

Page 68 of 70
ORBITE ALUMINAE INC. (TSX: ORT) Company Note - September 17, 2012
Orbite Aluminae Inc. Philip Shen, Roth Capital Partners
(TSX: ORT) [email protected], 949 720-7198
Cash Flow Statement FY'11 Q1'12 Q2'12 Q3'12E Q4'12E FY'12E Q1'13E Q2'13E Q3'13E Q4'13E FY'13E FY'14E FY'15E FY'16E FY'17E FY'18ECAD in millions (except per share data) Dec-11 Mar-12 Jun-12 Sep-12 Dec-12 Dec-12 Mar-13 Jun-13 Sep-13 Dec-13 Dec-13 Dec-14 Dec-15 Dec-16 Dec-17 Dec-18
Net income (11.6) (3.8) (6.1) (9.1) (9.6) (29.7) (6.4) (5.0) (1.9) (6.5) (19.7) (27.0) 19.0 125.8 145.4 295.5Adj to reconcile NI to tash used in operating activitiesD&A of PPE 0.1 0.0 2.3 0.9 1.8 5.1 1.3 1.5 1.7 4.1 8.6 44.0 87.8 127.1 164.0 80.0Stock-based compensations 5.6 1.5 1.6 3.1 0.0 0.0 0.0 0.0 0.0 0.0Amortization of deferred revenues (0.1) (0.0) (0.5) (0.6) 0.0 0.0 0.0 0.0 0.0 0.0Net finance (income) expense (0.3) (0.2) (0.1) (0.3) 0.0 0.0 0.0 0.0 0.0 0.0Interest capitalized on convertible debentures and LTD 0.0 0.0 0.0 0.0 0.0 0.0 0.0 0.0Deferred income taxes 0.5 0.6 0.1 0.7 0.0 0.0 0.0 0.0 0.0 0.0Changes in non-cash working-capital itemsSales taxes and other receivables (0.1) (0.6) 0.3 (0.3) 0.0 0.0 0.0 0.0 0.0 0.0Current income taxes recoverable (0.6) (0.1)Investment tax credits an other assistance receivable (1.0) (0.2) (0.0) (0.3) 0.0 0.0 0.0 0.0 0.0 0.0Prepaid expenses and deposits (0.2) (0.1) 0.1 0.1 0.0 0.0 0.0 0.0 0.0 0.0Accounts payable and accrued liabilities 0.3 0.6 0.0 0.6 0.0 0.0 0.0 0.0 0.0 0.0Interest payable on convertible debentures 0.0 0.0 0.0 0.0 0.0 0.0 0.0 0.0Interest received 0.1 0.1 0.1 0.1 0.0 0.0 0.0 0.0 0.0 0.0Interest paid (0.0) (0.0) (0.0) (0.0) 0.0 0.0 0.0 0.0 0.0 0.0Net changes in non-cash working-capital items (0.8) (0.8) 0.4 55.3 0.0 60.1 (4.8) (2.4) (5.2) (4.8) (17.2) (1.9) (49.3) (16.4) (32.8) (32.8)Cash flows used in operating activities (6.8) (2.6) (2.3) 47.1 (7.8) 38.7 (9.8) (5.9) (5.4) (7.2) (28.2) 15.1 57.6 236.5 276.5 342.6Changes in short-term investments (64.3) 2.8 2.9 5.7 0.0 0.0 0.0 0.0 0.0 0.0Additions to patents (0.1) (0.0) (0.1) 0.0 0.0 0.1 0.0 0.0 0.0 0.0 0.0 0.0 0.0 0.0 0.0 0.0Purchases of PPE (3.5) (0.5) (3.5) (10.0) (10.0) (24.0) (5.0) (5.0) (50.0) (50.0) (110.0) (280.0) (280.0) (330.0) (320.0) (80.0)Changes in exploration funds 0.2 0.0 0.0 0.0 0.0 0.0 0.0 0.0 0.0 0.0 0.0 0.0 0.0 0.0 0.0 0.0Additions to deferred exploration expenses and mining properties (2.2) (2.6) (2.6)Cash flows (used in) from investing activities (69.8) (0.3) (3.3) (10.0) (10.0) (23.6) (5.0) (5.0) (50.0) (50.0) (110.0) (280.0) (280.0) (330.0) (320.0) (80.0)Proceeds from convertible debentures 0.0 0.0 0.0 0.0 0.0 0.0 0.0 0.0Proceeds from LTD 2.2 0.0 0.0 0.0 0.0 0.0 0.0 0.0 130.0 0.0 130.0 0.0 200.0 170.0 0.0 0.0Repayment of LTD (0.0) (0.0) (0.0) 0.0 0.0 (0.0) 0.0 0.0 0.0 0.0 0.0 0.0 0.0 0.0 0.0 0.0Issuance of capital stock and warrants 74.3 0.1 0.3 0.0 0.0 0.4 100.0 0.0 0.0 0.0 100.0 200.0 0.0 0.0 0.0 0.0Share issue expenses (4.3) 0.0 0.0 0.0 0.0 0.0 0.0 0.0Necessary to finance 0.0 0.0 0.0 0.0 0.0 0.0 0.0 0.0 0.0 0.0 0.0 0.0 0.0Cash flows from financing activities 72.2 0.1 0.3 0.0 0.0 0.4 100.0 0.0 130.0 0.0 230.0 200.0 200.0 170.0 0.0 0.0Effect of exchange rate changes (4.4) (3.4)Cash at beginning of period 12.7 8.3 5.4 0.1 37.2 8.3 19.4 104.6 93.7 168.3 19.4 111.1 46.2 20.4 96.9 53.4Cash at end of period 8.3 5.4 0.1 37.2 19.4 19.4 104.6 93.7 168.3 111.1 111.1 46.2 20.4 96.9 53.4 316.1Net increase/(decrease) in cash and cash equivalents (4.4) (2.8) (5.4) 37.1 (17.8) 11.1 85.2 (10.9) 74.6 (57.2) 91.8 (64.9) (25.8) 76.5 (43.5) 262.6B/S Beginning cash and equivalents 12.7 8.3 5.5 0.1 37.2 8.3 19.5 104.7 93.8 168.4 19.5 111.2 46.3 20.5 97.0 53.5B/S Ending cash and equivalents 8.3 5.5 0.1 37.2 19.5 19.5 104.7 93.8 168.4 111.2 111.2 46.3 20.5 97.0 53.5 316.1B/S Net change in cash (4.4) (2.8) (5.4) 37.1 (17.8) 11.2 85.2 (10.9) 74.6 (57.2) 91.8 (64.9) (25.9) 76.5 (43.5) 262.6Source: Company filings and press releases; ROTH Capital Partners estimates.

Page 69 of 70
ORBITE ALUMINAE INC. (TSX: ORT) Company Note - September 17, 2012
Regulation Analyst Certification ("Reg AC"): The research analyst primarily responsible for the content of this report certifiesthe following under Reg AC: I hereby certify that all views expressed in this report accurately reflect my personal viewsabout the subject company or companies and its or their securities. I also certify that no part of my compensation was, isor will be, directly or indirectly, related to the specific recommendations or views expressed in this report.
Disclosures:
Within the last twelve months, ROTH has received compensation for investment banking services from Orbite AluminaeInc. (TSX: ORT).
ROTH makes a market in shares of Orbite Aluminae Inc. (TSX: ORT) and Avalon Rare Metals Inc. and as such, buys andsells from customers on a principal basis.
Shares of Orbite Aluminae Inc. (TSX: ORT) may not be eligible for sale in one or more states.
On September 28, 2010, ROTH changed its rating system in order to replace the Hold rating with Neutral.
On May 26, 2011, ROTH changed its rating system in order to incorporate coverage that is Under Review.
Each box on the Rating and Price Target History chart above represents a date on which an analyst made a change to arating or price target, except for the first box, which may only represent the first note written during the past three years.Distribution Ratings/IB Services shows the number of companies in each rating category from which Roth or an affiliatereceived compensation for investment banking services in the past 12 month.
Distribution of IB Services Firmwide
IB Serv./Past 12 Mos.

Page 70 of 70
ORBITE ALUMINAE INC. (TSX: ORT) Company Note - September 17, 2012
as of 09/17/12
Rating Count Percent Count Percent
Buy [B] 208 71.72 75 36.06Neutral [N] 68 23.45 8 11.76Sell [S] 2 0.69 0 0Under Review [UR] 10 3.45 4 40.00
Our rating system attempts to incorporate industry, company and/or overall market risk and volatility. Consequently, at anygiven point in time, our investment rating on a stock and its implied price movement may not correspond to the stated 12-month price target.
Ratings System Definitions - ROTH employs a rating system based on the following:
Buy: A rating, which at the time it is instituted and or reiterated, that indicates an expectation of a total return of at least10% over the next 12 months.
Neutral: A rating, which at the time it is instituted and or reiterated, that indicates an expectation of a total return betweennegative 10% and 10% over the next 12 months.
Sell: A rating, which at the time it is instituted and or reiterated, that indicates an expectation that the price will depreciateby more than 10% over the next 12 months.
Under Review [UR]: A rating, which at the time it is instituted and or reiterated, indicates the temporary removal of theprior rating, price target and estimates for the security. Prior rating, price target and estimates should no longer be reliedupon for UR-rated securities.
Not Covered [NC]: ROTH does not publish research or have an opinion about this security.
ROTH Capital Partners, LLC expects to receive or intends to seek compensation for investment banking or other businessrelationships with the covered companies mentioned in this report in the next three months. The material, information andfacts discussed in this report other than the information regarding ROTH Capital Partners, LLC and its affiliates, are fromsources believed to be reliable, but are in no way guaranteed to be complete or accurate. This report should not be used asa complete analysis of the company, industry or security discussed in the report. Additional information is available uponrequest. This is not, however, an offer or solicitation of the securities discussed. Any opinions or estimates in this report aresubject to change without notice. An investment in the stock may involve risks and uncertainties that could cause actualresults to differ materially from the forward-looking statements. Additionally, an investment in the stock may involve a highdegree of risk and may not be suitable for all investors. No part of this report may be reproduced in any form without theexpress written permission of ROTH. Copyright 2012. Member: FINRA/SIPC.