cleantech matchmaking 2017 - wsp presentation.pdf · the wsp cleantech matchmaking concept the...
TRANSCRIPT

CleanTech
Matchmaking
2017

Actors searching for solutions
Companies to pitch
Attending companies
and organizations
Our second webinar of the year with the theme
District Heating

The agenda for today
ITEM DESCRIPTION TIME
1. Intro from Sweden – History and purpose of the event 10 minutes
2. Sweden, District Heating 10 minutes
3. Toronto, distrcit heating and their needs 10 minutes
4. Ottawa, district heating and their needs 10 minutes
5. Halifax, district heating and their needs 10 minutes
6. Pitch – Öresundskraft / Q&A 5 min / 5 min
7. Pitch – Alfa Laval / Q&A 5 min / 5 min
8. Pitch – Energy Opticon / Q&A 5 min / 5 min
9. Pitch – Regin / Q&A 5 min / 5 min
10. Pitch – Wideco / Q&A 5 min / 5 min
11. Pitch – Petro Bio 5 min / 5 min
12. Summary 10 min

To develop a global networking platform
where companies and organizations can
expand sustainable (green) business
solutions and technologies to a new
market.
The platform started 2015 between Malmö and Nova Scotia.
So far 1 company has succeeded to expand to the Canadian market. At least 6 companies has identified business opportunities and business partners, the next phase is to finalize business deals.
Several companies are today involved in our platform where they are in the “matchmaking accelerator”
Cities and areas that need new sustainable solutions are “pitched out” in a very cost efficient and easy way to find new solutions.
The business idea and results

The WSP Cleantech Matchmaking concept
The pitch
WSP together with our
partners present a case
where certain solutions is
needed and could not been
found in the country
presenting the pitch.
The match
At our webinars WSP Sweden
and WSP Canada take turns
in being the host presenting
the case. In this case Sweden
pitch and Canada present
their solutions.
The Matchmaking Journey
Companies that found their
match are offered to travel
together with WSP. During the
visit we arrange B2B meetings
which maximizes the
companies opportunities to
create more business deals in
the regions we are working in.

Ingrid Nohlgren, PhD Chem. Eng.
District Heating in
Sweden
District Energy Opportunity in Halifax
2016-09-19

District heating –58% (55 TWh or 200 PJ) of the total energy use in dwelling and non-
residential premises
1 kWh = 3.6 MJ

In almost every town (270 out of 290)
Some cities are connected with each other in order to give an even more efficientsystem
More than 18,000 km of pipes with hot water under ground… and a complex network…
Normal temperatures 80-90°C (hot side) and 40-50°C (cold side)
A heat exchanger locally (in houses) transfering heat from the network to the heatingsystem in the house
40% of the heat are cogenerated with power
Some general facts
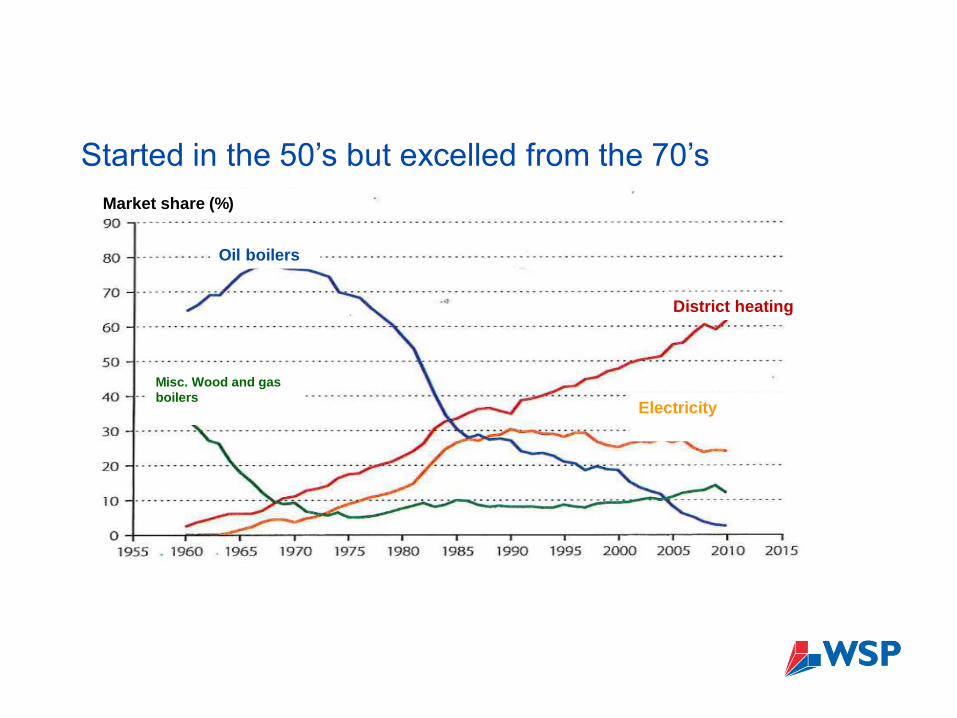
Started in the 50’s but excelled from the 70’s
Oil boilers
District heating
Misc. Wood and gas boilers
Electricity
Market share (%)

Fuels for district heating production
A major transition towards renewable fuels
Drivers
Combined heat & power production
Lower specific production costs
Cheaper fuels and higher efficiency
Use of industrial waste heat
Lower emissions
No fire hazards and less space needed in buildings
Drivers
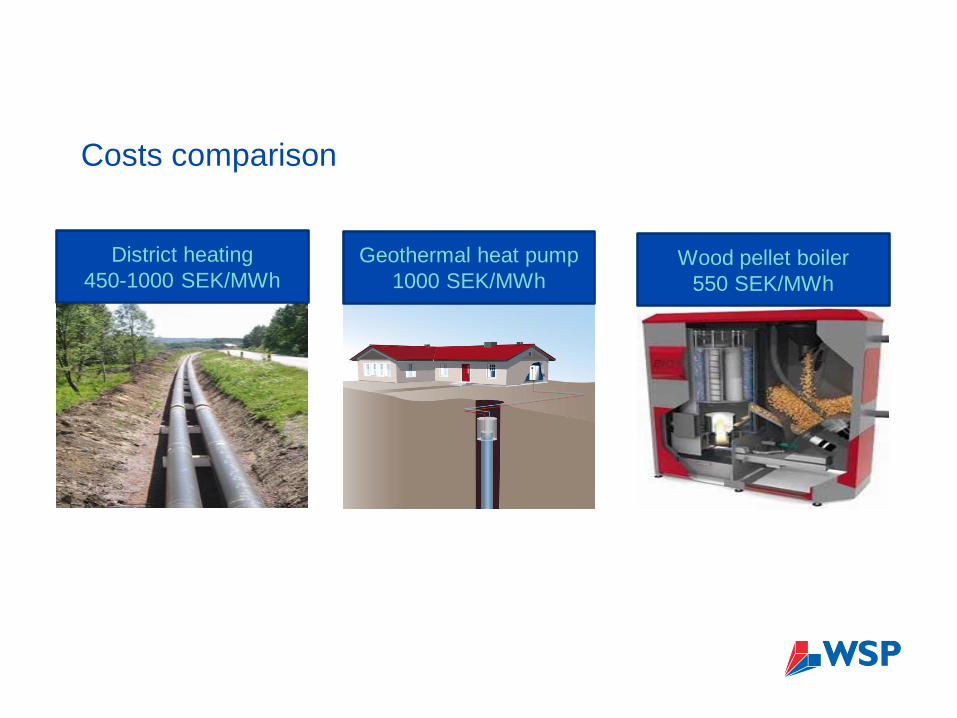
Costs comparison
District heating
450-1000 SEK/MWh
Geothermal heat pump
1000 SEK/MWhWood pellet boiler
550 SEK/MWh
Environment and Energy Division
Environment and Energy Division
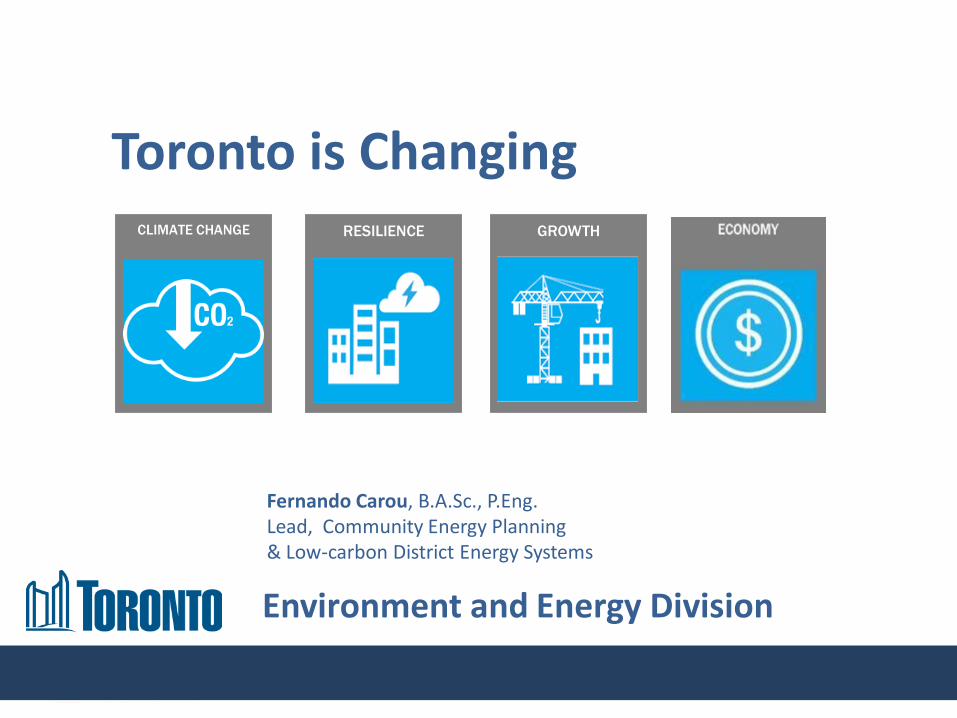
Toronto is Changing
Fernando Carou, B.A.Sc., P.Eng.Lead, Community Energy Planning & Low-carbon District Energy Systems
RESILIENCE GROWTHCLIMATE CHANGE

Environment and Energy Division
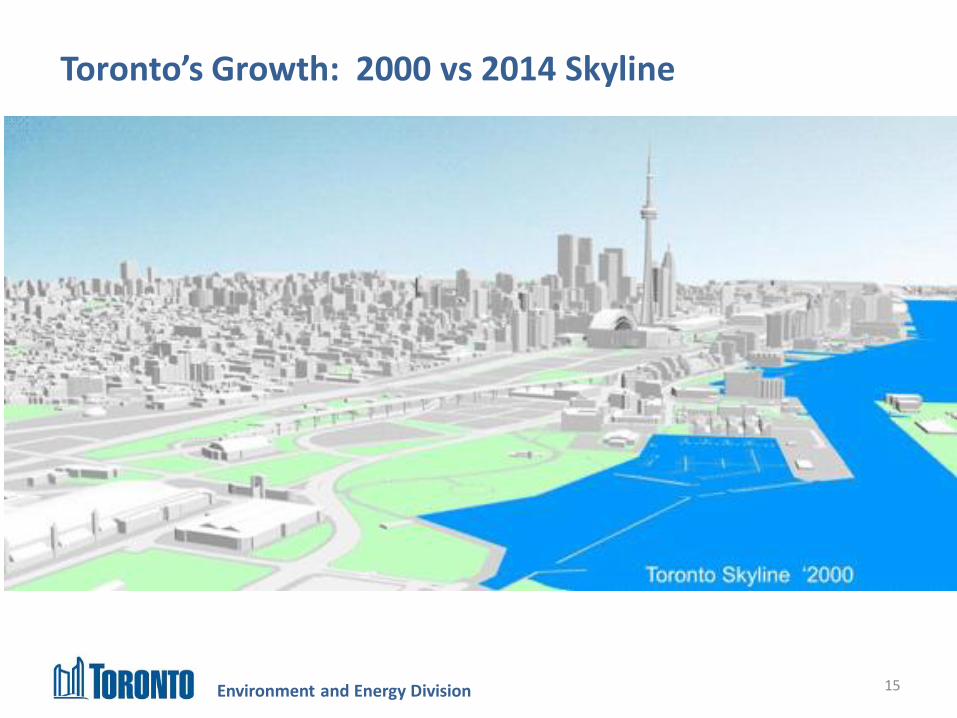
Toronto is Changing
Toronto’s population is growing &
densifying at one of the fastest
rates in North America, placing
demands on services &
infrastructure, energy systems &
the environment.
About 60% of households now live
in multi-residential housing.
14
Environment and Energy Division 15
Toronto’s Growth: 2000 vs 2014 Skyline

Environment and Energy Division 16
Toronto’s Growth: 2000 vs 2014 Skyline
Environment and Energy Division
Target 2012
Target 2020
Target 2050
0
5 000 000
10 000 000
15 000 000
20 000 000
25 000 000
30 000 000
1990 1995 2000 2005 2010 2015 2020 2025 2030 2035 2040 2045 2050
Ton
ne
s o
f G
HG
Year
17
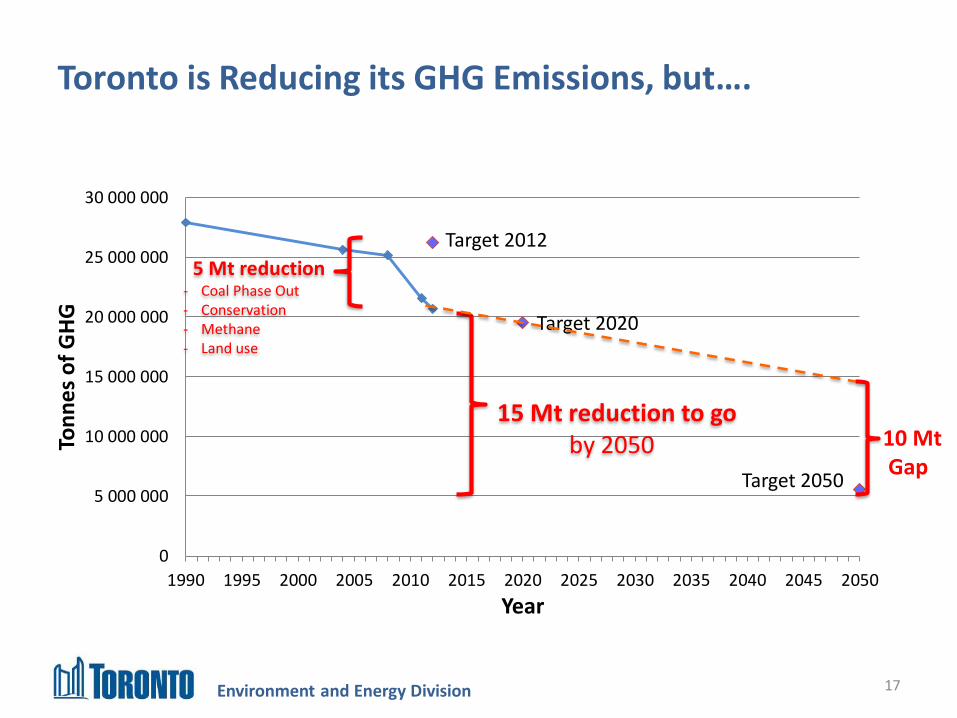
Toronto is Reducing its GHG Emissions, but….
5 Mt reduction- Coal Phase Out - Conservation- Methane - Land use
15 Mt reduction to go by 2050 10 Mt
Gap

Environment and Energy Division
Key strategies for large magnitude emissions reductions:
Efficient Buildings + Low-carbon Thermal Energy Networks to reduce/displace natural gas use in buildings.
Transit + Electric Vehiclesto reduce/displace mobile
fossil fuels.

Environment and Energy Division
Developing Toronto’s Thermal NetworksDistrict Energy w/ Large Renewables
2015 UNEP Report
Opportunity for 30+ new Low-carbon/Renewable Thermal Energy Networks in in Toronto
Environment and Energy Division
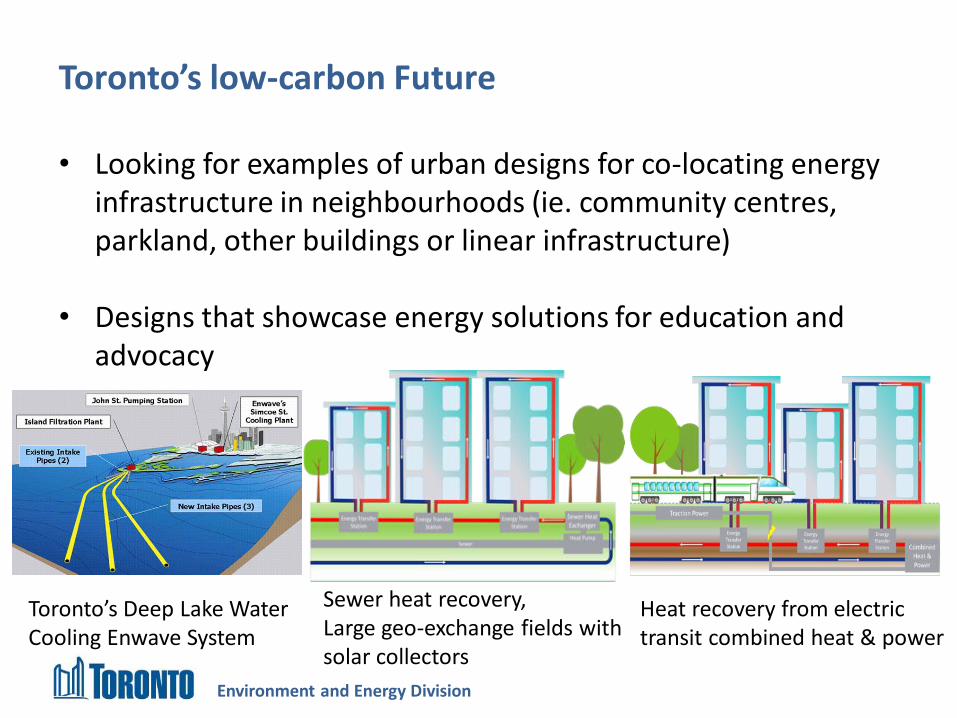
Toronto’s low-carbon Future
• Looking for examples of urban designs for co-locating energy infrastructure in neighbourhoods (ie. community centres, parkland, other buildings or linear infrastructure)
• Designs that showcase energy solutions for education and advocacy
Sewer heat recovery, Large geo-exchange fields with solar collectors
Heat recovery from electric transit combined heat & power
Toronto’s Deep Lake Water Cooling Enwave System
Environment and Energy Division
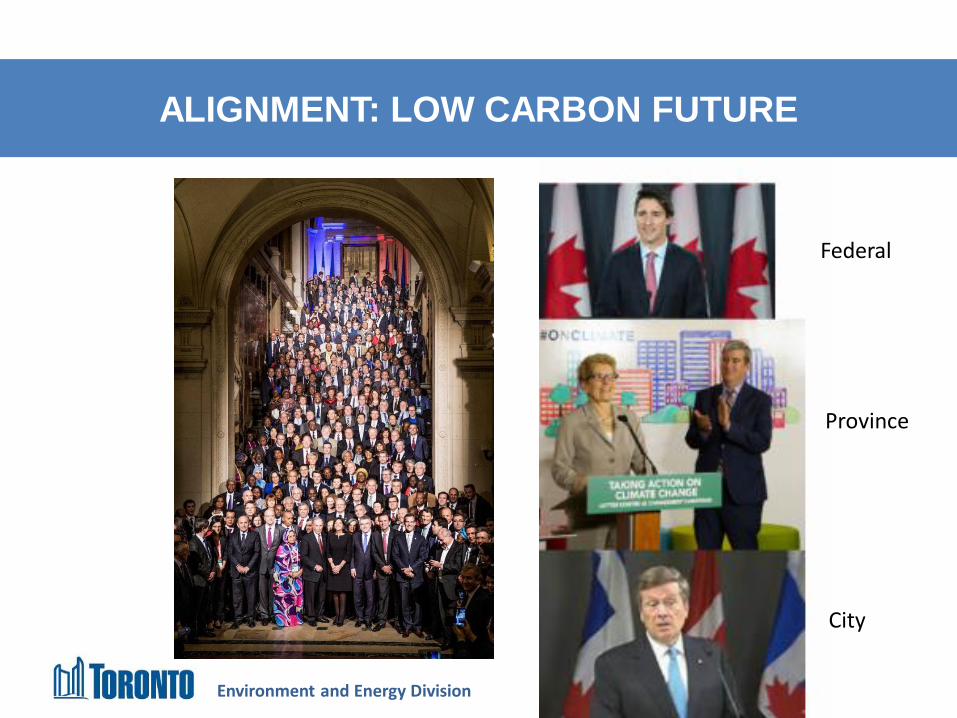
ALIGNMENT: LOW CARBON FUTURE
Federal
Province
City
Environment and Energy Division 22
Climate change will be fought in
cities. Toronto is
ready to do its part, but
we can’t do it alone –
John Tory #ParisAgreement
#COP21

An Introduction to the Government of
Canada’s District Energy System in the NCR
Presented by Tomasz Smetny-Sowa, Senior Director
Energy Services Acquisition Program (ESAP)
Public Services and Procurement Canada
Presentation for WSP Cleantech Seminar
April 11, 2017

ESAP
Program Overview
24
Energy Services Acquisition Program (ESAP)
is modernizing the District Energy System
(DES) which provides heating and cooling
services to over 80 federal buildings in the
National Capital Region (>1.6M m2 of floor
space), accommodating 55,000+ occupants
Goals & Objectives:
• Reduce Greenhouse Gas (GHG) emissions
• Reduce Costs
• Increase Safety & Reliability
• Leverage Private Sector’s Innovation &
Expertise

ESAP
ESAP Supports Key Government Priorities
25
The ESAP modernization will help the Government of Canada to meet
the following commitments:
• Paris Agreement committing Canada to reducing GHG emissions by 30%
by 2030
• Federal Sustainable Development Strategy and Greening Government
committing to lead by example by greening government operations and
reducing emissions in government buildings and fleets by 40% by 2030 at
the latest
• Pan-Canadian Framework on Clean Growth and Climate Change
committing to move toward smart and sustainable buildings that use less
energy and open the way for using renewable energy sources
ESAP
Commitments to ESAP
26
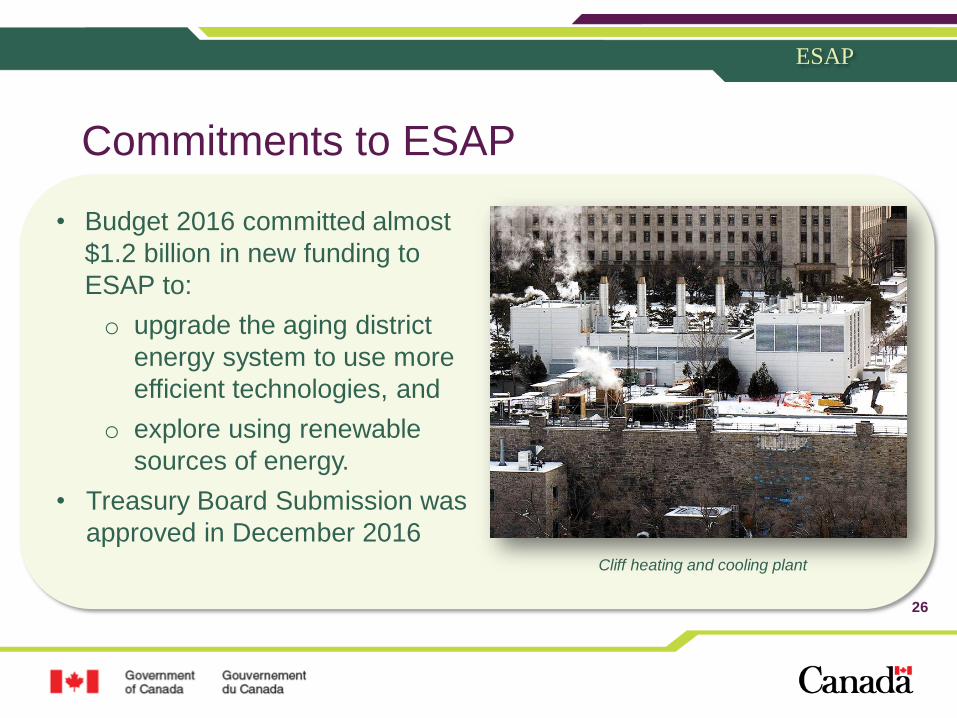
• Budget 2016 committed almost
$1.2 billion in new funding to
ESAP to:
o upgrade the aging district
energy system to use more
efficient technologies, and
o explore using renewable
sources of energy.
• Treasury Board Submission was
approved in December 2016Cliff heating and cooling plant

ESAP
The Network
27
* 78 government buildings and 3 private buildings
Year built is original plant construction date; does not reflect current condition of systems
PWGSC Central
Heating & Cooling Plants
Year
Built
# of Buildings
Heated Cooled
Cliff Plant + distribution network 1916 51 41
NRC Plant 1930 Joint with Cliff
Tunney’s Pasture Plant + distribution network 1952 18 16
Confederation Heights Plant + distribution network 1958 11 9
RCMP Plant + distribution network (closing) 1971 n/a n/a
NPB Plant 1954 1 1
81* 67

ESAP
Generating and Distribution Equipment
28
PWGSC Central
Heating & Cooling Plants
# of
Boilers# of Chillers
Tunnels
(m)*
Buried Piping
(m)*
Cliff Plant 7 6
6,600 2,050
NRC Plant 2 4
Tunney’s Pasture Plant 4 5 1,400 2 025
Confederation Heights Plant 4 5 2,075 350
RCMP Plant (closing) n/a n/a n/a n/a
NPB Plant 3 3 0 0
Totals 20 23 10,000 4,400
* approximate
ESAP
The Opportunity
29
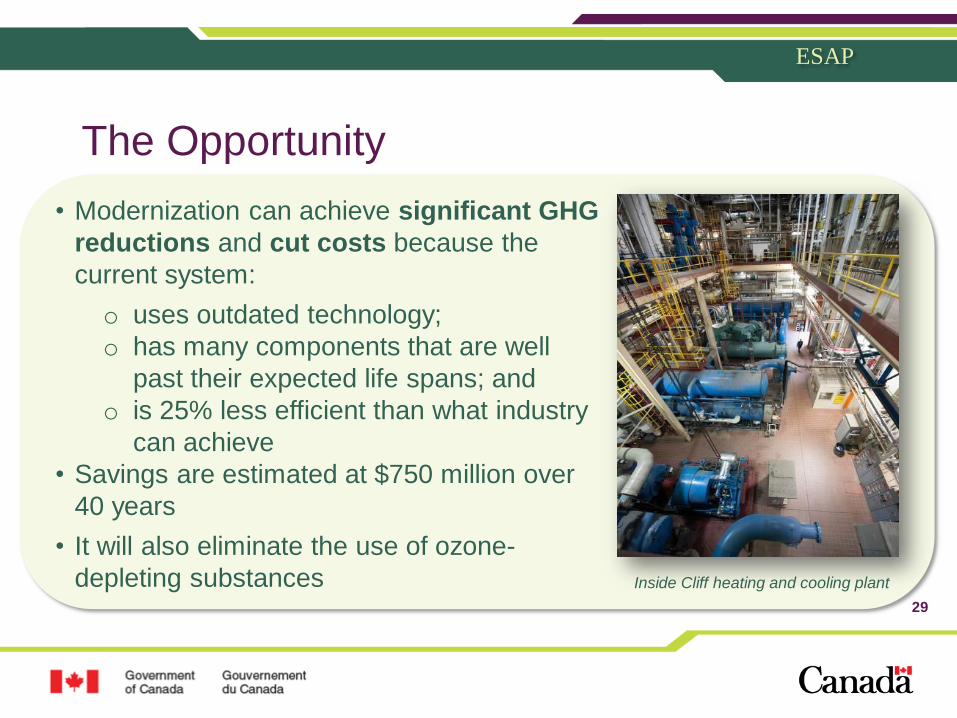
• Modernization can achieve significant GHG
reductions and cut costs because the
current system:
o uses outdated technology;
o has many components that are well
past their expected life spans; and
o is 25% less efficient than what industry
can achieve
• Savings are estimated at $750 million over
40 years
• It will also eliminate the use of ozone-
depleting substances Inside Cliff heating and cooling plant

ESAP
Future Vision
A B
C
D
E
F
• The CGPB / Green Plant
would become the Base-
Load Plant (meeting 80% of
annual demand)
• The three Plants using fossil
fuels would become the
Peaking Plants (for the top
20% of annual demand)
A
C
F
B
D
E
CGPB / Green Plant
(Using carbon-neutral fuels)
NRC Plant
To be removed
Cliff Plant
(Using fossil fuels)
Tunney’s Pasture Plant
(Using fossil fuels)
Confederation Heights Plant
(Using fossil fuels)
RCMP Plant
To be removed

ESAP
First stage – Modernization– Convert to industry-standard low temperature hot water technology
– Switch to electric chillers
– Implement Smart Buildings data analysis to pinpoint efficiencies
– Test new carbon neutral fuels for deeper greening - pilot projects,
feasibility studies
Second stage – Deeper Greening and Expansion– Convert base load to carbon neutral fuels – achieve low carbon
government
– Double the number of government buildings on the system
– Expand and share carbon neutral energy with non-GOC buildings in
the community31
The Plan
ESAP
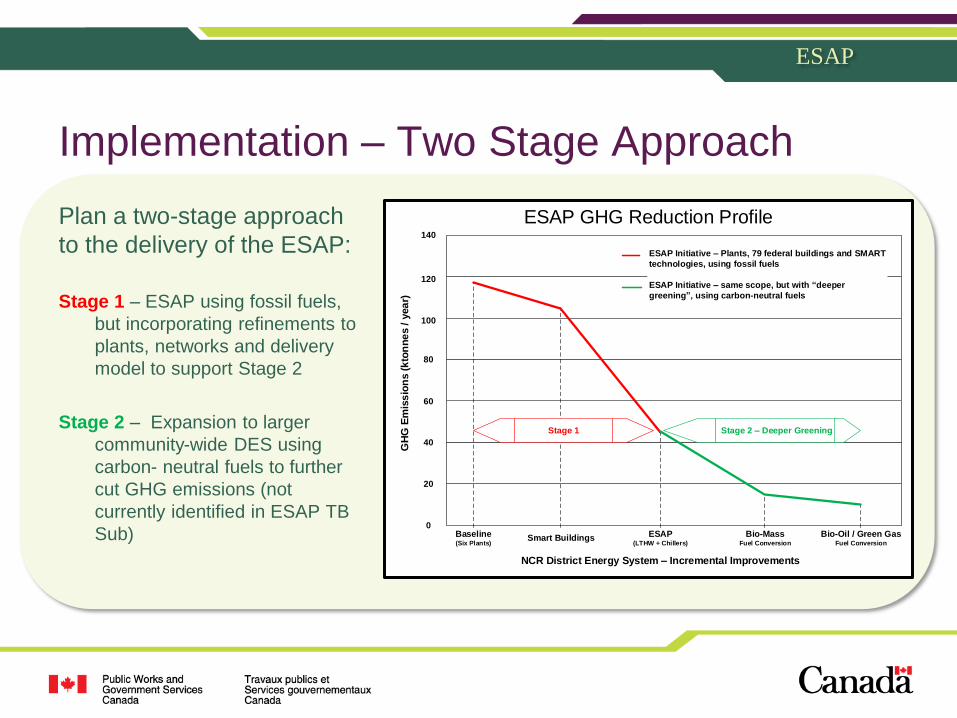
Plan a two-stage approach
to the delivery of the ESAP:
Stage 1 – ESAP using fossil fuels,
but incorporating refinements to
plants, networks and delivery
model to support Stage 2
Stage 2 – Expansion to larger
community-wide DES using
carbon- neutral fuels to further
cut GHG emissions (not
currently identified in ESAP TB
Sub)
Implementation – Two Stage Approach
140
40
60
80
100
120
20
0
GH
G E
mis
sio
ns (
kto
nn
es / y
ea
r)
NCR District Energy System – Incremental Improvements
Baseline(Six Plants)
Smart Buildings ESAP(LTHW + Chillers)
Bio-MassFuel Conversion
Bio-Oil / Green GasFuel Conversion
ESAP GHG Reduction Profile
ESAP Initiative – Plants, 79 federal buildings and SMART
technologies, using fossil fuels
ESAP Initiative – same scope, but with deeper
greening using carbon-neutral fuels
Stage 1 Stage 2 – Deeper Greening

ESAP
• Biomass – local and regional
(wood chips, pellets). Considered
to have a carbon neutral cycle
when sustainably grown,
managed, and harvested
• Green Gas – renewable methane
gas that is recovered from landfill
sites or anaerobic digesters and
purchased by natural gas
customers – it is renewable and
considered to have zero GHG
emissions
33
Low/No GHG Energy Sources
33
Biomass samples at Confederation
College – part of ongoing research
into carbon neutral fuels
ESAP
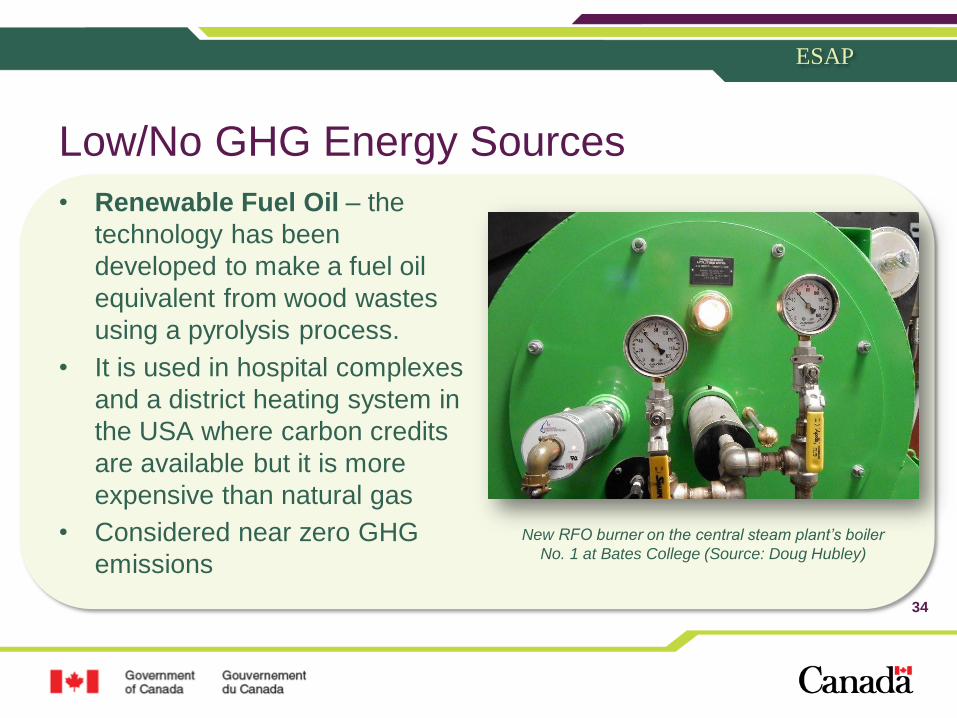
• Renewable Fuel Oil – the
technology has been
developed to make a fuel oil
equivalent from wood wastes
using a pyrolysis process.
• It is used in hospital complexes
and a district heating system in
the USA where carbon credits
are available but it is more
expensive than natural gas
• Considered near zero GHG
emissions
34
Low/No GHG Energy Sources
New RFO burner on the central steam plant’s boiler
No. 1 at Bates College (Source: Doug Hubley)

ESAP
• Industrial Waste Heat – much of the
energy used by industry is rejected as
waste heat or cooling water. With a
LTHW system, this energy can be
captured and used directly or with a
heat pump to provide energy for the
district heating system
• Waste to Energy – Common in many
European cities and a part of the
process in St. Paul, MN, burning waste
materials to generate LTHW without
significant emissions is an option
35
Low/No GHG Energy Sources
Waste-to-energy facility in
Copenhagen, Denmark

ESAP
With deeper
greening we
can offer low
carbon
solution to the
community
36
Growth and Expansion Potential
Existing PWGSC
DES locations
Potential DES
Growth and
Expansion
Other DES
in operation (University of
Ottawa, Carleton University,
local hospitals)

ESAP
• We cannot comment on the
ongoing procurement
process
• A letter of intent is available
on buyandsell.gc.ca
• Any procurement questions
would need to be sent to
PASE.ESAP@tpsgc-
pwgsc.gc.ca
37
A Note on Procurement


Delivering Quality & Value For Over 70 Years
Cogswell District Energy
Project Update
WSP Matchmaking EventApril 11th, 2017

District Energy at Halifax Water
• 2010 investigation demonstrated feasibility in Bedford (Mill Cove
WWTF) and downtown Halifax (Halifax WWTF)
• 2016 Feasibility study completed by DEC Engineering for Halifax Water
shows a positive business case for a DES within the Cogswell
redevelopment area
• Ambient Temperature DES shown to be the most promising, cost
effective and efficient system for the Cogswell redevelopment area
40 Cogswell ATDES Update – WSP Matchmaking Event – April 11th, 2017

Benefits of District Energy
• Improved Energy Efficiency
• Improved Local Air Quality
• Reduced GHG Emissions
• Environmental Protection
• Energy Resilience & Access
• Ease of Operation & Maintenance
• Reliable, Proven Technology
• Comfort & Convenience
• Decreased Life-Cycle Costs
• Decreased Developer Costs
• Decreased Building Capital Costs
• Improved Architectural Design
Flexibility
• Improved Marketability & Value of
Real Estate
41 Cogswell ATDES Update – WSP Matchmaking Event – April 11th, 2017

Why Ambient Temperature?
• Ambient Temperature DES Advantages:
• Lower capital cost – no large energy center
• Modular build out – delivers only energy that is needed by the connected load
• Less DES piping losses – better energy efficiency
• Individual back-up systems in each building – better security of supply
• Opportunities for heat recovery and renewable supply:
• Distributed Solar
• Building Heat Sharing
• Connected CHP
42 Cogswell ATDES Update – WSP Matchmaking Event – April 11th, 2017

District Energy Systems – Proven Technology
• Cheakamus Crossing ATDES, Whistler, BC (2010, WW Effluent)*https://www.whistler.ca/services/water-and-wastewater/district-energy-system
http://www.cheakamuscrossing.ca/
• Southeast False Creek DHS, Vancouver, BC (2010, Raw Sewage)*http://vancouver.ca/home-property-development/southeast-false-creek-neighbourhood-energy-utility.aspx
http://vancouver.ca/docs/planning/renewable-energy-neighbourhood-utility-factsheet.pdf
• Saanich ATDES, Victoria, BC (2011, WW Effluent)*https://www.crd.bc.ca/project/past-capital-projects-and-initiatives/saanich-peninsula-water-transmission-main-heat-recovery
https://www.pembina.org/reports/ctax-casestudy-saanich.pdf
• Markham District Energy, Markham, ON (2000 + 2012, NG CHP)*http://www.markhamdistrictenergy.com/
https://www.markham.ca/
• Alexandra DEU, Richmond, BC (2015, AT Geo-Exchange)*
http://www.richmond.ca/sustainability/energysrvs/districtenergy/energyutility.htm
• Marine Gateway, Vancouver, BC (2015, Geo-Exchange ATDES)
http://marinegateway.com/ambitious-mix-marine-gateway/
• University of British Columbia, Kelowna, BC (2011, AT Geo-Exchange)
http://facilities.ok.ubc.ca/geoexchange/des-operation.html
• Many other Canadian, US, European and Asian Applications
* Examples of municipally mandated district energy systems
43 Cogswell ATDES Update – WSP Matchmaking Event – April 11th, 2017

Image Credits: False Creek Energy Centre
District Energy Systems - Energy from Wastewater
44 Cogswell ATDES Update – WSP Matchmaking Event – April 11th, 2017

District Energy Systems - Energy from Wastewater
Photo Credit: Resort Municipality of Whistler
45 Cogswell ATDES Update – WSP Matchmaking Event – April 11th, 2017

DES Supply
DES Return
Future DES Connections
Cogswell DES – Energy from Wastewater
EnergyTransferStation
Legend
Image Credit: Ekistics Planning & Design
46 Cogswell ATDES Update – WSP Matchmaking Event – April 11th, 2017

Halifax WWTF Effluent Heat Capacity
Halifax WWTF 2013 Data
47 Cogswell ATDES Update – WSP Matchmaking Event – April 11th, 2017
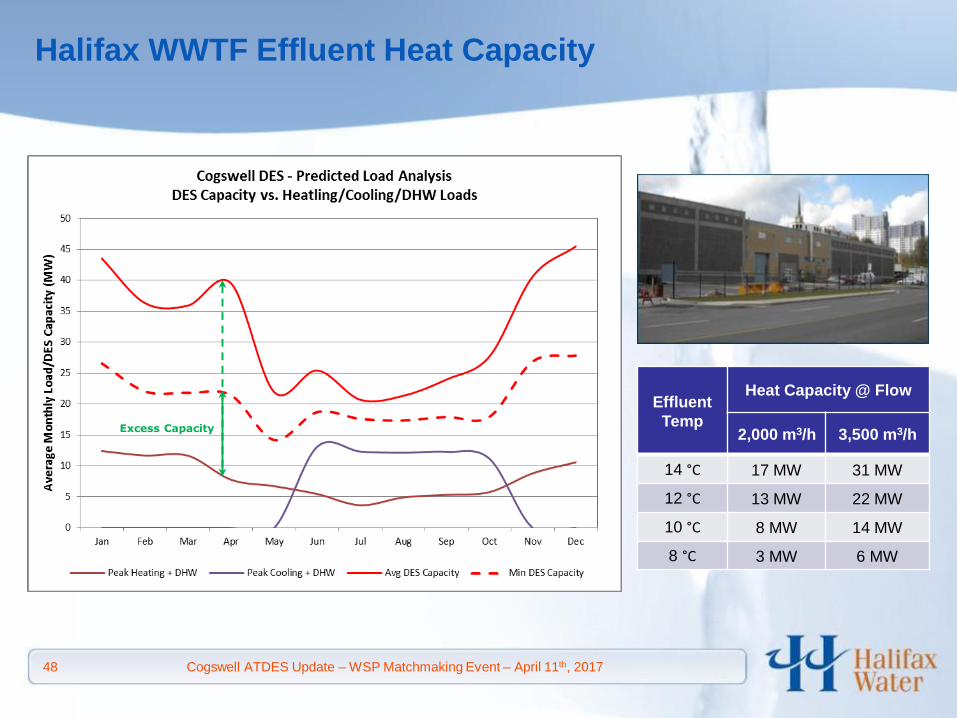
Halifax WWTF Effluent Heat Capacity
Effluent
Temp
Heat Capacity @ Flow
2,000 m3/h 3,500 m3/h
14 °C 17 MW 31 MW
12 °C 13 MW 22 MW
10 °C 8 MW 14 MW
8 °C 3 MW 6 MW
Excess Capacity
48 Cogswell ATDES Update – WSP Matchmaking Event – April 11th, 2017

Electric
Baseboard
Heating
Air Source
Heat Pump
Heating +
Cooling
Gas Hydronic
Heating
(BAU) (4)
Oil Hydronic
Heating
ATDES
Heating +
Cooling
Heating Energy 1 MWh
Fuel Source Electricity Electricity Natural Gas Heating OilElectricity +
DES
Efficiency 100% 240% 85% 80% 420%
Fuel Use1.00 MWh
Electricity
0.42 MWh
Electricity
1.18 MWh
Natural Gas
1.25 MWh
Heating Oil
0.24 MWh
(Electricity)
0.76 MWh (DES)
Fuel Rate
($/MWh)$149.54 (1) $149.54 (1) $50.40 (2) $69.70 (3) $149.54 (1)
Fuel Cost
($/MWh
Delivered Heat)
$149.54 $62.81 $59.47 $87.13 $35.60
GHG Emissions
(tCO2e/MWh
Delivered Heat)
0.652 0.274 0.212 0.313 0.166 (5)
Halifax Heating Energy Source Comparison
Notes:
(1) Based on NSPI Rate Class 2 – Domestic, May 2016.
(2) Based on Heritage Gas, Rate 1 – Residential, May 2016
(3) Based on #2 Fuel Oil @ $0.75/L
(4) BAU = Business As Usual
(5) Does not include GHG emissions from back-up heat source (NG)
49 Cogswell ATDES Update – WSP Matchmaking Event – April 11th, 2017
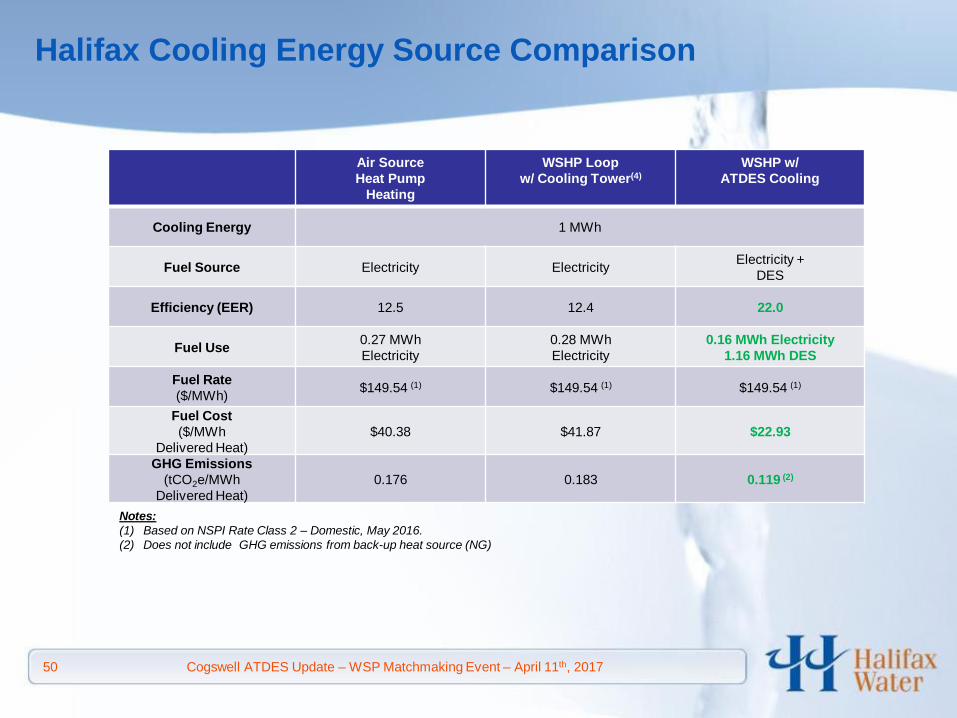
Air Source
Heat Pump
Heating
WSHP Loop
w/ Cooling Tower(4)
WSHP w/
ATDES Cooling
Cooling Energy 1 MWh
Fuel Source Electricity ElectricityElectricity +
DES
Efficiency (EER) 12.5 12.4 22.0
Fuel Use0.27 MWh
Electricity
0.28 MWh
Electricity
0.16 MWh Electricity
1.16 MWh DES
Fuel Rate
($/MWh)$149.54 (1) $149.54 (1) $149.54 (1)
Fuel Cost
($/MWh
Delivered Heat)
$40.38 $41.87 $22.93
GHG Emissions
(tCO2e/MWh
Delivered Heat)
0.176 0.183 0.119 (2)
Halifax Cooling Energy Source Comparison
Notes:
(1) Based on NSPI Rate Class 2 – Domestic, May 2016.
(2) Does not include GHG emissions from back-up heat source (NG)
50 Cogswell ATDES Update – WSP Matchmaking Event – April 11th, 2017

Conclusions
1. Initial analysis shows a positive business case for the Cogswell DES.
2. The Cogswell DES project would demonstrate environmental leadership in the community.
3. Ambient Temperature DES from wastewater heat recovery is a demonstrated and reliable solution.
4. Halifax WWTF effluent has sufficient thermal energy to meet the heating and cooling requirements of the proposed DES loads and much more.
5. The DES can offer the customer thermal energy more cost effectively and with more rate stability compared to conventional natural gas, electricity, or heating oil systems.
51 Cogswell ATDES Update – WSP Matchmaking Event – April 11th, 2017

Conclusions
6. Halifax Water ownership advantages include:• Existing operating expertise;• Existing billing and customer service systems;• Lower cost of financing;• Secure public utility.
7. The proposed DES would likely be considered a “public utility” under the definition of the Public Utilities Act and interpretations provided by the Utilities and Review Board.
8. Cogswell DES Business Case depends on mandatory connection to the system within the Cogswell development area. Additional customer connections would improve the energy rate and the business case.
52 Cogswell ATDES Update – WSP Matchmaking Event – April 11th, 2017
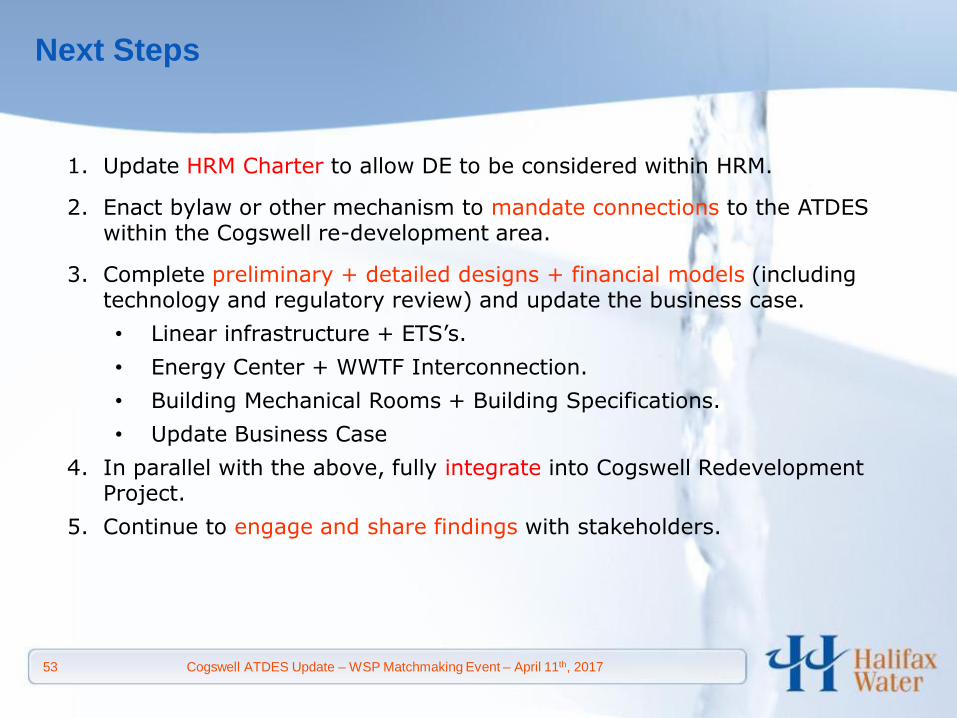
1. Update HRM Charter to allow DE to be considered within HRM.
2. Enact bylaw or other mechanism to mandate connections to the ATDES within the Cogswell re-development area.
3. Complete preliminary + detailed designs + financial models (including technology and regulatory review) and update the business case.
• Linear infrastructure + ETS’s.
• Energy Center + WWTF Interconnection.
• Building Mechanical Rooms + Building Specifications.
• Update Business Case
4. In parallel with the above, fully integrate into Cogswell Redevelopment Project.
5. Continue to engage and share findings with stakeholders.
Next Steps
53 Cogswell ATDES Update – WSP Matchmaking Event – April 11th, 2017

Thank you!
For Further Information Contact:
Jeff Knapp, P.Eng., FEC, CEM
Manager, Energy Efficiency
Halifax Regional Water Commission
(902) 471-2791
54 Cogswell ATDES Update – WSP Matchmaking Event – April 11th, 2017

www.alfalaval.com
Make it or break it in district heatingThe importance of efficiency in DH systems
Joe Garcia
Heating and Cooling Systems

www.alfalaval.com
A global company, key figures 2015
• Heat transfer
• Separation
• Fluid handling
• Founded in 1883
• Represented in > 100 countries
• ~17 500 employees globally
• Turnover of 4 billion €
3 Key technologies

www.alfalaval.com© Alfa Laval© Alfa Laval
The global driver of Heat Exchanger
Development

www.alfalaval.com
50+ years of expertise Our history of heat exchanger systems
Since 1964 we have been a
leading producer of optimized
prefabricated heat exchanger
systems for space heating and/or
domestic hot water.

www.alfalaval.com© Alfa Laval Slide 59© Alfa Laval Slide 59
Design criteria to reach high efficiency in DH
The key design principle to achieve high
efficiency in district heating is to implement
solutions that ensures
LOW PRIMARY RETURN
TEMPERATURE

www.alfalaval.com
One example:
- In Helsinki, Finland, the District
Energy Company, HELEN Ltd saves
yearly $1M if DH return temperature
is decreased with 1°C

www.alfalaval.com
Low return temperature, why?
Solutions with low return temperature and a high delta T reduces the flow in the distribution system.
A low flow in the distribution system:
• Reduces the DN-sizes of piping in the system = CAPEX savings
• Reduces investments cost for pipes, pumps, valves etc. = CAPEX savings
• Reduces the use of electricity for circulation pumps = OPEX savings
• Less mass flow at a lower temperature means less heat losses in the distribution = OPEX savings

www.alfalaval.com
District Heating, DHW, District Cooling- a full range of prefabricated systems/solutions
Slide 62

www.alfalaval.com
Benefits of using ETS
Slide 63
o Modular Design• Break Points
• Plug-n-Play
• Quick Connections
o Cost Efficiency• Standardized Designs
• Quicker Delivery
• Quicker Installation Time
o Energy Efficiency• Pumps
• Eco-Functions

www.alfalaval.com© Alfa Laval Slide 64
Alfa Laval – some global references
© Alfa Laval Slide 64
Ronneby
Hus
9 residential
blocks, Housing
complex- Maxi
& Midi Units
Stanford University- 129 Maxi Units
heating the University buildings
Roeselare,
Belgium1 Maxi sub-
station and 74
Mini City HIU
installed
Tallin
Estonia800 Maxi units
supplied to feed
from a city
district heating
scheme to
individual
buildings.

Restricted © Energy Opticon AB 2016 All rights reserved
Energy Optima 3April 11, 2017
Economical Production Optimization, Accurate Load Forecasts & Easier Energy Trading
Björn Malmström, Energy Opticon AB

Restricted © Energy Opticon AB 2016 All rights reserved
Energy Opticon
• Founded in 1989 – Know-how since almost 30 years
• Delivers software for economical production optimization, accurate load forecasting, trading support tools and optimization of the district heating network for energy companies with Energy Optima 3
• 20 specialists in Lund, Sweden
• Big international partners for deliveries and local service, ex:
• Large base of satisfied customers (more than 50 in Europe)
• Uses the quality norms ISO 9001:2015
Short company facts

Restricted © Energy Opticon AB 2016 All rights reserved
Economical benefit 2010-2012 with
Decrease of variable operation costs: 1,8 MEUR/year
Example: Benefit of economical follow-up with Energy Optima 3

Restricted © Energy Opticon AB 2016 All rights reserved
How to increase incomes with short- and long-term optimization
Short-term (for the current time, day-ahead and current weeks)
• Optimized start or stop of production units
• The most economical fuel choice
• Planning of the electricity production according to the market ...
Long-term
• Contracts for fuel and energy supply
• Planning of revisions and maintenance
• CO2 planning
• Calculation and investment choices
Examples of decisions that can improve the economy of the energy companies:

Restricted © Energy Opticon AB 2016 All rights reserved
Energy Optima 3
Software for:
• Production Optimization
• Accurate Forecasts
• Support for Energy Trading
• Optimization of the District Heating Network
• Advanced Reporting (Business Intelligence)
Energy Optima 3 – The modules
Production Optimization
Forecasts
Trading
System
Smart Optima Heat Network
Measurements
Long-term
Short-term
Long-term
Reserve power
SpotIntraday
Spot day ahead
District heating/cooling
Electricity Gas & Steam Wind & Solar
SimulationsBusiness
IntelligenceWork Flow
EngineEO3 Cloud
Standard software
ROI <= 1 year
Support andService contract
Restricted © Energy Opticon AB 2016 All rights reserved
Thank you for your attention
Published by and Copyright 2017:
Energy Opticon AB
Scheelevägen 17S-223 70, Lund, Sweden
Contact:
Björn Malmström
Tel.: +46 (0) 46 286 23 75
Mobile: +46 (0)708 18 23 70
E-mail: [email protected]
www.energyopticon.comPlease contact us for more information!
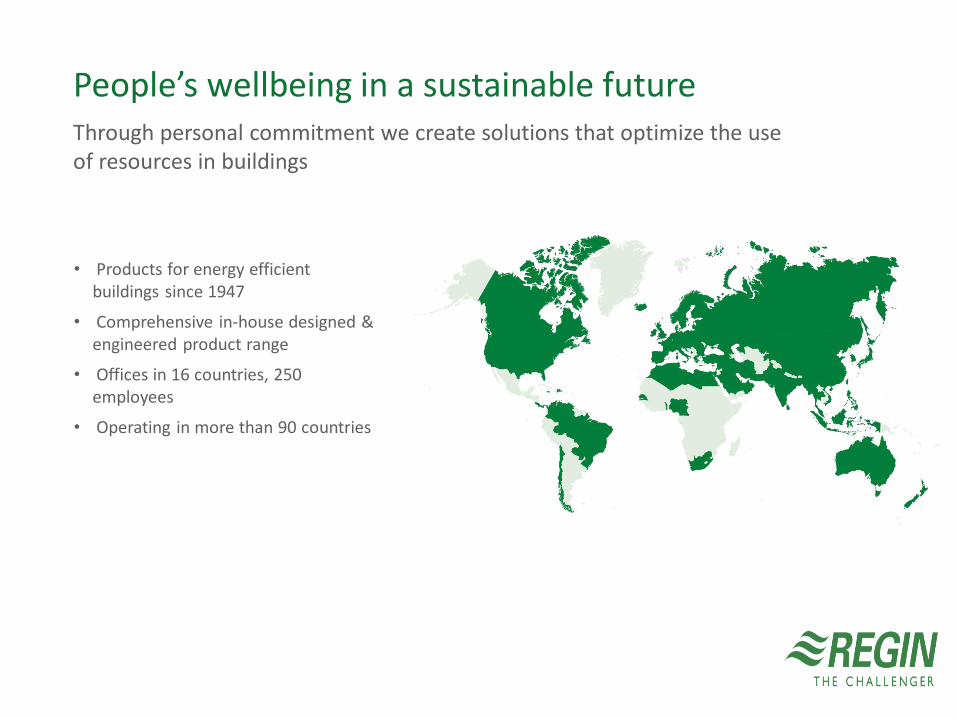
• Products for energy efficient buildings since 1947
• Comprehensive in-house designed & engineered product range
• Offices in 16 countries, 250 employees
• Operating in more than 90 countries
Through personal commitment we create solutions that optimize the use of resources in buildings
People’s wellbeing in a sustainable future

How can we improve the service level and engage end-users through smart apps and cloud solutions
District heating systems
“Various incentives exist for Local Authorities to develop a heat
network scheme. The most common reasons are to generate new
revenue streams and secure affordable energy for its citizens,
while also reducing carbon emissions”Opportunities in the UK Heat Networks Market and options for entry, 2016

District HeatingEveryone wants to engage?

Back then

Yesterday
Vent RadVV
VP
VP
VVC
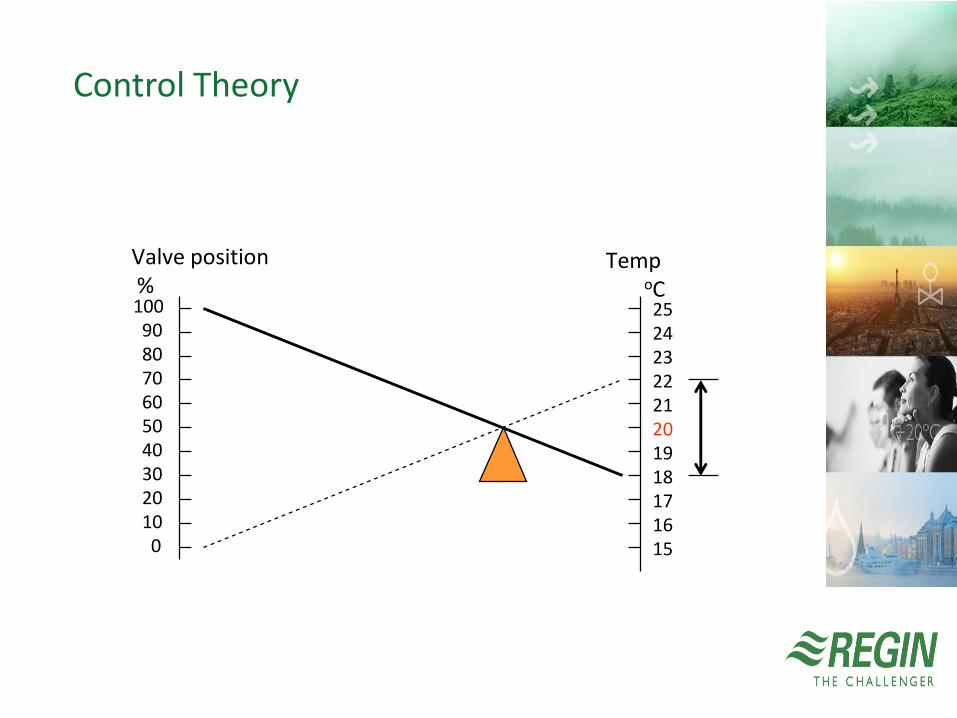
Control Theory
1009080706050403020100
2524232221201918171615
Valve position%
TempoC

In Every Level
Added value
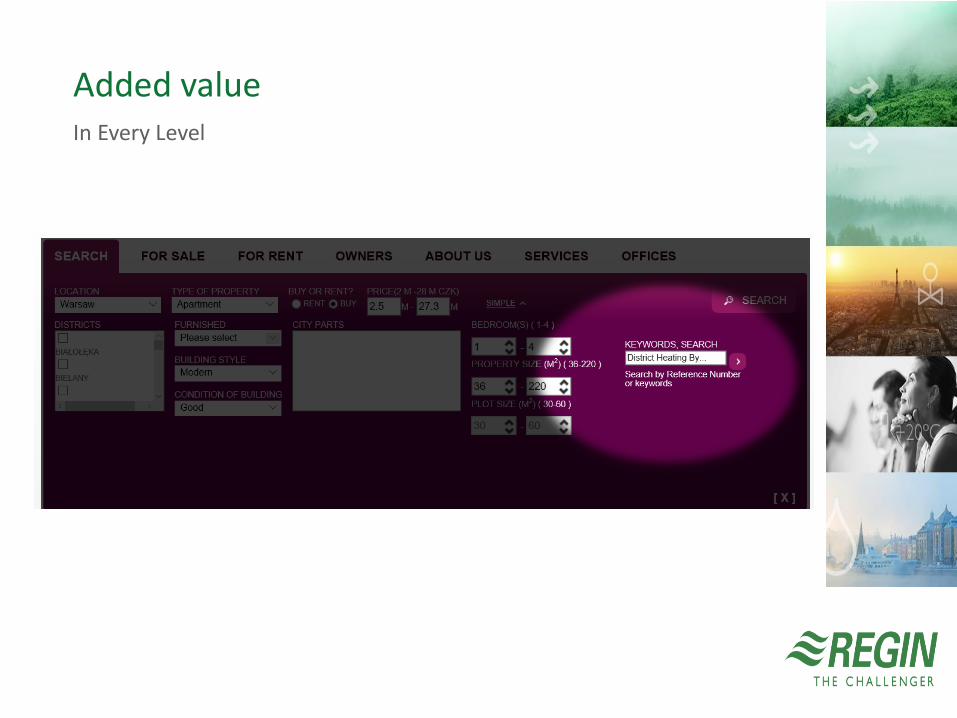
In Every Level
Added value

Creating value through networking
Our Challenge
E N E R G Y P R O V I D E R S H A V E A R E S P O N S I B I L I Y T O I N T E R A C T I N O R D E R T O C R E AT E A S U S TA I N A B L E F U T U R E

SERVICE
MARKETING
PRODUCTION
SUPPORT
ELECTRICITY
DISTRICT HEATING
GAS
ENERGY SUPPLIERS
CLOUD SERVICES
ENERGY PRODUCTION
Wind powerWater powerBiogasWaste heatWaste to energyGas burner

Adapted to the user group
Service and Communication
Common end-user Expert

District HeatingEveryone wants to engage?
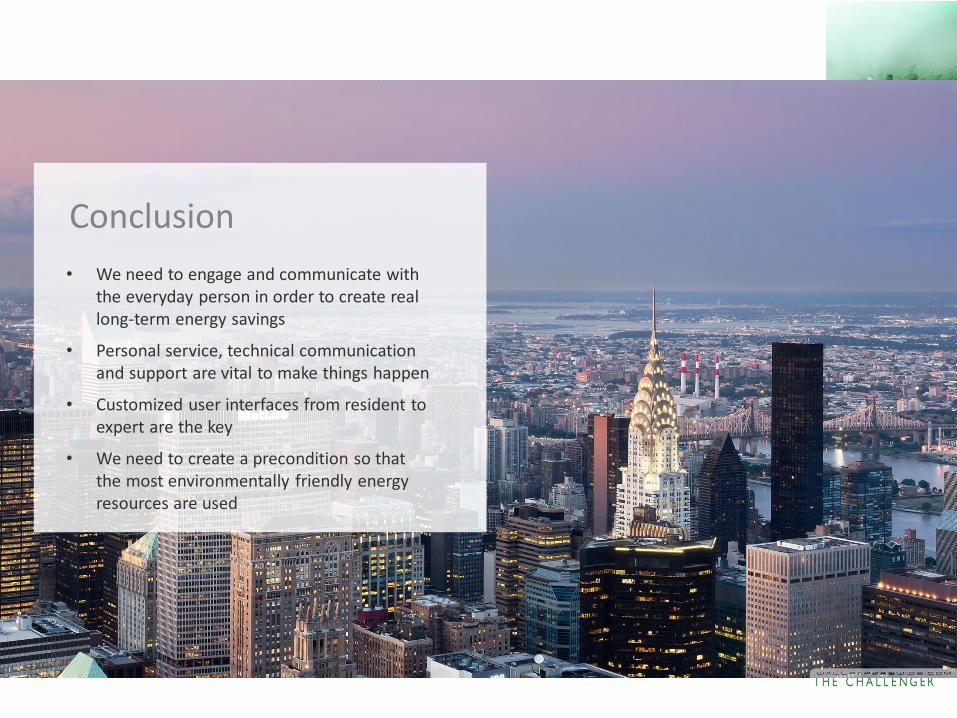
Conclusion
• We need to engage and communicate with the everyday person in order to create real long-term energy savings
• Personal service, technical communication and support are vital to make things happen
• Customized user interfaces from resident to expert are the key
• We need to create a precondition so that the most environmentally friendly energy resources are used

Johan Hervéus, Export SalesThanks for listening

About Wideco
• Established in 1982
• Close to four decades of experience in leakage detection
systems and advanced sealing systems
• Ownership & development of all systems in-house
• Focus on long-term partnerships / sustainability
• 20 employees. HQ in Boras.

RedDetect®
Our values

Our brands
Unique static and portable leakage
detection system
Advanced sealing system

Established brand

Value Proposition
Total control of your pipe networks
“Wideco has developed a unique portable and static monitoring system
that accurately locates moisture and faults along pipes and in chambers.
Using wireless technology, our leakage detection system notifies you
immediately when leaks or faults occur, giving you the possibility to
quickly act before they turn into costly problems.
Our systems have been continuously developed and optimized over a
period of 35 years and successfully installed in thousands of projects
worldwide.”
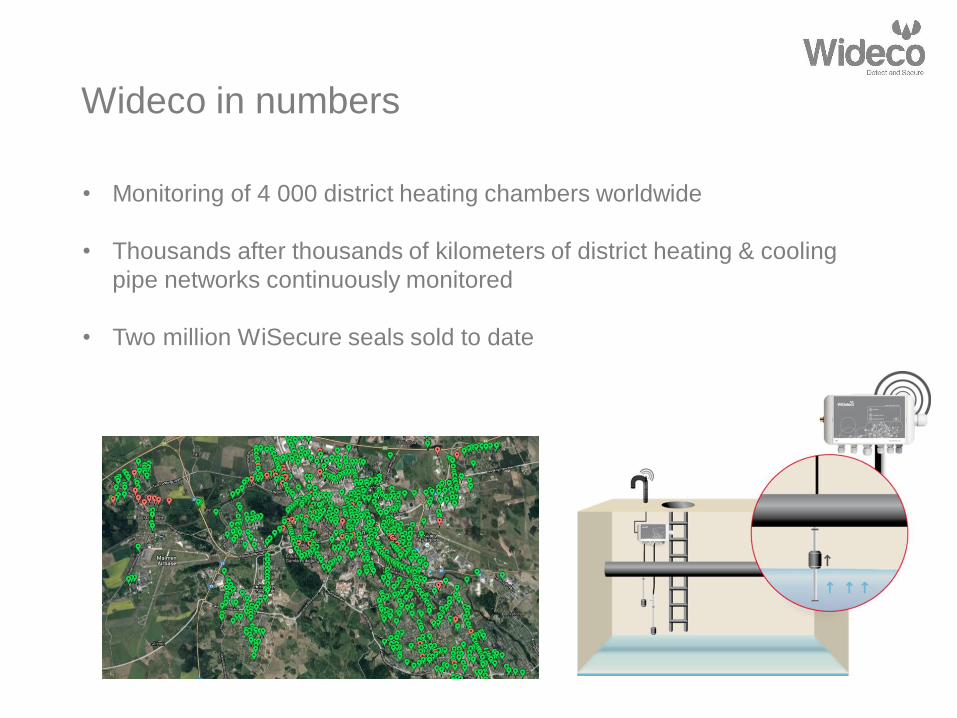
Wideco in numbers
• Monitoring of 4 000 district heating chambers worldwide
• Thousands after thousands of kilometers of district heating & cooling
pipe networks continuously monitored
• Two million WiSecure seals sold to date
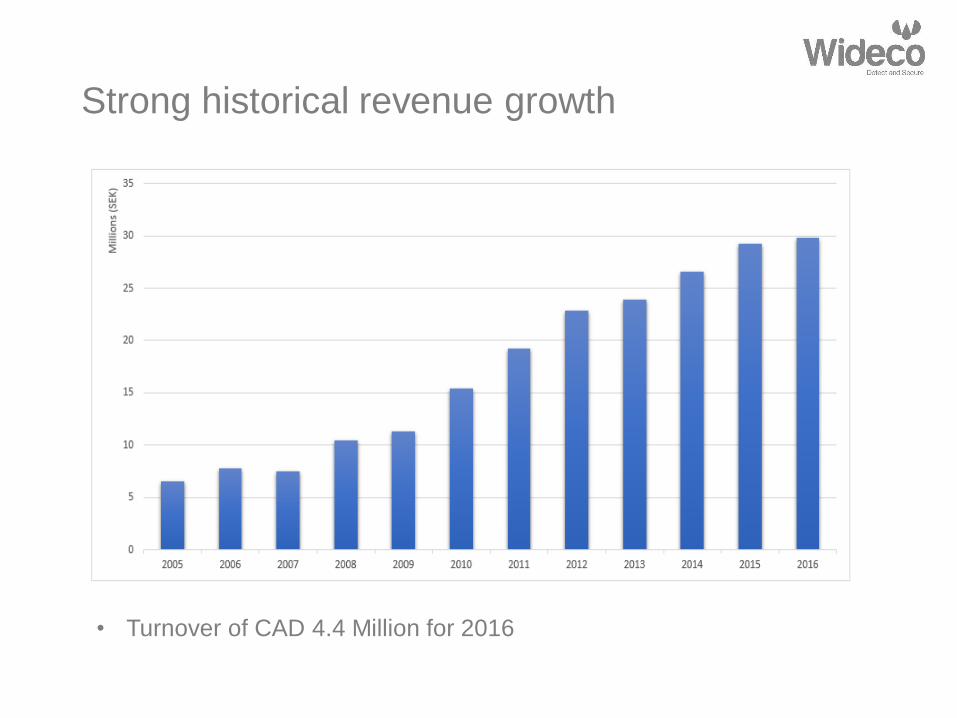
Strong historical revenue growth
• Turnover of CAD 4.4 Million for 2016

Vision 2020 – Expansion to new markets
• Turnover of CAD 7.5 Million by 2020

Geographical distribution 2020

Unique selling points
• Four decades of experience
• Market leading brand in Nordic countries, Middle East & parts of Asia
• All systems and products developed and maintained in-house
• Complete hosting & monitoring solution offering high reliability
• Utilizes the latest technology within time domain reflectometry (TDR) to
accurately locate moisture and faults to the nearest meter
• Fully prepared and focused on international expansion

Leaks are a global phenomenon.
So is our mission.
Wideco Group 2017

PETRO BIO AB
COMPANY PRESENTATION

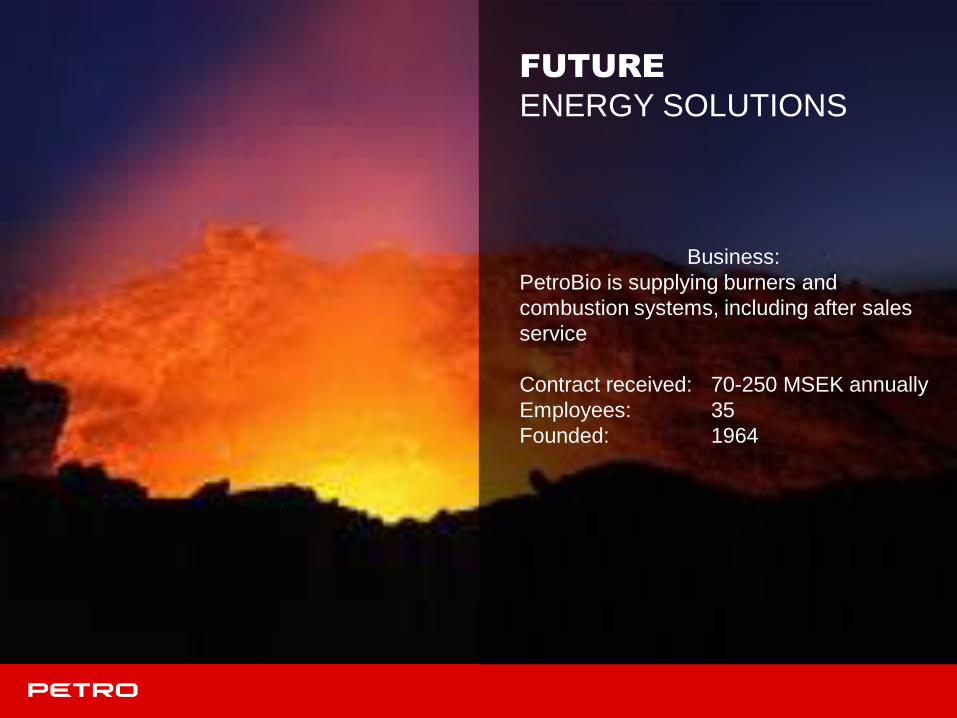
FUTURE
ENERGY SOLUTIONS
Vision:
PetroBio contribute globally and locally
to a better environment and better
climate for future generations
FUTURE
ENERGY SOLUTIONS
Business:
PetroBio is supplying burners and
combustion systems, including after sales
service
Contract received: 70-250 MSEK annually
Employees: 35
Founded: 1964

COMBUSTION SOLUTIONS
Solid biomass
• Combustion of dry biomass, wood in most cases
• Milled to wood powder
• Delivered as pellet
• Use of flame combustion
• 2MW to 100MW
Main advantage
• Retrofit of old boilers (oil or gas)
• Rapid change of out-put (same as oil and gas)
• Good ROI
Applications
• DH - peak load in winter. Base load in summer
• CHP
• Industrial steam production

COMBUSTION SOLUTIONS
Wood Powder
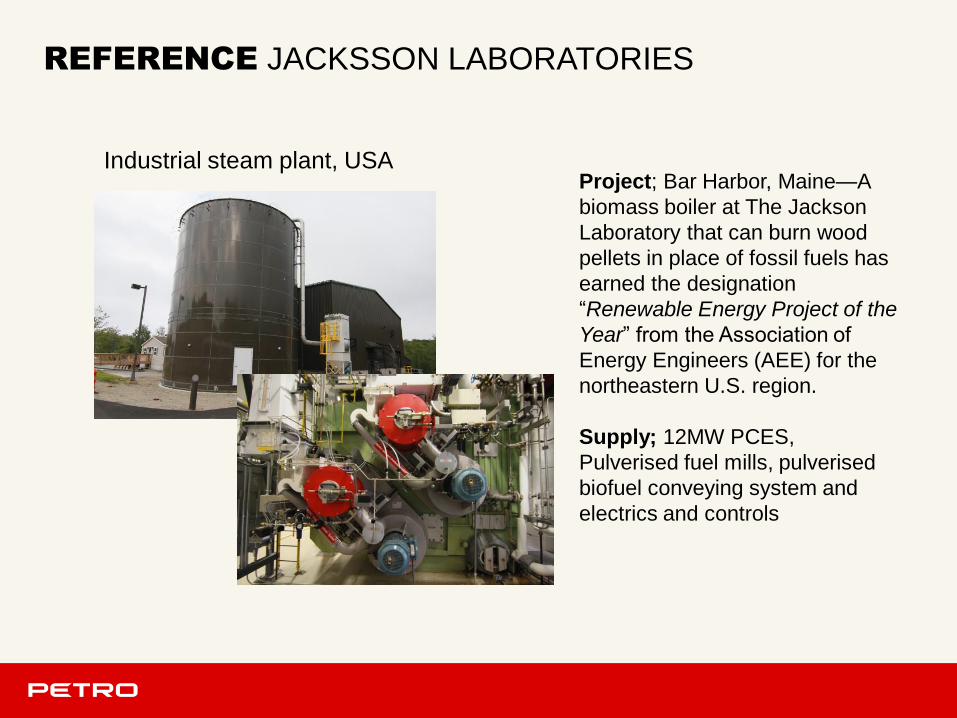
REFERENCE JACKSSON LABORATORIES
Project; Bar Harbor, Maine—A
biomass boiler at The Jackson
Laboratory that can burn wood
pellets in place of fossil fuels has
earned the designation
“Renewable Energy Project of the
Year” from the Association of
Energy Engineers (AEE) for the
northeastern U.S. region.
Supply; 12MW PCES,
Pulverised fuel mills, pulverised
biofuel conveying system and
electrics and controls
Industrial steam plant, USA

REFERENCE ATRIA
Project; Atria is a major producer
of food under brands such as
Sibylla, Lithells and Ridderheims.
In autumn 2015, Atria brought
into operation a new steam plant
that can supply 6 MW of steam,
based on wood powder, to the
plant in Sköllersta.
Supply; The new boiler house
was placed in the yard next to the
factory. In this way Atria
experienced minimal disruption in
production during construction. It
was delivered to Sköllersta in four
prefabricated modules and was
assembled into one unit at site. It
was then supplemented with a
pellet silo, a flue gas filter and a
stack.
Industrial steam plant, Sweden
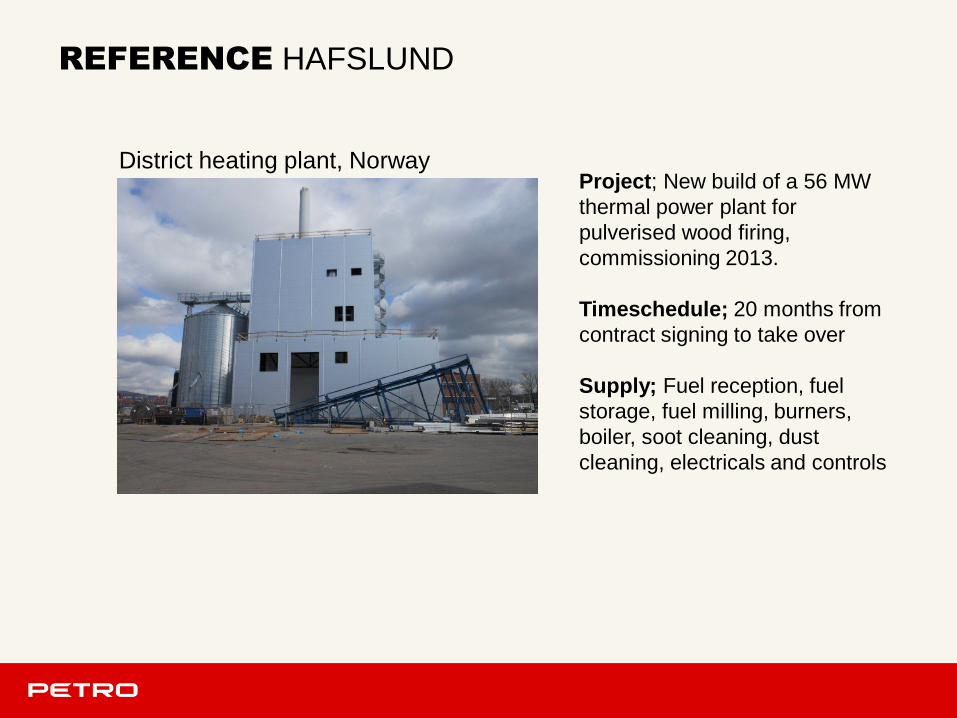
REFERENCE HAFSLUND
Project; New build of a 56 MW
thermal power plant for
pulverised wood firing,
commissioning 2013.
Timeschedule; 20 months from
contract signing to take over
Supply; Fuel reception, fuel
storage, fuel milling, burners,
boiler, soot cleaning, dust
cleaning, electricals and controls
District heating plant, Norway

PETRO BIO ABFUTURE ENERGY SOLUTIONS
www.petro.se
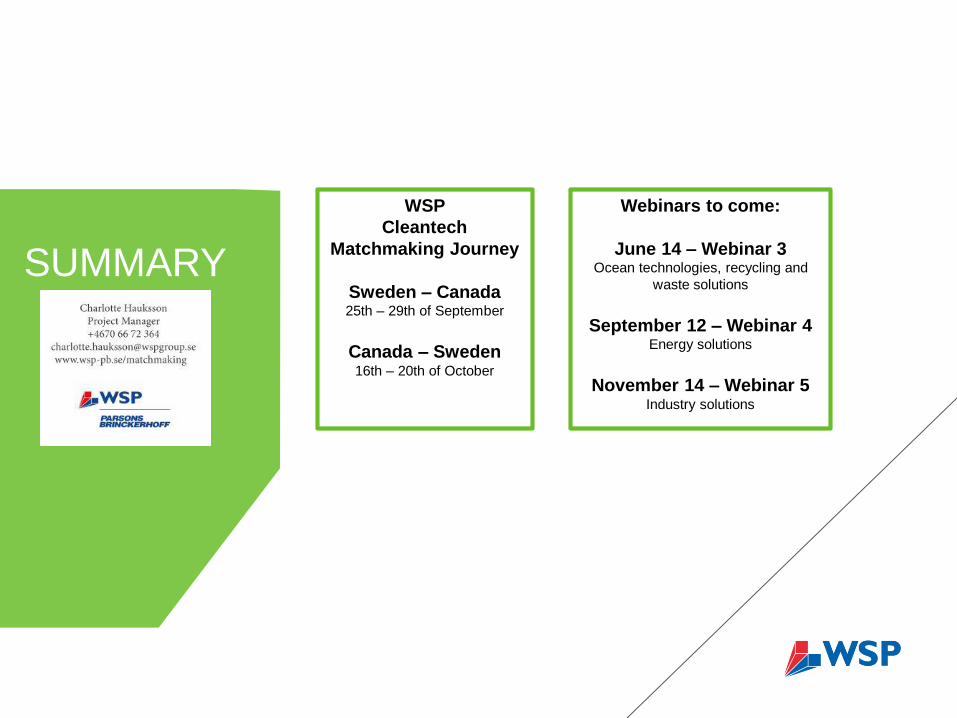
SUMMARY
WSP
Cleantech
Matchmaking Journey
Sweden – Canada 25th – 29th of September
Canada – Sweden 16th – 20th of October
Webinars to come:
June 14 – Webinar 3Ocean technologies, recycling and
waste solutions
September 12 – Webinar 4Energy solutions
November 14 – Webinar 5Industry solutions