clean energy outlook - dallas fed
TRANSCRIPT

Clean Energy Outlook
Logan Goldie-Scot
Head of Clean Power
November 20, 2020
Federal Reserve Bank of Dallas

1 November 20, 2020
Solar module price ($/W)
XP Curve = 28.8%
Wind turbine price ($/W)
XP Curve = 7.1%
Falling technology costs are key to the decarbonization of power and transport
Source: BloombergNEF
0.1
1
10
100
0 0 10 1,000
1976
$/W
2019e0
1
10
100
0 1 10 100 1,000
1985
$/W
2020
2010
2019
10
100
1,000
10,000
10 1,000 100,000
$/kWh
Batteries pack price ($/kWh)
XP Curve = 18%
Cumulative installed capacity (GW) Cumulative installed capacity (GW) Cumulative capacity (MWh)

2 November 20, 2020
Source: BloombergNEF Note: 2017 multi module efficiency was adjusted downwards from the 2018 PV manufacturing overview to reflect the industry average
instead of pure survey results.
PV is increasingly efficient
Average year-end PV module efficiency
15.8%16.3%
16.7%17.1%
17.6%18.0%
18.5%
19.3%
15.4%15.7%
16.0% 16.1% 16.3%16.6% 16.8%
17.1%
2012 2013 2014 2015 2016 2017 2018 2019
Mono module
Multi module

3 November 20, 2020
Source: BloombergNEFSource: BloombergNEF
Wind capacity factors are on the rise
Onshore wind Offshore wind
Wind capacity factors by technology
0%
15%
30%
45%
60%
2020 2025 2030 2035 2040 2045 2050
U.K.
Germany
U.S.
China
4 November 20, 2020
Source: BloombergNEF
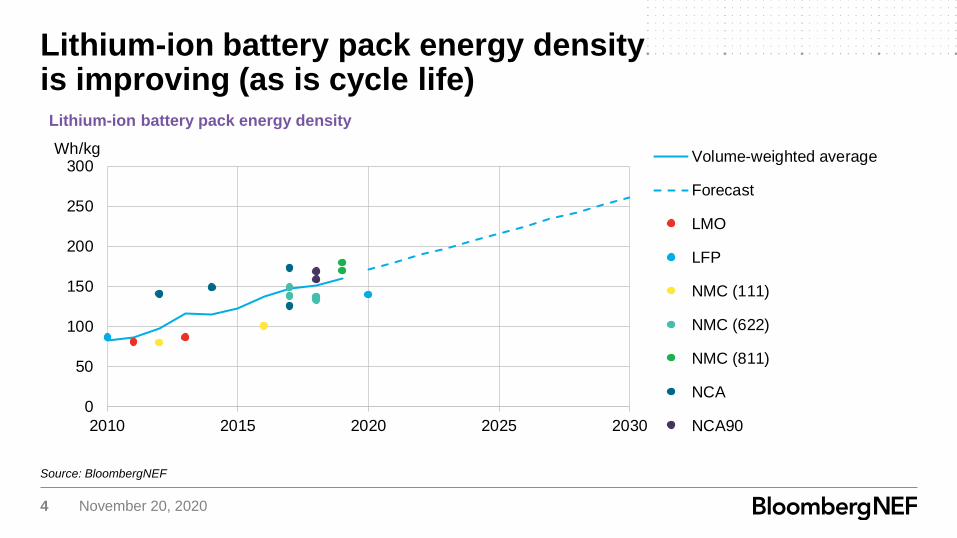
Lithium-ion battery pack energy density is improving (as is cycle life)Lithium-ion battery pack energy density
0
50
100
150
200
250
300
2010 2015 2020 2025 2030
Wh/kgVolume-weighted average
Forecast
LMO
LFP
NMC (111)
NMC (622)
NMC (811)
NCA
NCA90

5 November 20, 2020
Source: BloombergNEF. Note: LCOEs exclude tax-credits (ITC & PTC) and curtailment. The LCOE range represents a range of costs and capacity factors. Battery
storage systems (co-located and stand-alone) presented here have four-hour storage. In the case of solar-and wind-plus-battery systems,the range is a combination
of capacity factors and size of the battery relative to the power generating asset (25% to 100% of total installed capacity).
Wind and PV are among the cheapest forms of generation in the U.S.United States levelized cost of electricity
26 32
84
3360
193
3952
69
13659 50
56
105
59
84
77
157340
106
0
50
100
150
200
250
300
350
400
Onshorewind
Tracking PV Offshorewind
CCGT Coal Nuclear Onshorewind +storage
Fixed-axisPV + storage
OCGT Utility-scalebattery (4h)
$/MWh (nominal)

6 November 20, 2020
Wind and PV grow to 56% of global electricity generation in 2050
Source: BloombergNEF, IEA
56%
wind &
PV
24% fossil fuels
76% zero carbon
Global electricity generation
Coal
Gas
Oil
Nuclear
Hydro
Wind
Solar
Other
0%
10%
20%
30%
40%
50%
60%
70%
80%
90%
100%
1970 1980 1990 2000 2010 2020 2030 2040 2050

7 November 20, 2020
Source: BloombergNEF
PV, wind and energy storage is a least-cost combination to 70-80% renewablesShare of wind and solar as % of total annual generation
0%
10%
20%
30%
40%
50%
60%
70%
80%
90%
100%
2012 2015 2020 2025 2030 2035 2040 2045 2050
Germany
Italy
Iberia
U.S.
Canada
Brazil
China
India
Average

8 November 20, 2020
Source: BloombergNEF
In the U.S., renewables and gas have thrived over the last decade at the expense of coalNet U.S. power generation additions (GW)
-30
-20
-10
0
10
20
30
40
2005 2007 2009 2011 2013 2015 2017 2019
Wind
Sub-Bituminous
Solar (DG)
Solar
Nuclear
Lignite
Gas OC / Steam
Gas CC
Bituminous

9 November 20, 2020
Source: BloombergNEF
Coal and nuclear continue to struggle based on economics aloneCoal and nuclear capacity retirements, United States
-40
-30
-20
-10
0
2015 2020 2025 2030 2035 2040 2045 2050
GW
Nuclear
Coal

10 November 20, 2020
Source: BloombergNEF
Wind, solar and gas (in the 2020s) continue to thriveU.S. power generation capacity additions (GW)
-15
-10
-5
0
5
10
15
20
25
30
2015 2020 2025 2030 2035 2040 2045 2050
GWSmall-scale batteries
Utility-scale batteries
Other
Solar thermal
Small-scale PV
Utility-scale PV
Offshore wind
Onshore wind
Biomass
Geothermal
Pumped hydro
Hydro
Nuclear
Oil
Peaker gas
Combined-cycle gas
Coal

11 November 20, 2020
Source: BloombergNEF
Renewables overtake gas as the leading source of generation in 2041U.S. gross generation (TWh)
0
1,000
2,000
3,000
4,000
5,000
6,000
2015 2020 2025 2030 2035 2040 2045 2050
Other
Solar thermal
Small-scale PV
Utility-scale PV
Offshore wind
Onshore wind
Biomass
Geothermal
Hydro
Nuclear
Oil
Peaker gas
Combined-cycle gas
Coal

12 November 20, 2020
Source: BloombergNEF Note: ETS stands for Energy Transition Scenario
Wind and solar make up some 60% of total installed capacity in California in the ETSInstalled power generation capacity (GW) in California, Economic Transition Scenario
0
50
100
150
200
250
300
350
2012 2020 2025 2030 2035 2040 2045 2050
Small-scale batteries
Utility-scale batteries
Other
Solar thermal
Small-scale PV
Utility-scale PV
Offshore wind
Onshore wind
Biomass
Geothermal
Pumped hydro
Hydro
Nuclear
Oil
Peaker gas
Combined-cycle gas
Coal

13 November 20, 2020
Source: BloombergNEF
Meeting California state goals requires much more capacity (solar+storage)Installed power generation capacity (GW) in California, Renewable Portfolio Standard Scenario
0
50
100
150
200
250
300
350
2012 2020 2025 2030 2035 2040 2045 2050
Small-scale batteries
Utility-scale batteries
Other
Solar thermal
Small-scale PV
Utility-scale PV
Offshore wind
Onshore wind
Biomass
Geothermal
Pumped hydro
Hydro
Nuclear
Oil
Peaker gas
Combined-cycle gas
Coal

14 November 20, 2020
Net-zero pledges of top global
economies
1. United States
2. China
3. Japan
4. India
5. Germany
6. United Kingdom
7. France
8. Italy
9. Brazil
10. Canada
11. Russia
12. South Korea
U.S. federal policy changes could be similarly impactful
Source: Bloomberg
×
×
×
×

15 November 20, 2020
The U.S. currently lags behind Europe and China in terms of EV sales
Passenger electric vehicle sales (millions)
2.3
0.040.1 0.2
0.30.5
0.7
1.1
1.9
2.1
2011 2012 2013 2014 2015 2016 2017 2018 2019 2020e
Rest of world
Japan and Korea
North America
Europe
China
Source: BloombergNEF. Includes BEVs and PHEVs

16 November 20, 2020
Policy Performance Corporate actions
Transitions are slow, right up until they’re not
Source: VolkswagenSource: Jean Chung/Bloomberg Source: Tomohiro Ohsumi/Bloomberg

17 November 20, 2020
Source: BloombergNEF
Passenger vehicles electrify quickly from the mid-2020s based on economics
Electric vehicle share of global new vehicle sales
0%
10%
20%
30%
40%
50%
60%
70%
80%
2020 2025 2030 2035 2040
Buses
Two-wheelers
Passenger vehicles
Light commercial
Medium commercial
Heavy commercial

18 November 20, 2020
Two ways to think about O&G transition strategies
Shareholder pressure and
ESG considerations
Disclosure
requirements
Alignment to
political goals in
home markets
Social license to
operate
The business rationale for
investing in new and clean
energy
1 2

19 November 20, 2020
Shell at BNEF New York Summit, 2019
We believe we can be the largest
electricity power company in the world in
the early 2030s.
Maarten Wetselaar, Integrated Gas &
New Energies Director, Shell
“

20 November 20, 2020
Interested in learning more about BNEF?
Contact: Brent Smelter, Commercial Director (BNEF)
Email: [email protected]

21 November 20, 2020
Copyright
© Bloomberg Finance L.P. 2020. This publication is the copyright of Bloomberg Finance L.P. in connection with BloombergNEF. No portion of this document may be
photocopied, reproduced, scanned into an electronic system or transmitted, forwarded or distributed in any way without prior consent of BloombergNEF.
Disclaimer
The BloombergNEF ("BNEF"), service/information is derived from selected public sources. Bloomberg Finance L.P. and its affiliates, in providing the
service/information, believe that the information it uses comes from reliable sources, but do not guarantee the accuracy or completeness of this information, which is
subject to change without notice, and nothing in this document shall be construed as such a guarantee. The statements in this service/document reflect the current
judgment of the authors of the relevant articles or features, and do not necessarily reflect the opinion of Bloomberg Finance L.P., Bloomberg L.P. or any of their
affiliates (“Bloomberg”). Bloomberg disclaims any liability arising from use of this document, its contents and/or this service. Nothing herein shall constitute or be
construed as an offering of financial instruments or as investment advice or recommendations by Bloomberg of an investment or other strategy (e.g., whether or not
to “buy”, “sell”, or “hold” an investment). The information available through this service is not based on consideration of a subscriber’s individual circumstances and
should not be considered as information sufficient upon which to base an investment decision. You should determine on your own whether you agree with the
content. This service should not be construed as tax or accounting advice or as a service designed to facilitate any subscriber’s compliance with its tax, accounting or
other legal obligations. Employees involved in this service may hold positions in the companies mentioned in the services/information.
The data included in these materials are for illustrative purposes only. The BLOOMBERG TERMINAL service and Bloomberg data products (the “Services”) are
owned and distributed by Bloomberg Finance L.P. (“BFLP”) except (i) in Argentina, Australia and certain jurisdictions in the Pacific islands, Bermuda, China, India,
Japan, Korea and New Zealand, where Bloomberg L.P. and its subsidiaries (“BLP”) distribute these products, and (ii) in Singapore and the jurisdictions serviced by
Bloomberg’s Singapore office, where a subsidiary of BFLP distributes these products. BLP provides BFLP and its subsidiaries with global marketing and operational
support and service. Certain features, functions, products and services are available only to sophisticated investors and only where permitted. BFLP, BLP and their
affiliates do not guarantee the accuracy of prices or other information in the Services. Nothing in the Services shall constitute or be construed as an offering of
financial instruments by BFLP, BLP or their affiliates, or as investment advice or recommendations by BFLP, BLP or their affi liates of an investment strategy or
whether or not to “buy”, “sell” or “hold” an investment. Information available via the Services should not be considered as information sufficient upon which to base an
investment decision. The following are trademarks and service marks of BFLP, a Delaware limited partnership, or its subsidiaries: BLOOMBERG, BLOOMBERG
ANYWHERE, BLOOMBERG MARKETS, BLOOMBERG NEWS, BLOOMBERG PROFESSIONAL, BLOOMBERG TERMINAL and BLOOMBERG.COM. Absence of
any trademark or service mark from this list does not waive Bloomberg’s intellectual property rights in that name, mark or logo. All rights reserved. © 2020 Bloomberg.
Copyright and disclaimer

Coverage.
Clean energy
Advanced transport
Commodities
Digital industry
BloombergNEF (BNEF) is a leading provider
of primary research on clean energy,
advanced transport, digital industry,
innovative materials, and commodities.
BNEF’s global team leverages the world’s
most sophisticated data sets to create clear
perspectives and in-depth forecasts that
frame the financial, economic and policy
implications of industry-transforming trends
and technologies.
BNEF research and analysis is accessible via
web and mobile platforms, as well as on the
Bloomberg Terminal.
Client enquiries:
Bloomberg Terminal: press <Help> key twice
Email: [email protected]
Learn more:
about.bnef.com | @BloombergNEF
Logan Goldie-Scot