clean energy canada report: the cleanest lng in the world?
TRANSCRIPT

cleanenergycanada.org The Cleanest LNG in the World? 1
THE CLEANEST LNG IN THE WORLD?HOW TO SLASH CARBON POLLUTION FROM WELLHEAD TO WATERLINE
IN BRITISH COLUMBIA’S PROPOSED LIQUEFIED NATURAL GAS INDUSTRY

cleanenergycanada.org The Cleanest LNG in the World?
The Cleanest LNG in the World?How to Slash Carbon Pollution From Wellhead to Waterline in British Columbia’s Proposed Liquefied Natural Gas Industry
James GlaveJeremy Moorhouse
September 2013
Production design: Samantha LefortCover photo: Joshua Welsh
Printed in British Columbia on 100 percent recycled, post-consumer paper.
© 2013 Clean Energy Canada at Tides Canada
All rights reserved. Permission is granted to reproduce all or part of this publication for non-commercial purposes, so long as the source is cited as “Clean Energy Canada at Tides Canada.”
Clean Energy Canada at Tides Canada (cleanenergycanada.org) is a solutions-focused initiative working to accelerate Canada’s transition to an energy-efficient, ecologically responsible, and prosperous low-carbon economy.
The contents of this publication are available online at http://cleanenergycanada.org/LNG

cleanenergycanada.org The Cleanest LNG in the World?
1 ExEcutivE Summary
2 Background: BritiSh columBia’S liquEfiEd natural gaS amBitionS
3 our approach
4 thE clEanESt lng in thE World
5 factorS influEncing thE carBon footprint of lng
6 a rEcipE for lng lEadErShip
7 dEtailEd diScuSSion of rESultS
8 furthEr rESEarch
9 concluSionS
10 SourcES
appEndix
Methodology
Data Sources and Assumptions
taBlE of contEntS
4
5
7
8
10
11
13
14
15
16
17
19

cleanenergycanada.org The Cleanest LNG in the World? 4
1 | ExEcutivE Summary
Maintaining this leadership, while also delivering on a recent policy focus of extracting and exporting natural gas resources, will require significant commitments and actions by both government and the natural gas sector.
Over the past year and a half, the Government of British Columbia has signalled that it intends to keep its low carbon leadership position—and the reputational benefits it provides—by repeatedly stating that its proposed new liquefied natural gas (LNG) industry will produce “the cleanest LNG in the world.”
“Clean” is a subjective term that should properly capture a wide range of potential aquatic, marine, air, and biodiversity impacts across the fuel production cycle—such as the ecosystem risks associated with increased groundwater withdrawals and fracking activity to extract shale gas to the smog from the plants that compress the gas into LNG.
While these are important areas for further study, this paper limits its scope to carbon pollution, and specifically government assertions that British Columbia’s industry “will have lower life cycle greenhouse gas emissions than anywhere else.” Until this report, no independent definition has yet attempted to explain what “cleanest LNG in the world” actually means, and what it will take to deliver on it.
This report concludes that without policy leadership, LNG produced in British Columbia would emit more than three times the carbon pollution of that produced in current world-leading operations. The finding is based not only on the emissions of the proposed LNG plants, but on the carbon footprint of the commodity they would produce—from wellhead to waterline.
British Columbia is at a crossroads. After gaining an early advantage on climate change leadership with a suite of policies including a revenue-neutral carbon tax and an aggressivegreenhouse gas reduction target, the province has earned a reputation as a low carbon leader.
We conclude that this leadership gap can be closed if the government creates the policy environment that both directs and incentivizes the energy industry to employ a mix of strategies and technologies proven to drive carbon pollution down all the way across the lifecycle of LNG production.
By working with industry to specify a variety of these solutions and pushing the envelope of innovation, British Columbia can make good on its promises and deliver the cleanest LNG in the world. Doing so will reduce impacts on communities, other sectors, and ecosystems, provide a competitive advantage in a global energy marketplace increasingly focused on lower carbon energy, and help reduce the recent erosion of the province’s hard-earned reputation as a climate leader.

cleanenergycanada.org The Cleanest LNG in the World? 5
2 | Background
In 2007 and 2008, the Province of British Columbia landed on the world stage as a climate and clean energy champion when the government introduced a revenue-neutral carbon tax, a ban on coal-fired electricity without carbon capture and storage, and other measures. In 2010, it introduced a Clean Energy Act that mandated the province to source at least 93 percent of its electricity from clean and renewable sources.
The province earned widespread praise for this early leadership, a reputation it is still enjoying to this day. For example, a recent study confirming the carbon tax’s effectiveness in reducing fossil fuel consumption (Elgie, 2013) attracted international media attention, including accolades from The Economist.
A March 2011 leadership change brought a corresponding shift in British Columbia’s policy priorities, and the government began placing a stronger focus on fossil fuel extraction and export. The following year, the province released its Liquefied Natural Gas Strategy. The strategy outlined its intent to access new overseas markets for the province’s extensive natural gas resources, via a series of proposed liquefied natural gas (LNG) facilities and export terminals.
The proposed new industry would extract, process, transport, and chill natural gas to minus 162 degrees Celsius—the point at which it becomes liquid and transportable. The liquefied fuel would then be shipped to Pacific Rim customers aboard specialized tankers.
Assuming industry proponents secure First Nations support, social licence, and the necessary environmental approvals, the Government of British Columbia has set itself a goal of having at least three LNG facilities in operation on the B.C. coast by 2020.
The strategy promises significant short and medium term economic benefits for British Columbia. The government expects these three news plants will drive more than $20 billion in direct investment and yield more than $1 billion a year in public revenue (Ministry of Energy and Mines, 2013) At full build-out, the province anticipates the industry will support as many as 75,000 permanent jobs (Ministry of Energy, Mines, and Natural Gas, 2013). These projections have not been independently
verified and may be overstated, but undeniably the industry promises significant new investment and employment.
It is also important to consider and mitigate the costs and risks of development to current and future generations of British Columbians and the province’s well-earned reputation for climate leadership. Even before it is regasified into natural gas overseas and burned, LNG produces significant carbon pollution. When one totals up the emissions associated with all links in the LNG production chain up until shipment, a tonne of LNG manufactured in the “off the shelf” B.C. plant we describe below will generate roughly a tonne of carbon pollution.
Climate disruption is already costing British Columbia citizens and communities real money. Without strengthened leadership and policy reform from all levels of government, their burden will only grow.
According to a 2011 report by the National Round Table on the Environment and Economy, by the middle of this century, climate change could cost British Columbia between $500 million and $3 billion per year, mostly through flooding and lost revenue from forestry (National Round Table, 2011). Further, new jobs created in the energy sector may well undermine others. As one example, climate disruption is already pushing many of British Columbia’s agricultural producers to the limit of viability (Pacific Institute for Climate Solutions, 2013).
To be clear, even if natural gas is the cleanest burning of all fossil fuels, and even if LNG is produced with a relatively smaller carbon footprint, LNG remains a fossil fuel.
BritiSh columBia’S liquEfiEd natural gaS amBitionS

cleanenergycanada.org The Cleanest LNG in the World?
In its recent World Energy Outlook, the International Energy Agency made it clear that if humanity is to escape truly dangerous climate disruption, we must leave two-thirds of all remaining fossil fuels—including gas—in the ground. (International Energy Agency, 2012).
The proposed LNG industry would increase the province’s overall emissions, not reduce them. Under the Greenhouse Gas Reduction Targets Act, the Government of British Columbia is required to reduce carbon pollution 33 percent below 2007 levels by the year 2020. However, recent assessments conclude that the proposed new industry would push this goal out of reach. (Bryant, 2013; Lee, 2012).
Perhaps anticipating these concerns, government has at various points over the past 18 months assured British Columbians that made-in-B.C. LNG industry will be “the cleanest LNG in the world”—that is to say, it will boast the world’s lowest life cycle greenhouse gas emissions. (See “For the Record.”)
This report represents an effort to define what it will take to deliver on British Columbia’s promise to produce the cleanest available LNG with respect to life cycle greenhouse gas emissions. It outlines where, and under what circumstances, the LNG with the world’s smallest carbon footprint is currently produced. It also outlines various strategies and technologies that British Columbia’s nascent LNG industry would need to adopt if it is to meet or beat the current global best-in-class standard.
It is our hope that this document will inform ongoing public and policy discussions such that any new LNG industry and associated infrastructure will present the smallest possible impact—not only to the climate, British Columbia’s water and world-class ecosystems, and the people who live in them, but also to the province’s hard-fought international reputation for climate leadership.
Since February 2012, the Government of British Columbia has been stating that the fuel produced in its proposed liquefied natural gas industry will meet and beat the global gold standard for carbon stewardship. Here’s what leaders have been saying.
for thE rEcord
“LNG development in British Columbia will have lower life cycle greenhouse gas emissions than anywhere else.” —British Columbia Ministry of Energy and Mines, Liquefied Natural Gas: A Strategy for B.C.’s Newest Industry, February 2012.
“Our plan has always been for the cleanest LNG produced anywhere in the world.” —Hon. Premier Christy Clark, B.C. Local News, December 12, 2012.
“We are continuing our close work with industry and First Nations to build the world’s cleanest LNG industry.” —Hon. Premier Christy Clark, British Columbia’s Liquefied Natural Gas Strategy, One Year Update, February 7, 2013.
“Working with the Minister of Natural Gas Development, ensure that LNG operations in British Columbia are the cleanest in the world.” —Mandate letter to Hon. Minister Mary Polak from Hon. Premier Christy Clark, June 10, 2013.
“Positive discussions are taking place with industry to ensure we have the cleanest LNG industry in the world.” —Hon. Rich Coleman, Terrace Standard, August 21, 2013.
“...we also want to have the cleanest natural gas that is produced for export anywhere in the world, and some of the companies that we are working with are equally committed to that.” —Hon. Premier Christy Clark, CBC Early Edition, September 10, 2013.
6

cleanenergycanada.org The Cleanest LNG in the World? 7
3 | our approach
To define what “cleanest LNG” really means, and recommend how British Columbia could achieve it via a hypothetical LNG sector, we commissioned a scan of the global LNG industry, a survey of best practices, and an analysis of the carbon impact of various strategies and technologies using greenhouse gas modelling software.
This paper reviews existing industry data to assess the carbon footprint, from wellhead to ship terminal, of LNG produced at a variety of existing and proposed facilities around the world.
To assess LNG from a carbon perspective, one must consider not simply the liquefaction facility, but the full upstream chain of production, including gas extraction, processing, and transportation (Figure 1). Our assessment includes these stages, but not the carbon pollution released as the fuel is shipped to its final markets and burned there.
Figure 1: This report only addresses the carbon pollution associated with the LNG production chain from wellhead to waterline.
We identify two facilities that today produce the “cleanest” LNG available—again, factoring in all stages of production—a benchmark that British Columbia LNG needs to meet or beat to claim world-leading status. We sketch out what a “standard” British Columbia LNG plant would look like under current policy, and present a range of potential pathways to leadership. We then discuss the challenges of achieving this global leadership and the detailed results of our life cycle analysis. Finally, we offer some suggestions for future research.
For a detailed explanation of our research methodology, please see the Appendix.
LN
G L
IFE
CY
CLE
CO
VER
ED
IN
TH
IS R
EP
OR
T
NATURAL GAS PRODUCTION(WELLHEAD)
PROCESSING
TRANSPORTATIONBY PIPELINE
TRANSPORTATIONBY PIPELINE
LIQUEFACTION AT LNG FACILITY
REGASIFICATION AT LNG FACILITY
COMBUSTION
SHIP TO MARKETWATERLINE
AD
DIT
ION
AL C
AR
BO
N
2
2

cleanenergycanada.org The Cleanest LNG in the World?
MelkøyaBritish
Columbia
BarrowIsland
BurrupPeninsula
CurtisIsland
Statoil’sSnøhvitproject
Gorgonplant
Woodside Petroleum’sPluto plant
Santos-PetronusGLNG
project*
8
The cleanest LNG in the world is currently produced at two separate facilities located a half world apart: Statoil’s Snøhvit project, on the island of Melkøya in the Norwegian Sea, and the Gorgon plant, on Barrow Island off the western coast of Australia. The latter is a joint venture of Australian subsidiaries of Chevron, Royal Dutch Shell, and ExxonMobil.
4 | thE clEanESt lng in thE World
These two projects boast life cycle greenhouse gas emissions from production, transportation and liquefaction of 0.35 and 0.36 tonnes CO2 equivalent per tonne of LNG, respectively. That is to say, each tonne of LNG produced at Snøhvit and Gorgon releases the equivalent of 0.35 and 0.36 tonnes of greenhouse gas emissions into the atmosphere.
No emissions data exists for a “typical” British Columbia LNG plant, as none is yet built. To inform our analysis, we have used engineering data from a pair of facilities that employ—or will employ—technologies currently being discussed by B.C. LNG proponents. Both are in Australia: Woodside Petroleum’s Pluto
plant, located on the Burrup Peninsula of the country’s northwest coast, and the Santos-Petronus GLNG project, presently under construction on Curtis Island, off the coast of Gladstone, in Queensland.
Since British Columbia is clearly not Australia, our analysis accounts for differences in underlying operating conditions, including environmental operating conditions (see “A Cold Climate Advantage?” page 9). The government of British Columbia has recently identified the province’s cooler northern climate as offering a strategic advantage.
Figure 2: Cleanest LNG facilities and facilities that employ (or will employ) technologies currently being discussed by BC LNG proponents.
cleanenergycanada.org The Cleanest LNG in the World?
With respect to similarities neither Pluto nor Santos-Petronus will process natural gas on site, nor will they capture and store carbon dioxide emissions. Though it is technically possible, none of the current British Columbia LNG proponents plans to capture their carbon pollution and there currently exists no government requirement for them to do so. The Australian facilities also use contemporary technologies: Pluto began liquefying gas in May 2012, while Santos-Petronus is expected to come online in 2015.
For all of the above reasons, we consider the Pluto and Santos-Petronus operations to be a reasonable approximation of a typical British Columbia LNG plant.
Given this, without additional policy or regulations, a standard British Columbia plant will produce life cycle greenhouse gas emissions equivalent to 0.96 tonne of carbon per tonne of LNG produced. In translation, this means that the atmospheric cost of one tonne of fuel produced in an off-the-shelf British Columbia LNG plant will be roughly one tonne of carbon pollution—almost three times that produced out of the globally leading facilities in Norway and Australia.
If British Columbia were truly to produce the cleanest LNG in the world with respect to life cycle carbon pollution, government and industry would need to find ways to close the 0.61 tonne emissions gap between the world-leading plants and the standard facilities currently on the table.
This will be challenging, because both the Snøhvit and Gorgon facilities draw directly from undersea natural gas deposits, efficiently produce, process and liquefy that gas in a centralized facility, and incorporate carbon capture and storage. Plant operators capture and sequester underground greenhouse gas emissions that would ordinarily be vented to the atmosphere during processing.
British Columbia LNG producers will be sourcing at least a portion of their gas from unconventional deposits that contain more carbon dioxide. Project proponents would need to pipe the gas across the province, and process and liquefy it at different locations. Without mitigation measures, this will increase the carbon footprint of the final product.
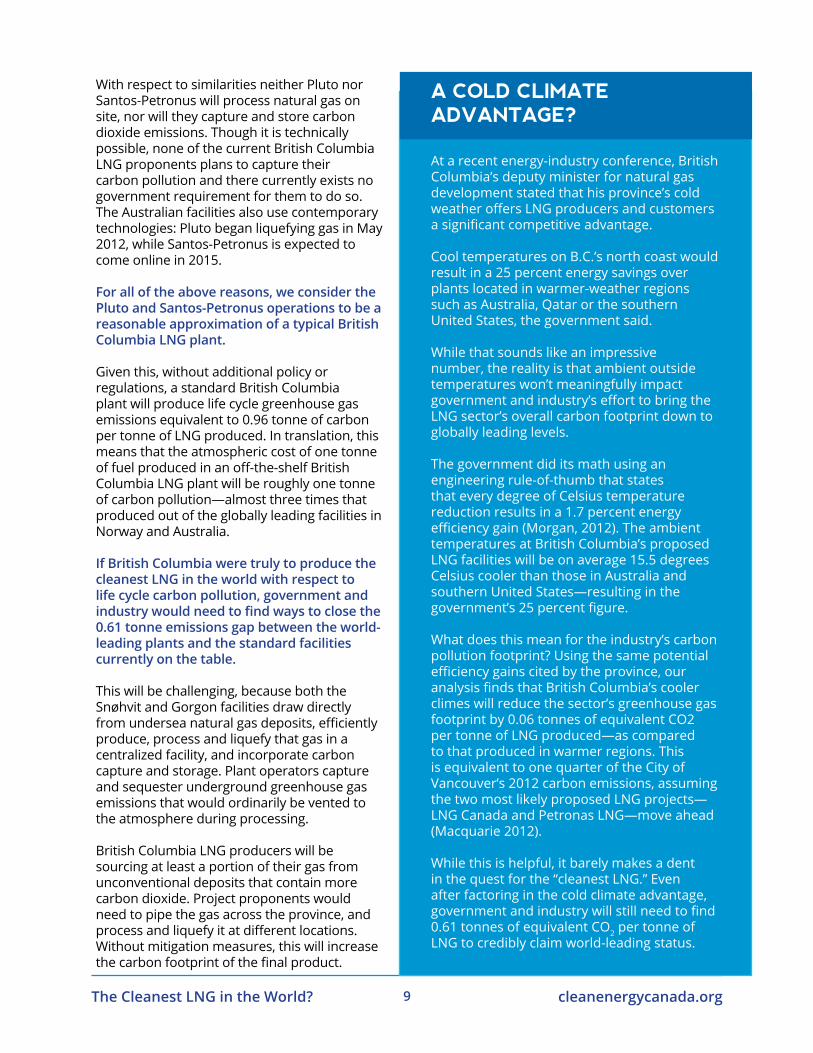
a cold climatE advantagE?
At a recent energy-industry conference, British Columbia’s deputy minister for natural gas development stated that his province’s cold weather offers LNG producers and customers a significant competitive advantage.
Cool temperatures on B.C.’s north coast would result in a 25 percent energy savings over plants located in warmer-weather regions such as Australia, Qatar or the southern United States, the government said.
While that sounds like an impressive number, the reality is that ambient outside temperatures won’t meaningfully impact government and industry’s effort to bring the LNG sector’s overall carbon footprint down to globally leading levels.
The government did its math using an engineering rule-of-thumb that states that every degree of Celsius temperature reduction results in a 1.7 percent energy efficiency gain (Morgan, 2012). The ambient temperatures at British Columbia’s proposed LNG facilities will be on average 15.5 degrees Celsius cooler than those in Australia and southern United States—resulting in the government’s 25 percent figure.
What does this mean for the industry’s carbon pollution footprint? Using the same potential efficiency gains cited by the province, our analysis finds that British Columbia’s cooler climes will reduce the sector’s greenhouse gas footprint by 0.06 tonnes of equivalent CO2 per tonne of LNG produced—as compared to that produced in warmer regions. This is equivalent to one quarter of the City of Vancouver’s 2012 carbon emissions, assuming the two most likely proposed LNG projects—LNG Canada and Petronas LNG—move ahead (Macquarie 2012).
While this is helpful, it barely makes a dent in the quest for the “cleanest LNG.” Even after factoring in the cold climate advantage, government and industry will still need to find 0.61 tonnes of equivalent CO2 per tonne of LNG to credibly claim world-leading status.
9

cleanenergycanada.org The Cleanest LNG in the World? 10
As the above examples illustrate, not all LNG facilities are created equal. In British Columbia, industry proponents have a range of technologies and strategies at their disposal—both “up-stream” at the source of gas extraction and “downstream” at the LNG plant, and at all points between—that could bring down the life cycle carbon footprint of British Columbia LNG to a world-leading standard.
5 | factorS influEncing thE carBon footprint of lng
natural gaS Sourcing & procESSing Due to characteristics of different natural gas fields and how they are extracted, some deposits innately have much lower greenhouse gas emissions than others. For example, raw natural gas sourced from the Horn River basin, near Fort Nelson in the province’s far northeast corner, contains 12 percent carbon dioxide.
Meanwhile, the Montney field, in the vicinity of Fort St. John and Dawson Creek, contains just one percent carbon dioxide. Gas sourced from the Montney field will have a smaller carbon footprint than Horn River gas, unless the latter’s significant carbon dioxide content is captured and stored at the wellhead—a process not currently required in British Columbia. Carbon dioxide in natural gas must be separated in a processing plant, and without carbon capture and storage, it is vented to the atmosphere, where it exacerbates climate disruption.
Further, at least in British Columbia, the industry presently burns a great deal of natural gas to process natural gas, releasing more carbon pollution. Electrification of processing plants with clean electricity would offset some of these emissions, however this is not currently required.
comprESSion Liquid Natural Gas plants are essentially enormous refrigerators that work in much the same fashion as a home chiller, but at an industrial scale. The plants run massive power-hungry compressors to cool incoming natural gas to -162 degrees Celsius (Woodside, 2011). Typically, LNG facilities burn natural gas to run these compressors directly—a configuration known in the industry as “direct drive.”
poWEr gEnEration LNG facilities require electricity to accomplish ancillary tasks other than the compression phase of production. How this electricity is sourced influences the carbon footprint of the plant, and the LNG produced there.
Renewable energy sources such as wind and hydro produce almost no carbon pollution. Combined cycle natural gas electricity generation does produce carbon pollution, but is currently the most efficient form of gas-fired generation available.
Broadly speaking, three factors influence the carbon footprint of LNG, from wellhead to waterline.
However, they can also be run by electricity, in a configuration referred to as electric drive, or E-Drive. Electric drives can be more efficient, and can use lower carbon energy sources such as wind, hydro, and also natural gas, burned in an efficient “combined-cycle” power plant.
Figure 3
REFRIGERANTCYCLE
COMPRESSOR
MECHANICALDRIVE
(GAS TURBINE)
REFRIGERANTCYCLE
COMPRESSOR
ELECTRICMOTOR
ELECTRICPOWER
(CCGT, NEWRENEWABLES
& GRID)
eLNGDirect DriveLNG
RENEWABLEPOWER
VS.

cleanenergycanada.org The Cleanest LNG in the World? 11
After exploring various options (see Section 7), we conclude that a world-leading British Columbia LNG facility would need to be powered with a combination of grid electricity, new renewables, and combined-cycle natural gas generators.
6 | a rEcipE for lng lEadErShip
Taken together, the above actions will collectively reduce life cycle greenhouse gas emissions of a standard off-the-shelf B.C. plant by 0.61 tonnes of equivalent emissions per tonne of LNG produced. This would result in a world-leading industry offering a product competitive to that offered in Norway and Australia.
To place the scale of the opportunity into perspective, for every standard, off-the shelf LNG project that proceeds, achieving this scale of emission reductions would be equivalent to avoiding the annual carbon pollution of two cities the size of Vancouver.
By requiring industry to adopt the above measures, the Government of British Columbia could head off the release of significant quantities of climate pollution and credibly claim that the proposed industry will produce the cleanest LNG in the world with respect to greenhouse gas emissions.
When supplied with lower-carbon gas that is processed with best-in-class equipment, this approach brings the proposed facilities within reach of global leadership.
To ensure British Columbia produces the cleanest LNG in the world, the industry will need to source the cleanest natural gas available, process it with best available technologies, and then compress it with low-emission technologies.

TRANSPORTATIONBY PIPELINE
REGASIFICATION AT LNG FACILITY
COMBUSTION
SHIP TO MARKETWATERLINE
AD
DIT
ION
AL C
AR
BO
N
TO BECOME A WORLD LEADER IN THE LNG INDUSTRY,
WE RECOMMEND B.C. UNDERTAKE THE FOLLOWING THREE STRATEGIES
=1 TONNELNG
0.23TONNE
C02HORN RIVERBASIN
mandate carbon capture and storage on any gas sourced
MONTNEY FORMATION RESOURCE
Government could require LNG proponents to exclusively source their natural gas from the province’s Montney Formation resource, or mandate carbon capture and storage on any gas sourced from the Horn River basin, which has innately higher greenhouse gas emissions.
To reduce carbon emissions, project developers could use a combination of strategies and tools such as electrification —using electricity instead of natural gas to process natural gas—and low-bleed valves and plunger lifts, which reduce leaks and venting.
To achieve best-in-class LNG, B.C. LNG plants must use electric drive compressors that in turn run on a combination of new renewable power, existing British Columbia grid electricity, and efficient combined-cycle natural gas generators.
1. USE MONTNEY GAS OR CARBON CAPTURE & STORAGE
2. ELECTRIFY NATURAL GAS PROCESSING & PLUG THE LEAKS
3. USE ELECTRIC DRIVE
UPSTREAM: SOURCE B.C.’S CLEANEST GAS & PROCESS IT WELL
DOWNSTREAM: AT THE PLANTS
LIQUIFACTION AT LNG FACILITY
PROCESSING
These strategies could reduce emissions by the equivalent of 0.23 tonnes of carbon dioxide per tonne of LNG produced.
When combined with emerging technologies these choices could reduce equivalent greenhouse gas emissions by 0.27 tonnes per tonne of LNG produced.
If the industry adopts this blend of compression technologies and power sources, it will reduce emissions by the equivalent of 0.11 tonnes of carbon dioxide per tonne of LNG produced.
LN
G L
IFE C
YC
LE C
OV
ER
ED
IN
TH
IS R
EPO
RT
NATURAL GAS PRODUCTION(WELLHEAD)
PROCESSING
TRANSPORTATIONBY PIPELINE
LIQUEFACTION AT LNG FACILITY
2
2
INDUSTRYSTANDARD
LNG FACILITY ANNUAL CARBONEMISSIONS OF VANCOUVER
C02 X2=
To place the scale of the opportunity into perspective, for every standard, off-the shelf LNG project that proceeds, achieving this scale of emission reductions would be equivalent to avoiding the annual carbon pollution of two cities the size of Vancouver.
RECIPE FOR THE CLEANEST LNG IN THE WORLDrEcipE for thE clEanESt lng in thE World

cleanenergycanada.org The Cleanest LNG in the World?
TO
NN
E C
O2E
Q/T
ON
NE
NG
0
0.40
0.60
0.80
1.00
BC STANDARD
BC COMBIN
ED CYCLE
BC RENEW
ABLE
BC CCS A
ND RENEW
ABLE
BC GRID
BC CC A
ND RE
BC LOW
EST
SABINE
SNOHVIT
GORGON
PRODUCTION & PROCESSING
CCS
TRANSPORTATION
LIQUEFACTION
PRODUCTIONPROCESSINGTRANSPORTATIONLIQUEFACTION
TARGET
13
The above discussion is based on a life cycle comparison of seven potential B.C. scenarios, including production, processing, transportation and liquefaction. Detailed methodology, assumptions, and sources are available in the appendix.
7 | dEtailEd diScuSSion of rESultS
Each scenario is progressively less greenhouse gas intensive, from left to right in Figure 2, below. We compare these scenarios with two world leading operations (Gorgon and Snøhvit) and Cheniere Energy’s Sabine Pass LNG project in Western Cameron Parish, Louisiana, which we expect would operate under similar conditions to a hypothetical British Columbia plant. Cheniere Energy sources its natural gas from shale and conventional fields, as British Columbia proponents would also do.
Figure 5 (below): Results summary for life cycle GHG emissions in tonnes CO2eq per tonne natural gas production and processing (dark blue) represent the majority of the emissions in the British Columbia and Sabine scenarios, and are far higher than Gorgon and Snøhvit emissions. Snøhvit and Gorgon both produce natural gas from subsea fields with
lower greenhouse gas intensities than shale gas production. Shale gas production and processing emissions are difficult to mitigate. Even with carbon capture and storage (see B.C. CCS and renewable scenario), a British Columbia facility would remain well above best-in-class life cycle greenhouse gas emissions at Snøhvit and Gorgon.
Mitigating these emissions requires a combination of strategies such as electrification and technologies designed to reduce leaks and venting, such as bleed valves and plunger lifts. These could reduce emissions in this link of the life cycle chain (see B.C. Low scenario).
Emissions from the LNG facility (light blue) account for less of the total but can be dramatically reduced by using electric drive combined with zero-emission electricity generation (the B.C. grid scenario and B.C. Low scenario).
Figure 5

cleanenergycanada.org The Cleanest LNG in the World? 14
An opportunity exists to identify current best practices with respect to airshed, marine, aquatic, and other non-carbon impacts of LNG development and compare them with current industry proposals. This will help ensure that the proposed British Columbia industry, if developed, will embrace and exceed world-leading ecosystem-protection standards.
8 | furthEr rESEarch
With respect to carbon pollution—the scope of this report—the following three research areas would refine this analysis and provide information to better inform a world leading greenhouse gas emission profile for LNG.
rEfinE natural gaS production and tranSportation EmiSSion rEduction opportunitiES: This report estimates carbon reduction potential, but it’s unclear what exact mix of technologies would reduce emissions in the Horn River Basin and Montney field. Additional research, in coordination with government and industry, could identify the technologies that would enable B.C. to lead the world in low carbon LNG.
policiES: Government policy will likely be necessary to drive industry adoption of these technologies. A policy analysis that considers environmental effectiveness, cost, and technical feasibility would help identify likely policy options and priorities.
coStS: Costs (including capital and operating, and intangible) should be calculated for different technology options. Energy efficient technologies in the natural gas industry are often not adopted despite short payback periods because the technologies are typically considered “risky,” don’t work in certain applications, or require new learning. These intangible costs should also be estimated because they provide a more realistic estimate of the true cost of adopting new technology.

cleanenergycanada.org The Cleanest LNG in the World? 15
The Government of British Columbia has made it clear that its proposed liquefied natural gas (LNG) industry will market the “cleanest LNG in the world” with “lower life cycle greenhouse gas emissions than anywhere else.”
9 | concluSionS
Were the province to fulfil this ambition and achieve this goal, from a carbon perspective it would be a world leader in responsible LNG production. Our analysis suggests that a mixture of available and proven technologies and processes—if deployed from wellhead to the ship terminal—could bring the goal within reach.
While additional research is required to understand the most cost-effective implementation options, we recommend the government put in place the policies and regulations that would require the emerging industry to deliver this desired level of performance. Further research is also required to determine what other benchmarks the industry needs to achieve in other no-less critical areas—such as aquatic, marine, and airshed stewardship—in order to reach its stated goal of producing “cleanest LNG in the world.”

cleanenergycanada.org The Cleanest LNG in the World? 16
(S&T)2 Consultants Inc. (2011). Shale Gas Update for GHGenius. Retrieved from http://www.ghgenius.ca/reports/ShaleGasUpdateFinalReport.pdf
Bradbury, J., Obeiter, M., Drauker, L., Wang, W., & Stevens, A. (2013). Clearing the Air: Reducing Upstream Greenhouse Gas Emissions from U.S. Natural Gas Systems (pp. 1–60). Retrieved from http://pdf.wri.org/clearing_the_air_full_version.pdf
Bryant, T., & Budd, R., David Suzuki Foundation (2013). The Cost of Exporting Liquid Natural Gas (Graphic Report). Retrieved from http://thetyee.ca/Opinion/2012/11/29/BC-LNG-Plan-To-Wipe-Away-Climate-Progress/
Chevron. (2009). Gorgon Gas Development and Jansz Feed Gas Pipeline (pp. 0–58). Retrieved from http://www.chevronaustralia.com/Libraries/Chevron_Documents/GGAP_Rev_0_G1-NT-PLNX0000012.pdf.sflb.ashx
Elgie, S. & McClay, S. (2013). Sustainable Prosperity. BC’s Carbon Tax Shift After Five Years, An Environmental (and Economic) Success Story. Retrieved from http://www.sustainableprosperity.ca/article3685
International Energy Agency (2012). 2012 World Energy Outlook (p. 25). Retrieved from http://www.worldenergyoutlook.org/publications/weo-2012/
Lee, Marc (2012). Canadian Centre for Policy Alternatives. BC’s Legislated Greenhouse Gas Targets vs Natural Gas Development: The Good, The Bad and the Ugly. Retrieved from http://www.policyalternatives.ca/natural-gas-ghgs
Ministry of Energy and Mines. (2013). Liquefied Natural Gas A Strategy for B.C.’s Newest Industry (p. 12). Vic-toria. Retrieved from http://www.gov.bc.ca/ener/popt/down/liquefied_natural_gas_strategy.pdf
Morgan, J. (2012). Rules of Thumb for Screening LNG Developments. Perth. Retrieved from http://www.engineersaustralia.org.au/sites/default/files/shado/Divisions/Western%20Australia%20Divi-sion/Groups/Oil_Gas/lng_technical_presentation_ieaustralia_oil_and_gas_division_perth_october_2012.pdf
Ministry of Energy, Mines, and Natural Gas (2013). Employment Impact Review. Retrieved from http://www.empr.gov.bc.ca/OG/Documents/Grant%20Thornton%20-%20LNG%20Employment%20Im-pacts.pdf
National Round Table on the Environment and the Economy. (2011). Paying the Price: The Economic Im-pacts of Climate Change for Canada. Retrieved from http://collectionscanada.gc.ca/webarchives2/20130322143115/http:/nrtee-trnee.ca/climate/climate-pros-perity/the-economic-impacts-of-climate-change-for-canada/paying-the-price
Nestli, T. F., & Tubaas, P. (2007). Integrated electrical and automation systems (pp. 53–56). Oslo. Retrieved from http://www05.abb.com/global/scot/scot271.nsf/veritydisplay/2cb11d704bb403b8c1257288004ebece/$file/53-56 SRAS13_72dpi.pdf
Crawford, E. & Beveridge, R. (2013). Pacific Institute for Climate Solutions. Strengthening BC’s Agriculture Sector in the Face of Climate Change. Retrieved from http://pics.uvic.ca/sites/default/files/uploads/publications/Strengthening%20BC’s%20Agriculture%20Sec-tor_0.pdf
Sabine Pass LNG. (2011). Environmental Assessment for the Sabine Pass Liquefaction Project. Retrieved from http://www.circleofblue.org/waternews/wp-content/uploads/2012/01/FERC_Sabine-Pass.pdf
Santos/Petronas. (2009). Greenhouse Gas Emissions GLNG : Supplementary EIS. Retrieved from http://www.santosglng.com/media/pdf1624/AttachmentK_Greenhouse_Gas_Emissions.pdf
Statoil. (2009). Snøhvit LNG Installation. 2009 Sustainability Report. Retrieved from http://www.statoil.com/annualreport2009/en/sustainability/keysustainabilityperformancedata/hseac-counting/environmentaldata/Pages/SnøhvitLNGInstallation.aspx
Woodside. (2011). Pluto LNG Project Greenhouse Gas Abatement Program. Retrieved from http://www.woodside.com.au/our-business/pluto/sustainability/documents/pluto_lng_project_-_green-house_gas_abatement_program.pdf
10 | SourcES

cleanenergycanada.org The Cleanest LNG in the World?
appEndix
17
We use a simple greenhouse gas life cycle assessment to estimate greenhouse gas emissions for several theoretical British Columbia liquefied natural gas (LNG) scenarios compared with best in class and likely similar projects around the world. The life cycle assessment includes production (drilling, servicing, well testing, production), processing, transportation (pipelines), liquefaction (compression, electricity production, flaring, acid gas removal and fugitives) and carbon capture and storage (CCS). However, activities are only disaggregated into production and processing, transportation, liquefaction and CCS.
We have based upstream reduction estimates on U.S. mitigation potential (Bradbury, Obeiter, Drauker, Wang, & Stevens, 2013). The level of emission reduction may be different in British Columbia, but no comparable public report exists.
mEthodology
We based British Columbia production and processing emissions on the shale gas emission profile of GHGenius—a popular model for evaluating life cycle emissions for transportation fuels ((S&T)2 Consultants Inc., 2011). We sourced the emissions profiles for the Gorgon and Snøhvit facilities from company reports (Chevron, 2009; Statoil, 2009). It is unclear if these company reports provide the same type of information as available from GHGenius. It is also possible that the Gorgon and Snøhvit materials underestimate their emissions.
We calculate life cycle emissions for five British Columbia scenarios and three international LNG projects. Table 1 summarizes the scenarios, description (compression type, power generation type and natural gas source) as well as the rationale for the option.
Table 1: Scenario name, description and rationale
RATIONALE
Alternative design to be world leader. More upstream reductions are required, but likely shorter development time for electricity infrastructure.
Industry standard appears to be direct drive with single cycle turbine. Most global facilities have this set up.
Combined cycle considered best practice in some LNG project documents (Woodside, 2011).
Zero GHG emission source for electrical load at facility. Representative of grid or local renewable options.
Other jurisdictions have or are considering CCS with facilities (Chevron, 2009).
Lowest GHG option for the LNG facility.
Try to meet world class with renewable powered facility and upstream reductions.
Type of field more comparable to B.C. operations (partially shale gas rather than sub-sea).
Best in class LNG facility from GHG intensity perspective (Woodside, 2011)(Nestli, 2007).
Has CCS, planned large operation. (Chevron, 2009) also close to best in class (Woodside, 2011).
DESCRIPTION
Compression: Direct Drive (NG)
Power Generation: Single Cycle (35% efficiency, natural gas)
NG Source: 50/50 Montney (1% CO2 mol)/Horn River (12% CO2
mol)
Compression: Combined Cycle (58% efficieny)
Power Generation: Single Cycle (55% efficiency, natural gas)
Fields: 50/50 Montney (1% CO2 mol)/Horn River (12% CO2 mol)
Compression: Direct Drive (NG)
Power Generation: Renewable energy sources (actual source
undefined)
Fields: 50/50 Montney (1% CO2 mol)/Horn River (12% CO2 mol)
Compression: Direct Drive (NG)
Power Generation: Renewable energy sources (actual source
undefined)
Fields: 50/50 Montney (1% CO2 mol)/Horn River (12% CO2 mol,
but with CCS)
Compression: Electric – Grid/renewable
Power Generation: Renewable energy sources (actual source
undefined)
Fields: 50/50 Montney (1% CO2 mol)/Horn River (12% CO2 mol)
Compression: Electric – zero emission
Power Generation: Grid
Fields: Montney with policy requirements on low bleed valves,
plunger lifts and leak detection and 60% electrification.
Compression: Electric – 73% combined cycle and 27%
renewable
Power Generation: 73% combined cycle and 27% renewable
Fields: Montney with policy requirements on low bleed valves,
plunger lifts and leak detection and 60% electrification.
Compression: Direct Drive (NG)
Power Generation: Single Cycle (NG)
Fields: 50/50 conventional (0.01% CO2) and shale gas
(Barnette, Fayette, Haynesvill) avg. 2.5%.
Compression: Electric Drive
Power Generation: Gas Turbine
Fields: Barents Sea (5% to 8% CO2 mol)
Compression: Direct Drive (NG)
Power Generation: Single Cycle (NG)
Fields: Gorgon/Jansz
SCENARIONAME
BRITISH COLUMBIA STANDARD
BRITISH COLUMBIA COMBINED
CYCLE
BRITISH COLUMBIA
RENEWABLE
BRITISH COLUMBIA
CCS & RENEWABLE
BRITISH COLUMBIA
GRID
BRITISH COLUMBIA
LOWEST
BRITISH COLUMBIA
CC & RE
SABINE
SNOHVIT
GORGON

cleanenergycanada.org The Cleanest LNG in the World? 18
RATIONALE
Alternative design to be world leader. More upstream reductions are required, but likely shorter development time for electricity infrastructure.
Industry standard appears to be direct drive with single cycle turbine. Most global facilities have this set up.
Combined cycle considered best practice in some LNG project documents (Woodside, 2011).
Zero GHG emission source for electrical load at facility. Representative of grid or local renewable options.
Other jurisdictions have or are considering CCS with facilities (Chevron, 2009).
Lowest GHG option for the LNG facility.
Try to meet world class with renewable powered facility and upstream reductions.
Type of field more comparable to B.C. operations (partially shale gas rather than sub-sea).
Best in class LNG facility from GHG intensity perspective (Woodside, 2011)(Nestli, 2007).
Has CCS, planned large operation. (Chevron, 2009) also close to best in class (Woodside, 2011).
DESCRIPTION
Compression: Direct Drive (NG)
Power Generation: Single Cycle (35% efficiency, natural gas)
NG Source: 50/50 Montney (1% CO2 mol)/Horn River (12% CO2
mol)
Compression: Combined Cycle (58% efficieny)
Power Generation: Single Cycle (55% efficiency, natural gas)
Fields: 50/50 Montney (1% CO2 mol)/Horn River (12% CO2 mol)
Compression: Direct Drive (NG)
Power Generation: Renewable energy sources (actual source
undefined)
Fields: 50/50 Montney (1% CO2 mol)/Horn River (12% CO2 mol)
Compression: Direct Drive (NG)
Power Generation: Renewable energy sources (actual source
undefined)
Fields: 50/50 Montney (1% CO2 mol)/Horn River (12% CO2 mol,
but with CCS)
Compression: Electric – Grid/renewable
Power Generation: Renewable energy sources (actual source
undefined)
Fields: 50/50 Montney (1% CO2 mol)/Horn River (12% CO2 mol)
Compression: Electric – zero emission
Power Generation: Grid
Fields: Montney with policy requirements on low bleed valves,
plunger lifts and leak detection and 60% electrification.
Compression: Electric – 73% combined cycle and 27%
renewable
Power Generation: 73% combined cycle and 27% renewable
Fields: Montney with policy requirements on low bleed valves,
plunger lifts and leak detection and 60% electrification.
Compression: Direct Drive (NG)
Power Generation: Single Cycle (NG)
Fields: 50/50 conventional (0.01% CO2) and shale gas
(Barnette, Fayette, Haynesvill) avg. 2.5%.
Compression: Electric Drive
Power Generation: Gas Turbine
Fields: Barents Sea (5% to 8% CO2 mol)
Compression: Direct Drive (NG)
Power Generation: Single Cycle (NG)
Fields: Gorgon/Jansz
SCENARIONAME
BRITISH COLUMBIA STANDARD
BRITISH COLUMBIA COMBINED
CYCLE
BRITISH COLUMBIA
RENEWABLE
BRITISH COLUMBIA
CCS & RENEWABLE
BRITISH COLUMBIA
GRID
BRITISH COLUMBIA
LOWEST
BRITISH COLUMBIA
CC & RE
SABINE
SNOHVIT
GORGON

cleanenergycanada.org The Cleanest LNG in the World? 19
The primary data sources and assumptions associated with the scenarios above are listed here:
1. B.C. Liquefaction/power production: There is no data for proposed liquefaction facilities in B.C. so we estimated actual performance based on the Santos LNG project (Santos/Petronas, 2009). Unlike Gorgon and Snøhvit, this facility does not include onsite gas pro-cessing and CCS power requirements, so is likely more representative of what could be built in B.C.
2. Combined cycle and renewable scenarios: We calculated expected electricity require-ments for the Santos project and then re-cal-culated GHG emissions based on natural gas emissions factors and efficiency for combined cycle turbines and renewable power genera-tion.
3. CCS in B.C.: Assumes 80 percent of CO2 in the produced natural gas could be recovered and sequestered. The Gorgon project as-sumes the same (Chevron, 2009). However, the analysis excludes the additional energy required to achieve these reductions.
4. B.C. Natural Gas Production: We use the most recent GHGenius (GHGenius 4.03) to cal-culate upstream emissions from the Montney and Horn River Fields with 1% CO2 and 12% CO2 in the produced natural gas.
5. The “cold advantage”: B.C. is in a colder climate, which should afford some efficiency benefits. We use an engineering rule of thumb of 1.7% energy efficiency gain per degree Cel-sius reduction in temperature (Morgan, 2012). See “A Cold Climate Advantage?” Page 9 .
6. Additional Natural Gas: We include pro-duction emissions for the additional natural gas for natural gas fired direct drive, single cycle and combined cycle turbines.
7. Sabine: Facility emissions are based on their application (Sabine Pass LNG, 2011) and upstream emissions from GHGenius with 50/50 supply from conventional and shale gas formations.
8. Snøhvit: Snøhvit emissions are based on 2009 operating data and assuming this data includes emissions from natural gas produc-tion, processing and liquefaction. CCS is also included (Statoil, 2009).
9. Gorgon: Information is also primarily from the proponent’s application (Chevron, 2009)
appEndix
data SourcES and aSSumptionS

cleanenergycanada.org