clean development mechanism simplified project design ... · pdf fileclean development...
TRANSCRIPT

CDM-SSC-PDD (version 02) CDM – Executive Board page 1
CLEAN DEVELOPMENT MECHANISM
SIMPLIFIED PROJECT DESIGN DOCUMENT FOR SMALL-SCALE PROJECT ACTIVITIES (SSC-CDM-PDD)
Version 02
CONTENTS
A. General description of the small-scale project activity B. Baseline methodology C. Duration of the project activity / Crediting period D. Monitoring methodology and plan E. Calculation of GHG emission reductions by sources F. Environmental impacts G. Stakeholders comments Annexes Annex 1: Information on participants in the project activity Annex 2: Information regarding public funding Annex 3: Abbreviations Enclosure 1
Calculation for CO2 emission reduction

CDM-SSC-PDD (version 02) CDM – Executive Board page 2
Revision history of this document
Version Number
Date Description and reason of revision
01 21 January 2003
Initial adoption
02 8 July 2005 • The Board agreed to revise the CDM SSC PDD to reflect guidance and clarifications provided by the Board since version 01 of this document.
• As a consequence, the guidelines for completing CDM SSC PDD have been revised accordingly to version 2. The latest version can be found at <http://cdm.unfccc.int/Reference/Documents>.

CDM-SSC-PDD (version 02) CDM – Executive Board page 3 SECTION A. General description of the small-scale project activity A.1. Title of the small-scale project activity: >> Energy efficiency by purge gas recovery at Nagothane Manufacturing Complex of IPCL
Version No 1 Dated 08/09/061. Project Reference No. RIL/I/PDD/0607/008 A.2. Description of the small-scale project activity: >> Introduction Reliance Group has acquired control of Indian Petrochemicals Corporation Limited (IPCL) in the year
2002 when Government of India, as a measure of privatisation of Public Sector Undertakings (PSUs),
divested its equity holding to IPCL to Reliance Group Company. IPCL is the pioneering petrochemical
company in India, established on March 22, 1969. Today, IPCL is one of the leading petrochemical
companies in India involved in the business of manufacturing polymers, synthetic fiber, fiber
intermediates, solvents, surfactants, industrial chemicals, catalysts and adsorbents. The Company is backed
by strong Research Centre, Product Application Centers, Technology Management Centers and Customer
Relations Centers. The company owns and operates three petrochemical complexes - a Naphtha based
complex at Vadodara, Gujarat and Gas based complexes at Nagothane near Mumbai in Maharashtra and at
Dahej near Bharuch in Gujarat. The company produces over one million tonnes of merchant products and
has a turnover close to USD 2bn.
The first manufacturing Plant in Nagothane Manufacturing Complex was commissioned in March 1989.
The Complex houses 6 manufacturing units within the complex spread over nearly 1000 hectares of land.
The different products manufactured at the manufacturing sites are Ethylene, Propylene, Acetylene,
Butene-1, Ethylene Oxide, Ethylene Glycol, Low Density Polyethylene, Linear Low Density
Polyethylene, High Density Polyethylene, Polypropylene and Dehydration catalyst. It also has a Captive
Power Plant. Nagothane Manufacturing Complex is the first fully integrated gas-based Petrochemical
Complex of India.
Purpose Reliance Group, after having taken over management control of Nagothane Manufacturing Complex,
introduced the concept of CDM in energy conservation schemes that result from audit programmes with
the aim of benefit to employees and neighborhood, which were carried out in-house to assess energy
conservation potential at the complex by identifying possibilities to adopt new technologies/ modifications
to minimise the energy losses and reduce specific energy consumption. Reliance Industries Limited is
1 All dates are in dd/mm/yy format

CDM-SSC-PDD (version 02) CDM – Executive Board page 4 consciously working in the field of energy conservation and management to reduce Greenhouse Gas
emission. In recognition of its effort, contribution and success, Nagothane Complex became winners of
various energy conservation awards like National Energy Conservation Award in Petrochemicals Sector
by Ministry of Power, Government of India, Award for Excellence in Natural Gas Conservation by GAIL
and also is also recipient of various awards for its work in the field of Environment protection, Pollution
reduction and safety.
The purpose of undertaking this project activity was recovery of the heat that was being wasted on flaring
of the Purge Gas from the LLDPE/HDPE2 reactor in Train-I, and using the same to increase the gaseous
fuel component and reducing LSHS in the fuel mix being fired for steam generation in Heat Recovery
Steam Generator (HRSG) at the Captive Power Plant. This results in useful utilization of the heat
component of a hydrocarbon stream that was being flared and thus improves energy efficiency by reducing
additional fuel usage in the form of LSHS at Captive Power Plant for steam generation. The project
activity also contributes towards reduction of emission of Greenhouse Gas from burning equivalent
quantity of LSHS.
In Nagothane Manufacturing Complex there are two manufacturing lines, called trains, of manufacturing
LLDPE and HDPE in fluidised bed swing reactor process. Train-I has a capacity of 140,000 TPA and
Train-II is of 80,000 TPA.
In the fluidized bed polymerisation reactors, the partial pressures of different reacting components like
ethylene, hydrogen, 1-Butene and inerts like hexane, pentane and nitrogen are maintained depending upon
the grade of product. The active pre-polymerised catalyst powder is continuously injected in the reactor
by using high-pressure nitrogen. In this process some amount of nitrogen continuously goes into the
reactor. A quantity of gas, rich in hydrocarbons and hydrogen, is continuously purged from the reactor gas
loop in order to maintain the constant partial pressure of nitrogen and other inert components, including
ethane and butane that are produced as by-products. Prior to the project activity, this Purge Gas from
Train-I was sent to flare where it was burnt.
The steam generated in Captive Power Plant is used in various manufacturing processes in the Nagothane
Manufacturing Complex and for power generation in a Steam Turbine Generator. The Captive Power Plant
uses a mix of liquid and gaseous fuel for seam generation. Heat from combusting fuels like LSHS, Mixed
Oil Lean Gas and Fuel gas are regularly used in HRSGs, along with the hot combustion gases from Gas
Turbine Generators, to generate steam.
Purge gases from Train-I are routed through a hydrocarbon recovery unit using membrane assisted
separation process where most of the hydrocarbons, sources of carbon dioxide, are removed allowing
2 Linear Low Density Polyethylene; High Density Polyethylene

CDM-SSC-PDD (version 02) CDM – Executive Board page 5 hydrogen to go through. The effluent gases from the Membrane Separation Unit (MSU) are routed through
a cyclone separator and filter to separate polymer powder from the gas and the latter joins the Fuel Gas
drum 10-V-206 in Gas Cracker Plant. Fuel Gas from Gas Cracker unit is fed under pressure control into
this Fuel gas drum 10-V-206. Addition of Purge Gas from LLD/HD Plant to the Fuel Gas Drum displaces
Fuel Gas, which is now available for use in HRSGs of Captive Power Plant for generation of steam. A
schematic diagram of the routing of these gases is provided in Fig.1. All these gases, both before and after
implementation of the project, were undergoing combustion, with the difference that the heat from the
Purge gas was lost to the atmosphere. In the project scenario energy in the form of heat is recovered and
used in steam generation leading to an improvement in energy efficiency. As the Purge Gas replaces an
equivalent quantity of LSHS in the HRSG, the project achieves it objective of reducing Greenhouse Gas
emission from that LSHS that is now conserved.
Sustainable development:
The project also contributes to sustainable development in terms of environmental, socio-economic and
technological development by
• Reduction in fossil fuel consumption - a non-renewable source of limited availability.
• Reduction in GHG emission, mainly carbon dioxide.
• Prevention of air quality deterioration due to adverse effects of
o Fossil fuel extraction,
o Petroleum processing, and
o Fuel transportation.
• Reduction in atmospheric vent of hydrocarbon.
• Encouraging other large facilities irrespective of sector to adopt small but effective fuel switch
measures.
• Release the available primary source of energy, LSHS, for processes where it is necessary
The four criteria for sustainable development as defined by Host Government are addressed as follows:
Community Development
Nagothane Manufacturing Complex is resolved to Reduce – Reuse – Recycle the waste generated in the
manufacturing process and the residential township nearby housing its employees. This is what is being
practiced at by way of implementation of Internationally Accredited Environmental Management System
of ISO-14001.
The key Resource Conservation measures implemented are
• Reduction and re-use of water aiming towards Zero Discharge ,
• Reduction in emission of Greenhouse gases by re-use of hydrocarbon streams,

CDM-SSC-PDD (version 02) CDM – Executive Board page 6
• Reduction in generation of waste and re-cycling for beneficial use,
• Switchover from Ozone depleting substances
The latest initiative is implementation of “ZERO GARBAGE” concept to make the residential township an
eco-friendly zone.
Socially oriented Activities: Nagothane Manufacturing Complex is continuously striving and working for
socio-economic development of villages around the Complex. The programmes/activities are three
pronged and includes:
1) Training : Imparting training/awareness to village youth, women and men folk in farm as well
non-farm trade skills e.g. training in tailoring, vaccination of poultry, motor driving, computer
education, awareness on AIDS, Balwadi teacher training, typing, welding, etc.
2) Input supply – The villagers and tribal people are aided by providing following inputs-
a) Distribution of improved variety paddy seeds and other Agricultural inputs -
Organizing an exhibition and sale Camp of improved variety of paddy seeds, mixed
fertilizer, pesticides & other agricultural inputs at subsidized cost.
b) Distribution of glass Roof Tiles - As an energy conservation measure and to improve
illumination, villagers have been provided glass Roof Tiles at subsidised rates.
c) Promoting Kisan nursery – Financial and technical aid to raise saplings of trees in the
nursery run by farmers.
d) Distribution of fruit tree graft & vegetable saplings to schools and Panchyats.
3) Developmental :
a) Formation of Self - Help Groups has been initiated to promote and inculcate the habit of
saving money, strengthen the hands of women folk & promote entrepreneurship among
women folk. The efforts have yielded results with 47 self-help groups in operation with
more than 600 women members from neighbouring villages. Recently an SHG has been
formed in 2 tribal Hamlet of Killawadi AND Gangawane with 20 and 19 Members
respectively. Efforts are on to form SHG in other tribal hamlets as well.
b) Animal husbandry & Poultry: The onset of disease wipes away the cattle and poultry
raised by the villagers. As a preventive measure, Vaccination camps are organized and the
response for such initiatives from villagers is very encouraging.
c) Construction of check dams, rain water harvesting demonstrations, Kirtan programmes,
cultural programme, etc.

CDM-SSC-PDD (version 02) CDM – Executive Board page 7
d) Infrastructure development projects in the neighbouring villages which includes
construction of internal roads, bus-stops, laying of pipeline for supply of water and
reservoir for water. Free water supply is also provided to the neighbouring villages.
The testimony to the efforts put in by Nagothane Manufacturing Complex towards resource
conservation, environmental up-gradation and ecological conservation is reflected from the awards
bestowed to it which includes.
a) Maharashtra State Vanashree Award for ecological up-gradation and afforestation efforts.
b) Dr R.J Rathi Award of Environmental Pollution control for “Outstanding efforts in
controlling Pollution and protecting the Environment”.
c) Indo-German Greentech Award for “Outstanding achievement in the field of
Environmental protection”.
d) Indira Gandhi National Award for “Best Environmental and Ecological Implementation”.
Environmental impact: The project activity has reduced consumption of fossil fuel for generation of heat
energy based on LSHS, thus directly reducing emission of Greenhouse Gases (GHG) like carbon dioxide
in addition to other pollutants like NOx and SOx. It has also resulted in an indirect improvement in air
quality by way of reduced emissions as a result of exploration, processing and transportation of fuel. This
contributes to the sustainable development of environment.
Social impact: The project activity generated employment during the erection and commissioning of the
project. Interaction with the Technology provider for the Membrane Separation Unit and enhanced the
skill sets of manpower.
Economic impact: The project activity reduces fossil fuel consumption in the Heat Recovery Steam
Generators, thus reducing the variable cost of steam production. Though the quantum of savings are
negligible as compared to total turnover of the site, directionally the project contributes to economic
development.
Technological impact : This kind of innovative and effective energy efficiency measures serve to
demonstrate the operational efficacy of such systems and encourage others to adopt similar measures
leading to further conservation of fuel and protection of environment.
A.3. Project participants: >>

CDM-SSC-PDD (version 02) CDM – Executive Board page 8 Name of the Party involved (*) ((Host ) indicates a host Party )
Private and / or Public entity(ies) project participants (*)( as applicable )
Indicate if the party involved wishes to be considered as project participant ( Yes / No )
India [ (Ministry of Environment
and Forest (MoEF)(Host party)]
Reliance Industries Limited
(Private entity)
No
Contact information of project proponent is attached as Annex-I.

CDM-SSC-PDD (version 02) CDM – Executive Board page 9 A.4. Technical description of the small-scale project activity: >> Nagothane Manufacturing Complex is an integrated Petrochemical complex using ethane/propane as the
main feedstock. There are downstream production units to convert the cracked products of ethane and
propane to value added products.
In Nagothane Manufacturing Complex there are two manufacturing lines, called trains, of manufacturing
LLDPE and HDPE in fluidised bed reactors. Train-I has a capacity of 140,000 TPA and Train-II is of
80,000 TPA.
In the fluidized bed polymerisation reactor of Train-I, the reactants are ethylene, hydrogen and 1-Butene,
that polymerise in the presence of a partially pre-polymerised Ziegler-Nata catalyst to form either LLDPE
or HDPE depending on the reaction conditions and the partial pressure of these reactants. The active pre-
polymerised catalyst powder is continuously injected into the reactor by using high-pressure nitrogen. In
this process some amount of nitrogen continuously goes into the reactor. Other inert components that play
an enabling role in the reaction but do not participate directly in it e.g. hexane and pentane, are also
present in the reactor gas loop. The un-reacted gases along with inert substances are withdrawn from the
top of the reactor and recycled back after adjusting the same for concentration of reactants and the inert
substances. In order to control the concentration of inert substances in the reactor gas loops, some amount
of the gas from these loops is withdrawn and purged to flare. This stream is rich in hydrocarbons and
hydrogen, including ethane and butane that are produced as by-products. Prior to the project activity, as
recommended by the process licensor, this Purge Gas from the reactor gas loops was sent to flare where it
was burnt.
The steam generated in Captive Power Plant is used in various manufacturing processes in the Nagothane
Manufacturing Complex and for power generation in a Steam Turbine Generator. The Captive Power Plant
uses a mix of liquid and gaseous fuel for steam generation. Heat from combusting fuels like LSHS, Mixed
Oil, Lean Gas and Fuel gas are regularly used in HRSGs, along with the hot combustion gases from Gas
Turbine Generators, to generate steam.
In order to further restrict the passage of higher hydrocarbons to combustion process, the scheme was
developed wherein Purge gases from Train-I are routed through a hydrocarbon recovery unit using
membrane assisted separation process. Most of the hydrocarbons, sources of carbon dioxide, are removed
in this Membrane Separation Unit (MSU).
The membrane can be defined essentially as a barrier, which separates two phases and restricts transport of
various chemicals in a selective manner. A membrane separation system separates an influent stream into
two effluent streams known as the permeate and the concentrate. The permeate is the portion of the fluid

CDM-SSC-PDD (version 02) CDM – Executive Board page 10 that has passed through the semi-permeable membrane, whereas the concentrate stream contains the
constituents that have been rejected by the membrane.
The effluent gases from the Membrane Separation Unit (MSU) are routed through a cyclone separator and
filter to separate polymer powder from the gas and the latter joins the Fuel Gas drum 10-V-206 in Gas
Cracker Plant. Fuel Gas from Gas Cracker unit is fed under pressure control into this Fuel gas drum 10-V-
206. Addition of Purge Gas from LLDPE/HDPE Plant to the Fuel Gas Drum displaces Fuel Gas, which is
now available for use in HRSGs of Captive Power Plant for generation of steam. A schematic diagram of
the routing of these gases is provided in Fig.1. All these gases, both before and after implementation of the
project, were undergoing combustion, with the difference that the heat from the Purge gas was lost to the
atmosphere. In the project scenario energy in the form of heat is recovered and used in steam generation
leading to an improvement in energy efficiency as the energy input from additional quantity of LSHS is
eliminated. As the Purge Gas replaces an equivalent quantity of LSHS in the HRSG, the project achieves it
objective of reducing Greenhouse Gas emission from that LSHS that is now conserved.
Fig 1. Schematic of Purge Gas recovery A.4.1. Location of the small-scale project activity:
To HRSG at CPP
10-V-206
PV4002
PV4001
To Gas Cracker
Fuel Gas from Gas Cracker
Cyclone separator
Filter
Membrane Separation
Unit
Lean Gas from GAIL
Purge Gas from Train-I

CDM-SSC-PDD (version 02) CDM – Executive Board page 11 >> INDIA A.4.1.1. Host Party(ies): >> INDIA A.4.1.2. Region/State/Province etc.: >> MAHARASHTRA A.4.1.3. City/Town/Community etc: >> P.O. : Petrochemicals Township, Nagothane – 402 125 Dist. : Raigad. A.4.1.4. Detail of physical location, including information allowing the unique identification of this small-scale project activity(ies): >>
The project site is located at the manufacturing premises of Nagothane Manufacturing Complex,
in the state of Maharashtra in the Western part of India. It is about 120 Km from Mumbai. The
nearest National Highway is NH-17 and the nearest railway station is at Nagothane. The site
coordinates are Latitude 180. 33’ 51” E and Longitude 730 6’ 14.6” N.

CDM-SSC-PDD (version 02) CDM – Executive Board page 12 A.4.2. Type and category(ies) and technology of the small-scale project activity: >> Type II D( Ver 07 ): Energy efficiency by purge gas recovery at Nagothane Complex of IPCL
Sectoral Scope: Manufacturing Industries;
Scope Number: 4
A.4.3. Brief explanation of how the anthropogenic emissions of anthropogenic greenhouse gas (GHGs) by sources are to be reduced by the proposed small-scale project activity, including why the emission reductions would not occur in the absence of the proposed small-scale project activity, taking into account national and/or sectoral policies and circumstances: >> Prior to the implementation of the project activity, Purge Gas from the reactor gas loop in the
LLDPE/HDPE Plant was being flared. As a result, the thermal energy available from this stream was lost.
At CPP, the HRSGs consume a mix of liquid and gaseous fuels like LSHS, Mixed Oil, Lean Gas and Fuel
Gas. It has always been an endeavour to maximize usage of the hydrogen rich Fuel gas stream and
minimize firing LSHS and Mixed oil. Hence, after the project was implemented, the Purge Gas from
LLDPE/HDPE Plant is consumed at Gas Cracker Plant, releasing extra quantity of Fuel Gas to be
consumed for steam generation at CPP.
Carbon dioxide emission from combustion of Purge gas remains the same before and after the
implementation of the project. However, in the post project scenario, the energy from an internally
generated reaction product that was lost in flare was recovered and additional energy input in the form of
an energy-wise equivalent quantity of LSHS firing was reduced leading to reduction in carbon dioxide
emission.
Hence, in the event, the Purge Gas stream was not used as a fuel, an energy-wise equivalent LSHS
would have been continued to burn in the HRSGs, additionally contributing to carbon dioxide
emission.
A.4.3.1 Estimated amount of emission reductions over the chosen crediting period: >> As stated above, the reduction in emission of carbon dioxide is a resultant of the project activity. The
project was commissioned on 09/07/05. The estimated reduction of carbon dioxide emission from the
project is given in the Table A.1 below. Details are indicated in the tables in Section B.

CDM-SSC-PDD (version 02) CDM – Executive Board page 13 Emission reductions
Table A.1 Year Annual estimation of emission reduction
tonnes CO2 e Jan'07 to Dec'07 6700
Jan'08 to Dec'08 6700
Jan'09 to Dec'09 6700
Jan'10 to Dec'10 6700
Jan'11 to Dec'11 6700
Jan'12 to Dec'12 6700
Jan'13 to Dec'13 6700
Jan'14 to Dec'14 6700
Jan'15 to Dec'15 6700
Jan'16 to Dec'16 6700
Total estimated reductions ( tonnes CO2 e ) 67000
Total Number of crediting years 10
Annual Average over the crediting period of
estimated reductions ( tonnes of CO2 e )
6700
A.4.4. Public funding of the small-scale project activity: >> No public funding has been sought for the project activity and the project proponent made the entire
investment for the project from funds available with itself.
A.4.5. Confirmation that the small-scale project activity is not a debundled component of a larger project activity: >> As mentioned under Appendix C of the simplified Modalities and Procedure for Small-Scale CDM project
Activities, “ A proposed small-scale project activity shall be deemed to be a debundled component of a
large project activity if there is a registered small-scale CDM project activity or an application to register
another small-scale CDM project activity:
• With the same project participants
• In the same project category and technology / measure and
• Registered within the previous 2 years and
• Whose boundary is within 1 km of the project boundary of the proposed small-scaled activity at the
closest point.”

CDM-SSC-PDD (version 02) CDM – Executive Board page 14 The project activity is not a debundled component of a large project activity as there is no small scale
CDM project activity or an application registered by Nagothane Manufacturing complex, in the same
project category in the last two years within 1 km of the project boundary of the proposed small-scale
project activity.

CDM-SSC-PDD (version 02) CDM – Executive Board page 15 SECTION B. Application of a baseline methodology: B.1. Title and reference of the approved baseline methodology applied to the small-scale project activity: >> Type II D ( Ver 7 ): Energy efficiency and fuel switching measures for industrial facilities
Reference : Categorisation of Appendix B to the simplified modalities and procedures for small-scale
CDM project activities.
B.2 Project category applicable to the small-scale project activity: >> Applicability criteria of the project as mentioned in the methodology AMS IID are as follows:
These criteria in the context of the project are point-wise addressed in the following table:
Table B.1 Category Criteria Project Activity Applicability Type II D Energy efficiency measures
implemented at a single
industrial facility
The project is implemented at a single
facility, i.e. at the Nagothane
Manufacturing Complex. The project
is aimed at energy efficiency.
Methodology
is applicable
The category covers project
activities aimed primarily at
energy efficiency
The Project activity improves energy
efficiency as it reduces wastage of
energy through flaring of
hydrocarbons.
Methodology
is applicable
The measures may replace
existing equipment or be
installed in a new facility
The project involves recovery of
waste hydrocarbon stream.
Methodology
is applicable
The aggregate energy savings of a single project may not exceed the equivalent of 15 GWhe per year. A total saving of 15 GWhe per year is equivalent to a maximum saving of 45 GWhth per year in fuel input to the generation unit.
The enrgy saving through this activity
is 24.3 GWHTh per year.
Methodology
is applicable
From the above discussion, it can be concluded that the project meets all the applicability criteria set out
under the selected small-scale methodology and hence the project category is applicable to the project.

CDM-SSC-PDD (version 02) CDM – Executive Board page 16 The emission factor for LSHS has been taken from IPCC Good Practice Guidance, 2000. The calculation
procedure has been provided in Annexure 3.
B.3. Description of how the anthropogenic emissions of GHG by sources are reduced below those that would have occurred in the absence of the registered small-scale CDM project activity: >> As explained above, the project initiatives qualify under Type II, D- Energy efficiency and fuel switching
measures for industrial facilities of small scale CDM simplified modalities and procedure. The project
additionality is analysed below.
In accordance with paragraph 28 of the simplified modalities and procedures for small scale CDM
projects, a simplified baseline and monitoring methodology is listed in Appendix B may be used if the
project participant can demonstrate that project activity would otherwise not be implemented due to the
existence of one or more barrier (s) listed in the attachment A to Appendix B. Similarly, for the identified
CDM project, following barriers have been overcome:
The project proponent is actively participating in efforts towards reduction in emission of Greenhouse
Gases. The company has contributed to sustainable development initiatives of the country through various
boards, advisory committees. The backup papers can be furnished to the validator if so desired. As
described before, the project, commissioned on 09/07/2005, aims at reducing wastage of energy, in other
words improving energy efficiency by recovering the hydrocarbon stream being flared and using it to
reduce LSHS consumption. The project activity would not have occurred anyway due to at least one of the
following barriers.
As described before, the project aims at reducing wastage of energy, that is improving energy efficiency
by recovering the hydrocarbon stream being flared and using it to partially eliminate additional LSHS
consumption in the HRSGs at Captive Power Plant.
Additionality of the project is justified based on the guidelines in Attachment A to Appendix B of the
simplified modalities and procedures for small-scale projects. The project activity would not have occurred
anyway due to at least one of the following barriers.
Investment barrier: A financially more viable alternative to the project activity would have led to higher
emissions;
Technological barrier: A less technologically advanced alternative to the project activity involves lower
risks due to the performance uncertainty or low market share of the new technology adopted for the project
activity and so would have led to higher emissions;
Barrier due to prevailing practice: Prevailing practice or existing regulatory or policy requirements
would have led to implementation of a technology with higher emissions;

CDM-SSC-PDD (version 02) CDM – Executive Board page 17
Other barriers: Without the project activity, for another specific reason identified by the project
participant, such as institutional barriers or limited information, managerial resources, organizational
capacity, financial resources, or capacity to absorb new technologies, emissions would have been higher.
Table B.2 Steps Additionality Requirements Status of Additionality
Check Step 1 Identification of alternatives to the project activity consistent
with current laws and regulations
Sub-step 1a. Define alternatives to the project activity:
Following alternatives for the project are identified
1) Project activity without CDM benefit
2) Continuation of existing practice
The first alternatives is ruled out because of various
investments, technological and prevailing practice barrier
which are elaborated below.
Continuation with the existing practice i.e. flaring the Purge
Gas stream would have been the most plausible alternative as
this alternative was not affecting business scenario. Hence,
continuation with the existing practice is the baseline scenario.
The project proponent has executed this project as an effort to
reduce Greenhouse Gas emission.
Sub-step 1b. Enforcement of applicable laws and
regulations:
There are/were no regulations and programs either at the State
or Municipal or Country levels that compel or constrain the
facility from implementing energy efficiency projects. In the
Manufacturing sector in India, energy efficiency projects are
not under the purview of any legal act. However, this project
activity complies with all good and safe engineering practices.
The additionality check for Step 1 has been crossed.
Step 2 & 3 Identification of Barrier
Technological barriers:
Concerns identified are as follows:
1. Risks involved: The project activity involves
The additionality check
for Steps 2 & 3 has been
crossed.
3 Document available for reference

CDM-SSC-PDD (version 02) CDM – Executive Board page 18
Steps Additionality Requirements Status of Additionality Check
recovering a stream that is a mixture of hydrocarbons
and other gases like ethane, ethylene, butane, 1-Butene,
pentane, hexane, hydrogen, nitrogen and suspended
particles of polythelene powder. The nitrogen content
in the Purge stream is almost 50% by volume. Nitrogen
being an inert gas, can cause flame out of burners
resulting in shutdown of furnaces. The fine particles of
polymer present in the stream gets deposited on filters
and sensitive flow measuring equipment causing
fluctuation in fuel flow. The polymer particles also
deposit as char on the burner tips resulting in
deteriorated burner performance. Fluctuation in fuel
flow and under-performance of burners can result in
shutdown of furnaces. In continuous chemical
industries, such equipment failures are a cause of major
financial setback due to both loss of production and
loss of material that take place due to emergency
procedures.
2. Other operation risks: The membrane separation unit
installed is the first such equipment installed in India3.
Project proponent has to train the employees as they are
neither experienced nor trained to handle emergency
troubleshooting and crisis situations in the operation of
Membrane Separation Unit. Since the operation and
maintenance of this equipment is new, the risks
associated with the unforeseen circumstances are not
identified. Implementation of the project has resulted in
additional risks which the operating personnel have to
tackle on a day to day basis by vigilant monitoring of
the Membrane Separation Unit as well as the attached
systems.
It can be appreciated that the risks involved in operating the
system of recovery were sufficient to warrant non-approval of
the scheme. Further noting that the business in general of

CDM-SSC-PDD (version 02) CDM – Executive Board page 19
Steps Additionality Requirements Status of Additionality Check
Nagothane Manufacturing Complex was not impacted by
flaring of this stream as was being practiced, there was no
compelling reason for Nagothane Manufacturing Complex,
other than reducing GHG emission reduction, to recognize the
risks and still implement the recovery scheme.
The project activity crosses technological barriers as the
project proponent has mitigated significant risk by installing
safety instruments and automations, although project
proponent had no experience to implement this project. The
system becomes much more complicate which may disturb the
main product quality if things go wrong.
Step 4: Barrier due to prevailing practice
The Membrane Separation Unit installed to reduce
hydrocarbon content in the Purge Gas and thus reduce GHG
emissions, is the first such equipment installed in India4.The
prevailing practice in similar sized plants elsewhere, is flaring
of this stream, thus losing the energy therein and consuming
GHG emitting fossil fuel making the process energy
inefficient.
Nagothane Manufacturing Complex has adopted a scheme that
is not a common practice and does not lead to additional
emission of GHG.
For the Petrochemicals sector in India, energy efficiency
projects are not under the purview of any legal act. However,
this project activity complies with all good and safe
engineering practices. Hence, there is no mandatory
requirement for project proponent to implement the energy
efficiency project such as this project activity
The project proponent regularly initiate energy efficiency
programmes at their manufacturing sites and have also taken
voluntary initiatives to realize the potential of Clean
The additionality check
for Step 4 has been
crossed.
4 http://www.mtrinc.com/Pages/News/news_old.html

CDM-SSC-PDD (version 02) CDM – Executive Board page 20
Steps Additionality Requirements Status of Additionality Check
Development Mechanism under the Kyoto Protocol by
organizing workshop / Energy Conservation meet. Such
initiative needs considerable investment, highly skilled &
trained personnel and dedicated technical personnel to monitor
the energy utilized. Awareness and systematic approach
towards energy conservation and reduction of GHG emission
is not a common practice in the country.
It is also not a common practice in Indian industries to carry
out such major modifications in the process on ground of
energy conservation alone. In recognition of its effort,
contribution and success, Project proponent became winners
of various energy conservation awards like National Energy
Conservation Award in Petrochemicals Sector by Ministry of
Power, Government of India, and Award for Excellence in
Natural Gas Conservation by GAIL and is also recipient of
various awards for its work in the field of Environment
protection, Pollution reduction and safety.
Step 5 Impact of CDM registration The approval and registration of the project activity as a CDM
activity would result inter alias in the following benefits:
• Reduction in GHG emissions.
• CDM fund will provide additional coverage to cover the
risk due to failure of project, shut down of plant and loss
of production.
• The fund will stimulate efforts in Nagothane
Manufacturing Complex to find methods of mitigating
risks and enhance replication of such projects to promote
GHG abatement in the industry.
• Publicity of the efforts taken by the project proponent
towards energy efficiency would result in sustainable
development; and
The social status of the company would be enhanced.
The additionality check
for Step 5 has been
crossed.

CDM-SSC-PDD (version 02) CDM – Executive Board page 21 B.4. Description of how the definition of the project boundary related to the baseline methodology selected is applied to the small-scale project activity: >> The project boundary is the physical, geographical site of the industrial facility, process or equipment that
is affected by the project activity”. A simple schematic diagram showing the project boundary and the
equipments considered in the project activity is shown below.
Fig 3. Schematic of Project Boundary B.5. Details of the baseline and its development: >> In the absence of the project activity, the HRSGs at Captive Power Plant (CPP) would have continued to
consume LSHS equivalent to the energy obtained from the recovered stream. Had the project activity not
been carried out at Nagothane Manufacturing Complex, it would have, additionally, continued to flare the
Purge Gas stream..
Hence the baseline for the project activity will be the energy equivalent quantity of LSHS used in the
HRSGs at Captive Power Plant.
Date of completing of this baseline development: 08/09/06
Name of person/entity determining the baseline: Reliance Industries Limited
Contact details are given in Annexure 1.
Table B.2 Emission reduction due to recovered Purge Gas Stream
1 Monthly average Purge Gas recovered (Apr’04 to Jun’05)
Kg/month QPG Calculated
Membrane Separation Unit
Gas Cracker Plant
Purge Gas to Flare
Cyclone separator and Filter
Train-I Gas Loop
HRSGs at CPP
Project Boundary

CDM-SSC-PDD (version 02) CDM – Executive Board page 22
2 Composton of AWC 2.a Avg Ethane (C2) content in Purge gas % wt NET Laboratory analysis 2.b Avg Ethylene (C2') content in Purge gas % wt NETY Laboratory analysis 2.c Avg Butane (C4) content in Purge gas % wt NBU Laboratory analysis 2.d Avg 1-Butene (C4') content in Purge gas % wt NBU1 Laboratory analysis 2.e Avg Pentane (C5) content in Purge gas % wt NPE Laboratory analysis 2.f Avg Hexane (C6) content in Purge gas % wt NHX Laboratory analysis 2.g Avg Hydrogen (H2) content in Purge gas % wt NH2 Laboratory analysis 3 Quantty of recovered hyrocarbon 3.a Quantity of C2 Kg/month QET Calculated 3.b Quantity of C2' Kg/month QETY Calculated 3.c Quantity of C4 Kg/month QBU Calculated 3.d Quantity of C4' Kg/month QBU1 Calculated 3.e Quantity of C5 Kg/month QPE Calculated 3.f Quantity of C6 Kg/month QHX Calculated 3.g Quantity of H2 Kg/month QH2 Calculated 4 Molecular weight of components 4.a Molecular wt of C2 MWET Standard figures 4.b Molecular wt of C2' MWETY Standard figures 4.c Molecular wt of C4 MWBU Standard figures 4.d Molecular wt of C4' MWBU1 Standard figures 4.e Molecular wt of C5 MWPE Standard figures 4.f Molecular wt of C6 MWHX Standard figures 4.g Molecular wt of H2 MWH2 Standard figures 5 Moles of CO2 from recovered
components
5.a Moles of CO2 from C2 Kg-moles/month MET Calculated 5.b Moles of CO2 from C2' Kg-moles/month METY Calculated 5.c Moles of CO2 from C4 Kg-moles/month MBU Calculated 5.d Moles of CO2 from C4' Kg-moles/month MBU1 Calculated 5.e Moles of CO2 from C5 Kg-moles/month MPE Calculated 5.f Moles of CO2 from C6 Kg-moles/month MHX Calculated 5.g Moles of CO2 from H2 Kg-moles/month MH2 Calculated 5.h Total CO2 emission Kg-moles/month MCO2 Calculated 6 Energy from recovered Purge Gas 6.a NCV of C2 TJ/T NCVET Standard figures 6.b NCV of C2' TJ/T NCVETY Standard figures 6.c NCV of C4 TJ/T NCVBU Standard figures 6.d NCV of C4' TJ/T NCVBU1 Standard figures 6.e NCV of C5 TJ/T NCVPE Standard figures 6.f NCV of C6 TJ/T NCVHX Standard figures 6.g NCV of H2 TJ/T NCVH2 Standard figures 6.h Energy from recovered C2 TJ/month HET Calculated 6.i Energy from recovered C2' TJ/month HETY Calculated 6.j Energy from recovered C4 TJ/month HBU Calculated 6.k Energy from recovered C4' TJ/month HBU1 Calculated 6.l Energy from recovered C5 TJ/month HET Calculated
6.m Energy from recovered C6 TJ/month HHX Calculated 6.n Energy from recovered H2 TJ/month HH2 Calculated

CDM-SSC-PDD (version 02) CDM – Executive Board page 23
6.o Total energy recovered TJ/month HPG Calculated 7 Baseline: CO2 emission due to LSHS 7.a Ratio of heater efficiency before and after
project implementation Reff
Calculated 7.b Carbon emission factor for LSHS tC/TJ EfC IPCC Default 7.c Oxidation factor Of IPCC Default 7.d CO2 emission factor of LSHS tCO2/TJ EfCO2 Calculated 7.e Emission due to LSHS consumption
equivalent to energy of Purge Gas recovered
tCO2/month E
Calculated 7.f Total operating months in a year months OP Annual 7.g Baseline:Total CO2 emissions in a year tCO2/year Eyear Calculated

CDM-SSC-PDD (version 02) CDM – Executive Board page 24 SECTION C. Duration of the project activity / Crediting period: C.1. Duration of the small-scale project activity: >> C.1.1. Starting date of the small-scale project activity: >> 10/01/2004
(Date of start of procurement)
C.1.2. Expected operational lifetime of the small-scale project activity: >> 20 years C.2. Choice of crediting period and related information: >> Fixed crediting period has been selected
C.2.1. Renewable crediting period: >> Not applicable
C.2.1.1. Starting date of the first crediting period: >> Not applicable
C.2.1.2. Length of the first crediting period: >> Not applicable C.2.2. Fixed crediting period: >> Yes C.2.2.1. Starting date: >> 01/01/2007 ( date by which the project is expected to be registered ) C.2.2.2. Length: >> 10 Years

CDM-SSC-PDD (version 02) CDM – Executive Board page 25 SECTION D. Application of a monitoring methodology and plan: >> D.1. Name and reference of approved monitoring methodology applied to the small-scale project activity: >> As per Appendix B of the simplified modalities and procedures for small-scale CDM project activities, the
name and reference of approved monitoring methodology applied to this project activity are:
Type II D( Ver 7 ): Energy efficiency and fuel switching measures for industrial facilities
D.2. Justification of the choice of the methodology and why it is applicable to the small-scale project activity: >> In addition to the emissions arising from LSHS/Liquid fuel combustion in HRSGs, additional CO2
emissions occur during fossil fuel extraction, processing and transportation to the consumption site. In
view of insufficient specific data on these activities as applicable to this project activity, the resultant
emissions are not included in the project. This also provides a conservative estimate of the emission
reductions.
As per the provisions of paragraph 14 of Draft Simplified Modalities and Procedures for Small Scale CDM
Project Activities [FCCC/CP/2002/7/Add.3, English, Page 21] the “Project participants may use the
simplified baseline and monitoring methodologies specified in appendix B for their project category” if
they meet the applicability criteria of Small scale CDM project activity. As detailed in Section B.2 of this
Project design Document, Category IID is applicable to the project activity. Hence, the monitoring
methodology and plan has been developed in line with the guidance provided in Appendix B.
The baseline emission is CO2 emission from combustion of LSHS to the extent limited by the energy
available from the recovered Purge Gas stream.
As per the provisions set in the Category IID methodology, the following parameters are to be measured
and monitored in the project activity.
• Quantity of Purge Gas stream recovered and sent to Gas Cracker Plant.
• Laboratory analysis of the composition of this stream

CDM-SSC-PDD (version 02) CDM – Executive Board page 26 D.3 Data to be monitored: >>
ID number
Data type
Data Variable
Data unit
Measured (m)
Calculated (c) or
Estimated (e)
Recording Frequency
Proportion of data to
be monitored
How will the data
be archived
(electronic /paper)
For how long is
archived data kept
Comment
Parameters to determine recovery of hydrocarbon stream and thereby obtain energy of equivalent LSHS to be replaced. D.3.1 Purge Gas to Gas
Cracker Plant QPG T m Monthly 100% Electronic
Crediting period (10 years)+ 2
yrs Available on DCS
D.3.2 Ethane content in Purge Gas stream
NET % wt m
Daily 100% Electronic
Crediting period (10 years)+ 2 yrs
Available from Laboratory analysis of sample collected of Purge Gas stream
D.3.3 Ethylene content in Purge Gas stream
NETY % wt m
Daily 100% Electronic
Crediting period (10 years)+ 2 yrs
Available from Laboratory analysis of sample collected of Purge Gas stream
D.3.4 Butane content in Purge Gas stream
NBU % wt m
Daily 100% Electronic
Crediting period (10 years)+ 2 yrs
Available from Laboratory analysis of sample collected of Purge Gas stream
D.3.5 1-Butene content in Purge Gas stream
NBU1 % wt m
Daily 100% Electronic
Crediting period (10 years)+ 2 yrs
Available from Laboratory analysis of sample collected of Purge Gas stream
D.3.6 Pentane content in Purge Gas stream
NPE % wt m
Daily 100% Electronic
Crediting period (10 years)+ 2 yrs
Available from Laboratory analysis of sample collected of Purge Gas stream

CDM-SSC-PDD (version 02) CDM – Executive Board page 27 D.3.7 Hexane content
in Purge Gas stream
NHX % wt m
Daily 100% Electronic
Crediting period (10 years)+ 2 yrs
Available from Laboratory analysis of sample collected of Purge Gas stream
D.3.8 Hydrogen content in Purge Gas stream
NH2 % wt m
Daily 100% Electronic
Crediting period (10 years)+ 2 yrs
Available from Laboratory analysis of sample collected of Purge Gas stream
Constants used D.3.9 Net Calorific
Value of LSHS NCVLSHS -- -- -- -- -- --
IPCC default = 40.19 TJ/kT (IPCC ID: 17154)
D.3.10 Emission factor for LSHS
EfC tC/TJ IPCC default = 21.1 tC/TJ (IPCC ID: 110660)
D.3.11 Oxidation factor for LSHS
IPCC default = 0.99 (IPCC ID: 110712)
D.3.12 Net Calorific Value of Ethane
NCVET Kcal/Kg -- -- -- -- -- 11332 Kcal/Kg Standard value – applicable throughout the project duration
D.3.13 Net Calorific Value of Ethylene
NCVETY Kcal/Kg -- -- -- -- -- 11279 Kcal/Kg Standard value – applicable throughout the project duration
D.3.14 Net Calorific Value of Butane
NCVBU Kcal/Kg -- -- -- -- -- 11010 Kcal/Kg Standard value – applicable throughout the project duration

CDM-SSC-PDD (version 02) CDM – Executive Board page 28 D.3.15 Net Calorific
Value of 1-Butene
NCVBU1 Kcal/Kg -- -- -- -- -- 11226 Kcal/Kg Standard value – applicable throughout the project duration
D.3.16 Net Calorific Value of Pentane
NCVPE Kcal/Kg -- -- -- -- -- 11383 Kcal/Kg Standard value – applicable throughout the project duration
D.3.17 Net Calorific Value of Hexane
NCVHX Kcal/Kg -- -- -- -- -- 10782 Kcal/Kg Standard value – applicable throughout the project duration
D.3.18 Net Calorific Value of Hydrogen
NCVH2 Kcal/Kg -- -- -- -- -- 28676 Kcal/Kg Standard value – applicable throughout the project duration

CDM-SSC-PDD (version 02) CDM – Executive Board page 29 D.4. Qualitative explanation of how quality control (QC) and quality assurance (QA) procedures are undertaken: >> Quality control (QC) and quality assurance (QA) procedures that are being undertaken for data monitored
Data (Indicate table and
ID number e.g. 3.-1.; 3.2.)
Uncertainty level of data (High/Medium/Low)
Explain QA/QC procedures planned for these data, or why such procedures are not necessary.
D.3.1 Low QA / QC procedure for all these measurements are part of GHG Emission Reduction Management System System which is hooked up to plant ISO system that is reviewed internally on monthly basis.
D.3.2 Low QA / QC procedure for all these measurements are part of GHG Emission Reduction Management System System which is hooked up to plant ISO system that is reviewed internally on monthly basis.
D.3.3 Low QA / QC procedure for all these measurements are part of GHG Emission Reduction Management System System which is hooked up to plant ISO system that is reviewed internally on monthly basis.
D.3.4 Low QA / QC procedure for all these measurements are part of GHG Emission Reduction Management System System which is hooked up to plant ISO system that is reviewed internally on monthly basis.
D.3.5 Low QA / QC procedure for all these measurements are part of GHG Emission Reduction Management System System which is hooked up to plant ISO system that is reviewed internally on monthly basis.
D.3.6 Low QA / QC procedure for all these measurements are part of GHG Emission Reduction Management System System which is hooked up to plant ISO system that is reviewed internally on monthly basis.
D.3.7 Low QA / QC procedure for all these measurements are part of GHG Emission Reduction Management System System which is hooked up to plant ISO system that is reviewed internally on monthly basis.
D.3.8 Low QA / QC procedure for all these measurements are part of GHG Emission Reduction Management System System which is hooked up to plant ISO system that is reviewed internally on monthly basis.

CDM-SSC-PDD (version 02) CDM – Executive Board page 30 D.5. Please describe briefly the operational and management structure that the project participant(s) will implement in order to monitor emission reductions and any leakage effects generated by the project activity: >> No leakages due to project activity
The process monitoring and control system at the Nagothane Manufacturing Complex is automated. All
the parameters covered under monitoring plan are monitored. This Worksheet Doc No
RIL/I/PM/0607/008 is designed for both the measures and is an in-house development to monitor the
projects on daily basis.
Technology department (TLS) monitors the data on monthly basis in the form of monthly reports.
Technology department (TLS) Engineer will monitor and document the data on regular basis as per the
monitoring plan outlined in Section D.3.
Report on emission reductions will be maintained on a monthly basis and will be available with
Technology Department.
Project proponent has established a project specific GHG Emission Reduction Management System
RIL/I/MS/ 0607/008 which mentions QC & QA details, that is hooked up to Plant ISO system. This has
made the CDM project system driven. This document gives detailed responsibility matrix, emergency
preparedness, calibration / measurement / monitoring and reporting parameters, control of records,
internal audits, performance review, and corrective action for sustaining the CDM project.
D.6. Name of person/entity determining the monitoring methodology: >> The contact information is furnished in Annexure 1
CDM-SSC-PDD (version 02) CDM – Executive Board page 31 SECTION E.: Estimation of GHG emissions by sources: E.1. Formulae used: >> E.1.1 Selected formulae as provided in appendix B: >> Not Applicable E.1.2 Description of formulae when not provided in appendix B: >> In the estimation and calculation of GHG emissions, both in the baseline and in the project activity,
emissions of methane and nitrous oxide have not been considered as they are negligible. As a result,
the emission reduction calculated is conservative.
E.1.2.1 Describe the formulae used to estimate anthropogenic emissions by sources of GHGs due to the project activity within the project boundary: >> The Purge Gas stream, a stream consisting of hydrocarbons, nitrogen, hydrogen was being flared in the
baseline case. Hence emission due to combustion of this stream in the project scenario has not been
considered.
Hence, in this case project emission is nil.
E.1.2.2 Describe the formulae used to estimate leakage due to the project activity, where required, for the applicable project category in appendix B of the simplified modalities and procedures for small-scale CDM project activities >> Leakage is not applicable in the project activity. E.1.2.3 The sum of E.1.2.1 and E.1.2.2 represents the small-scale project activity emissions: >> Project emission, as sum of emissions shown in E.1.2.1 and E.1.2.2 is nil.
E.1.2.4 Describe the formulae used to estimate the anthropogenic emissions by sources of GHGs in the baseline using the baseline methodology for the applicable project category in appendix B of the simplified modalities and procedures for small-scale CDM project activities: >> In the baseline the Purge Gas stream was being flared. In the project case the same stream is recovered
and is used as fuel in the HRSG at CPP. In both cases, baseline as well as project, the quantity of carbon
dioxide emission from the Purge gas stream remains the same, and hence is not considered. In the
baseline, the emission was due to the combustion of LSHS equivalent to the Purge Gas recovered.
Table E.1
CDM-SSC-PDD (version 02) CDM – Executive Board page 32
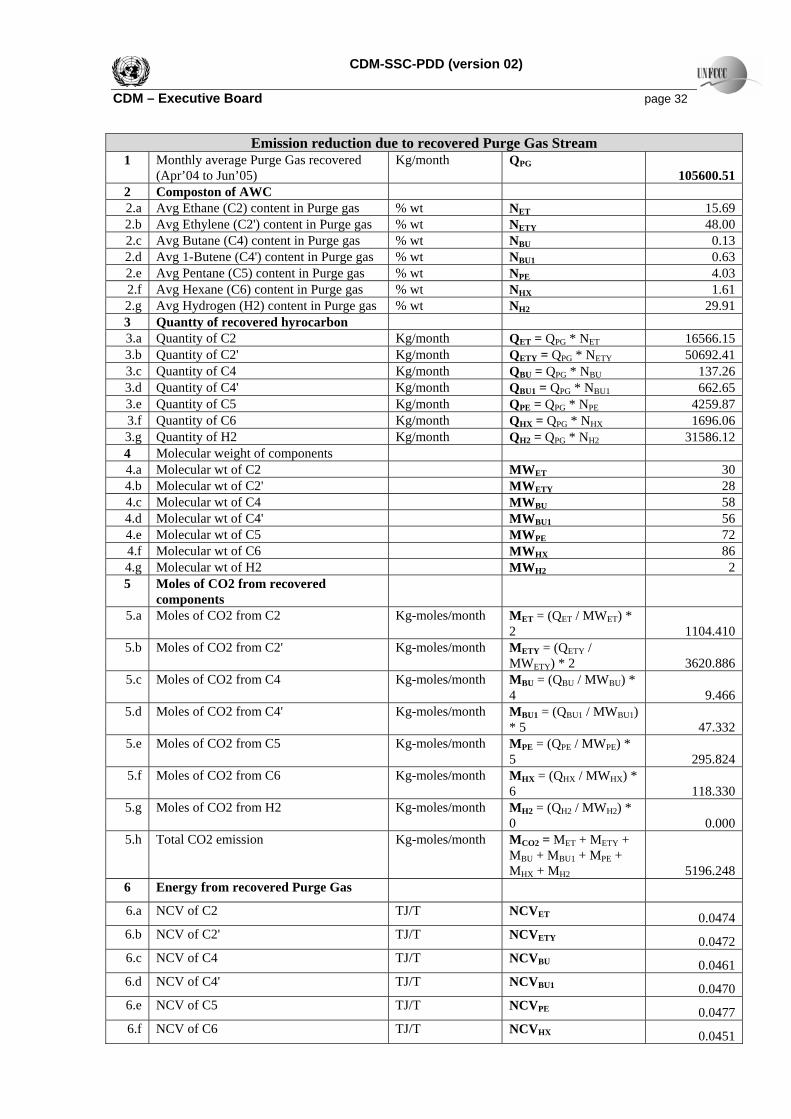
Emission reduction due to recovered Purge Gas Stream 1 Monthly average Purge Gas recovered
(Apr’04 to Jun’05) Kg/month QPG
105600.51 2 Composton of AWC 2.a Avg Ethane (C2) content in Purge gas % wt NET 15.69 2.b Avg Ethylene (C2') content in Purge gas % wt NETY 48.00 2.c Avg Butane (C4) content in Purge gas % wt NBU 0.13 2.d Avg 1-Butene (C4') content in Purge gas % wt NBU1 0.63 2.e Avg Pentane (C5) content in Purge gas % wt NPE 4.03 2.f Avg Hexane (C6) content in Purge gas % wt NHX 1.61 2.g Avg Hydrogen (H2) content in Purge gas % wt NH2 29.91 3 Quantty of recovered hyrocarbon 3.a Quantity of C2 Kg/month QET = QPG * NET 16566.15 3.b Quantity of C2' Kg/month QETY = QPG * NETY 50692.41 3.c Quantity of C4 Kg/month QBU = QPG * NBU 137.26 3.d Quantity of C4' Kg/month QBU1 = QPG * NBU1 662.65 3.e Quantity of C5 Kg/month QPE = QPG * NPE 4259.87 3.f Quantity of C6 Kg/month QHX = QPG * NHX 1696.06 3.g Quantity of H2 Kg/month QH2 = QPG * NH2 31586.12 4 Molecular weight of components 4.a Molecular wt of C2 MWET 30 4.b Molecular wt of C2' MWETY 28 4.c Molecular wt of C4 MWBU 58 4.d Molecular wt of C4' MWBU1 56 4.e Molecular wt of C5 MWPE 72 4.f Molecular wt of C6 MWHX 86 4.g Molecular wt of H2 MWH2 2 5 Moles of CO2 from recovered
components
5.a Moles of CO2 from C2 Kg-moles/month MET = (QET / MWET) *
2 1104.410 5.b Moles of CO2 from C2' Kg-moles/month METY = (QETY /
MWETY) * 2 3620.886 5.c Moles of CO2 from C4 Kg-moles/month MBU = (QBU / MWBU) *
4 9.466 5.d Moles of CO2 from C4' Kg-moles/month MBU1 = (QBU1 / MWBU1)
* 5 47.332 5.e Moles of CO2 from C5 Kg-moles/month MPE = (QPE / MWPE) *
5 295.824 5.f Moles of CO2 from C6 Kg-moles/month MHX = (QHX / MWHX) *
6 118.330 5.g Moles of CO2 from H2 Kg-moles/month MH2 = (QH2 / MWH2) *
0 0.000 5.h Total CO2 emission Kg-moles/month MCO2 = MET + METY +
MBU + MBU1 + MPE + MHX + MH2 5196.248
6 Energy from recovered Purge Gas 6.a NCV of C2 TJ/T NCVET 0.0474 6.b NCV of C2' TJ/T NCVETY 0.0472 6.c NCV of C4 TJ/T NCVBU 0.0461 6.d NCV of C4' TJ/T NCVBU1 0.0470 6.e NCV of C5 TJ/T NCVPE 0.0477 6.f NCV of C6 TJ/T NCVHX 0.0451
CDM-SSC-PDD (version 02) CDM – Executive Board page 33
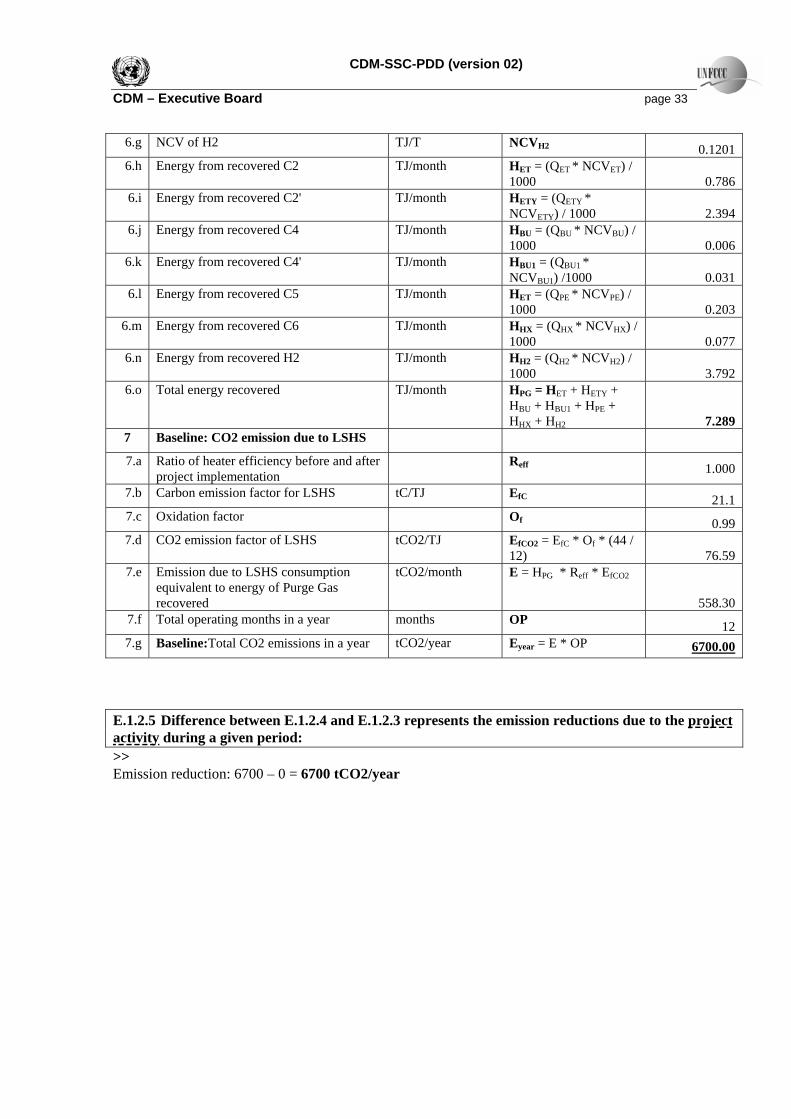
6.g NCV of H2 TJ/T NCVH2 0.1201 6.h Energy from recovered C2 TJ/month HET = (QET * NCVET) /
1000 0.786 6.i Energy from recovered C2' TJ/month HETY = (QETY *
NCVETY) / 1000 2.394 6.j Energy from recovered C4 TJ/month HBU = (QBU * NCVBU) /
1000 0.006 6.k Energy from recovered C4' TJ/month HBU1 = (QBU1 *
NCVBU1) /1000 0.031 6.l Energy from recovered C5 TJ/month HET = (QPE * NCVPE) /
1000 0.203 6.m Energy from recovered C6 TJ/month HHX = (QHX * NCVHX) /
1000 0.077 6.n Energy from recovered H2 TJ/month HH2 = (QH2 * NCVH2) /
1000 3.792 6.o Total energy recovered TJ/month HPG = HET + HETY +
HBU + HBU1 + HPE + HHX + HH2 7.289
7 Baseline: CO2 emission due to LSHS 7.a Ratio of heater efficiency before and after
project implementation Reff 1.000
7.b Carbon emission factor for LSHS tC/TJ EfC 21.1 7.c Oxidation factor Of 0.99 7.d CO2 emission factor of LSHS tCO2/TJ EfCO2 = EfC * Of * (44 /
12) 76.59 7.e Emission due to LSHS consumption
equivalent to energy of Purge Gas recovered
tCO2/month E = HPG * Reff * EfCO2
558.30 7.f Total operating months in a year months OP 12 7.g Baseline:Total CO2 emissions in a year tCO2/year Eyear = E * OP 6700.00
E.1.2.5 Difference between E.1.2.4 and E.1.2.3 represents the emission reductions due to the project activity during a given period: >> Emission reduction: 6700 – 0 = 6700 tCO2/year

CDM-SSC-PDD (version 02) CDM – Executive Board page 34 E.2 Table providing values obtained when applying formulae above: >>
Table E.2 Emission reduction
Year Estimation of Project activity
emission
Estimation of baseline emissions
Estimation of leakage
Estimation of emission reduction
(tonnes CO2 e) (tonnes CO2 e) (tonnes CO2 e) (tonnes CO2 e) Jan'07 to Dec'07 0 6700 0 6700
Jan'08 to Dec'08 0 6700 0 6700
Jan'09 to Dec'09 0 6700 0 6700
Jan'10 to Dec'10 0 6700 0 6700
Jan'11 to Dec'11 0 6700 0 6700
Jan'12 to Dec'12 0 6700 0 6700
Jan'13 to Dec'13 0 6700 0 6700
Jan'14 to Dec'14 0 6700 0 6700
Jan'15 to Dec'15 0 6700 0 6700
Jan'16 to Dec'16 0 6700 0 6700
Total 0 67,000 0 67,000

CDM-SSC-PDD (version 02) CDM – Executive Board page 35 SECTION F.: Environmental impacts: F.1. If required by the host Party, documentation on the analysis of the environmental impacts of the project activity: >>
As per the guidelines for conducting the EIA, the project activity does not fall into any of the two
categories, hence EIA is not required to be done as per the guidelines. However, the project proponent
has carried out Aspect-Impact analysis as a good engineering practice.
The different Aspects considered under the Aspect impact assessment are as follows:
• Land – There is no degradation of land quality due to the project. The quality of the land is not
negatively affected by the project activity as it is non-polluting, clean and there is no land
development activity or discharge of effluents into the soil from the equipment installed in the
project boundary.
• Water – There is no degradation of water quality due to the project. The quality of the water is not
negatively affected by the project activity.
• Air quality – The MSU installed does not emit any contaminants into the air that can be attributed
solely as a result of its operation.
• Noise – There is no contribution to noise level at site that can be attributed solely as a result of its
operation.
• Solid / Hazardous waste – In the project activity there is no generation of solid or hazardous waste
attributable to the project activity.
• Resource Depletion – The project activity aims at reduction in fossil fuel consumption and,
thereby conserving resources rather than causing its depletion.
• Biological Environment – Not applicable.
• Public Health and Safety – The project activity does not endanger public health and safety as it
reduces emission of harmful Greenhouse Gases. Moreover. In the project activity adequate safety
measures have been implemented and persons involved have been trained in the operation of the
recovery system.
• Socio-economic and cultural environment – Due to the project activity the Socio- Economic and
cultural environment has improved as successful implementation of the project has improved the
skill sets of the people, instilled confidence and has provided fresh impetus to the personnel to
conserve energy by identifying more areas in the process where energy can be conserved and GHG
emissions can be reduced.

CDM-SSC-PDD (version 02) CDM – Executive Board page 36
SECTION G. Stakeholders’ comments: G.1. Brief description of how comments by local stakeholders have been invited and compiled: >> The Stakeholders were explained in totality and in depth about the project activity .The related document
on the project was also circulated among them. The stakeholders, after going through the project activity
rated it as environment friendly and without any negative impact on the work environment. They also
praised the environment friendly approach of the company.
The stakeholders have filled in questionnaires given to them to assess the impact of the project on the
environment. The same are available with the project proponent as records and can be made available if
so desired by the Validator.
The project activity involves modifications within the existing operational plant. There are well-
established procedures within the company for involving technical as well as operating staff in the
decision making for implementation of any project. Field Change Order (FCO) is circulated through all
key departments within the plant concerned with the project activity. Comments from the department
chiefs are available in such FCOs.
G.2. Summary of the comments received: >> The stakeholders who were interviewed include panel superintendent, field engineer, Technical services
engineer and plant production manager. After providing all the details of project activity, the questions
were asked to evaluate what the stakeholder thinks about impact of project activity on following :
1. Air pollution
2. Water pollution
3. Water availability
4. Water allocation
5. Natural drainage pattern
6. Drainage in general
7. Solid waste generation and disposal
8. Land use / landscape
9. Plant life
10. Agriculture / horticulture
11. Habitat fragmentation
12. Employment
13. Vocational opportunities

CDM-SSC-PDD (version 02) CDM – Executive Board page 37
14. Income levels
15. Stress on infrastructure
The stakeholders have indicated that there is no significant impact of the project activity in terms of any
of the above parameters.
G.3. Report on how due account was taken of any comments received: >> Stakeholders have appraised the project as an environment friendly project and have expressed their
satisfaction on the fact that it reduces emissions and contributes to well-being of society. There are no
negative comments received that require the project proponent to take any corrective action.

CDM-SSC-PDD (version 02) CDM – Executive Board page 38
Annex 1
CONTACT INFORMATION ON PARTICIPANTS IN THE PROJECT ACTIVITY
Organization: Reliance Industries Limited Street/P.O.Box: Thane-Belapur Road, Koparkhairane Building: 2nd Floor, B Wing, PHQ, Dhirubhai Ambani Knowledge City (DAKC) City: Navi Mumbai State/Region: Maharashtra Postfix/ZIP: 400709 Country: India Telephone: + 91 22 67270585 FAX: + 91 22 67270699 E-Mail: [email protected] URL: www.ril.com Represented by: Title: General Manager Salutation: Mr Last Name: Mukherjee Middle Name: K First Name: Kisor Department: Projects Mobile: + 91 9322645078 Direct FAX: + 91 22 67270699 Direct tel: + 91 22 67270585 Personal E-Mail: [email protected]

CDM-SSC-PDD (version 02) CDM – Executive Board page 39
Annex 2
INFORMATION REGARDING PUBLIC FUNDING
There was no public funding in procurement or implementation of the project activity. The entire investment was from funds generated internally.
- - - - -

CDM-SSC-PDD (version 02) CDM – Executive Board page 40
Annex 3
ABBREVIATIONS
CDM Clean Development Mechanism
CER Certified Emission Reduction
CPP Captive Power Plant
EIA Environmental Impact Assessment
FCO Field Change Order
GHG Greenhouse Gas
HDPE High Density Polyethylene
HRSG Heat Recovery Steam Generator
KTA Kilo Tonnes per Annum
LLDPE Linear Low Density Polyethylene
LSHS Low Sulphur Heavy Stock
MSU Membrane Separation Unit
TPH Tonnes per Hour
UNFCCC United Nation Framework Convention on Climate Change

CDM-SSC-PDD (version 02) CDM – Executive Board page 41
Enclosure 1
Calculation for CO2 emission reduction
Table A : Purge Gas stream recovered per month
Month Purge Gas (MT)
Apr-04 71.797
May-04 88.412Jun-04 128.585Jul-04 77.7732Aug-04 132.0964Sep-04 111.746Oct-04 65.815Nov-04 82.778Dec-04 124.892Jan-05 148.558Feb-05 118.415Mar-05 126.569Apr-05 59.092May-05 110.783Jun-05 136.696
Average 105.600
Table B : Calculation for emission reduction Emission reduction due to recovered Purge Gas Stream
1 Monthly average Purge Gas recovered (Apr’04 to Jun’05)
Kg/month QPG 105600.51
2 Composton of AWC 2.a Avg Ethane (C2) content in Purge gas % wt NET 15.69 2.b Avg Ethylene (C2') content in Purge gas % wt NETY 48.00 2.c Avg Butane (C4) content in Purge gas % wt NBU 0.13 2.d Avg 1-Butene (C4') content in Purge gas % wt NBU1 0.63 2.e Avg Pentane (C5) content in Purge gas % wt NPE 4.03 2.f Avg Hexane (C6) content in Purge gas % wt NHX 1.61 2.g Avg Hydrogen (H2) content in Purge gas % wt NH2 29.91 3 Quantty of recovered hyrocarbon 3.a Quantity of C2 Kg/month QET = QPG * NET 16566.15 3.b Quantity of C2' Kg/month QETY = QPG * NETY 50692.41 3.c Quantity of C4 Kg/month QBU = QPG * NBU 137.26 3.d Quantity of C4' Kg/month QBU1 = QPG * NBU1 662.65 3.e Quantity of C5 Kg/month QPE = QPG * NPE 4259.87 3.f Quantity of C6 Kg/month QHX = QPG * NHX 1696.06 3.g Quantity of H2 Kg/month QH2 = QPG * NH2 31586.12 4 Molecular weight of components 4.a Molecular wt of C2 MWET 30 4.b Molecular wt of C2' MWETY 28 4.c Molecular wt of C4 MWBU 58

CDM-SSC-PDD (version 02) CDM – Executive Board page 42
4.d Molecular wt of C4' MWBU1 56 4.e Molecular wt of C5 MWPE 72 4.f Molecular wt of C6 MWHX 86 4.g Molecular wt of H2 MWH2 2 5 Moles of CO2 from recovered
components
5.a Moles of CO2 from C2 Kg-moles/month MET = (QET / MWET) *
2 1104.410 5.b Moles of CO2 from C2' Kg-moles/month METY = (QETY /
MWETY) * 2 3620.886 5.c Moles of CO2 from C4 Kg-moles/month MBU = (QBU / MWBU) *
4 9.466 5.d Moles of CO2 from C4' Kg-moles/month MBU1 = (QBU1 / MWBU1)
* 5 47.332 5.e Moles of CO2 from C5 Kg-moles/month MPE = (QPE / MWPE) *
5 295.824 5.f Moles of CO2 from C6 Kg-moles/month MHX = (QHX / MWHX) *
6 118.330 5.g Moles of CO2 from H2 Kg-moles/month MH2 = (QH2 / MWH2) *
0 0.000 5.h Total CO2 emission Kg-moles/month MCO2 = MET + METY +
MBU + MBU1 + MPE + MHX + MH2 5196.248
6 Energy from recovered Purge Gas 6.a NCV of C2 TJ/T NCVET 0.0474 6.b NCV of C2' TJ/T NCVETY 0.0472 6.c NCV of C4 TJ/T NCVBU 0.0461 6.d NCV of C4' TJ/T NCVBU1 0.0470 6.e NCV of C5 TJ/T NCVPE 0.0477 6.f NCV of C6 TJ/T NCVHX 0.0451 6.g NCV of H2 TJ/T NCVH2 0.1201 6.h Energy from recovered C2 TJ/month HET = (QET * NCVET) /
1000 0.786 6.i Energy from recovered C2' TJ/month HETY = (QETY *
NCVETY) / 1000 2.394 6.j Energy from recovered C4 TJ/month HBU = (QBU * NCVBU) /
1000 0.006 6.k Energy from recovered C4' TJ/month HBU1 = (QBU1 *
NCVBU1) /1000 0.031 6.l Energy from recovered C5 TJ/month HET = (QPE * NCVPE) /
1000 0.203 6.m Energy from recovered C6 TJ/month HHX = (QHX * NCVHX) /
1000 0.077 6.n Energy from recovered H2 TJ/month HH2 = (QH2 * NCVH2) /
1000 3.792 6.o Total energy recovered TJ/month HPG = HET + HETY +
HBU + HBU1 + HPE + HHX + HH2 7.289
7 Baseline: CO2 emission due to LSHS 7.a Ratio of heater efficiency before and after
project implementation Reff 1.000
7.b Carbon emission factor for LSHS tC/TJ EfC 21.1

CDM-SSC-PDD (version 02) CDM – Executive Board page 43
7.c Oxidation factor Of 0.99 7.d CO2 emission factor of LSHS tCO2/TJ EfCO2 = EfC * Of * (44 /
12) 76.59 7.e Emission due to LSHS consumption
equivalent to energy of Purge Gas recovered
tCO2/month E = HPG * Reff * EfCO2
558.30 7.f Total operating months in a year months OP 12 7.g Baseline:Total CO2 emissions in a year tCO2/year Eyear = E * OP 6700.00