clean air action plan: the way forward - · pdf filethis reversal is clearly seen by...
TRANSCRIPT

Clean Air Action Plan: The Way Forward 2015 was the first time on record that the average Indian was exposed to more
pollution than the average Chinese - Published February 2016 by Greenpeace India
Greenpeace analysis of satellite-based particulate matter measurements over the past decade
shows that China’s systematic efforts to combat air pollution have achieved an impressive
improvement in average air quality in the country in the past few years – although pollution
levels remain alarmingly high. In contrast, air pollution levels in India, and in particular North
India, have risen rapidly, with 2015 being the most polluted year on record.
As a result of dramatic improvements in China and continuing deterioration of air quality in India,
2015 was the first time that the average Indian was exposed to more particulate pollution than
the average Chinese. However, China’s example shows that India, too, can turn the tide on
pollution with determined measures.
Air pollution monitoring only covers one quarter of the population in China and only a few
percent of the population in India, and in both countries, PM2.5 monitoring networks have only
been created very recently, so long-term trends cannot be assessed. Satellite-based
observations are the best way available to compare the average pollution exposure between
countries and trends over time.
Here is the situation in 2005, showing how China already has a very serious pollution problem,
and India’s pollution, while serious, is a lot lower than eastern China’s.

Until 2011, the situation kept getting worse with growing fossil fuel use in both China and in
India:
From 2011 to 2015, China has made big strides while in India, pollution levels have kept rising:

This reversal is clearly seen by calculating population-weighted average pollution levels for
China and India, showing how 2011 was the worst year on record for China, and there has been
a very dramatic improvement towards 2015, while India’s pollution levels have kept creeping
upwards, making 2015 the worst year on record.
Looking at the change in particulate levels measured from satellites in the past 10 years, very
significant reductions are seen across Eastern and Central China, testimony to the national
scale of the key measures to tackle air pollution. In India, while the pollution levels are highest in
the north, the trend of worsening pollution levels is seen across the subcontinent, with West
Bengal, Bihar, UP and AP displaying the largest increases, and the NCR also seeing a
significant increase.
0
0.1
0.2
0.3
0.4
0.5
0.6
0.7
2003 2004 2005 2006 2007 2008 2009 2010 2011 2012 2013 2014 2015
po
pu
lati
on
-wei
ghte
d a
vera
ge a
ero
sol o
pti
cal d
epth
Satellite-based pollution exposure for average citizen
India China United States EU

Change in average particle pollution levels over 10 years to 2015.
China’s national-level efforts yield results In 2013, after widespread public outrage sparked by heavy pollution episodes, the Chinese
government published a “National Air Pollution Action Plan”. Some of the key components of
China’s strategy were:
setting targets and deadlines for improving air quality in key cities and provinces
setting targets for increasing the share of clean energy by 2017
tightened emission standards for coal-fired power plants and heavy industry facilities, and,
perhaps even more importantly, stepped up enforcement with automatic emission monitoring
and much larger fines for violations
requiring some of the highest polluting industrial regions to achieve absolute reductions in their
coal consumption
In addition, most provincial and local governments have implemented a raft of measures to
address local pollution sources. It is clear from the uniformity of the improvements across China,
however, that the regional and national level policies have been crucial in the success of
China’s plan.
Improving the monitoring network Another important finding from the satellite data is that not all highly polluted, large cities are
covered by India’s air pollution monitoring network. Out of India’s 89 cities with more than 5 lakh
people, only 17 are covered by the continuous air quality monitoring system making data
available to public through NAQI (which has total 23 cities covered as of February 2016).
Durgapur, Gorakhpur, Asansol, Shiliguri, Bareilly and Ludhiana are among the most polluted
cities without continuous air quality monitoring data made available to public. Overall, India’s
National Air Quality network, with 39 operating stations as of writing, compares poorly with the
1500 stations in China.
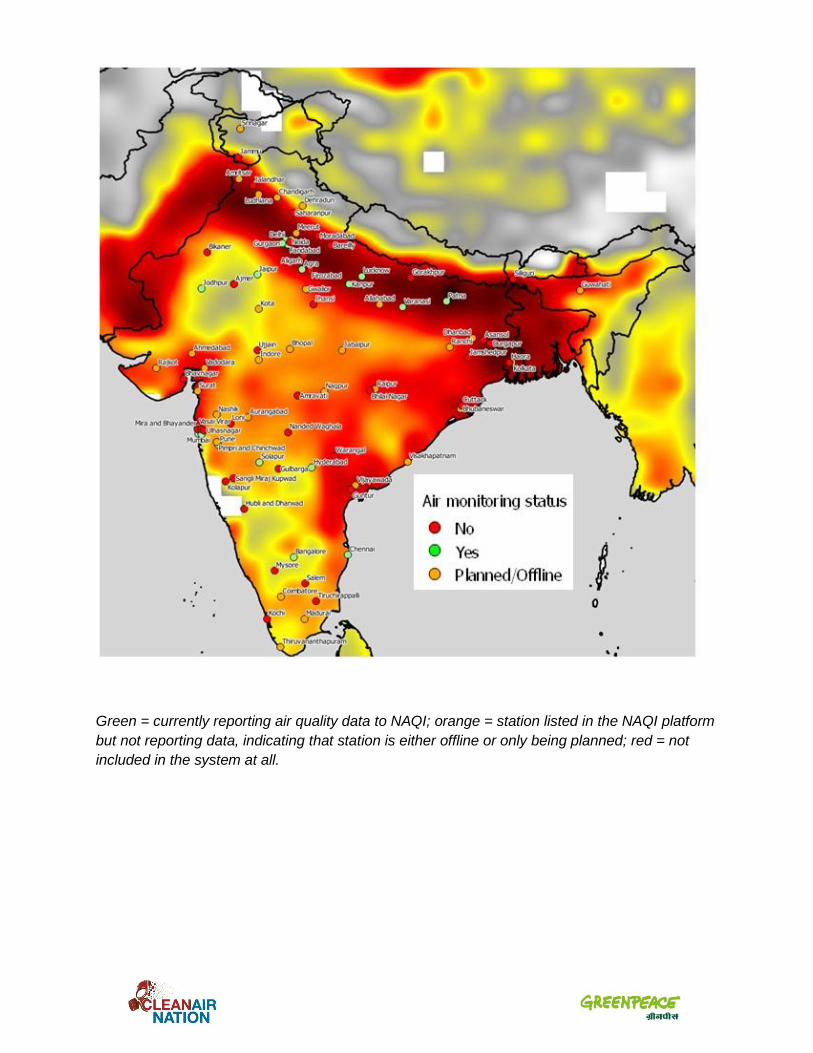
Green = currently reporting air quality data to NAQI; orange = station listed in the NAQI platform
but not reporting data, indicating that station is either offline or only being planned; red = not
included in the system at all.

The increase in pollution levels is also clearly visible on the city level.
Suggestions for Policy Demand Set a deadline for meeting the national air quality standards, and set e.g. 5-year interim targets
for reducing pollution levels in each state and city that doesn't currently comply
Create a regional action plan covering the extremely highly polluted areas from Punjab to West
Bengal, addressing all major air pollution emitting sectors.
Set targets for reducing interstate pollution, including compliance plan for meeting the thermal
power plant emission standards as soon as possible
Set up continuous air pollution monitoring in all major urban centers, at least those with 5 lakh
people or more, and especially in the extremely highly polluted IGP region
Methodology For the purposes of this briefing, the entire series of monthly Aerosol Optical Depth
measurements from the NASA MODIS Aqua satellite were downloaded. These AOD
measurements are a widely used proxy for regional PM2.5 levels – at a resolution of 1x1
degrees or about 100km at the equator, they do not capture very local patterns but give an
unparalleled picture of regional average levels in countries that lack a comprehensive
monitoring network.
0
0.1
0.2
0.3
0.4
0.5
0.6
0.7
0.8
Patna Kolkata Delhi Gorakhpur Kanpur Varanasi
AO
D
Satellite-based pollution levels in most polluted Indian cities in 2005-2015
2005 2006 2007 2008 2009 2010 2011 2012 2013 2014 2015

Whether, satellite-based aerosol readings cannot always be derived for every month and every
grid cell, so there is missing data in the results. To overcome this, the dataset was analyzed by
first calculating average aerosol levels in each grid cell during each month of the year, and then
calculating monthly “anomalies” for each observation, compared to this long-term monthly
average. The population-weighted average of the anomalies was then calculated for each
country and each month, excluding grid cells with less than 10 months of data, and then
averaged for each year. This procedure was designed to utilize most of the measurement data
available, but to avoid skewing the data towards areas with better data availability. For China
and India, the dataset covers most of the populated regions for every year in the records,
making the results well comparable. The R routines written for this analysis can be provided
upon request.
The correspondence of the AOD measurements to ground-based measurements was validated
by comparing the two in China for the 135 NASA 1-degree grid locations for which both AOD
and ground-based PM2.5 was available for the year of 2015. Average of all ground based
measurement stations in each grid cell was calculated and plotted against the AOD, with the
AOD being able to explain 63% of variation in ground-based measurements. For India, PM2.5
data from the National AQI system was obtained for the period from the inauguration of the
system in April until December. For the 14 cities for which at least three months of both ground-
based and AOD data was available, AOD was able to explain 71% of the variation in PM2.5.
Importantly, the average ratio of ground-based measurements to AOD was significantly higher
in India (on average, an AOD of 1 would correspond to 110ug/m3 in China and 170ug/m3 in
India), indicating that India’s actual pollution levels in relation to China could be higher than the
AOD-based analysis indicates. Naturally, the paucity of measurement data from India limits the
strength of the conclusions.
R² = 0.6255
0
20
40
60
80
100
120
0 0.2 0.4 0.6 0.8 1 1.2
PM
2.5
(µ
g/m
³)
AOD
Correspondence between ground-level measurements of PM2.5 and AOD in Chinese cities in 2015

Comparison of air pollution policies in the world’s four major economies China India U.S. EU
Change in satellite-based PM2.5 levels from 2010 to 2015
-17% +13% -15% -20% (from 2005 to 2013)
PM2.5 trend Falling since 2011; 2015 was the best on record
Increasing steadily for past 10 years; 2015 was the worst year on record
Falling since measurements started
Falling since measurements started
PM2.5 in capital city, annual (µg/m3)
81 128 12 18
PM2.5 air quality standard, annual (µg/m3)
35 40 15 25 (from 2020, 20)
Deaths per day from air pollution in 2013
2,700 1,800 250 640
Online PM2.5 monitoring
1,500 stations in 900 cities & towns
39 stations in 23 cities (as of Feb 2016)
770 stations in 540 cities & towns
1,000 stations in 400 cities & towns
R² = 0.7129
0
50
100
150
200
250
0 0.1 0.2 0.3 0.4 0.5 0.6 0.7 0.8 0.9
PM
2.5
(µ
g/m
³)
AOD
Correspondence between 2015 April-December average PM2.5 and AOD in Indian cities

Share of thermal power plants with basic pollution controls (desulphurization, particle controls)
95% 10% 60% 75%
Deadline for meeting national air quality standards
2030; most key cities have an interim target for 2017
None 2012; violating areas are currently implementing new plans
25 by 2015
20 by 2020
Consequences for missing targets
Promotion of province governors depends on meeting targets
None States must adopt emission reduction measures into law that are demonstrated to enable meeting targets; must account for pollution transport into downwind states; periodic review
Cities & countries face legal action for not meeting standards
Coverage of government measures
National, regional and city-level action plans with measurable 5-year targets
National emission standards for power plants, industrial sectors and vehicles
Mainly action in individual cities with no measurable targets
Recently introduced India-wide emission standards for thermal power plants; Introduction of Bharat VI vehicle emission norms is proposed by April 2020
National air quality targets; implementation plans approved on federal level and executed on state level
National emission standards for power plants, industrial sectors and vehicles
“Clean Air For Europe” action plan
Europe-wide emission standards for power plants, industry and cars
Most countries and key cities have own plans

Sources Change in satellite-based PM2.5 levels from 2010 to 2015
Greenpeace analysis of NASA satellite data; EU coverage for recent years was not sufficient so EU analyzed from Boys et al 2014: Fifteen-year global time series of satellite-derived fine particulate matter, Environ. Sci. Technol, 10.1021/es502113p, 2014.
PM2.5 trend As above.
PM2.5 in capital city (µg/m3) New Delhi: data obtained from DPCC through RTI request
Brussels and Washington, D.C.: WHO Ambient Air Pollution database
Beijing: Beijing Municipal Environmental Monitoring Centre
PM2.5 air quality standard (µg/m3) National and EU regulation
Deaths per day from air pollution in 2013
Global Burden of Disease Study 2013 (GBD 2013) Results by Location, Cause, and Risk Factor. Seattle, United States: Institute for Health Metrics and Evaluation (IHME), 2016.
Online PM2.5 monitoring EU AirBase http://www.eea.europa.eu/data-and-maps/data/aqereporting
U.S. EPA AirData http://www3.epa.gov/airdata/
China Ministry of Environmental Protection online data platform
India National AQI platform
Share of thermal power plants with basic pollution controls (desulphurization, particle controls)
Platts World Electric Power Plants database 2015Q4
Deadline for meeting national air quality standards
National and EU regulation
Consequences for missing targets National and EU regulation
Coverage of government measures National and EU regulation, http://pib.nic.in/newsite/mbErel.aspx?relid=134232