clay mineral variations in holocene terrestrial sediments ... · clay mineral variations in...
TRANSCRIPT

Quaternary Research 77 (2012) 368–381
Contents lists available at SciVerse ScienceDirect
Quaternary Research
j ourna l homepage: www.e lsev ie r .com/ locate /yqres
Clay mineral variations in Holocene terrestrial sediments from the Indus Basin
Anwar Alizai a,⁎, Stephen Hillier b, Peter D. Clift a, Liviu Giosan c, Andrew Hurst a,Sam VanLaningham d, Mark Macklin e
a School of Geosciences, University of Aberdeen, Meston Building, Aberdeen, AB24 3UE, UKb The James Hutton Institute, Craigiebuckler, Aberdeen AB15 8QH, UKc Woods Hole Oceanographic Institution, Woods Hole, MA 02543, USAd School of Fisheries and Ocean Sciences, University of Alaska Fairbanks, Fairbanks AK 99775-7220, USAe Institute of Geography and Earth Sciences, University of Wales, Aberystwyth, UK
⁎ Corresponding author.E-mail address: [email protected] (A. Alizai).
0033-5894/$ – see front matter © 2012 University of Wdoi:10.1016/j.yqres.2012.01.008
a b s t r a c t
a r t i c l e i n f oArticle history:Received 14 December 2010Available online 23 February 2012
Keywords:XRDClay mineralogyMonsoonHimalayaIndus DeltaFloodplainFluvial processesLarge rivers
We employed X-ray diffraction methods to quantify clay mineral assemblages in the Indus Delta and floodplains since ~14 ka, spanning a period of strong climatic change. Assemblages are dominated by smectiteand illite, with minor chlorite and kaolinite. Delta sediments integrate clays from across the basin andshow increasing smectite input between 13 and 7.5 ka, indicating stronger chemical weathering as the sum-mer monsoon intensified. Changes in clay mineralogy postdate changes in climate by 5–3 ka, reflecting thetime needed for new clay minerals to form and be transported to the delta. Samples from the flood plainsin Punjab show evidence for increased chemical weathering towards the top of the sections (6–b4 ka), coun-ter to the trend in the delta, at a time of monsoon weakening. Clay mineral assemblages within sandy flood-plain sediment have higher smectite/(illite+chlorite) values than interbedded mudstones, suggestive of ei-ther stronger weathering or more sediment reworking since the Mid Holocene. We show that marine recordsare not always good proxies for weathering across the entire flood plain. Nonetheless, the delta record likelyrepresents the most reliable record of basin-wide weathering response to climate change.
© 2012 University of Washington. Published by Elsevier Inc. All rights reserved.
Introduction
Variations in climate are one of the most prominent drivers ofchange in continental environments. Reconstructing the response oflandscape to climate change over long periods of geological time isoften difficult because of fragmentary sedimentary records, and be-cause of the paucity or even complete lack of age control in terrestrialsediments. As a result, marine sediments are often used to constrainevolving continental environments, based on the assumption thatthe sediments that accumulate on a continental margin at any giventime are representative of the terrestrial drainage basins fromwhich they are sourced and the processes occurring therein (Thiry,2000). However, if the flux of sediment at the delta largely reflectsreworking of older flood-plain deposits, or if the sediment transporttimes are long and punctuated, then this assumption may not bevalid. In such circumstances marine sediments would not act asgood proxies of continental weathering conditions.
In this study we assess the linkage between marine and terrestrialclay mineral records in a single major river system. To do this wepresent clay mineral data from across the flood plains and contempo-raneous deltaic sediments from the Indus River basin in SW Asia
ashington. Published by Elsevier In
(Fig. 1). We chart how clay mineral assemblages have changed on-shore in response to evolving monsoon intensity since ~14 ka. Wefurther compare those mineralogies deposited in the flood plainswith those at the delta in order to establish if the marine recordevolves coherently with the flood plain, or not. By studying both thepotential source areas and the delta sink, we establish a betterunderstanding of the constraints and the caveats on the use of claymineral assemblages as proxies of continental environmental change,a perspective that is not available to most studies of marine sedi-ments that are typically made without the onshore controls enjoyedhere.
The purpose of the current study is to document temporal varia-tions in the clay mineralogy of the terrestrial sediments of the Indussystem during the Holocene and to determine how these might belinked to previously published reconstructions of climatic variationssince the end of the Last Glacial Maximum (LGM: ~20 ka)(Overpeck et al., 1996; Fleitmann et al., 2003; Gupta et al., 2003).Here we report for the first time on how monsoon variations since14 ka correlate with changing clay mineral compositions in a majorriver flood plain, feeding one of the world's largest delta systems. Inso doing we provide a linked continental source to marine sinkperspective on the interpretation of clay mineral records in terms ofenvironmental evolution, a perspective that is rarely considered, orindeed available when older marine sequences are analyzed.
c. All rights reserved.
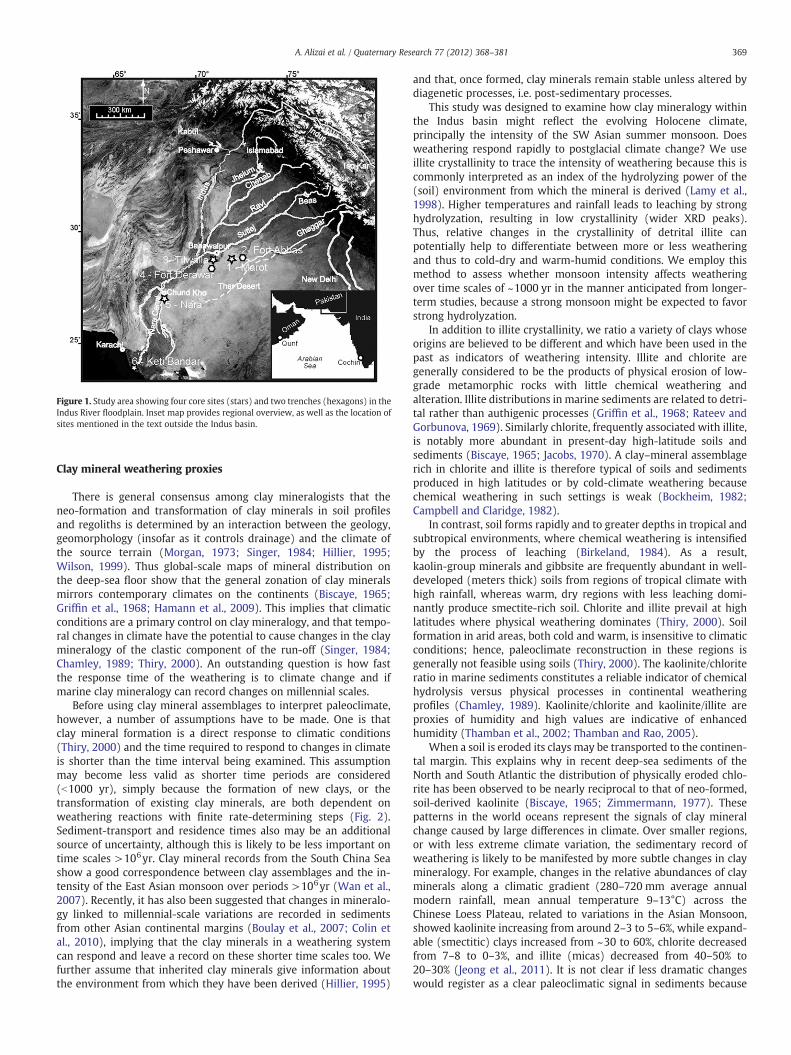
Figure 1. Study area showing four core sites (stars) and two trenches (hexagons) in theIndus River floodplain. Inset map provides regional overview, as well as the location ofsites mentioned in the text outside the Indus basin.
369A. Alizai et al. / Quaternary Research 77 (2012) 368–381
Clay mineral weathering proxies
There is general consensus among clay mineralogists that theneo-formation and transformation of clay minerals in soil profilesand regoliths is determined by an interaction between the geology,geomorphology (insofar as it controls drainage) and the climate ofthe source terrain (Morgan, 1973; Singer, 1984; Hillier, 1995;Wilson, 1999). Thus global-scale maps of mineral distribution onthe deep-sea floor show that the general zonation of clay mineralsmirrors contemporary climates on the continents (Biscaye, 1965;Griffin et al., 1968; Hamann et al., 2009). This implies that climaticconditions are a primary control on clay mineralogy, and that tempo-ral changes in climate have the potential to cause changes in the claymineralogy of the clastic component of the run-off (Singer, 1984;Chamley, 1989; Thiry, 2000). An outstanding question is how fastthe response time of the weathering is to climate change and ifmarine clay mineralogy can record changes on millennial scales.
Before using clay mineral assemblages to interpret paleoclimate,however, a number of assumptions have to be made. One is thatclay mineral formation is a direct response to climatic conditions(Thiry, 2000) and the time required to respond to changes in climateis shorter than the time interval being examined. This assumptionmay become less valid as shorter time periods are considered(b1000 yr), simply because the formation of new clays, or thetransformation of existing clay minerals, are both dependent onweathering reactions with finite rate-determining steps (Fig. 2).Sediment-transport and residence times also may be an additionalsource of uncertainty, although this is likely to be less important ontime scales >106yr. Clay mineral records from the South China Seashow a good correspondence between clay assemblages and the in-tensity of the East Asian monsoon over periods >106yr (Wan et al.,2007). Recently, it has also been suggested that changes in mineralo-gy linked to millennial-scale variations are recorded in sedimentsfrom other Asian continental margins (Boulay et al., 2007; Colin etal., 2010), implying that the clay minerals in a weathering systemcan respond and leave a record on these shorter time scales too. Wefurther assume that inherited clay minerals give information aboutthe environment from which they have been derived (Hillier, 1995)
and that, once formed, clay minerals remain stable unless altered bydiagenetic processes, i.e. post-sedimentary processes.
This study was designed to examine how clay mineralogy withinthe Indus basin might reflect the evolving Holocene climate,principally the intensity of the SW Asian summer monsoon. Doesweathering respond rapidly to postglacial climate change? We useillite crystallinity to trace the intensity of weathering because this iscommonly interpreted as an index of the hydrolyzing power of the(soil) environment from which the mineral is derived (Lamy et al.,1998). Higher temperatures and rainfall leads to leaching by stronghydrolyzation, resulting in low crystallinity (wider XRD peaks).Thus, relative changes in the crystallinity of detrital illite canpotentially help to differentiate between more or less weatheringand thus to cold-dry and warm-humid conditions. We employ thismethod to assess whether monsoon intensity affects weatheringover time scales of ~1000 yr in the manner anticipated from longer-term studies, because a strong monsoon might be expected to favorstrong hydrolyzation.
In addition to illite crystallinity, we ratio a variety of clays whoseorigins are believed to be different and which have been used in thepast as indicators of weathering intensity. Illite and chlorite aregenerally considered to be the products of physical erosion of low-grade metamorphic rocks with little chemical weathering andalteration. Illite distributions in marine sediments are related to detri-tal rather than authigenic processes (Griffin et al., 1968; Rateev andGorbunova, 1969). Similarly chlorite, frequently associated with illite,is notably more abundant in present-day high-latitude soils andsediments (Biscaye, 1965; Jacobs, 1970). A clay–mineral assemblagerich in chlorite and illite is therefore typical of soils and sedimentsproduced in high latitudes or by cold-climate weathering becausechemical weathering in such settings is weak (Bockheim, 1982;Campbell and Claridge, 1982).
In contrast, soil forms rapidly and to greater depths in tropical andsubtropical environments, where chemical weathering is intensifiedby the process of leaching (Birkeland, 1984). As a result,kaolin-group minerals and gibbsite are frequently abundant in well-developed (meters thick) soils from regions of tropical climate withhigh rainfall, whereas warm, dry regions with less leaching domi-nantly produce smectite-rich soil. Chlorite and illite prevail at highlatitudes where physical weathering dominates (Thiry, 2000). Soilformation in arid areas, both cold and warm, is insensitive to climaticconditions; hence, paleoclimate reconstruction in these regions isgenerally not feasible using soils (Thiry, 2000). The kaolinite/chloriteratio in marine sediments constitutes a reliable indicator of chemicalhydrolysis versus physical processes in continental weatheringprofiles (Chamley, 1989). Kaolinite/chlorite and kaolinite/illite areproxies of humidity and high values are indicative of enhancedhumidity (Thamban et al., 2002; Thamban and Rao, 2005).
When a soil is eroded its clays may be transported to the continen-tal margin. This explains why in recent deep-sea sediments of theNorth and South Atlantic the distribution of physically eroded chlo-rite has been observed to be nearly reciprocal to that of neo-formed,soil-derived kaolinite (Biscaye, 1965; Zimmermann, 1977). Thesepatterns in the world oceans represent the signals of clay mineralchange caused by large differences in climate. Over smaller regions,or with less extreme climate variation, the sedimentary record ofweathering is likely to be manifested by more subtle changes in claymineralogy. For example, changes in the relative abundances of clayminerals along a climatic gradient (280–720 mm average annualmodern rainfall, mean annual temperature 9–13°C) across theChinese Loess Plateau, related to variations in the Asian Monsoon,showed kaolinite increasing from around 2–3 to 5–6%, while expand-able (smectitic) clays increased from ~30 to 60%, chlorite decreasedfrom 7–8 to 0–3%, and illite (micas) decreased from 40–50% to20–30% (Jeong et al., 2011). It is not clear if less dramatic changeswould register as a clear paleoclimatic signal in sediments because

Figure 2. Clay–mineral formation and transport mechanismmodified after Fagel (2007). This cartoon shows the many processes and factors that must be considered when trying toextract paleoclimatic information from clay minerals, which may be linked directly or indirectly to climatically modulated surface processes. I (illite), C (chlorite), Sm (smectite)and K (kaolinite) may also reveal information about the source.
370 A. Alizai et al. / Quaternary Research 77 (2012) 368–381
the normal but complex processes of weathering must combine withepisodes of erosion, mixing, storage, and transport before ultimatedeposition.
The Indus River basin
The Indus Basin is a good location for a study of the clay mineralsin both the flood plains and delta of a major river because it lies underthe influence of the SW monsoon and experiences large volumes ofsediment transport from the western Himalaya and Karakoram,which are experiencing rapid erosion. Although the regionexperiences strong summer rain it is relatively arid compared to theGanges–Brahmaputra basin further east (Bookhagen and Burbank,2006). Samples were taken from four core sites and two shallowtrenches in the Indus flood plains that have been the focus of earlierprovenance and sedimentology studies (Alizai et al., 2011b; Clift etal., in press). The core sites, each about 50 m deep, and the twoshallow trench sites each ~4 m deep, are located in the upper easternPakistani Punjab, near the city of Bahawalpur (Fig. 1). Sands >5 mthick are interpreted as channel-fill deposits, while interbeddedshales and thin sands correspond to overbank deposits (Fig. S1,Online data supplement). Because channels meander and migratethrough time the appearance of sand in a single section does notnecessarily indicate a basin-wide increase in sediment flux from themountains.
The sites lie southeast of the modern course of the Sutlej River onthe edge of the Thar Desert, but are located in the paleo-flow path ofthe Ghaggar-Hakra River, which is now an ephemeral course thatmay have previously contained a year-round flow (Ghose et al.,1979; Valdiya, 2002). The sample sites in the Punjab were designed
to provide a weathering record of conditions in the eastern floodplain during the Holocene close to where the Ghaggar-Hakra mayhave flowed. This location on the edge of the Thar Desert meansthat conditions here are especially sensitive to changes in summermonsoon strength.
As well as the Punjabi sites we analyzed materials from a third sitelocated further south, 13 km south of the village of Chund Kho in theregion of the Nara Canal (Fig. 1). At this site, coring recovered mate-rial to a depth of 30 m. The Nara region lies just south of the modernconfluence of the major eastern and western tributaries of the Indus,prior to its arrival at the delta in the Arabian Sea, however, the NaraValley is no longer an active strand of the modern river and its geom-etry is reminiscent of capture from a separate, earlier, drainage. As aresult, the sediments cored in the Nara Valley may represent theflood-plain deposits of an earlier river, undoubtedly of Himalayanprovenance, but not necessarily the main Indus stream (Alizai et al.,2011b).
The southernmost site considered is located in the Indus delta atKeti Bandar, close to the mouth of the Indus River at the ArabianSea coast (Fig. 1). Although the site is no longer a location of activeaccumulation, previously published 14C dating has established thatsedimentation was continuous from ~13,500 to 300 ‘calendar’ yearsbefore present (cal yr BP) (Clift et al., 2008) (Online data supplement;Figs. S1 and S2). Because the Indus delta has prograded seawardssince ~13.5 ka (Giosan et al., 2006) changes in sedimentation ratesand in lithology are mostly linked to shoreline advance and retreatrather than variations in the rate of sediment supply.
Thus, these three regions provide three localized areas where wecan examine the clay mineralogy of the sediment being transportedand stored within the Indus River basin during the Holocene. We

371A. Alizai et al. / Quaternary Research 77 (2012) 368–381
test whether the clay mineral changes at the river mouth are similarto those preserved synchronously around the Thar Desert anddetermine if these can be linked to changes in climate. In so doingwe consider the degree of sediment buffering in the flood plainsand integration by the delta. Geomorphic studies have highlightedthe fact that the flood plains have experienced incision and recyclingduring the Holocene (Clift et al., 2009), which may have influencedthe mineralogy of the sediment reaching the ocean since these sedi-ment would be expected to be more weathered than fresh materialfrom mountain sources.
In order to interpret trends in clay mineralogy in terms of weather-ing changes we must first understand the potential effects of changingsources. Earlier provenance work from the flood plains is based on U–Pb dating of zircon grains (Alizai et al., 2011a; Clift et al., in press) andthe Pb isotope characteristics of K-feldspar grains (Alizai et al., 2011b).However, these studies refer only to sands, not the clays targeted here.The difference is significant because sand, especially dense grains likezircon, tends to be transported as bedload rather than as suspendedsediment, as is the case with clays. These earlier studies show a generalpattern of sediment supply from the Himalaya-draining Yamuna andSutlej Rivers to the eastern parts of the flood plains (Marot; Fig. 1)and from the similarly sourced Beas River to regions just to the west(Tilwalla). Both these boreholes show increasing flux from the TharDesert going up-section prior to the deposition of the last channelsands. Sediments at Fort Abbas are believed to largely representreworking from the Thar Desert (Clift et al., in press).
Only at Keti Bandar is there Nd isotope data from finer-grainedmaterials to help constrain provenance. This is important because atKeti Bandar sediment flux is integrated from across the whole basin.The study of Clift et al. (2008) showed a shift away fromKarakoram-derived sediment towards sources in the Himalayabetween the base of the core and ~50 m depth (~7–9 ka) abovewhich level they demonstrated relative stability from that time tothe present day. Thus changes in clay mineralogy at Keti Bandarabove 50 m depth can be most clearly linked to changes in environ-mental conditions rather than provenance.
Methods
X-ray diffraction (XRD) is the most reliable and commonly usedtechnique for the determination and quantification of clay mineral as-semblages. In this study we use the semi-quantitative method ofMoore and Reynolds (1989) to estimate the clay assemblage, whichis based on peak-intensity factors determined from calculated XRDpatterns. Hillier (2003) described the method used in the present
Table 1Radiocarbon ages from the core and trench sites used to control the timing of sedimentationTilwalla are from Clift et al. (in press). The ages from Marot, Nara and Fort Abbas are from
Sr. no. Location Sample ID Material type
1 Keti Bandar KB-6-2 Plant/wood2 Keti Bandar KB-11-1 Mollusc shell3 Keti Bandar KB-17-2 Mollusc shell
Keti Bandar KB_19-4 Mollusc shell4 Keti Bandar KB_19-4 Mollusc shell5 Keti Bandar KB-23-2 Mollusc shell6 Keti Bandar KB-28-2 Mollusc shell7 Keti Bandar KB-35-1 Mollusc shell8 Keti Bandar KB-38-3 Mollusc shell9 Keti Bandar KB-40-4 Mollusc shell10 Keti Bandar KB-40-4 Coral11 Fort Abbas 080421-3 Mollusc shell12 Nara NA-7-7 Bivalve13 Marot MAR-2-5 Gastropod14 Tilwalla Till-3-17B Plant/wood
All the radiocarbon data were produced at the National Ocean Sciences Accelerator Mass SpKeti Bandar ages after Clift et al. (2008).
study in detail, including its validation and an assessment of analyti-cal uncertainty based on its application to prepared mixtures of pureclay minerals. For clay minerals present in amounts >10 wt.%uncertainty is estimated as better than ±5 wt.% at the 95% confidencelevel. Uncertainty of peak area measurement based on repeatedmeasurements is typically b5%, with the smallest peaks having thehighest uncertainties. In addition to calculating the relativepercentages of clay minerals in the samples, we also determine vari-ous ratios based on measurements of peak areas in the XRD patterns.These ratios are used to reconstruct changes in relative abundanceand are directly proportional to ratios calculated from the exactvalues for individual mineral percentages. Data are presented asboth relative percentages and as ratios to best illustrate factors thatcontrol trends.
184 samples were taken from four core sites and two trenches.These comprise drill sites at Marot (44 samples), Tilwalla (63 sam-ples), Nara (14 samples) and Keti Bandar (30 samples), as well astrench sites at Fort Abbas (19 samples) and Fort Derawar (14 samples)(Fig. 1). The clay-sized fraction (b2 μm) was separated by sedimenta-tion and application of Stokes’ Law. The filter-transfer method wasused to orient clay minerals on a glass slide prior to X-ray analysisfollowing the method of Moore and Reynolds (1989). The sampleswere analyzed at the Macaulay Institute, Aberdeen, UK (now theHutton Institute), using a Siemens X-ray diffractometer, with Co Kαradiation selected by a diffracted beam monochromator. A set ofthree diffraction patterns (i.e., air-dried, glycolated and heated to300°C for 1 h) were produced for each sample and used for mineralquantification. All patterns were collected by step scanning from 2 to45° 2θ, in 0.02° steps and counting for 1 s per step. Peak areameasure-ments for individual minerals were made using Bruker Diffrac PlusEVA-12.0 software. Ratios reflecting relative variations in clay mineralabundance were determined from peak area measurements. Illitecrystallinity was measured using the Bruker Eva software as the fullwidth at half maximum (FWHM) of the illite 001 basal peak in glyco-lated XRD patterns in units of Δ°2θ; formally known as the ‘Kubler’index. We also measured the integral breadth of the illite 001 peak,which is the breadth inΔ°2θ of a rectangle of the same area and heightas the corresponding peak. Integral breadth trended in the same fash-ion as FWHM and is not discussed further in this paper.
Depositional age determinations were taken from previous stud-ies and were mostly made by the 14C dating method to mollusc shells,as well as to wood and plant remains. These were further supplemen-ted by optically stimulated luminescence dating. The compilation isgiven in Table 1 and shown graphically in the online data supplement(Fig. S1). Depositional ages for the Keti Bandar core site were
in the studied sections. Ages at Keti Bandar are from Clift et al. (2008), while those atAlizai et al. (2011b).
Depth (m) 14C ages(14C yr BP)
Calendar age range(2 sigma, cal yr BP)
15.48 245 ±25 277–31729.62 2560 ±30 1813–194749.55 7080 ±40 7153–742755.49 8210 ±55 9017–930955.49 8710 ±65 8302–913967.24 9160 ±35 8850–968780.33 10,100 ±30 10,477–10,772100.22 12,650 ±40 12,953–13,981110.73 13,000 ±55 13,265–15,172116.93 28,700 ±110 31,623–30,711116.93 38,900 ±410 42,032–40,5723.48 5050 ±35 3957–37676. 4830 ±25 3660–35319.37 6500 ±50 5604–535943.7 45,100 ±670 47,980–44,801
ectrometry Facility (NOSAMS) at the Woods Hole Oceanographic Institution, USA.

372 A. Alizai et al. / Quaternary Research 77 (2012) 368–381
published by Clift et al. (2008); ages from Marot, Tilwalla, Fort Abbasand Nara were published by Clift et al. (in press) and Alizai et al.(2011b).
Results
The major clay mineral groups resolved at all study sites are illite,kaolinite chlorite and smectite. The identification of illite, chlorite andkaolinite was straightforward, whereas for smectite there was somevariation in the diffraction patterns that may indicate a small degreeof mixed layering in some samples. Typically, this is manifest by sub-tle changes in peak positions and peak profiles that appear to vary inrelation to the relative abundance of smectite in a given sample. Thussamples characterized by a high relative abundance of smectite showrational peak positions that are consistent with a pure ‘end-member’smectite (Moore and Reynolds, 1989). There is no single peakposition for end-member smectite, the key to its precise identificationare the rational peak positions (i.e., the 005 peak is an exact sub-multiple of the 001 spacing). In contrast, samples with relativelylow smectite abundance show peak positions with a measureabledegree of irrationality (irregular peak position) and correlativechanges in peak shape. These characteristics indicate unequivocallythat the clay mineral is not pure (end-member) smectite but containsa small degree of (b20%) of mixed layering, probably of illite layers.However, for the sake of simplicity, both types are referred to as‘smectite’ and the evidence for mixed layering is referred tospecifically when relevant. The clay mineral data is divided intothree geographical areas, which we present independently beforediscussing them together.
The general character of the clay assemblages is shown in Figure 3,which demonstrate the generally low levels of kaolinite seen in allsamples, but the wide range in smectite compared to illite andchlorite. The samples from Keti Bandar have a more restricted rangethan many of the flood-plain sites. The highest proportions ofsmectite are found at Nara, Tilwalla and Marot, although all threesites also have examples of some of the most (illite+chlorite)-richassemblages.
Mineralogy in the upper eastern Punjab
The stratigraphy sampled at the two drilling sites south of Baha-walpur show that they both have similar clay mineral assemblages.
Figure 3. Ternary diagram of clay–mineral compositions from all the samples consid-ered in this study. They show uniformly low proportions of kaolinite and a widerange in smectite versus physically weathered illite and chlorite clays. Note thatclay–mineral variation observed at Keti Bandar is less extreme than that found in theflood plains in Punjab.
Clay mineral weight percentages at Marot comprise smectite(27–64%), illite (25–60%), kaolinite (2–6%) and chlorite (4–11%)(Table S1). At the Tilwalla core site the clay mineral assemblage com-prises smectite (25–65%), illite (24–66%), kaolinite (1–6%) and chlorite(5–12%). The trench at Fort Abbas shows clay mineral abundances ofsmectite (47–57%), illite (32–45%), kaolinite (3–5%) and chlorite(6–8%). The other trench site at Fort Derawar comprises smectite(39–57%), illite (38–50%), kaolinite (2–5%) and chlorite (7–11%).Because they are the most abundant clay minerals present, most of thevariations in relative abundance are caused by changes in theproportions of smectite and illite. As mentioned above, sediments withrelatively low smectite abundance appear to be characterized by thepresence of mixed-layer illite–smectite, whilst those with high smectitecontent are characterized by a more nearly pure end-member smectite.Two samples from the Tilwalla section that are illustrative of thesetypes are shown in the online data supplement (Fig. S3).
The more subtle variations in the relative abundance of chloriteand kaolinite are more easily appreciated by an examination of peakarea ratios. Clay ratios based simply on the areas of key peaks are use-ful in defining and comparing possible environmental trends. Wehave employed kaolinite/smectite, kaolinite/illite, smectite/illite,smectite/(illite+chlorite), kaolinite/chlorite and kaolinite/(illite+chlorite) ratios because these ratios are all potentially environmen-tally controlled and have been successfully used in past studies.Here we try to assess which of these is the most sensitive.
The evolving mineral ratios in the two cored sections allow these tobe divided into three broad intervals. The upper section (0–14.16 m) inthe Marot core, which is dominated by the finest grained sediments(Fig. 4), has kaolinite/smectite values of 0.06–0.19 (averaging 0.12).The second depth interval of 14.16–28.94 m comprises both fine andsand–sized material with kaolinite/smectite values ranging 0.05–0.17(averaging 0.09). The deepest depth interval of 28.94–41.14 m has ka-olinite/smectite values of 0.06–0.08 (averaging 0.08). These values areclose to those found in the Tilwalla core over depth intervals0–22.23 m, 22.23–37.48 and 37.48–45.11 m, where kaolinite/smectiteratios are 0.03–0.17, (averaging 0.10), 0.04–0.10 (averaging 0.06) and0.05–0.11 (averaging 0.07) (Figs. 4B and 5B). Variation in kaolinite/smectite with depth at these two sites is also mirrored in the variabilityin illite crystallinity (FWHM) (Figs. 4A and 5A). Both sites show similarpatterns in depth-lithology and depth-clay variations. It is noteworthythat kaolinite/smectite and kaolinite/illite ratios are generally higher atthe top of both sections compared to deeper and they appear to be lessaffected by changes in lithology compared to some other ratios. In allthe measured sections there is a clear correlation between clay miner-alogy and lithology, most clearly with smectite being enriched and illitereduced over sandier intervals.
At Fort Abbas and Fort Derawar, the kaolinite/smectite ratioranges 0.10–0.19 (averaging 0.15) and 0.07–0.19 (averaging 0.13) re-spectively, most similar to the shallowest part of the sections at Marotand Tilwalla. Other mineral ratios at Fort Abbas include kaolinite/illiteof 0.12–0.26 (averaging 0.20), smectite/illite of 1.02–1.59 (averaging1.34), kaolinite/(illite+chlorite) of 0.11–0.22 (averaging 0.17) andsmectite/(illite+chlorite) of 0.9–1.48 (averaging 1.14) (Online DataSupplement: Fig. S4B). At Fort Derawar kaolinite/smectite is higherstill compared to the sediments from Marot and Tilwalla, showingvalues of 0.07–0.19 (averaging 0.13). Kaolinite/illite values range0.10–0.21 (averaging 0.14); smectite/illite ranges 0.79–1.66 (averag-ing 1.12), kaolinite/(illite+chlorite) is 0.08–0.16 (averaging 0.12)and smectite/(illite+chlorite) is calculated at 0.68–1.39 (averaging0.94) (Online Data Supplement: Fig. S5B). These latter ratios are a lit-tle lower than those found at Fort Abbas.
Mineralogy in the Nara region
Clay mineral analysis of the Nara core (Online data supplement;Table S1) show smectite abundances at 27–74%, illite at 20–58%,

Figure 4. Down-core variation in clay minerals in the Marot borehole showing variations in the relative abundance of kaolinite, smectite, illite and chlorite along with chlorite/illiteratio and the crystallinity index for illite, as measured by the full width at half maximum (FWHM) of the illite 001 basal peak. (B) Variations in climate-sensitive proxy ratios:smectite/(illite+chlorite), kaolinite/(illite+chlorite), kaolinite/illite, kaolinite/smectite, kaolinite/chlorite and smectite/illite. Note increasing values of kaolinite/illite, kaolinite/smectite, and kaolinite/chlorite above 15 m depth.
373A. Alizai et al. / Quaternary Research 77 (2012) 368–381
kaolinite at 1–4% and chlorite at 4–13%. This is in the same generalrange as that seen in the Bahawalpur region, i.e. high smectite andillite and low kaolinite and chlorite. However, in the Nara area wesee long amplitude variations in smectite and illite compared to theBahawalpur area, while kaolinite and chlorite show more or less thesame composition as further north.
At Nara the kaolinite/smectite, smectite/illite, kaolinite/illite,kaolinite/(illite+chlorite) and smectite/(illite+chlorite) ratiosshow coherent variability with depth, and a generally good matchwith changes in the illite crystallinity index. (Figs. 6A, B). The clay ra-tios allow us to divide the section into three intervals (i.e., 0–8.24,8.24–23.21 and 23.21–29.39 m). In the upper interval crystallinity islow, as is smectite/illite and smectite/(illite+chlorite). Ratios involv-ing kaolinite are generally more variable, likely because of the lowconcentrations of that mineral. Illite crystallinity, smectite/illite andsmectite/(illite+chlorite) all increase below 8 m depth (close tothe 14C age of 3400–3700 cal yr BP). These ratios decrease furtherdown-section, except for another high point close to 24 m depthand at the lowest sample at 29 m depth.
Mineralogy in the delta region
The section at Keti Bandar, representing flux to the delta, showsclay mineral abundances ranging from 35–54% for smectite, 34–52%for illite, 1–5% for kaolinite and 7–12% for chlorite, i.e. similar rangesto those found on the flood plains of the Punjab, indicating that theassemblages are essentially coherent from both areas (Online datasupplement; Table S2). Illite increases in parallel with a concomitantdecrease in smectite with depth. Smectite abundance is greatest andillite abundance is the least at ~48 m depth, which is just above the~8200 cal yr BP flooding surface that separates the section here intotwo coarsening-upwards regressive cycles.
The average mineral ratios at Keti Bandar are kaolinite/smectite0.11, smectite/illite 1.06, kaolinite/illite 0.12, kaolinite/(illite+chlorite)0.10 and smectite/(illite+chlorite) 0.88. The average value for the illitecrystallinity index (FWHM) is 0.31 (Fig. 7). Coherent variabilitywith depth is seen for some of the ratios. Smectite/illite and smectite/(illite+chlorite) generally show low values towards the base of thecore, except for the lowermost samples dated as having been exposed

Figure 5. Down-core variation in clay minerals at the Tilwalla core site showing variations in the relative abundance of kaolinite, smectite, illite and chlorite percentages along withchlorite/illite ratio and the crystallinity index for illite. (B) Variations in climate-sensitive proxy ratios: smectite/(illite+chlorite), kaolinite/(illite+chlorite), kaolinite/illite,kaolinite/smectite, kaolinite/chlorite and smectite/illite.
374 A. Alizai et al. / Quaternary Research 77 (2012) 368–381
and possibly deposited at the LGM (>20 ka),which lie below an uncon-formity separating them from the 14 ka overlying transgressive muds(Clift et al., 2008). These ratios show a gradual increase up-section to~48 m depth, before falling from that point to the surface. Kaolinite/illite also shows similar trends, as does kaolinite/smectite (Fig. 7B),both of which fall sharply in the upper 30 m of the sediment column.This reflects the decrease in kaolinite abundance over the same depthinterval.
Discussion
Regional variations in clay mineralogy can be assessed by plottingclay mineral ratios against one another. Figure 8A shows thevariations in kaolinite/(illite+chlorite) compared to those in illitecrystallinity for all the different study areas. This diagram shows
that there is no overall close relationship between proxies forleaching and for alteration by hydrolization during weathering. Allsites show a wide array of illite crystallinity, but there are resolvabledifferences between sites in kaolinite/(illite+chlorite). Sedimentsat Fort Abbas and Marot have especially high kaolinite/(illite+chlorite) values. Although sediments from Tilwalla also have highvalues it is noteworthy that the lowest kaolinite/(illite+chlorite)values are found there and in the Nara valley. The delta sedimentsfrom Keti Bandar cluster with moderate values in kaolinite/(illite+chlorite), suggesting that they integrate material from across the en-tire drainage, eliminating extreme variations that may occurlocally. The differences among Tilwalla and the Marot and FortAbbas samples may in part reflect their different source origins(Clift et al., in press), rather than radical differences among sitesthat are close by and experience similar climatic conditions.

Figure 6. Down-core variation in clay minerals at the Nara borehole showing (A) variations in the relative abundance of kaolinite, smectite, illite and chlorite percentages alongwith chlorite/illite ratio and the crystallinity index for illite as measured by the FWHW. (B) Variations in climate-sensitive proxy ratios: smectite/(illite+chlorite), kaolinite/(illite+chlorite), kaolinite/illite, kaolinite/smectite, kaolinite/chlorite and smectite/illite.
375A. Alizai et al. / Quaternary Research 77 (2012) 368–381
Links between leaching processes and hydrolization can be assessedby plotting smectite/kaolinite against illite crystallinity (Fig. 8B). Againthere is no clear overall relationship but the plot indicates that sedi-ments at different boreholes have different weathering histories. Sedi-ments from Tilwalla, and to a lesser extent the Nara Valley, show thehighest smectite/kaolinite values, suggestive of reduced leaching inthe presence of the warm, dry environment. This is consistent withtheir position on the edge of the Thar Desert. Sediments from Marothave moderate smectite/kaolinite values and lower illite crystallinityindicating less hydrolization, but more leaching. Sediments from KetiBandar, as well as Forts Derawar and Abbas have the greatest degreesof leaching but the least hydrolization. This figure suggests differentweathering conditions across the flood plains and contrasting prove-nances. The character of the Keti Bandar sediments certainly suggeststhat the rivers of the Tilwalla, Marot and Nara regions are not the dom-inant sediment contributors to the delta. The similarity between KetiBandar and Forts Derawar and Abbas is consistent with the conclusionfrom zircon dating and Pb isotope work that indicates that the dunes ofthe Thar Desert are largely reworked from mixed Indus sediments inthe lower reaches, transported to the NE by eolian processes (Alizaiet al., 2011a; Alizai et al., 2011b). These dunes sands are then reworkedinto the channel sands of at Forts Derawar and Abbas. The sources ofthe Indus River appear to be dominated by regions experiencingweathering in a wet, tropical setting.
Upper Eastern Punjab
The clay records at Marot and Tilwalla show close similarities inthe depth variations of the clay ratios (Figs. 4 and 5). Unfortunately
poor age control makes it impossible to test whether the variationsare synchronous. There is only one 14C age in the core at Tilwalla, at45,100 14C yr BP near the base of the section, although a OSL age at3.84 m depth suggests sedimentation as young as 4900 yr (Clift etal., in press), with an end to sedimentation shortly after this time.This is close to the age of 7300 14C yr BP seen near to the top of thesection at Marot. The age of the thicker sand bodies in each boreholeis not well-known, but is presumed to be early Holocene (7–10 ka) toPleistocene.
The kaolinite/smectite ratio shows a coherent pattern increasingup-section at both Marot and Tilwalla, with the highest valuesattained in the uppermost, finest grained layers. Similar trends arealso seen in kaolinite/illite and kaolinite/(illite+chlorite), all drivenby an up-section increase in kaolinite contents. If we interpret the ka-olinite/smectite ratio as a weathering proxy that reflects variationsbetween humid-warm (kaolinite-rich) and more dry and seasonal(smectite-rich) climate conditions (Adatte et al., 2002) we may inter-pret this trend to indicate warmer wetter conditions during the earlyHolocene enhancing chemical weathering towards the top of thesection (Figs. 4B and 5B). At both sites the underlying sand bodiesare characterized by higher values of smectite/illite and smectite/(illite+chlorite) and lower values of kaolinite/smectite, kaolinite/illite and kaolinite/(illite+chlorite).
Variations in the clay ratios appear to closely correlate withchanges in lithology, showing that these changes have no clear signif-icance as environmental indicators. For example, smectite/illiteshows higher values in sands compared to surrounding clay-richlayers. The same is true of smectite/(illite+chlorite). However, wenote that at both sites the smectite/(illite+chlorite) ratios are

Figure 7. Down-core variation in clay minerals at Keti Bandar showing (A) variations in the relative abundance of kaolinite, smectite, illite and chlorite percentages, along withchlorite/illite ratio and the crystallinity index for illite. (B) Variations in climate-sensitive proxy ratios: smectite/(illite+chlorite), kaolinite/(illite+chlorite), kaolinite/illite, kao-linite/smectite, kaolinite/chlorite and smectite/illite.
376 A. Alizai et al. / Quaternary Research 77 (2012) 368–381
lower in the older muds than they are in the younger, shallowestmuds, which we interpret to indicate more chemical weathering inrecent times compared to the Pleistocene.
Key to this discussion is the origin of the abundant smectite in theIndus flood-plain sediments. The association of high smectite withsands is suggestive of a detrital origin. However, Stern et al. (1997)
showed that the oxygen isotopic composition of smectite in olderHimalayan Molasse was consistent with a pedogenic origin and thatthis was even responsive to climate change. Given the predominantlymetamorphic and igneous provenance of the Indus sedimentssmectite-rich detritus from the primary source areas would not beexpected, so that a pedogenic origin for smectite in the alluvial
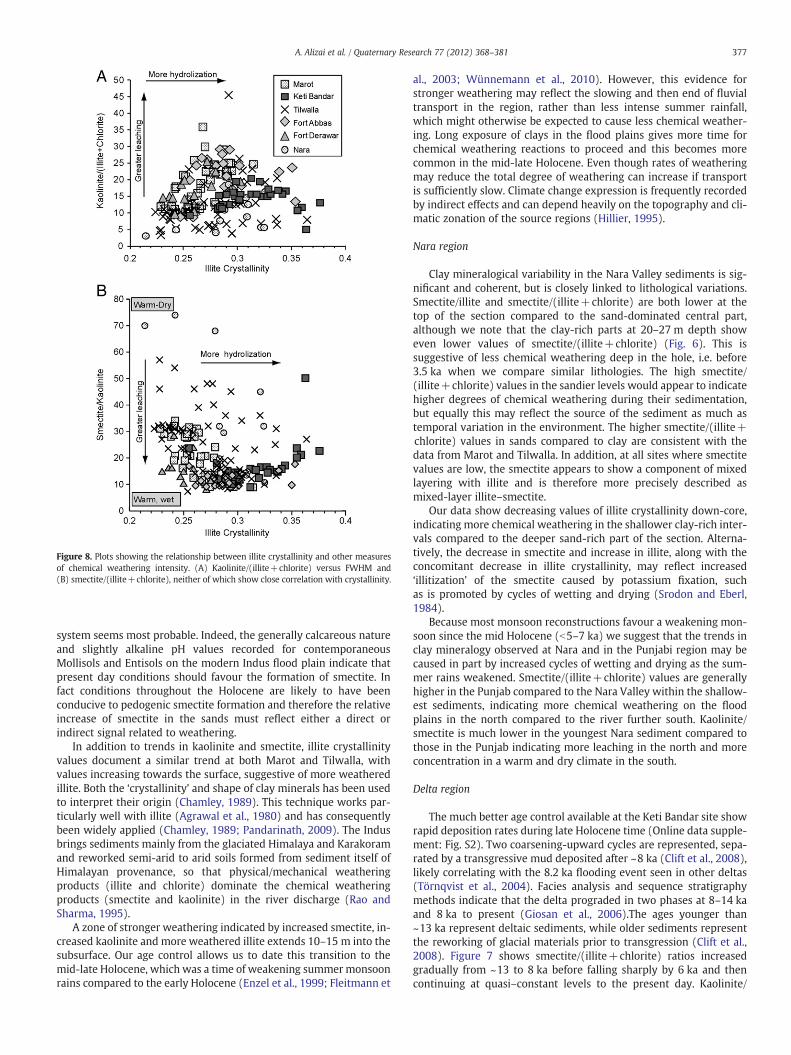
Figure 8. Plots showing the relationship between illite crystallinity and other measuresof chemical weathering intensity. (A) Kaolinite/(illite+chlorite) versus FWHM and(B) smectite/(illite+chlorite), neither of which show close correlation with crystallinity.
377A. Alizai et al. / Quaternary Research 77 (2012) 368–381
system seems most probable. Indeed, the generally calcareous natureand slightly alkaline pH values recorded for contemporaneousMollisols and Entisols on the modern Indus flood plain indicate thatpresent day conditions should favour the formation of smectite. Infact conditions throughout the Holocene are likely to have beenconducive to pedogenic smectite formation and therefore the relativeincrease of smectite in the sands must reflect either a direct orindirect signal related to weathering.
In addition to trends in kaolinite and smectite, illite crystallinityvalues document a similar trend at both Marot and Tilwalla, withvalues increasing towards the surface, suggestive of more weatheredillite. Both the ‘crystallinity’ and shape of clay minerals has been usedto interpret their origin (Chamley, 1989). This technique works par-ticularly well with illite (Agrawal et al., 1980) and has consequentlybeen widely applied (Chamley, 1989; Pandarinath, 2009). The Indusbrings sediments mainly from the glaciated Himalaya and Karakoramand reworked semi-arid to arid soils formed from sediment itself ofHimalayan provenance, so that physical/mechanical weatheringproducts (illite and chlorite) dominate the chemical weatheringproducts (smectite and kaolinite) in the river discharge (Rao andSharma, 1995).
A zone of stronger weathering indicated by increased smectite, in-creased kaolinite and more weathered illite extends 10–15 m into thesubsurface. Our age control allows us to date this transition to themid-late Holocene, which was a time of weakening summermonsoonrains compared to the early Holocene (Enzel et al., 1999; Fleitmann et
al., 2003; Wünnemann et al., 2010). However, this evidence forstronger weathering may reflect the slowing and then end of fluvialtransport in the region, rather than less intense summer rainfall,which might otherwise be expected to cause less chemical weather-ing. Long exposure of clays in the flood plains gives more time forchemical weathering reactions to proceed and this becomes morecommon in the mid-late Holocene. Even though rates of weatheringmay reduce the total degree of weathering can increase if transportis sufficiently slow. Climate change expression is frequently recordedby indirect effects and can depend heavily on the topography and cli-matic zonation of the source regions (Hillier, 1995).
Nara region
Clay mineralogical variability in the Nara Valley sediments is sig-nificant and coherent, but is closely linked to lithological variations.Smectite/illite and smectite/(illite+chlorite) are both lower at thetop of the section compared to the sand-dominated central part,although we note that the clay-rich parts at 20–27 m depth showeven lower values of smectite/(illite+chlorite) (Fig. 6). This issuggestive of less chemical weathering deep in the hole, i.e. before3.5 ka when we compare similar lithologies. The high smectite/(illite+chlorite) values in the sandier levels would appear to indicatehigher degrees of chemical weathering during their sedimentation,but equally this may reflect the source of the sediment as much astemporal variation in the environment. The higher smectite/(illite+chlorite) values in sands compared to clay are consistent with thedata from Marot and Tilwalla. In addition, at all sites where smectitevalues are low, the smectite appears to show a component of mixedlayering with illite and is therefore more precisely described asmixed-layer illite–smectite.
Our data show decreasing values of illite crystallinity down-core,indicating more chemical weathering in the shallower clay-rich inter-vals compared to the deeper sand-rich part of the section. Alterna-tively, the decrease in smectite and increase in illite, along with theconcomitant decrease in illite crystallinity, may reflect increased‘illitization’ of the smectite caused by potassium fixation, suchas is promoted by cycles of wetting and drying (Srodon and Eberl,1984).
Because most monsoon reconstructions favour a weakening mon-soon since the mid Holocene (b5–7 ka) we suggest that the trends inclay mineralogy observed at Nara and in the Punjabi region may becaused in part by increased cycles of wetting and drying as the sum-mer rains weakened. Smectite/(illite+chlorite) values are generallyhigher in the Punjab compared to the Nara Valley within the shallow-est sediments, indicating more chemical weathering on the floodplains in the north compared to the river further south. Kaolinite/smectite is much lower in the youngest Nara sediment compared tothose in the Punjab indicating more leaching in the north and moreconcentration in a warm and dry climate in the south.
Delta region
The much better age control available at the Keti Bandar site showrapid deposition rates during late Holocene time (Online data supple-ment: Fig. S2). Two coarsening-upward cycles are represented, sepa-rated by a transgressive mud deposited after ~8 ka (Clift et al., 2008),likely correlating with the 8.2 ka flooding event seen in other deltas(Törnqvist et al., 2004). Facies analysis and sequence stratigraphymethods indicate that the delta prograded in two phases at 8–14 kaand 8 ka to present (Giosan et al., 2006).The ages younger than~13 ka represent deltaic sediments, while older sediments representthe reworking of glacial materials prior to transgression (Clift et al.,2008). Figure 7 shows smectite/(illite+chlorite) ratios increasedgradually from ~13 to 8 ka before falling sharply by 6 ka and thencontinuing at quasi–constant levels to the present day. Kaolinite/

378 A. Alizai et al. / Quaternary Research 77 (2012) 368–381
smectite ratios show a slightly different trend. This ratio was low at~13 and ~11 ka, but was higher at ~12 ka and in the early Holoceneat 9–10 ka. Kaolinite/smectite shows a decreasing trend after~7.5 ka (Fig. 7).
We compare these trends with mineralogical results from Kochi(Thamban et al., 2002), a coastal site in western India (Fig. 1),which records run-off from peninsular India, and which is also dom-inated by a SW monsoonal climate (Fig. 9). Both the Indus delta andKochi show maximum smectite/(illite+chlorite) around 6–7 ka.However, the Kochi record indicates more chemical weathering onlystarting after ~9.7 ka, while the increasing trend at Keti Bandarcommences at the base of the cored section (~13 ka). Although bothbroadly correlate with the intensity of the summer monsoon the re-sponse is different in each place. In this respect the Indus Delta recordparallels trends seen in SE Asia in the Mekong offshore region, whichalso records smectite/(illite+chlorite) increasing after 14 ka (Colin etal., 2010). This is a period when the monsoon is generally consideredto be strengthening (Overpeck et al., 1996; Gupta et al., 2003). KetiBandar shows a fall in smectite/(illite+chlorite) between 7.3 and5.9 ka, while Kochi has a single very high value ~6.5 ka. The temporalresolution is low, and it is not clear whether the two sites are reallyout of step with one another in the timing of the maximum.Smectite/(illite+chlorite) ratios at both sites reach low values at5–6 ka, indicating weaker chemical weathering, consistent with areduced summer monsoon at that time. Since ~6 ka to recent times,the smectite/(illite+chlorite) values at both Keti Bandar and Kochihave been variable but lower than the peak in the early Holocene(Fig. 9).
In order to try to understand the linkage between monsoon inten-sity, chemical weathering and clay mineral formation we plot the clayratios against select monsoon proxies. Here we compare with a pollenratio record from Tso (Lake) Kar in Ladakh in northernmost India(Wünnemann et al., 2010), a Globigerina bulloides record from the
Figure 9. Chart showing the temporal evolution of the environmentally sensitive proxies kCochin-Kochi, India (Thamban et al., 2002). The kaolinite/smectite ratio is used to graph vations, one (kaolinite) requiring more leaching, the other (smectite) more concentration.moisture-controlled pollen record from Tso Kar in Ladakh (Wünnemann et al., 2010), an u(Overpeck et al., 1996) and a speleothem record from the Qunf Cave in southern Oman (Ffor comparison.
Oman margin of the Arabian Sea (Overpeck et al., 1996) and from aspeleothem record from southern Oman, the oxygen isotopecharacter of which is considered to be a robust measure of rainfall in-tensity (Fleitmann et al., 2003). Globigerina bulloides abundance haslong been used a proxy for the summer monsoon because the modernabundance of this planktonic foraminifer is closely linked toupwelling induced by summer monsoon winds in that part of thenorthern Indian Ocean (Prell and Curry, 1981).
It is clear that the monsoon proxies are not all in agreement. Thelake records indicate a strengthening of the summer monsoon after11.4 ka, at the onset of the Holocene, while the upwelling record sug-gests that the increase began much earlier, ~17 ka. The speleothemrecord shows summer monsoon strengthening a little later than thelake records after ~10 ka. All the records suggest that the monsoonremained strong and only experienced significant decline after~6 ka. The clay mineralogy shows a first-order correlation with themonsoon proxies in that it indicates increasing chemical weatheringin the Holocene, as the monsoon intensified. However, theKochi-Cochin record shows a much clearer response to the strengthen-ing after 11 ka than is apparent at Keti Bandar. Furthermore, at bothKeti Bandar and Kochi-Cochin the peak in clay mineralogy occurssomewhat after the climatic peak, at 6–8 ka. This suggests a lag of3000–5000 yr between the change in the climate and a change inthe clay mineralogy in the river deltas of the region. Such a delay inthe formation of smectite-rich assemblages may reflect the timeneeded to form clay minerals in the flood plains after the change ofclimate.
The rapid decline in smectite/(illite+chlorite) ratios in both thedeltas after 6–7 ka is not paralleled by any clear sharp decline in themonsoon intensity at that time. The proxies instead point to a gradualweakening of the monsoon then. Indeed the Tso Kar pollen recordshows a sharp decline only after 5 ka. Some of this temporal mis-match may reflect uncertainties in the age control at each study
aolinite/smectite and smectite/(illite+chlorite) at Keti Bandar compared with that atriation in two clays, which are potentially both pedogenic, but indicate different condi-We further compare these with three monsoon reconstructions for the Holocene, apwelling record of Globigerina Bulloides (%) on the Oman margin of the Arabian Sealeitmann et al., 2003). The Greenland ice core of Stuiver and Grootes (2000) is shown
379A. Alizai et al. / Quaternary Research 77 (2012) 368–381
site. We suggest that the delta clay mineralogy does indicate a changein chemical weathering conditions in the river flood plains as themonsoon changes, but that it seems unlikely that clay mineralogycan be used to pin-point environmental changes at high temporalresolution (i.e., b1000 yr). The contrasting responses of Kochi andKeti Bandar also indicate that the marine weathering record will beinfluenced by the nature of the onshore drainage, especially thedegree of sediment buffering and recycling. Erosion of pre-existingfluvial terrace sediments is known to be a significant influence onthe flux to the Indus, at least since 10 ka (Bookhagen et al., 2006;Clift et al., 2009).
The clay mineral trends preserved in the delta sediments appearto be consistent with the anticipated weathering response to climatechange whereas the floodplain records show an opposing trend. Thisdifference reflects the fact that most of the sediment arriving at thedelta is derived directly from Himalayan source regions rather thanbeing reworked on the flood plain. The delta record tends to integratethe overall signal from the catchment and smooth out any spatiallyvariable signatures from the flood plains. Illite crystallinity shows noobvious temporal trend, but it is notable that the values in the delta(max 0.37, min 0.25, mean 0.31) are generally higher than those ob-served in the floodplain (max 0.36, min 0.21, mean 0.27). This mayindicate that the bulk of the sediment delivered to the delta is moreweathered than the material we measured from the flood plains inCholistan (area located to the north of the Thar Desert). This is notconsistent, however with the idea that most of the sediment reachingthe delta is not derived from this region but represent faster directtransport from the mountains.
Sources and transport of clays in the Indus basin
The clay data from the Indus basin allow us to ask whether claymineralogy in the delta changes with monsoon intensity. We havediscussed the possibility that climate directly influences weatheringregimes and thereby the composition of clays being formed or trans-formed in the flood plains and subsequently transported to the ocean.Another possibility is that climate change causes a change in how andwhere sediment is eroded from within the basin and that the changein clay assemblage reflects instead, more or less, reworking ofsediment previously stored in the flood plains. This latter hypothesisis consistent with the higher smectite/(illite+chlorite) ratiosobserved in the sands versus the mudstones. Because sands tend torepresent either overbank flooding events or channel deposits theyare higher energy deposits usually formed by erosion of the flood-plain sediment further upstream, rather than direct delivery fromthe mountains. This is especially true in the Punjab where the sitesare fed by the now ephemeral Ghaggar-Hakra River.
A series of maps for the early, middle and late Holocene (1–6 ka)(Figs. 10A, B and C) show how clay mineral assemblages vary tempo-rally and synchronously across different parts of the flood plain. Onefeature that is apparent is that the assemblages are quite similar atthe broadest scale, with the exception that Nara and Tilwalla areespecially rich in smectite. Nonetheless, there are differences acrossthe area that may tell us something of the sediment transport historyand where the Indus River derives the bulk of its sediment load. For ex-ample, the early Holocene shows that the delta is generally richer in il-lite compared to the sites in the Punjab or Nara Valley (Fig. 10A). Thisprobably indicates that these regions are not representative of the av-erage clay assemblage in the entire system, which appears to be lesschemically weathered than the eastern flood plains.
We suggest that the majority of the clay load of the Indus is dom-inated by more direct erosion from the Lesser and Greater Himalaya(Clift et al., 2008), as suggested by Nd isotope data rather thanreworking from the flood plain. In contrast, in the Ghaggar systemmore clays were reworked by erosion of the flood plains, wherethey had been stored and were available for chemical weathering
over the period of the LGM. By the mid Holocene (Fig. 10B) thesmectite percentage at the delta had increased, but at Tilwalla thisclay was less abundant; the sands at Tilwalla have similar highsmectite content as those being synchronously deposited at thedelta. This is consistent with the idea that reworking of flood-plainsediments is a significant if minority contributor of sediment flux tothe ocean during the Holocene. The clays deposited at Nara duringthe mid and late Holocene are distinctive in their compositioncompared to the rest of the river system in being moresmectite-dominated than seen elsewhere (Fig. 10C). This implieseither more chemical weathering in this region or that this regionwas deriving its sediment from different regions compared to themain Indus, likely with strong influence from the Thar Desert. It islikely that as major channels in the Nara Valley were abandonedchemical weathering increased as transport times slowed, despitethe fact that the environment had become drier.
Conclusions
Our present work shows that the clay record reconstructed at thedelta (and representing the integrated flux from the Indus River)shows important differences with the terrestrial climate recordpreserved in the flood plains further upstream, although both reflectchanges in weathering and erosion as the monsoon first strength-ened, then weakened during the Holocene. The deltaic clay recordat Keti Bandar is shown to be a useful proxy record for changingcontinental weathering environments across the Indus basin despitethe fact that the clay mineral proxy record in at least part of the flood-plain shows site-specific trends that are contradictory with the deltarecord. The Indus delta shows a response to changes in monsoonstrength similar to that seen in SE Asia, with more influx of smectiteproduced by weathering and to a lesser extent more kaolinite duringthe early Holocene. The Indus record starts its trend to more chemicalweathering before that seen in Peninsular India, after ~14 ka com-pared to 11 ka.
The flood-plain record is harder to interpret because clay assem-blages vary strongly with the sediment type, while Keti Bandar is gen-erally muddy. Sands contain more chemically weathered smectiteand kaolinite compared to clay-rich layers. This may be because ofrecycling and reworking, or as a result of differences in the processesaffecting the sediment on the flood plain with more wetting and dry-ing, promoting illitization of smectite in environments receivingfiner-grained sediment. Furthermore, there is also a possibility ofthe post-depositional formation of smectite in the sands byperi-pedogenetic or early diagenetic process. Comparison of onlyclay-rich layers from within a single section shows more smectiteand kaolinite going up-section from the mid to late Holocene. Thistrend, as well as increasing kaolinite/smectite and increasing illitecrystallinity, is consistent with more chemical weathering in theflood plain as the monsoon weakened into the late Holocene. This isthe reverse of the trend at the delta at that time and shows that thispart of the flood plain was not the primary source of sediment tothe ocean and/or that the delta record is sufficiently integrative ofprocesses acting across the entire catchment that it is not perturbedby modest local variation. In the Punjabi plains increased weatheringprobably reflected slower transport as the monsoon weakened,soil-moisture regime became more variable, and sediment flux fromthe mountains was reduced.
Determining whether the clay mineral assemblages respond im-mediately to climate change or not is difficult because of poor agecontrol and because of uncertainties about how and when the mon-soon changed, depending on which proxy is used. Although there isa general correspondence between clay mineralogy in the largely ma-rine sediments cored at Keti Bandar and monsoon strength the peakresponse in clays at the delta postdates the climatic peak by3000–5000 yr. While the monsoon appears to have weakened
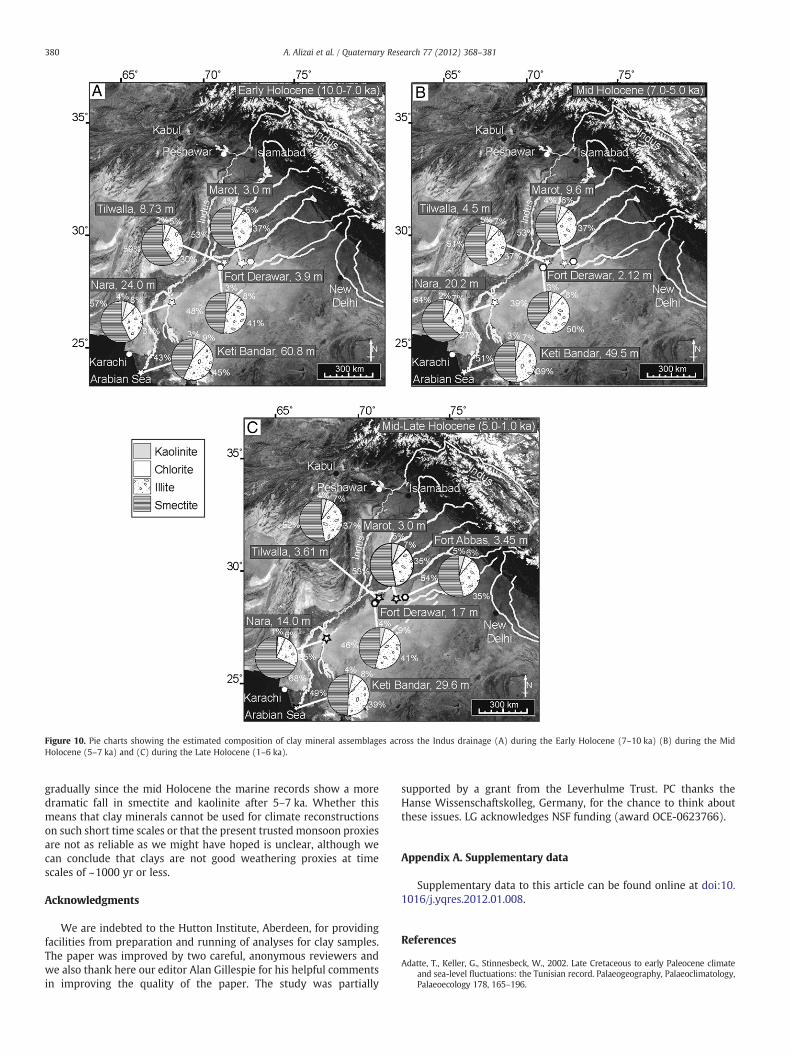
Figure 10. Pie charts showing the estimated composition of clay mineral assemblages across the Indus drainage (A) during the Early Holocene (7–10 ka) (B) during the MidHolocene (5–7 ka) and (C) during the Late Holocene (1–6 ka).
380 A. Alizai et al. / Quaternary Research 77 (2012) 368–381
gradually since the mid Holocene the marine records show a moredramatic fall in smectite and kaolinite after 5–7 ka. Whether thismeans that clay minerals cannot be used for climate reconstructionson such short time scales or that the present trusted monsoon proxiesare not as reliable as we might have hoped is unclear, although wecan conclude that clays are not good weathering proxies at timescales of ~1000 yr or less.
Acknowledgments
We are indebted to the Hutton Institute, Aberdeen, for providingfacilities from preparation and running of analyses for clay samples.The paper was improved by two careful, anonymous reviewers andwe also thank here our editor Alan Gillespie for his helpful commentsin improving the quality of the paper. The study was partially
supported by a grant from the Leverhulme Trust. PC thanks theHanse Wissenschaftskolleg, Germany, for the chance to think aboutthese issues. LG acknowledges NSF funding (award OCE-0623766).
Appendix A. Supplementary data
Supplementary data to this article can be found online at doi:10.1016/j.yqres.2012.01.008.
References
Adatte, T., Keller, G., Stinnesbeck, W., 2002. Late Cretaceous to early Paleocene climateand sea-level fluctuations: the Tunisian record. Palaeogeography, Palaeoclimatology,Palaeoecology 178, 165–196.
381A. Alizai et al. / Quaternary Research 77 (2012) 368–381
Agrawal, D., Datta, P., Hussain, Z., Krishnamurthy, R., Misra, V., Rajaguru, S., Thomas, P.,1980. Palaeoclimate, stratigraphy and prehistory in north and west Rajasthan.Journal of Earth System Science 89 (1), 51–66.
Alizai, A., Carter, A., Clift, P.D., VanLaningham, S., Williams, J.C., Kumar, R., 2011a.Sediment provenance, reworking and transport processes in the Indus River byU–Pb dating of detrital zircon grains. Global and Planetary Change 76, 33–55.doi:10.1016/j.gloplacha.2010.11.008.
Alizai, A., Clift, P.D., Giosan, L., et al., 2011b. Pb isotopic variability in the Modern andHolocene Indus River System measured by ion microprobe in detrital K-feldspargrains. Geochimica et Cosmochimica Acta 75, 4771–4795. doi:10.1016/j.gca.2011.05.039.
Birkeland, P.W., 1984. Soils and Geomorphology. Oxford University Press, Oxford. 310 pp.Biscaye, P.E., 1965. Mineralogy and sedimentation of recent deep-sea clay in the
Atlantic Ocean and adjacent seas and oceans. Geological Society of AmericaBulletin 76, 803–832.
Bockheim, J.G., 1982. Properties of a chronosequence of ultra-xerous soils in the Trans-Antarctic mountains. Geoderma 28, 239–255.
Bookhagen, B., Burbank, D.W., 2006. Topography, relief, and TRMM-derived rainfallvariations along the Himalaya. Geophysical Research Letters 33 (L08405).doi:10.1029/2006GL026037.
Bookhagen, B., Fleitmann, D., Nishiizumi, K., Strecker, M.R., Thiede, R.C., 2006. Holocenemonsoonal dynamics and fluvial terrace formation in the northwest Himalaya,India. Geology (Boulder) 34, 601–604.
Boulay, S., Colin, C., Trentesaux, A., Clain, S., Liu, Z., Lauer-Leredde, C., 2007. Sedimenta-ry responses to the Pleistocene climatic variations recorded in the South China Sea.Quaternary Research 68, 162–172.
Campbell, I.B., Claridge, G., 1982. The influence of moisture on the development of soilsof the cold deserts of Antarctica. Geoderma 28, 221–228.
Chamley, H., 1989. Clay Sedimentology. Springer-Verlag, Berlin. 267 pp.Clift, P., Giosan, L., Blusztajn, J., et al., 2008.Holoceneerosion of the LesserHimalaya triggered
by intensified summer monsoon. Geology 36 (1), 79–82. doi:10.1130/G24315A.1.Clift, P.D., Giosan, L., Henstock, T., Tabrez, A.R., VanLaningham, S., Alizai, A., Limmer,D., Danish,
M., 2009. Sediment buffering and transport in the Holocene Indus River system.American Geophysical Union Eos Trans. AGU, Fall Meet. Suppl., Abstract, T35B-1950.
Clift, P.D., Carter, A., Giosan, L., Durcan, J., Tabrez, A.R., Alizai, A., VanLaningham, S.,Duller, G.A.T., Macklin, M.G., Fuller, D.Q., Danish, M., 2012. U-Pb zircon datingevidence for a Pleistocene Sarasvati River and Capture of the Yamuna River.Geology. doi:10.1130/G32840.1.
Colin, C., Siani, G., Sicre, M.-A., Liu, Z., 2010. Impact of the East Asian monsoon rainfallchanges on the erosion of the Mekong River basin over the past 25,000 yr. MarineGeology 271 (1–2), 84–92. doi:10.1016/j.margeo.2010.01.013.
Enzel, Y., Ely, L.L., Mishra, S., et al., 1999. High-resolution Holocene environmentalchanges in the Thar Desert, northwestern India. Science 284, 125–128.
Fagel, N., 2007. In: Hillaire-Marcel, C., Vernal, A.d. (Eds.), Marine clay minerals, deepcirculation and climate. : Paleoceanography of the Late Cenozoic, Volume 1.Methods, Elsevier, Amsterdam, pp. 139–184.
Fleitmann, D., Burns, S.J., Mudelsee, M., Neff, U., Kramers, J., Mangini, A., Matter, A.,2003. Holocene forcing of the Indian monsoon recorded in a stalagmite fromsouthern Oman. Science 300 (5626), 1737–1739.
Ghose, B., Kar, A., Husain, Z., 1979. The lost courses of the Saraswati River in the GreatIndian Desert; new evidence from Landsat imagery. The Geographical Journal 145(3), 446–451.
Giosan, L., Clift, P.D., Blusztajn, J., Tabrez, A., Constantinescu, S., Filip, F., 2006. On thecontrol of climate- and human-modulated fluvial sediment delivery on riverdelta development: the Indus. Eos, Transactions, American Geophysical Union 87(52) OS14A-04.
Griffin, J., Windom, H., Goldberg, E., 1968. The Distribution of Clay Minerals in theWorld Ocean. Elsevier, Amsterdam.
Gupta, A.K., Anderson, D.M., Overpeck, J.T., 2003. Abrupt changes in the Asiansouthwest monsoon during the Holocene and their links to the North AtlanticOcean. Nature 421, 354–356.
Hamann, Y., Ehrmann, W., Schmiedl, G., Kuhnt, T., 2009. Modern and late Quaternaryclay mineral distribution in the area of the SE Mediterranean Sea. QuaternaryResearch 71 (3), 453–464.
Hillier, S., 1995. Erosion, sedimentation, and sedimentary origin of clays. In: Velde, B.(Ed.), Clays and the environment. Springer Verlag, Berlin, pp. 162–219.
Hillier, S., 2003. Quantitative analysis of clay and other minerals in sandstones by X-raypowder diffraction (XRPD). In: Worden, R.H., Morad, S. (Eds.), Clay Mineral Cementsin Sandstones. Special Publication, International Association of Sedimentologists.
Jacobs, M., 1970. Clay mineral investigations of Cretaceous and Quaternary deep seasediments of the North American Basin. Journal of Sedimentary Research 40 (3),864–868.
Jeong, G.Y., Hillier, S., Kemp, R.A., 2011. Changes in mineralogy of loess–paleosolsections across the Chinese Loess Plateau. Quaternary Research 75 (1), 245–255.
Lamy, F., Hebbeln, D., Wefer, G., 1998. Late Quaternary precessional cycles ofterrigenous sediment input off the Norte Chico, Chile (27.5˚S) and palaeoclimaticimplications. Palaeogeography Palaeoclimatology Palaeoecology 141, 233–251.
Moore, D., Reynolds, R., 1989. X-ray Diffraction and the Identification and Analysis ofClay Minerals. Oxford University Press, Oxford. 332 pp.
Morgan, R., 1973. The influence of scale in climatic geomorphology: a case study ofdrainage density in West Malaysia. Geografiska Annaler. Series A. PhysicalGeography 55, 107–115.
Overpeck, J., Anderson, D., Trumbore, S., Prell, W., 1996. The southwest IndianMonsoon over the last 18000 years. Climate Dynamics 12, 213–225.
Pandarinath, K., 2009. Clay minerals in SW Indian continental shelf sediment cores asindicators of provenance and palaeomonsoonal conditions: a statistical approach.International Geology Review 51 (2), 145–165.
Prell, W.L., Curry, W.B., 1981. Faunal and isotopic indices of monsoonal upwelling:western Arabian Sea. Oceanologica Acta 4, 91–98.
Rao, D.R., Sharma, K.K., 1995. Petrological and geochemical constraints on the petro-genesis of the Jaspa granitic pluton, Lahual region, NW Himalaya. Journal of theGeological Society of India 45 (6), 629–642.
Rateev, M., Gorbunova, Z., 1969. The distribution of clay minerals in the oceans.Sedimentology 13 (1–2), 21–43.
Singer, A., 1984. The paleoclimatic interpretation of clay minerals in sediments—areview. Earth-Science Reviews 21, 251–293.
Srodon, J., Eberl, D., 1984. Illite. Reviews in Mineralogy and Geochemistry 13 (1),495–544.
Stern, L.A., Chamberlain, C.P., Reynolds, R.C., Johnson, G.D., 1997. Oxygen isotope evi-dence of climate change from pedogenic clay minerals in the Himalayan molasse.Geochimica et Cosmochimica Acta 61 (4), 731–744.
Stuiver, M., Grootes, P.M., 2000. GISP2 oxygen isotope ratios. Quaternary Research(New York) 53 (3), 277–284.
Thamban, M., Rao, V.P., 2005. Clay minerals as palaeomonsoon proxies: evaluation andrelevance to the late Quaternary record from SE Arabian Sea. In: Rajan, S., Pandey,P.C. (Eds.), Antarctic Geoscience: Ocean-atmosphere Interaction and Paleoclima-tology. National Centre for Antarctic & Ocean Research, Goa, India, pp. 198–215.
Thamban, M., Rao, V.P., Schneider, R.R., 2002. Reconstruction of late Quaternary mon-soon oscillations based on clay mineral proxies using sediment cores from thewestern margin of India. Marine Geology 186, 527–539.
Thiry, M., 2000. Palaeoclimatic interpretation of clay minerals in marine deposits; anoutlook from the continental origin. Earth-Science Reviews 49 (1–4), 201–221.
Törnqvist, T.E., Bick, S.J., Gonzalez, J.L., van der Borg, K., de Jong, A.F.M., 2004. Tracking thesea-level signature of the 8.2 ka cooling event: new constraints from the MississippiDelta. Geophysical Research Letters 31 (L23309). doi:10.1029/2004GL021429.
Valdiya, K.S., 2002. Saraswati: The River that Disappeared. 1st. University Press, India.Limited, Hyderabad, India, 116 pp.
Wan, S., Li, A., Clift, P.D., Stuut, J.-B.W., 2007. Development of the East Asian monsoon:mineralogical and sedimentologic records in the northern South China Sea since20 Ma. Palaeogeography, Palaeoclimatology, Palaeoecology 254 (3–4), 561–582.
Wilson, M.J., 1999. The origin and formation of clay minerals in soils: past, present andfuture perspectives. Clay Minerals 34 (1), 7–25.
Wünnemann, B., Demske, D., Tarasov, P., et al., 2010. Hydrological evolution during thelast 15 kyr in the Tso Kar lake basin (Ladakh, India), derived from geomorpholog-ical, sedimentological and palynological records. Quaternary Science Reviews 29,1138–1155.
Zimmermann, H.B., 1977. Clay–mineral stratigraphy and distribution in the SouthAtlantic ocean. Initial Reports of the Deep Sea Drilling Project 39, 395–405.