clay mineral identification using diffuse spectral

1
These XRD patterns from bulk samples clearly show the variability in the clay minerals, and all demonstrate that the samples used are fairly pure representatives of their species. The PC08 material shows numerous small clay peaks, but these are dwarfed by several large calcite peaks, the largest just before 30 degrees. Unlike the DSR method, this makes identification of the clay minerals within the marine sample difficult without additional sample processing. XRD DATA CLAY MINERAL IDENTIFICATION USING DIFFUSE SPECTRAL REFLECTANCE C.J. Stefano , J.D. Ortiz, E.H. Carlson, and L. Shiozawa, Kent State University, Department of Geology, Kent, OH, 44242 ABSTRACT Traditionally, the principle means of identifying clay minerals has been through X-ray diffraction (XRD). While effective, there are some disadvantages to using XRD for this application. XRD requires a good deal of sample preparation before measurements can be made. These sample preparation methods consume the sample in the process of doing the analysis. XRD instrumentation can also be expensive, a constraint which may place the technology out of the reach of some institutions. As an alternative, we have explored the use of Diffuse Spectral Reflectance (DSR), as a means of eliminating these disadvantages (Hunt, 1977). The method has been used extensively in satellite applications but less so in marine sedimentology (Balsam and Deaton, 1991; Ortiz et al., 1999; Vanden Berg and Jarrard, 2002). Clay minerals have distinct spectral features, which make them relatively easy to identify with this method. The method is fast, non-invasive, and less expensive. With proper calibration the method can provide quantitative estimates of clay mineral concentration, rather than simple presence-absence estimates. Using an Analytical Spectral Devices, LabSpec™ Pro FR we have developed a simple, and inexpensive means of constraining measurement geometry for use with its standard fiber optic probes. Our approach enables reproducibility of DSR measurements to better than 0.2% throughout much of the instrument’s measurement range which spans the UV/VIS/NIR from 350–2500 nm. Replicate measurements of known clay mineral samples and fine grain separates (<63mm) provide proof of concept. THE INSTRUMENT signal/noise ratio 0 5000 10000 15000 20000 25000 30000 35000 0 0.2 0.4 0.6 0.8 1 1.2 mm Analytic Spectral Devices LabSpec Pro FR UV/VIS/nIR spectrometer with 2 nm resolution, select-series detector Spectral range of 350-2500 nm. 400-2500nm is usable Uses a variety of fiber optic probes to allow easy changes to measurement geometry. We have attached a 3mm diameter probe to an existing microscope stand to enable accurate measurement of the distance between the custom designed probe tip and sample (~0.1mm). CALIBRATION AND ERROR REDUCTION Prior to each use, the instrument is calibrated using a Spectralon™ standard with known reflectance. All reflectance values are relative to this standard. Factors such as the distance between the probe tip and the sample, and the angle from which the measurement is taken can affect the quality of the data. We built a measurement jig to hold the probe tip normal to the sample, and a depth guide to maintain the probe at a constant height above the sample. We determined the optimal measurement height by taking replicate measurements of the standard at 0.1mm height intervals, and than dividing the peak visible photon counts by the standard deviation of the replicates. This creates a signal-to-noise ratio at 0.1 mm intervals above the sample. It was found that the ratio peaked at 0.5 mm. Using this setup can reduce measurement error from as much as 4% down to 0.2%. UV/VIS/nIR DATA The percent reflectance charts show the variability between the minerals being analyzed well enough to easily identify pure minerals with no more preparation than sieving and hand grinding the sample. The deep sea core data in which we are trying to identify minerals is a mixture and therefore presents slightly more challenging identification. Certain features due to the presence of one mineral may be masked by the presence of another. Interaction of this occurs between calcite, opal, kaolinite and smectite. Calcite shows a strong absorption feature just before 2400 nm, while the other three minerals all have increased reflectance at the same point, this results in a masking effect of the calcite feature when it is mixed with any or all of these minerals. Despite these difficulties, the presence/absence of clay minerals can be determined by correlation of reflectance spectra of known minerals with those of unknown samples (see table at right). The mineral standards were compared against reflectance data gathered from 77 fine grain separates (<63 mm) from deep sea core OXMZ01MV PC08, a 13.85 m long piston core taken off of Baja California (23°28’ N, 111°35.91 W). The core was raised from a water depth of 705 m. Legend applies to both plots CONCLUSIONS AND FUTURE DIRECTION DSR is a quick and efficient way to gather data on samples It is possible to make measurements with error as low 0.2% Clay minerals have distinct reflectance patterns that should make them identifiable with this method, although masking of some features can be a problem To extract quantitative information from DSR measurements, we are exploring the use of normative analysis of reflectance data (e.g. Vanden Berg and Jarrard, 2002) and principle component analysis of first derivative transformed data (e.g. Balsam and Deaton, 1991). Below is a correlation table for percent reflectance and first derivative values for the clay minerals and the median reflectance for the 77 samples from PC08. The bold face numbers are significant correlations. The significant correlations between the standards make it is difficult to tell the difference between these two minerals using this parameter. While this is a serious problem for the raw percent reflectance data, but there are fewer significant correlations between the standards when a first derivative transformation is used. Using first derivative transformed data, the correlation suggests the presence of illite, smectite, and opal, within these marine sediments. REFERENCES Balsam W.L. and Deaton B.C., 1991, Sediment dispersal in the Atlantic Ocean: Evaluation by visible light spectra, Reviews in Aquatic Sciences, 4, 411-447. Hunt, Graham R.,1977, Spectral Signatures of Particulate Minerals in the Visible and Near Infrared., Geophysics, Vol.42 No. 3 April p.501-513, (and references therein). Ortiz, J.D., Mix, A., Harris, S., and O’Connell, S. 1999. Diffuse spectral reflectance of as a proxy for percent carbonate in North Atlantic sediments, Paleoceanography, 14, 171- 186. Vanden Berg, M.D., and Jarrard, R.D., 2002. Determination of equatorial Pacific mineralogy. In Lyle, M., Wilson, P.A., Janecek, T.R., et al., Proc. ODP, Init. Repts., 199, 1-20 [CD-ROM]. Available from: Ocean Drilling Program, Texas A&M University, College Station TX 77845-9547, USA. Legend applies to both plots Linear Corelation Coefficient Between Reflectance of Standards and PC-08 Median Wavelength range 1000-2500nm @ 10nm resolution Chlorite Glauconite Illite Kaolinite Smectite Calcite Opal PC-08 Chlorite 1.00 Glauconite 0.78 1.00 Illite 0.86 0.52 1.00 Kaolinite -0.24 -0.72 0.08 1.00 Smectite -0.27 -0.70 0.11 0.91 1.00 Calcite 0.08 -0.46 0.20 0.73 0.67 1.00 Opal -0.32 -0.74 0.03 0.91 0.98 0.71 1.00 PC-08 0.74 0.31 0.94 0.24 0.33 0.39 0.26 1.00 Linear Corelation Coefficient Between First Derivatives of Standards and PC-08 median Wavelength range 1000-2500nm @ 10nm resolution Chlorite Glauconite Illite Kaolinite Smectite Calcite Opal PC-08 Chlorite 1.00 Glauconite 0.49 1.00 Illite 0.15 0.42 1.00 Kaolinite -0.04 0.22 0.51 1.00 Smectite -0.02 0.33 0.82 0.66 1.00 Calcite 0.60 0.23 0.15 0.04 -0.02 1.00 Opal 0.05 0.39 0.80 0.59 0.94 0.02 1.00 PC-08 0.27 0.55 0.78 0.43 0.71 0.22 0.77 1.00 Wavelength range 1000-2500nm @ 10nm resolution, thus n=150 Average lagged decorrelation scale is ~ 200nm Thus df* = (150-2)/20 = 7.4 5% r-crit 0.65 1% r-crit 0.78 Based on interpolation of Table A10 from "Statistical Methods", 8th ed. Glauconite Kaolinite Chlorite Smectite Illite PC08

Upload: others

Post on 15-Feb-2022

2 views

Category:

Documents


0 download

TRANSCRIPT

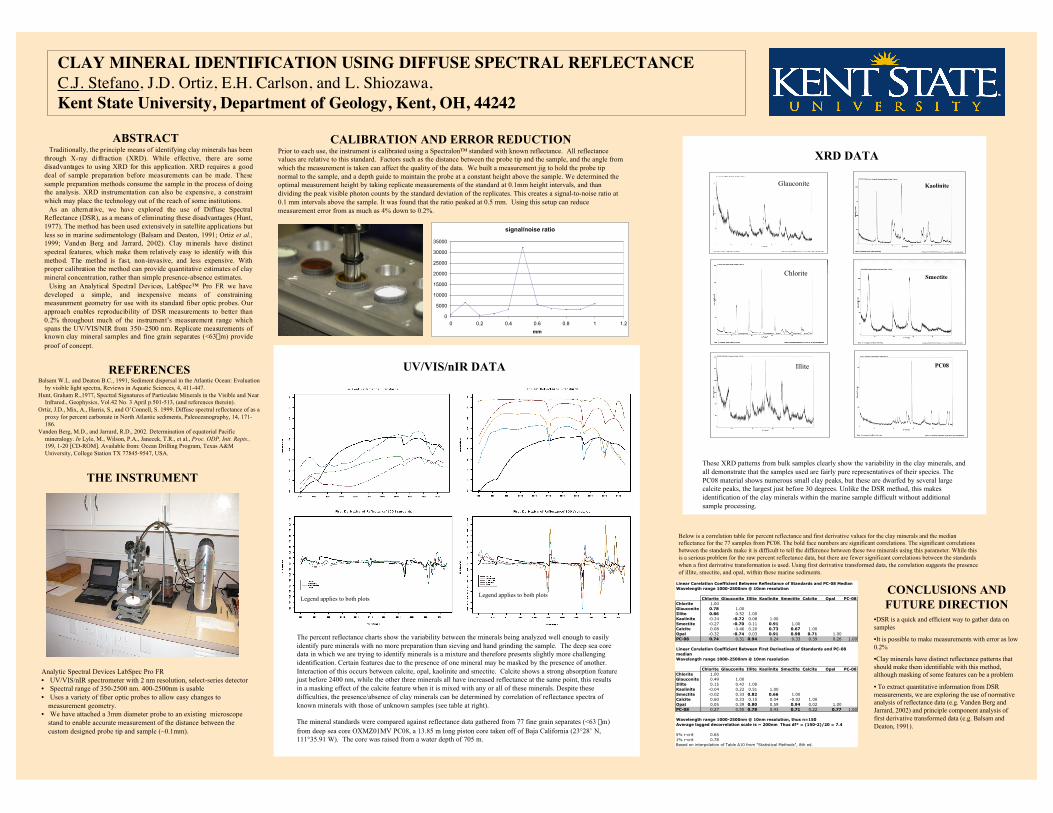
These XRD patterns from bulk samples clearly show the variability in the clay minerals, andall demonstrate that the samples used are fairly pure representatives of their species. ThePC08 material shows numerous small clay peaks, but these are dwarfed by several largecalcite peaks, the largest just before 30 degrees. Unlike the DSR method, this makesidentification of the clay minerals within the marine sample difficult without additionalsample processing.

XRD DATA

CLAY MINERAL IDENTIFICATION USING DIFFUSE SPECTRAL REFLECTANCEC.J. Stefano, J.D. Ortiz, E.H. Carlson, and L. Shiozawa,Kent State University, Department of Geology, Kent, OH, 44242

ABSTRACTTraditionally, the principle means of identifying clay minerals has been

through X-ray di ffraction (XRD). While effective, there are somedisadvantages to using XRD for this application. XRD requires a gooddeal of sample preparation before measurements can be made. Thesesample preparation methods consume the sample in the process of doingthe analysis. XRD instrumentation can also be expensive, a constraintwhich may place the technology out of the reach of some institutions.

As an alternat ive, we have explored the use of Diffuse SpectralReflectance (DSR), as a means of eliminating these disadvantages (Hunt,1977). The method has been used extensively in satellite applications butless so in marine sedimentology (Balsam and Deaton, 1991; Ortiz et al.,1999; Vanden Berg and Jarrard, 2002). Clay minerals have distinctspectral features, which make them relatively easy to identify with thismethod. The method is fast, non-invasive, and less expensive. Withproper calibration the method can provide quantitative estimates of claymineral concentration, rather than simple presence-absence estimates.

Using an Analytical Spectral Devices, LabSpec™ Pro FR we havedeveloped a simple, and inexpensive means of constrainingmeasurement geometry for use with its standard fiber optic probes. Ourapproach enables reproducibility of DSR measurements to better than0.2% throughout much of the instrument’s measurement range whichspans the UV/VIS/NIR from 350–2500 nm. Replicate measurements ofknown clay mineral samples and fine grain separates (<63mm) provideproof of concept.

THE INSTRUMENT

signal/noise ratio

0

5000

10000

15000

20000

25000

30000

35000

0 0.2 0.4 0.6 0.8 1 1.2

mm

Analytic Spectral Devices LabSpec Pro FR• UV/VIS/nIR spectrometer with 2 nm resolution, select-series detector• Spectral range of 350-2500 nm. 400-2500nm is usable• Uses a variety of fiber optic probes to allow easy changes to

measurement geometry.• We have attached a 3mm diameter probe to an existing microscope

stand to enable accurate measurement of the distance between thecustom designed probe tip and sample (~0.1mm).

CALIBRATION AND ERROR REDUCTIONPrior to each use, the instrument is calibrated using a Spectralon™ standard with known reflectance. All reflectancevalues are relative to this standard. Factors such as the distance between the probe tip and the sample, and the angle fromwhich the measurement is taken can affect the quality of the data. We built a measurement jig to hold the probe tipnormal to the sample, and a depth guide to maintain the probe at a constant height above the sample. We determined theoptimal measurement height by taking replicate measurements of the standard at 0.1mm height intervals, and thandividing the peak visible photon counts by the standard deviation of the replicates. This creates a signal-to-noise ratio at0.1 mm intervals above the sample. It was found that the ratio peaked at 0.5 mm. Using this setup can reducemeasurement error from as much as 4% down to 0.2%.

UV/VIS/nIR DATA

The percent reflectance charts show the variability between the minerals being analyzed well enough to easilyidentify pure minerals with no more preparation than sieving and hand grinding the sample. The deep sea coredata in which we are trying to identify minerals is a mixture and therefore presents slightly more challengingidentification. Certain features due to the presence of one mineral may be masked by the presence of another.Interaction of this occurs between calcite, opal, kaolinite and smectite. Calcite shows a strong absorption featurejust before 2400 nm, while the other three minerals all have increased reflectance at the same point, this resultsin a masking effect of the calcite feature when it is mixed with any or all of these minerals. Despite thesedifficulties, the presence/absence of clay minerals can be determined by correlation of reflectance spectra ofknown minerals with those of unknown samples (see table at right).

The mineral standards were compared against reflectance data gathered from 77 fine grain separates (<63 mm)from deep sea core OXMZ01MV PC08, a 13.85 m long piston core taken off of Baja California (23°28’ N,111°35.91 W). The core was raised from a water depth of 705 m.

Legend applies to both plots CONCLUSIONS ANDFUTURE DIRECTION

•DSR is a quick and efficient way to gather data onsamples

•It is possible to make measurements with error as low0.2%

•Clay minerals have distinct reflectance patterns thatshould make them identifiable with this method,although masking of some features can be a problem

• To extract quantitative information from DSRmeasurements, we are exploring the use of normativeanalysis of reflectance data (e.g. Vanden Berg andJarrard, 2002) and principle component analysis offirst derivative transformed data (e.g. Balsam andDeaton, 1991).

Below is a correlation table for percent reflectance and first derivative values for the clay minerals and the medianreflectance for the 77 samples from PC08. The bold face numbers are significant correlations. The significant correlationsbetween the standards make it is difficult to tell the difference between these two minerals using this parameter. While thisis a serious problem for the raw percent reflectance data, but there are fewer significant correlations between the standardswhen a first derivative transformation is used. Using first derivative transformed data, the correlation suggests the presenceof illite, smectite, and opal, within these marine sediments.

REFERENCESBalsam W.L. and Deaton B.C., 1991, Sediment dispersal in the Atlantic Ocean: Evaluation

by visible light spectra, Reviews in Aquatic Sciences, 4, 411-447.Hunt, Graham R.,1977, Spectral Signatures of Particulate Minerals in the Visible and Near

Infrared., Geophysics, Vol.42 No. 3 April p.501-513, (and references therein).Ortiz, J.D., Mix, A., Harris, S., and O’Connell, S. 1999. Diffuse spectral reflectance of as a

proxy for percent carbonate in North Atlantic sediments, Paleoceanography, 14, 171-186.

Vanden Berg, M.D., and Jarrard, R.D., 2002. Determination of equatorial Pacificmineralogy. In Lyle, M., Wilson, P.A., Janecek, T.R., et al., Proc. ODP, Init. Repts.,199, 1-20 [CD-ROM]. Available from: Ocean Drilling Program, Texas A&MUniversity, College Station TX 77845-9547, USA.

Legend applies to both plots

Linear Corelation Coefficient Between Reflectance of Standards and PC-08 MedianWavelength range 1000-2500nm @ 10nm resolution

Chlorite Glauconite Illite Kaolinite Smectite Calcite Opal PC-08Chlorite 1.00Glauconite 0.78 1.00Illite 0.86 0.52 1.00Kaolinite -0.24 -0.72 0.08 1.00Smectite -0.27 -0.70 0.11 0.91 1.00Calcite 0.08 -0.46 0.20 0.73 0.67 1.00Opal -0.32 -0.74 0.03 0.91 0.98 0.71 1.00PC-08 0.74 0.31 0.94 0.24 0.33 0.39 0.26 1.00

Linear Corelation Coefficient Between First Derivatives of Standards and PC-08 medianWavelength range 1000-2500nm @ 10nm resolution

Chlorite Glauconite Illite Kaolinite Smectite Calcite Opal PC-08Chlorite 1.00Glauconite 0.49 1.00Illite 0.15 0.42 1.00Kaolinite -0.04 0.22 0.51 1.00Smectite -0.02 0.33 0.82 0.66 1.00Calcite 0.60 0.23 0.15 0.04 -0.02 1.00Opal 0.05 0.39 0.80 0.59 0.94 0.02 1.00PC-08 0.27 0.55 0.78 0.43 0.71 0.22 0.77 1.00

Wavelength range 1000-2500nm @ 10nm resolution, thus n=150Average lagged decorrelation scale is ~ 200nm Thus df* = (150-2)/20 = 7.4

5% r-crit 0.651% r-crit 0.78Based on interpolation of Table A10 from "Statistical Methods", 8th ed.

Glauconite Kaolinite

ChloriteSmectite

Illite PC08