clay and shale - usgs
TRANSCRIPT

CLAY AND SHALE—2002 18.1
CLAY AND SHALEBy Robert L. Virta
Domestic survey data and tables were prepared by Maria Arguelles, statistical assistant, and the world production tables were prepared by Linder Roberts, international data coordinator.
Companies in the United States mined six types of clays: ball clay, bentonite, common clay and shale, fire clay, fuller’s earth, and kaolin. Ball clays consist primarily of kaolinite with minor to major amounts of illite, chlorite, smectite minerals, quartz, and organic materials. Bentonites comprise smectite minerals (usually montmorillonite) with minor amounts of feldspars, biotite, and quartz. Common clay and shale contain illite and chlorite as major components. Fire clay comprises mainly kaolinite, halloysite, and/or diaspore. Fuller’s earth consists primarily of attapulgite, calcium-rich montmorillonite with quartz. In many countries all calcium-rich montmorillonite clays including calcium-rich bentonite are called fuller’s earth and attapulgite is grouped under specialty clays. Kaolin comprises primarily kaolinite or kaolin-group minerals. Smectite minerals, mica, quartz, and rutile are a few other components of kaolin deposits. Mineral composition, plasticity, color, absorption qualities, firing characteristics, and clarification properties are a few of the characteristics used to distinguish between the different clay types.
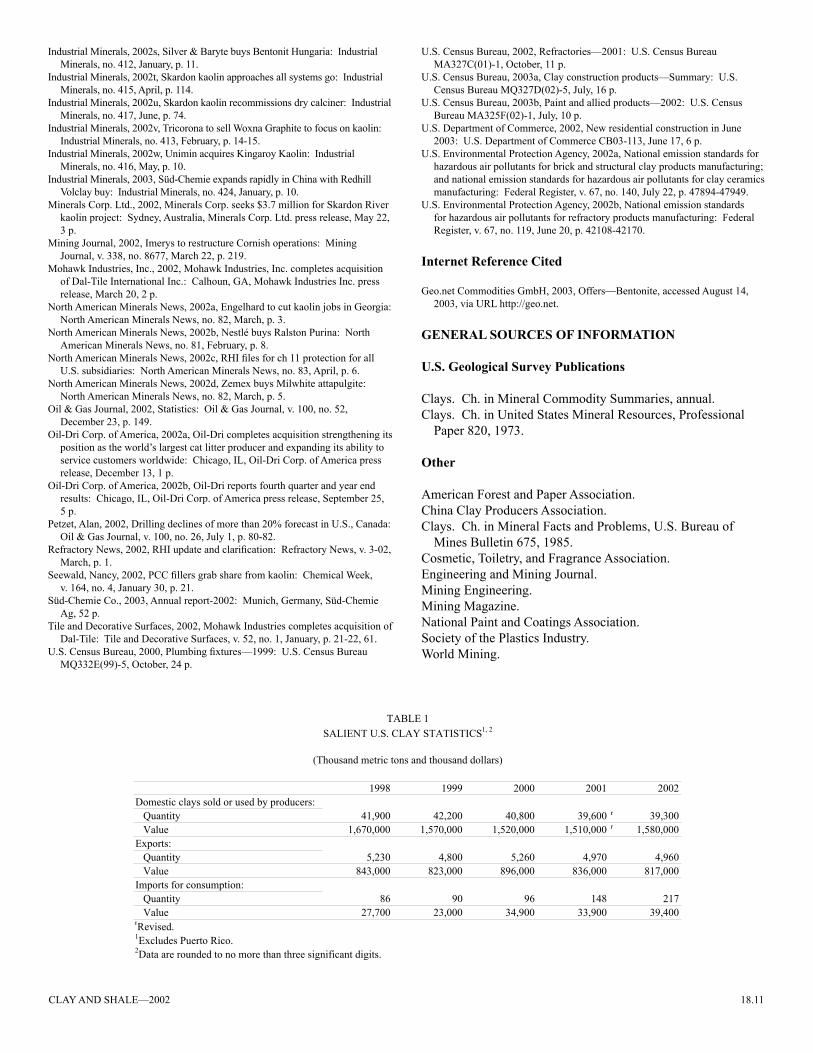
The amount of clay sold or used by domestic producers in 2002 was 39.3 million metric tons (Mt) valued at $1.58 billion, a decrease in tonnage but an increase in value from those of 2001. Production of ball clay and fire clay increased while production of bentonite, common clay and shale, fuller’s earth, and kaolin decreased. Of the clay and shale produced in 2002, common clay and shale accounted for 59% of the tonnage, and kaolin accounted for 60% of the value. Imports of clays increased to 217,000 metric tons (t) valued at $39.4 million. Exports decreased to 4.96 Mt valued at $817 million (table 1).
Major markets, including exports, for ball clay were floor and wall tile (38%), sanitary ware (32%), pottery and miscellaneous ceramics (17%); for bentonite, foundry sand bond (25%), absorbents (23%), drilling mud (21%), and iron ore pelletizing (15%); for common clay and shale, brick (56%), cement (17%), and lightweight aggregate (17%); for fire clay, refractory products (75%), for fuller’s earth, absorbents (74%); and for kaolin, paper coating and filling (64%).
The Industrial Minerals Association-North America was established as a complement to the Industrial Minerals Association-Europe. The organization will represent the interests of the North American industrial minerals producers. There currently are 38 member companies from a variety of mineral industries, including ball clay, feldspar, industrial sand, mica, soda ash, and talc producers (Industrial Minerals, 2002h).
Legislation and Government Programs
The U.S. Environmental Protection Agency (EPA) issued proposed emission standards as the agency continued developing its maximum achievable control technology
(MACT) regulation. The proposed standards would require the refractory industry to achieve a 99.8% combustion efficiency for hydrocarbons or alternatively limiting emissions of total hydrocarbons to 20 parts per million. The EPA also was studying emission of hydrocarbon, hydrogen fluoride, hydrogen chloride, and trace metal emissions from clay processors and manufacturers of lightweight aggregate, brick, and other ceramic products. Final specifications for the MACT regulation were under consideration at yearend 2002 (U.S. Environmental Protection Agency, 2002a, b).
Clay mining has an environmental impact because of the disturbance to the land through open pit or cut-and-fill mining methods. Overburden is moved, and clays are removed, leaving a depression or pit. State laws usually require leveling or contouring of the disturbed area and planting trees or grasses to prevent or minimize erosion. Ponds for recreational purposes often are created when ground water levels permit. For processing, the impoundment of slimes and dust control is required. The rules for disposal of coarse tailings are similar to or included within those laws governing reclamation of the mined area.
Production
In 2002, 237 companies operated approximately 760 clay and shale pits or quarries. The largest 20 companies, many with multiple operations, accounted for 50% of the tonnage and 79% of the value for all types of clay produced and sold or used. Clay production was reported in all States except Alaska, Delaware, Hawaii, Idaho, New Hampshire, Rhode Island, Vermont, and Wisconsin (table 2). For States not reporting production, clay probably was extracted for construction uses by companies not participating in the U.S. Geological Survey (USGS) canvass of the clay and shale industry.
The 10 leading producer States, in decreasing order of tonnage, were Georgia, Wyoming, Alabama, Texas, North Carolina, Missouri, South Carolina, Ohio, California, and Mississippi. The 10 leading producer companies, in alphabetical order, were American Colloid Co. (bentonite), Big River Industries, Inc. (common clay and shale), Engelhard Corp. (bentonite, fuller’s earth, and kaolin), General Shale Products Corp. (common clay and shale), Holnam, Inc. (common clay and shale), J.M. Huber Corp. (kaolin), Imerys (ball clay and kaolin), Oil-Dri Corp. (fuller’s earth), Solite Corp. (common clay and shale), and Thiele Kaolin Co. (kaolin).
Most clay mining in the United States was by open pit methods; less than 1% of U.S. clay output was from underground mines. All the underground production was in Ohio where the clays are mainly underclays associated with coal.

18.2 U.S. GEOLOGICAL SURVEY MINERALS YEARBOOK—2002
Domestic production data for clays were developed by the USGS from a voluntary survey of U.S. operations. Responses to the survey and company data available from other sources account for approximately 70% of the total clay and shale sold or used quantity shown in table 1. The bulk of the nonrespondents were producers of common clay and shale. Production data for the nonrespondents were estimated from reported prior year production levels adjusted by trends in the industry and other guidelines.
Ball Clay.—In 2002, 4 companies mined ball clay from 46 pits in 4 States. Production of domestic ball clay was estimated to be 1.12 Mt valued at $47 million, a slight increase from 1.11 Mt valued at $46.7 million in 2001 (table 3). Tennessee supplied 59% of the Nation’s output, followed by, in descending order of tonnage, Texas, Kentucky, and Mississippi. One producer reported a small amount of production in Indiana, but this was fire clay rather than ball clay. Water-slurried ball clay was produced in Kentucky and Tennessee. Airfloat and shredded (unprocessed) ball clay was produced in all four producer States.
Bentonite.—In 2002, 21 companies produced bentonite from approximately 93 pits in 12 States. The quantity of all varieties of bentonite sold or used, 3.97 Mt valued at $180 million, was essentially unchanged from that of 2001 and the value decreased by about 5% (table 5). Production of nonswelling bentonite decreased to 354,000 t valued at $14 million from 357,000 t valued at $13.7 million in 2001. Alabama led all States in the production of nonswelling bentonite, followed by, in descending order of tonnage, Mississippi, Georgia, Arizona, Nevada, California, Utah, and Colorado.
Production of swelling bentonite increased slightly to 3.62 Mt valued at $166 million from 3.61 Mt valued at $176 million in 2001. Wyoming still led all States in the production of swelling bentonite, followed by Montana, Utah, Texas, California, Oregon, and Nevada.
Süd-Chemie Inc. won its appeal of a judgment of $78 million against Southern Clay Products, Inc. for patent infringement. The U.S. District Court for the Southern District of Texas invalidated one of the patent infringement claims made by Southern Clay Products and remanded the other claim to a federal court for retrial (Chemical Week, 2002).
AMCOL International Corp. purchased FNG Industries Inc., New Haven, WV. FNG is a producer of ferrosilicon and carbon-silicon foundry brick and fluxes for iron foundries. The acquisition permitted AMCOL to expand its services to its foundry customers by providing products used for metal melting as well as for molding operations (Industrial Minerals, 2002d). Nanocor, Inc. (a subsidiary of AMCOL International Corp.) announced that it was expanding its research efforts with Gitto Global Corp., Lunenburg, MA, on flame-resistant polyolefin plastics using nanocomposites. Products developed thus far had greater strength, lower weight, and used less of the traditional flame retardant additives (AMCOL International Corp., 2002b).
Common Clay and Shale.—In 2002, 162 companies produced common clay and shale from approximately 450 pits in 41 States and Puerto Rico. For States not reporting production, common clay and shale probably was mined and sold for construction uses by companies not participating in the USGS canvass of the clay and shale industry. Most of the common clay and shale producers were manufacturers
of structural clay products, such as brick, cement, clay pipe, drain tile, lightweight aggregates, and sewer pipe. About 90% of production was used to manufacture brick, lightweight aggregate, and cement.
Domestic sales or use of common clay and shale decreased to 23.0 Mt valued at $148 million from 23.2 Mt valued at $129 million in 2001 (table 7). The major producing States, in descending order of tonnage, were North Carolina, Texas, Alabama, Georgia, Ohio, Missouri, Oklahoma, California, South Carolina, Kentucky, Arkansas, Virginia, and Pennsylvania.
Mohawk Industries, Inc. purchased Dal-Tile International Inc. for approximately $1.8 billion. The purchase made Mohawk Industries the largest floor covering manufacturer and distributor in the world. Dal-Tile had about $1 billion in annual sales of ceramic tile and stone (Mohawk Industries, Inc., 2002; Tile and Decorative Surfaces, 2002).
Gladding McBean (a division of Pacific Coast Building Products, Inc.) purchased Lincoln Clay Products Co. Lincoln Clay produced mortar, fire, and ceramic clays for domestic and Mexican markets. Gladding McBean produced clay for architectural terra cotta, clay roof tiles, sewer pipe, and pottery (Ceramic Bulletin, 2002a).
Fire Clay.—Fire clay producers were mostly refractory product manufacturers that used the clays in firebrick and other refractory products. In 2002, 7 firms in 4 States operated 44 pits. Fire clay sold or used by domestic producers increased to 446,000 t valued at $10.5 million from 383,000 t valued at $7.57 million in 2001 (table 9). Missouri was the leading producing State, followed by, in descending order of tonnage, South Carolina, Ohio, and California.
RHI Refractories America (a subsidiary of RHI AG) filed for bankruptcy protection following increasing asbestos-related liabilities. Included in the filing are its U.S. subsidiaries, Global Industrial Technologies, Inc.; Harbison-Walker Refractories Co.; and A.P. Green Industries, Inc. North American Refractories Co. Inc. (another RHI Refractories subsidiary) filed for bankruptcy protection earlier in the year due to asbestos-related liabilities (Industrial Minerals, 2002m; North American Minerals News, 2002c). RHI America will close some operations and restructure to improve efficiency. RHI AG will focus its efforts on its Veitsch-Radex America operation in Canada and RHI-Refmex SA operation in Mexico (Industrial Minerals, 2002p; Refractory News, 2002).
Fuller’s Earth.—In 2002, 16 companies produced fuller’s earth (attapulgite and montmorillonite varieties) from 31 pits in 10 States. Production of fuller’s earth decreased to 2.73 Mt valued at $246 million from 2.89 Mt valued at $267 million in 2001 (table 11). The fuller’s earth deposits grade from attapulgite-rich in Florida to montmorillonite-rich further northward into Georgia. Only those clays with attapulgite as the major clay component are classified as attapulgite. These basically are the gellant-grade fuller’s earths in Florida and the southernmost part of Georgia. Going northward into Georgia, the attapulgite content of the fuller’s earth declines, and montmorillonite becomes the dominant clay present. This is classified under montmorillonite although it contains minor to trace amounts of attapulgite.
The attapulgite variety of fuller’s earth was mined from eight pits in the Florida Panhandle and Southwestern Georgia.

CLAY AND SHALE—2002 18.3
Only Engelhard and Zemex Corp. mined attapulgite at yearend 2002 but an unspecified portion of the production was sold by ITC, Inc., making, in essence, three producers of attapulgite. Attapulgite production was reported by producers to have declined to 218,000 t valued at $26.8 million from 292,000 t valued at $35.8 million in 2001. Sales to oil and grease absorbent, adhesives, and paint markets showed moderate declines. The largest decrease in sales was in attapulgite exported for drilling mud applications and the processing of oils and greases. This decline in exports does not follow industry trends and it is believed that one company underreported exports by approximately 35,000 t; total sales in 2002 were probably closer to 255,000 t than the reported 218,000 t. Florida led in the production of attapulgite followed by Georgia. Production of the montmorillonite variety of fuller’s earth was 2.51 Mt valued at $219 million, a decrease from 2.60 Mt valued at $231 million in 2001. Montmorillonite was produced, in decreasing order of tonnage, in Georgia, Mississippi, Missouri, Virginia, California, Illinois, Florida, Tennessee, Kansas, and Texas.
Nestlé SA purchased Ralston Purina Co. for $10.3 billion. The purchase includes the pet litter products and pet food division. Ralston Purina had clay mining operations in California, Illinois, and Missouri. The purchase provided Nestlé with products that complement its current product line and provides additional access to pet care markets (North American Minerals News, 2002b).
Zemex purchased the attapulgite operations of Milwhite Inc. in Georgia for $12 million. Milwhite mined and processed attapulgite near Attapulgus, GA. The company produced about 50,000 tons per year (t/yr) of attapulgite for absorbent, coating, construction, oil well drilling applications and accounts for about 12% of the domestic supply. Zemex will spend $2.5 million to increase the efficiency of the facility, including $1.5 million for a new pneumatic conveyance system and bagging upgrades and $1 million for optimizing ore reserves (North American Minerals News, 2002d).
Oil-Dri completed its acquisition of specific assets from A&M Products Manufacturing Co. (a subsidiary of Clorox Co.). The purchase includes the inventories, mineral reserves of fuller’s earth, a manufacturing plant in Taft, CA, and rights to trademarks. The assets acquired include Jonny Cat litter, Jonny Cat liners, industrial absorbents, and agricultural carriers, producing annual revenues of about $18 million. The purchase expanded Oil-Dri’s distribution network for absorbents. Oil-Dri operates 12 domestic and international manufacturing facilities (Oil-Dri Corp. of America, 2002a).
Oil-Dri decided not to proceed with its plans to develop a fuller’s earth deposit and construct a mill facility in Hungary Valley, near Reno, NV, after the Washoe County Commission refused to issue a special use permit for the operation. Oil-Dri had received permits from the U.S. Department of the Interior’s Bureau of Land Management to develop a fuller’s earth deposit on Federal land. The company filed suit against the Commission to recoup damages (Oil-Dri Corp. of America, 2002b).
Kaolin.—In 2002, 24 firms mined kaolin from approximately 78 pits in 10 States. Domestic production decreased to 8.01 Mt valued at $951 million from 8.11 Mt valued at $875 million in 2001 (table 13). Nearly all of the increase in value was accounted for by a higher proportion of high-value low-
temperature calcined (pigment grade) kaolin being sold and 5% to 7% energy surcharges implemented by major producers in 2002. The leading producer State was Georgia, followed by, in descending order of tonnage, Alabama, South Carolina, California, Arkansas, Texas, North Carolina, Florida, Nevada, and Tennessee.
Of the 8.01 Mt mined, 4.26 Mt was water washed, 1.55 Mt was calcined, 1.07 Mt was delaminated, 943,000 t was airfloat, and 185,000 t was unprocessed (table 14). Of the calcined kaolin, 826,000 t valued at $264 million was pigment-grade (low-temperature calcined kaolin). The remainder was refractory-grade (high-temperature calcined kaolin) (table 15).
Kaolin production in Georgia decreased to 6.83 Mt valued at $893 million from 7.02 Mt valued at $818 million in 2001. Again, the increased value resulted from increased sales of high-value low-temperature calcined kaolin and energy surcharges placed on products in 2002. Approximately 4.22 Mt of Georgia kaolin production was sold as water washed, 1.07 Mt was delaminated, 888,000 t was calcined (high- and low-temperature calcined kaolin), 593,000 t was airfloat, and less than 59,000 t was unprocessed (table 16). Production in South Carolina was 374,000 t valued at $21.4 million compared with 377,000 t valued at $22.8 million in 2001. Approximately 307,000 t of production was airfloat kaolin with the remainder being calcined or unprocessed (table 18).
Alchemy Kaolin, Inc. (a subsidiary of Alchemy Ventures Ltd.) continued work on its deposit in Latah County, ID. Detailed mapping and sampling were completed, further defining the boundaries of the feldspar, kaolin, and quartz deposit. Preliminary work indicated that, at a minimum, feldspar could be economically recovered from the deposit. The company is continuing to characterize the kaolin that is present (Alchemy Ventures Ltd., 2002). Alchemy Ventures also has agreed with Idaho Industrial Minerals (IIM) to issue 1.75 million shares of stock to IIM in exchange for 100% interest in the lease applications for the Helmer Bovill property, subject to approval by the Toronto Stock Exchange (Industrial Minerals, 2002b).
J.M. Huber Corp. began working with Sparta Kaolin Corp. (a subsidiary of Kaoclay Resources Inc., Halifax, Nova Scotia) on a kaolin deposit near Sparta, GA, on the border of Georgia and South Carolina. Huber will make a market assessment of the kaolin from the deposit, conducting bench test and full-scale production runs. The agreement allows Sparta Kaolin to tap into Huber’s experience in the industry and is expected to give Huber first rights if the testing is successful. The deposit, 75% in Georgia and 25% in South Carolina, is expected to yield about 17.7 Mt of finished product (Industrial Minerals, 2002g).
Engelhard announced that it would consolidate some of its resources in its kaolin operations in Georgia and its petroleum refining catalyst facility in Savannah, GA. The shift of some resources from paper market applications to catalyst technologies was made to better leverage the assets of the company (Engelhard Corp., 2002a). The company announced that it would idle additional capacity and reduce staffing at its Gordon and McIntyre plants in Georgia by midyear. This action was partially in response to the continued downturn in the paper market (North American Minerals News, 2002a).
Atlas Mining Co. has contracted with Lintech International Inc., Macon, GA, to distribute halloysite mined from Atlas

18.4 U.S. GEOLOGICAL SURVEY MINERALS YEARBOOK—2002
Mining’s Dragon mine in Juab County, Utah. Atlas Mining will market only one product initially for porcelain, synthetic zeolite-based molecular sieve, catalyst support, and catalyst absorption, and filtration applications (Industrial Minerals, 2002l).
Imerys announced that it had further restructured its operations in Georgia. Production of kaolin for paper applications will be undertaken in its Sandersville, GA, operation. Kaolin for other applications will be the focus of Imerys’ Dry Branch plant (Mining Journal, 2002).
The Society for Mining, Metallurgy, and Exploration, Inc. held a conference on global kaolin resources, exploration, and development in Savannah, GA, in September. Reviews were presented on the world kaolin resources, the current state of the kaolin industries in various major source countries, a history of technological developments in the kaolin industry and their impact, trends in the paper industry with regard to kaolin consumption in Europe and the United States, potential for new deposits, and a general overview of consumption trends of mineral fillers that compete with kaolin. Worldwide sales of processed kaolin are approximately 25 Mt, with crude production of about 42 Mt. Approximately 42% of world sales were for paper applications in 2000. The United States is still the leading world source for paper-grade kaolin, but the share of the market held by Brazil has been increasing in recent years. Consumption of standard grades of kaolin has been decreasing in favor of specialty grades in North America. In the paper industry, the transition from acid to alkaline processing has enabled consumers to increase their use of calcium carbonate at the expense of kaolin. The impact was felt more strongly in the paper filler markets than in the coating markets. Kaolin producers have responded by manufacturing engineered kaolin products with unique size, shape, size distribution, and brightness characteristics and composite blends of kaolin and other mineral fillers. These actions have brought some of the emphasis back to print quality versus print brightness, which gave calcium carbonate an advantage. Standard ground wood grades of paper products were predicted to remain the mainstay of the kaolin industry although there was potential for growth in the short-term ground wood grades (Freas and others, 2002).
North American Refractories Co. Inc. closed its Indian Hills and Ione facilities in California. These facilities produced kaolin, refractory clay, and refractory products through its subsidiary, Ione Minerals & Refractories (Industrial Minerals, 2002k).
Consumption
Ball Clay.—The principal domestic ball clay markets, in decreasing order, were floor and wall tile, sanitaryware, and miscellaneous ceramics (table 4). Sales and use, including exports, increased to 1.12 Mt from 1.10 Mt in 2001. Exports declined but sales for miscellaneous ceramics increased. Sales to other end use categories were essentially unchanged. Sales and use of ball clay increased from 1990 to 1998 because increased commercial and residential building construction and home renovations resulted in greater demand for sanitaryware, tile, and whiteware. Although construction activity has continued at record levels since 1998, domestic sales of ball clay have leveled off. A contributing factor is competition from
imports of clay-based ceramic products such as sanitaryware and tile (see discussion under Ceramics) and the movement of whiteware manufacturing operations out of the United States.
Bentonite.—Domestic sales and use were estimated to be 3.56 Mt compared with 3.52 Mt in 2001 (table 6). Major domestic markets for bentonite were pet waste (899,000 t), drilling mud (762,000 t), foundry sand (762,000 t), and iron ore pelletizing (536,000 t). Total sales (domestic and exports) of bentonite were approximately 1.01 Mt for foundry sand bond (812,000 t was swelling bentonite), 903,000 t for pet waste absorbent (more than 99% was swelling bentonite), 821,000 t for drilling mud (essentially all swelling bentonite), 603,000 t for pelletizing iron ore (all swelling bentonite), and 243,000 t for waterproofing and sealing, water treatment and filtering, and miscellaneous civil engineering applications (more than 99% was swelling bentonite).
Data for other bentonite markets were concealed to avoid disclosing company proprietary data. However, more than 90% of the bentonite sold for absorbents, animal feed, civil engineering, drilling mud, ink, miscellaneous chemical manufacture applications, paint, pelletizing iron ore, pharmaceutical, plastics, waterproofing, and water treatment; and more than 70% of bentonite sold for foundry sand and miscellaneous filler and extender applications was swelling bentonite. More than 60% of the bentonite sold for clarifying, decolorizing, and filtering of oils and greases was the nonswelling variety. Mainly nonswelling bentonite was for desiccant and pesticides applications.
The major domestic markets for swelling bentonite, in decreasing order, were pet waste absorbents, drilling mud, foundry sand, iron ore pelletizing, and sealing and waterproofing. Major export markets for swelling bentonite, in decreasing order, were foundry sand, iron ore pelletizing, and drilling mud applications. The major domestic uses for nonswelling bentonite, in descending order of tonnage, were foundry sand bond; clarifying, decolorizing, and filtering of oils and greases; sealing and waterproofing; miscellaneous absorbents; pesticides; portland cement, animal feed, desiccants, and pet waste absorbent. Little nonswelling bentonite was exported.
Common Clay and Shale.—Common clay and shale was used most frequently in the manufacture of heavy clay products, such as building brick, drain tile, flue linings, lightweight aggregate, portland cement, sewer pipe, structural tile, and terra cotta (table 8). Consumption of common clay and shale decreased slightly to 23.0 Mt from 23.2 Mt in 2001. Brick manufacture remained the largest market for common clay and shale, followed by, in descending order of tonnage, lightweight aggregate and portland cement. Despite the slight decline, the strong housing and commercial building market has helped maintain sales of common clay and shale for brick and lightweight aggregate manufacture for the past several years. Privately owned housing starts, not seasonally adjusted, increased to 1.70 million units from 1.60 million units in 2001 (U.S. Department of Commerce, 2002).
Fire Clay.—Fire clays were used in grogs and calcines, high-alumina brick and specialties, ramming and gunning mixes, refractory products, such as firebrick and block, saggers, and refractory mortars and mixes. Fire clays also were used to produce such items as brick and pottery.

CLAY AND SHALE—2002 18.5
Consumption of fire clay increased to 446,000 t from 383,000 t in 2001 (table 10). Major markets for fire clay, in descending order of tonnage, were kiln furniture, refractory mortar and cement, miscellaneous refractory products, common brick, portland cement, grogs and calcines, firebrick, pottery, foundry sand, lightweight aggregate, terra cotta, and animal feed. Increased sales for refractory products along with a smaller increase in sales for brick manufacture under “Heavy clay products and lightweight aggregates” accounted for the bulk of the sales increase for fire clay.
Fuller’s Earth.—The major domestic uses for attapulgite and montmorillonite varieties of fuller’s earth, in descending order of tonnage, were pet waste absorbents; oil and grease absorbents; portland cement manufacture; fertilizer carriers; pesticides; animal feed; clarifying, decolorizing, and filtering of oils and greases; miscellaneous absorbents; miscellaneous heavy clay products; gypsum products; drilling mud; paint; desiccant; adhesives; and textiles (table 12). Consumption of fuller’s earth decreased to 2.73 Mt from 2.89 Mt in 2001.
Sales of montmorillonite decreased to 2.51 Mt from 2.60 Mt in 2001. Major domestic markets for montmorillonite, in descending order of tonnage, were pet waste absorbents, oil and grease absorbents, portland cement, fertilizer carrier, pesticide carrier, animal feed, clarifying, decolorizing, and filtering of oils and greases, miscellaneous heavy clay products, and miscellaneous absorbents. The largest export market was pet waste absorbent.
Sales of attapulgite reported by producers declined to 218,000 t from 292,000 t in 2001. The largest declines were in sales for pet waste absorbents, adhesives, paint, and exports for drilling mud and clarifying, decolorizing, and filtering of oils and greases. It is believed that one producer underreported exports by about 35,000 t, bringing U.S. sales to about 253,000 t rather than 218,000 t. Most of the sales data were concealed to avoid disclosing company proprietary data. Major markets for attapulgite, in decreasing order, were fertilizer carrier; oil and grease absorbents; pesticide carrier; gypsum products; drilling mud; paint; animal feed; miscellaneous filler and extender applications; miscellaneous absorbents; miscellaneous refractory; textile; miscellaneous clarifying, decolorizing, and filtering of oils and greases; ceramic floor tile; cosmetic, medical, pharmaceutical applications; asphalt tile; and adhesives.
Sales of the montmorillonite variety of fuller’s earth accounted for more than 80% of sales of fuller’s earth for adhesives; animal feed; portland cement manufacture; clarifying, decolorizing, filtering oils and greases; desiccant; oil and grease absorbents; pet waste absorbents; and exported products. Montmorillonite also accounted for more than 60% of sales for fertilizer carriers and pesticide carriers. Attapulgite accounted for all of the sales for asphalt tile; cosmetic, medical, pharmaceutical applications; drilling mud; gypsum products; paint; textiles; miscellaneous filler and extender applications; miscellaneous ceramic floor tile; and miscellaneous refractory products.
Kaolin.—Consumption of kaolin decreased to 8.01 Mt from 8.11 Mt in 2001. The major domestic markets for kaolin, in descending order of tonnage, were paper coating and filler, refractory products, paint, fiberglass, catalyst, and rubber
(table 20). The largest increase in domestic sales was for refractory applications and the largest decrease was for paper coating applications. Paper coating and filler markets have been affected in recent years by a stagnating paper market and competition from calcium carbonate. Major domestic markets for kaolin from Georgia, in descending order by tonnage, were paper coating, paper filling, fiberglass, paint, refractory products, and catalyst manufacture (table 17). Major domestic markets for kaolin from South Carolina, in descending order of tonnage, were rubber, roofing granules, catalyst, brick, fiberglass, and adhesives. The major export market for kaolin from South Carolina was rubber applications.
Absorbent Uses.—Sales reported by producers for absorbent uses were about 2.95 Mt, a decrease from 3.13 Mt in 2001. Fuller’s earth accounted for about 69% of the clay used for absorbents, followed by bentonite and kaolin. Pet waste absorbents accounted for 85% of absorbent consumption, followed by oil and grease absorbents and miscellaneous absorbent applications.
Ceramics.—All varieties of clays were used in ceramics. Demand for clay in the manufacture of ceramics, ranging from china to sanitaryware to roofing granules, was 2.16 Mt, an increase from 1.81 Mt in 2001. The largest ceramics market was ceramic floor and wall tile (43%), followed by sanitaryware (23%), catalyst (12%), roofing granules (9%), fine china (3%), pottery (3%), and quarry tile (3%). Ball clay accounted for 41% of the clay used in ceramics, followed by common clay and shale (35%) and kaolin (23%). Small amounts of bentonite, fire clay, and fuller’s earth also were used in the manufacture of ceramics. Ball clay dominated the crockery, electrical porcelain, glazing, and sanitaryware markets. Common clay and shale was the predominant clay used in quarry tile and roofing granules. Kaolin dominated the catalyst market. Ball clay and common clay and shale were the predominant clays used in floor and wall tile manufacture, and ball clay and kaolin dominated the fine china markets.
Apparent consumption of clay floor and wall tile in the United States was 245 million square meters valued at $2.37 billion compared with 211 million square meters valued at $2.11 billion in 2001. Domestic producers shipped 60.3 million square meters of clay floor and wall tile valued at $825 million compared with 54.9 million square meters valued at $776 million in 2001. Exports were 3.87 million square meters valued at $27.9 million compared with 3.09 million square meters valued at $26.5 million in 2001. Imports of clay floor and wall tile were 189 million square meters valued at $1.57 billion compared with 159 million square meters valued at $1.36 billion in 2001 (U.S. Census Bureau, 2003a).
The International Trade Administration reported that approximately 24.5 million square meters of glazed and unglazed ceramic tile with sides under 7 centimeters valued at $171 million was imported compared with 21.1 million square meters valued at $149 million in 2001.
Domestic tile consumption remained essentially unchanged for 2000 and 2001 despite the slow U.S. economy. The United States is the ninth largest producer of ceramic tile, the largest importer, and the fourth largest consumer. With imports accounting for much of the domestic growth in the tile market, some domestic producers have closed factories. Other

18.6 U.S. GEOLOGICAL SURVEY MINERALS YEARBOOK—2002
manufacturers, however, have opened new factories to improve overall company production efficiency. Large-form tile (30.5 centimeters (cm) by 30.5 cm) was the largest domestic market with the greatest growth being in low water-absorption floor tile such as glazed and unglazed porcelain tiles (Daniels, 2002a, b).
Continued record levels of new home construction have increased demand for sanitaryware in the United States in 2001 and early 2002. Spending for bathroom construction and remodeling has grown by double digits in Europe and the United States. In some cases, an increased sales value for individual products compensated for an overall decline in unit sales (Grahl, 2002a).
Government statistics on sales of vitreous sanitaryware including drinking fountains, flush tanks, lavatory bowls, urinals, wash sinks, and water closet bowls used in the United States were not available after 1999. In 1999, shipments from domestic producers were valued at $932 million, imports were valued at $102 million, exports were valued at $57.5 million, and apparent consumption was valued at $976 million (U.S. Census Bureau, 2000). Imports of sanitaryware continued to increase in 2002 with the U.S. Census Bureau reporting imports of 21.1 million units compared with 17.5 million units in 2001 and 16.2 million units in 2000.
Construction.—Common clays and shales were used to manufacture a wide variety of construction materials, including expanded aggregates, hydraulic cement, and structural clay products.
Expanded Clay and Shale.—Approximately 4.01 Mt of clay and shale was used in the production of lightweight aggregates, an increase from 3.87 Mt in 2001 (table 21). Nearly all the clay used to manufacture lightweight aggregates was common clay and shale. Lightweight aggregates were used in concrete block, structural concrete, and highway surfacing, in decreasing order of consumption.
Hydraulic Cement.—Clays provide the alumina and silica required to manufacture hydraulic cements. In 2002, approximately 4.28 Mt of clays was consumed, a decrease from 4.57 Mt in 2001. In descending order of tonnage, common clay and shale, fuller’s earth, kaolin, fire clay, bentonite, and ball clay were used in the manufacture of portland cement clinker. More than 92% of the clay consumed by the cement industry was common clay and shale.
Structural Clay Products.—Approximately 13.3 Mt of clays was used in the manufacture of structural clay products, such as building brick, roofing tile, and sewer pipe. Common and face brick accounted for about 97% of this total. Other markets, in descending order of tonnage, were flue linings, flower pots, sewer pipe, roofing tile, structural tile, drain tile, and terra cotta. About 98% of the clay used to manufacture structural clay products was common clay and shale. Small amounts of bentonite, fire clay, fuller’s earth, and kaolin also were used.
In 2002, domestic producers shipped 8.04 billion building and face bricks valued at $1.71 billion compared with 7.94 billion building and face bricks valued at $1.9 billion in 2001. Structural facing tile and ceramic glazed brick shipments were 19,200 units valued at $10.9 million compared with 25,800 units valued at $13.7 million in 2001. Shipments of structural clay tile were 49,600 units valued at $11.2 million compared with 49,500 units valued at $10.6 million in 2001. About 139,000
units of vitrified clay sewer pipe and fittings valued at $54 million were shipped compared with 165,000 units valued at $53.3 million in 2001 (U.S. Census Bureau, 2003a).
Brick markets remained strong in the United States and Canada in 2001 because of the strong housing market. Several major domestic producers of bricks reported unchanged or slightly lower shipments that were offset by increased unit values. International markets varied with housing markets declining in Germany and nearby countries and Australia while increasing in Slovakia. In North America, manufacturers believe that markets will increase modestly in the long term because population growth should bolster housing demand (Grahl, 2002b).
Drilling Mud.—Sales (domestic and exports) for drilling mud applications were 841,000 t (782,000 t sold domestically and 59,200 t exported). Swelling-type bentonite accounted for more than 95% of the clay used in drilling mud. Fuller’s earth and a small tonnage of kaolin also were used in drilling mud applications.
Drilling activity in North America continued at relatively low levels in 2002 with predictions for a 20% or greater decline. Drilling through April 2002 in other parts of the world was essentially unchanged from 2001. The rig count through May 2002 was 673 for land-based rigs compared with 985 in 2001. For Canada, the count through May 2002 was 273 for all rigs compared with 397 for all rigs through May 2001 (Petzet, 2002). The number of rotary rigs operating as of December 23, 2002, was 829 in Canada and the United States compared with 1,167 in 2001 (Oil & Gas Journal, 2002).
Fillers, Extenders, and Binders.—Clays are used as fillers, extenders, and binders in a wide variety of products, such as adhesives, flooring products, paint, paper, and rubber. About 4.21 Mt of clays was sold for use as fillers, extenders, and binders in the United States compared with 4.34 Mt in 2001. The decline was distributed throughout several end use categories so there were no significant losses in any one particular category. An additional 2.29 Mt of clays was exported for filler and extender applications compared with 2.35 Mt in 2001. Paper coating and filling accounted for 71% of domestic sales, followed by paint (8%), rubber (4%), fertilizer carrier (3%), pesticide carrier (3%), and animal feed (3%). Adhesive, asphalt emulsion, asphalt tile, gypsum products, ink, cosmetic, medical, and pharmaceutical, plastic, textile, and wallboard applications each accounted for less than 2% of the fillers and extenders markets.
Kaolin accounted for approximately 88% of the clay used in filler and extender applications, followed by fuller’s earth (9%), bentonite (2%), ball clay, common clay and shale, and fire clay (less than 1% each). Bentonite was the predominant clay used for ink, and cosmetic, medical, and pharmaceutical applications; Fuller’s earth dominated in animal feed, fertilizer and pesticide applications, and pet waste absorbents. Kaolin was the predominant clay used for adhesives, gypsum products, paint, paper, plastics, rubber, and textile markets.
Markets for mineral fillers in plastics continue to increase. In 2001, world consumption of fillers in plastics was 11 Mt. Calcium carbonate accounted for 66% of this total. The next most widely used mineral fillers were kaolin and talc (6% each), wollastonite (3%), and mica (1%). Unspecified mineral

CLAY AND SHALE—2002 18.7
fillers accounted for 18% of world consumption (Hohenberger, Holzinger, and Bernhart, 2002).
The U.S. Census Bureau reported shipment of paint and coatings for 2002 to be 1.46 billion gallons (5.53 billion liters) valued at $17.2 billion compared with 1.39 billion gallons (5.26 billion liters) valued at $17.3 billion in 2001. Of this amount, architectural paints, the major market for paint-grade fillers, was 719 million gallons (2.72 billion liters) valued at $7.12 billion compared with 667 million gallons (2.52 billion liters) valued at $7.04 billion in 2001 (U.S. Census Bureau, 2003b).
Fiberglass.—Sales, including exports, to the fiberglass and mineral wool industry were 409,000 t, an 8% increase from that of 2001.
While industry statistics are not available on fiberglass production, industrial sand used for the production of fiberglass was 1.43 Mt compared to 1.15 Mt t in 2001, 953,000 t in 2000, and 1.00 Mt in 1999 (Dolley, 2004).
Iron Ore Pelletizing.—Sales (domestic and exports) reported by producers were 603,000 t compared with 570,000 t in 2001. Swelling bentonite was the only type of clay used for this application.
Paper Products.—Sales of kaolin for paper applications increased slightly for the first time in several years. The industry had lost sales to ground and precipitated calcium carbonate for paper applications. Kaolin accounted for almost all the clay sales used for paper coating (2.54 Mt sold domestically and 2.04 Mt exported) and essentially all the clay used for paper filling (450,000 t sold domestically and 93,900 t exported). A small amount of bentonite also was sold for paper applications.
Slow economic growth in North America with its reduced paper demand and competition from calcium carbonate for paper applications has affected sales of kaolin for paper applications for the past several years. Reduced paper demand, however, also affected calcium carbonate sales for paper applications in 2001. Producers of kaolin and precipitated calcium carbonate were researching ways for their products to satisfy the trend by the paper industry to produce whiter, more opaque, and lighter paper products. Major kaolin producers indicated that they would like 25% to 30% of their sales to paper applications from products developed within the past 5 years. The trend toward multipigment combinations to enhance performance and a tendency for paper manufacturers to look to single source suppliers has already resulted in alliances among suppliers or product diversification by former single commodity producers. Estimated world consumption for paper fillers was 1.3 Mt for ground calcium carbonate, 2.1 Mt for precipitated calcium carbonate, 3.1 Mt for kaolin, 136,000 t for talc, and 204 t for titanium dioxide in 2001 (Harris, 2002; Seewald, 2002).
Refractory Products.—Producers reported that 2.09 Mt of clays was used for the domestic manufacture of refractory products in 2002 (2.86 Mt with foundry sand included) compared with an estimated 1.72 Mt in 2001 (2.47 Mt with foundry sand included). Domestic and export sales were 2.33 Mt. At about 769,000 t, foundry sand was the largest domestic market. Other markets were firebrick, refractory mortar and cement, grogs and calcines, high alumina brick and kiln furniture, and plug, tap and wad.
Bentonite accounted for 1.01 Mt of refractory sales (753,000 t domestic and 244,000 t exported), followed by kaolin (904,000
t domestic and exports), common clay and shale (795,000 t domestic with no exports), fire clay (333,000 t domestic with no exports), ball clay, and fuller’s earth. Data on U.S. refractory production and shipments were not available for 2002. The U.S. Census Bureau reported shipments of clay refractory products to be $757 million in 2001 compared with $878 million in 2000. In 2001, 715,000 t (238 million bricks) valued at $396 million of clay refractory brick and shapes were shipped by U.S. manufacturers. This is subdivided into fire clay brick and shapes, 362,000 t (107 million bricks) valued at $137 million; high alumina brick and shapes, 324,000 t (107 million bricks) valued at $219 million; and insulating brick and shapes, 29,000 t (23.8 million bricks) valued at $40.3 million. Shipments of unshaped clay refractory products were 581,000 t valued at $297 million. This is subdivided into refractory bonding mortar valued at $44.5 million (tonnage concealed); plastic refractory products, 115,000 t valued at $62.7 million; castable refractory products, 275,000 t valued at $159 million; and fire gunning mixes, 96,800 t valued at $30.6 million. Approximately 163,000 t of miscellaneous refractory products valued at $44 million and $19.5 million of other unknown types of clay refractory products also were sold in 2001 (U.S. Census Bureau, 2002).
Prices
Many of the clay producers instituted price increases of 3% to 8% for the past 2 to 3 years because of increased energy costs, particularly for natural gas users, and increased costs of production. Imerys announced that it would raise the price of all grades of paper-grade kaolin and calcium carbonate products by 2% to 7% (Imerys, 2002).
Ball Clay.—The average value for ball clay reported by domestic producers was $41.96 per metric ton. The average values for imported and exported ball clay were $348.89 and $55.51 per ton, respectively.
Average prices for ball clay, United Kingdom, free on board (f.o.b.), air-dried, shredded, bulk, were $40 per ton to $105 per ton; refined, noodled, bulk, $88 per ton to $112 per ton; pulverized, bagged, $129 per ton to $209 per ton. Average prices for ball clay, Germany, f.o.b., dried and ground, bulk, were $52 per ton to $141 per ton; and shredded, bulk, $15 per ton to $61 per ton (Industrial Minerals, 2002n).
Bentonite.—The average value reported by domestic producers for nonswelling bentonite was $39.55 per ton. The average value for swelling bentonite was $45.85 per ton. The average value for all bentonite was $45.34 per ton. The average value of imported bentonite was $115.12 per ton. The average value of exported bentonite was $121.33 per ton.
The price, ex-works, Wyoming, crude, bulk, rail cars, was $26 per ton to $63 per ton; foundry grade, bagged, rail cars, $50 per ton to $76 per ton; API-grade, bagged, rail cars, $43 per ton to $53 per ton. The price for bentonite, India, crushed, dried, loose in bulk, was $30 per ton to $40 per ton for API grade; $32 per ton to $40 per ton for cat litter grade; and $40 to $45 per ton for foundry grade (Industrial Minerals, 2002o).
Common Clay and Shale.—The average value for all common clay and shale produced in the United States and Puerto Rico was $6.43 per ton. The average value of clay and shale used in lightweight aggregate was $13.69 per ton.

18.8 U.S. GEOLOGICAL SURVEY MINERALS YEARBOOK—2002
The value for lightweight aggregate is an estimate of the clay value. Average prices for lightweight aggregate produced from clay and shale range from $30 per ton to $50 per ton for most applications.
Fire Clay.—The average value for fire clay reported by domestic producers was $23.54 per ton. The average of imported fire clay was $532.11 per ton. The average value of exported fire clay was $90.84 per ton.
Fuller’s Earth.—The average value of attapulgite-type fuller’s earth was $122.94 per ton. The average value of montmorillonite-type fuller’s earth was $87.25 per ton. The average value of all fuller’s earth was estimated to be $90.11 per ton. The average value of imported fuller’s earth was $234.15 per ton. The average value of exported fuller’s earth was $144.50 per ton.
The price, ex-plant, Georgia, 40% to 100% less than 325 mesh, truck load, was $220 per ton to $551 per ton; granular processed, 40% to 100% less than 4/8 mesh, truck load, $193 per ton to $551 per ton; granular, 6/30 mesh, truck load, $132 per ton to $220 per ton; and granular, 6/30 mesh, gel grade, bagged, $358 per ton to $772 per ton (Industrial Minerals, 2002n).
The price of filler-grade attapulgite from Asia ranged from $158 per ton to $315 per ton (Geo.net Commodities GmbH, 2003§1).
Kaolin.—The average value of kaolin was $118.73 per ton for all kaolin grades. The average value for airfloat was $55.64 per ton; refractory-grade (high-temperature calcined), $28.57 per ton; pigment-grade (low-temperature calcined), $319.61 per ton; all types of calcined, $183.22 per ton; delaminated, $115.89 per ton; water washed, $114.79 per ton; and unprocessed, $9.57 per ton. The average value of the imported kaolin was $141.77 per ton. The average value of exported kaolin was $160.00 per ton.
The price, ex-works, Georgia, filler, bulk, was $80 per ton to $100 per ton; coating, bulk, $85 per ton to $185 per ton; sanitaryware-grade, bagged, $65 per ton to $75 per ton; tableware-grade, bagged, $125 per ton; and calcined, bulk, $320 per ton to $375 per ton (Industrial Minerals, 2002o).
Foreign Trade
Ball Clay.—Ball clay exports decreased to 127,000 t valued at $7.05 million, according to the U.S. Census Bureau (table 23). Domestic ball clay producers reported that 146,000 t of ball clay was exported in 2002 (table 4). Imports were 407 t of ball clay valued at $142,000 (table 24).
Bentonite.—Bentonite exports increased to 722,000 t valued at $87.6 million (table 23). Domestic bentonite producers reported exports of 408,000 t (table 6). The large discrepancy between producers and the U.S. Census Bureau may result from producers including most of the exports destined for Canadian markets (219,000 t) under domestic sales. Sales through U.S. mineral brokers, where producers do not know if the bentonite is used domestically or exported, could also explain part of the discrepancy.
Bentonite imports consisted mainly of untreated bentonite clay and chemically or artificially activated materials. Imports
of untreated bentonite were 29,100 t valued at $3.35 million. Imports of chemically activated material were 26,800 t valued at $11.3 million (table 24).
Fire Clay.—Approximately 251,000 t of fire clay valued at $22.8 million was exported (table 23). In 2002, 218 t of fire clay valued at $116,000 was imported (table 24).
Fuller’s Earth.—Approximately 60,000 t of fuller’s earth valued at $8.67 million was exported (table 23). Approximately 205 t of decolorizing earth and fuller’s earth valued at $48,000 was imported in 2002 (table 24).
Kaolin.—The U.S. Census Bureau reported that 3.35 Mt valued at $536 million was exported compared with 3.44 Mt of kaolin valued at $567 million in 2001 (table 23). Producers reported exports of 2.49 Mt (table 20). Much of the 783,000 t of kaolin destined for Canada, particularly for its paper markets, probably was reported under domestic consumption.
Kaolin imports increased to 158,000 t valued at $22.4 million compared with 114,000 t valued at $18.7 million in 2001 (table 24). Approximately 90% was imported from Brazil, followed by the United Kingdom with 9%.
World Review
World production of bentonite was approximately 10.3 Mt, fuller’s earth production was estimated to be 3.89 Mt, and kaolin production was 43.2 Mt (tables 25-27). The world production data for kaolin also contain common clay for Colombia, ball clay for Australia, and crude kaolin ore for many other countries. Sales of processed kaolin were estimated to be about 25.9 Mt, after excluding 8.4 Mt for Colombia, 4 Mt for the Czech Republic, 4 Mt for Uzbekistan, 600,000 t for Iran, 200,000 t for Egypt, and 100,000 t for Australia. The United States continued to be the leading producer of all three varieties of clays, followed by Greece and countries of the Commonwealth of Independent States for bentonite; Germany for fuller’s earth; and the Republic of Korea (likely crude ore tonnage), the United Kingdom (processed sales), Brazil (processed sales), Germany (processed ore), Uzbekistan (processed ore), and the Czech Republic (processed ore). Spain led all countries in the production of sepiolite.
Australia.—Minerals Corp. announced that it had almost completed renovations at the Skardon River kaolin project. Equipment was overhauled in 2001 and the wet plant, dry plant circuit, spray drier, and bagging lines were commissioned in 2002. The company produced some ceramic-grade hydrous kaolin products and had plans to produce hydrous kaolin products for other markets later in the year. Initial plans were to produce 25,000 t/yr for nonpaper Asian markets (Industrial Minerals, 2002t). The company also completed renovations of its calciner circuit, producing a product with a brightness of 90 on the initial run. Several calcined paint-grade products and metakaolin for cement applications were produced (Industrial Minerals, 2002u; Minerals Corp. Ltd., 2002).
Unimin Australia Ltd. (a subsidiary of Unimin Corp.) acquired Kingaroy Kaolin Pty. Ltd. Kingaroy Kaolin is the largest of Queensland’s kaolin producers. The purchase included the plant and mineral leases. Kingaroy Kaolin sold kaolin for adhesive, ceramic, fiberglass, insecticide, paint, paper, and rubber applications (Industrial Minerals, 2002w).
1A reference that include a section mark (§) is found in the Internet Reference Cited section.
CLAY AND SHALE—2002 18.9
Belgium.—Engelhard Corp. opened a slurry facility in Ghent. The facility will process kaolin for paper markets in northern Europe. The facility has two 5.2 cubic meter slurry mixers, four 100 cubic meter holding tanks, and four 60 cubic meter holding tanks. The facility can store up to 36,000 t of dry kaolin and ship by barge, rail, or truck (Engelhard Corp., 2002c).
Brazil.—WBB Minerals (a subsidiary of Watts Blake Bearne & Co. PLC) acquired a 51% share of Caulim do Nordeste. Nordeste has its operations near Recife in Northeastern Brazil and supplies refined clay and ceramic body products to the Brazilian sanitaryware industry. The purchase will provide WBB with an opportunity to become a major supplier of specialty ceramic raw materials to Brazilian markets (Ceramic Bulletin, 2002b).
Rio Capim Caulim (a subsidiary of Imerys) commissioned a 160-kilometer pipeline used to transport kaolin from its quarry to its plant. The company also continued expanding its production capacity to 850,000 t/yr from 600,000 t/yr (Imerys, 2003).
Canada.—RHI AG announced that it would modernize its RHI Canada operations in Becancour, Quebec, and Burlington, Ontario. The modernization, to occur during an 18-month period, would involve downsizing the workforce and upgrading machinery such as crushers. The operations manufacture basic refractory brick for the steel, nonferrous metals, and cement industries (Industrial Minerals, 2002q).
Black Bull Resources Inc. withdrew its application to mine a deposit near Yarmouth County, Nova Scotia, for its kaolin, mica, and quartz content. The decision was made after the Minister of Environment and Labour in Nova Scotia requested an environmental assessment report and the company did not have all of the required data available at the time of the request. The company was considering submitting a proposal to mine quartz present in the deposit (Black Bull Resources Inc., 2002).
China.—Engelhard Corp. acquired certain operating aspects of Shuozhou Anpeak Kaolin Co., Ltd., a producer of calcined kaolin products. Shuozhou Anpeak Kaolin had operations in Pinglu District, Shuozhou City, Shanxi Province and processed kaolin for coatings, paints, paper, plastics, and rubber applications. The purchase provided Engelhard with more direct access to a growing Asian market (Engelhard Corp., 2002b).
The Absorbents Division of Süd-Chemie Ag acquired 100% ownership of Liaoning Redhill Volclay Co. Ltd., which was a joint venture between Volclay International and Beijing Prosperity Clay & Construction Materials Co. Ltd. Liaoning Redhill was China’s largest producer of bentonite for foundry applications, operating a surface and underground mine with a capacity of 120,000 t/yr for foundry and engineering applications. About 50,000 t/yr is sold as sodium exchanged bentonite and 70,000 t/yr is sold as calcium bentonite. Süd-Chemie also planned to market the bentonite to China’s growing construction and paper markets. The company will operate as Süd-Chemie Redhill Bentonite Co. Ltd. (Industrial Minerals, 2003; Süd-Chemie Co., 2003).
Nanocor, Inc. (a subsidiary of AMCOL International Corp.) announced that Beijing Nano Sunshine Technology Co., Ltd. would sell and distribute Nanocor products to automotive and food packaging (plastics) markets. The company will focus on the use of nanoclays in nylon and polyolefin plastics (AMCOL International Corp., 2002a).
Hungary.—Silver & Baryte Ores Mining Co. SA acquired 100% of the shares of Bentonit Hungaria Kft (BEH) (a subsidiary of Dyckerhoff Wopfinger Umweltstoffe GmbH). BEH mines and sells bentonite from its operation in Egyhazaskeszo in western Hungary. Sales are primarily for civil engineering applications. The mill facilities have a capacity of 40,000 t/yr. The purchase provides Silver & Baryte Ores Mining with better access to the eastern European markets (Industrial Minerals, 2002s).
Namibia.—Afhold Ltd. announced plans to begin production of sepiolite from a deposit south of Gobabis. The company plans to market the sepiolite to the European cat litter industry. Export sales were expected to account for about 95% of sales. The open pit mine will have an initial capacity of 40,000 t/yr with three grades being produced (Industrial Minerals, 2002a).
Russia.—Joint Stock Company (JSC) Gai GOK began preparing feasibility reports on a bentonite deposit in the Kuvandyk District, Orenburg oblast. The deposit had estimated reserves of 27 Mt, averaging 50% to 60% montmorillonite at a depth of 10 meters. Kachkanar GOK Vanadii will use the bentonite primarily for pelletizing iron ore (Industrial Minerals, 2002f).
Sweden.—Tricorona Mineral AB announced that it would sell its graphite operations and focus strictly on kaolin through its subsidiary, Svenska Kaolin AB. Svenska holds reserves in Billinge and feasibility studies indicated the kaolin could be produced at a rate of 40,000 t/yr, along with 15,000 t/yr feldspar and 10,000 t/yr quartz. The kaolin will be marketed to the Scandinavian paper industry (Industrial Minerals, 2002v).
Thailand.—Imerys acquired a majority share of MRD-ECC Co. Ltd. from Banpu PLC, a Thailand energy producer. MRD-ECC mines a kaolin deposit in Ranong province. The kaolin is used for fiberglass, sanitaryware, tableware, and tile applications. MRD-ECC also processed ball clay that was a byproduct of Banpu’s coal extraction. The purchase enhanced Imerys’ access to the growing ceramics market in southeast Asia (Ceramic Industry Cybernews, 2002; Industrial Minerals, 2002i).
Ukraine.—A 25% share stake in JSC Dashukovsky Bentonites was offered by sale by the Fund of State Property of Ukraine. Dashukovsky Bentonites’ facility had a capacity of 220,000 t/yr of crude and 180,000 t/yr of processed bentonite. The conditions of the purchase were that the buyer would have to upgrade the facilities and maintain existing production (Industrial Minerals, 2002r).
Engelhard Corp. divested itself of its 50% share of Dnipro Kaolin due to losses generated through the joint venture (Engelhard Corp., 2003).
United Kingdom.—Imerys announced that it would transfer a portion of paper-grade kaolin production from its Cornwall facility to its Brazilian facilities. The Brazilian operations include Rio Capim Caulim and ECC do Brazil Mineracao Ltda. Imerys cited increased expenses of production of paper-grade products from the Cornwall operations. The move will shift 150,000 t of production, or 10% of the Cornwall production, to Brazil. Imerys’ kaolin reserves in Brazil are more suited for the production of paper-grade products than that mined in Cornwall (Industrial Minerals, 2002j).
Minsol Ltd. purchased the foundry business and some refractory assets from Volclay Ltd., a subsidiary of AMCOL

18.10 U.S. GEOLOGICAL SURVEY MINERALS YEARBOOK—2002
International. The purchase included the manufacturing facilities in Wallasey, Merseyside, and license to some existing trademarks. The plant obtained its bentonite from non-AMCOL sources in Europe and had a capacity of 80,000 t/yr. Some bentonite will be obtained from Cetco Europe Ltd., an AMCOL International subsidiary that operates in Merseyside. Minsol will continue selling the bentonite for greensand molding sands. AMCOL cited inadequate returns as part of the reason for the divestiture (Industrial Minerals, 2002c).
Uzbekistan.—JSC Bentonit, a joint venture to produce bentonite in Uzbekistan, announced plans to commission its facilities in 2002. The facilities are in the Novbakhor District of Navoi Oblast. Bentonite will be produced from the Karatau deposit, estimated to have 160 years of reserves. The plant has a capacity of 40,000 t/yr. The bentonite will be used primarily as a soil amendment in agriculture and for water treatment (Industrial Minerals, 2002e).
Outlook
Although the economy remains sluggish, it has shown signs of recovery in the past year, brightening the prospects for several segments of the clay industry. Construction-oriented markets for clay-based products such as adhesives, brick, ceramics, fiber glass, lightweight aggregate, paint, and other construction-oriented markets remain fairly strong. Domestic sales to these markets probably will maintain their current levels for the near future. One stumbling block could be the continued increase in the use of imported clay-based products such as tile and whiteware. These imports already have affected domestic ball clay sales and probably will continue to do so in the near future. If the economic recovery continues and industrial manufacturing begins to increase, that bodes well for clays sold for foundry sand bond (bentonite), pelletizing iron ore (bentonite), and oil and grease absorbent (bentonite and fuller’s earth). These markets declined in the past several years in response to a decline in heavy industrial manufacturing. Based on the rate of the current recovery, growth in these markets probably will be slow in the near future. Prospects for domestic sales of bentonite for drilling mud applications are not favorable owing to a continued decline in drilling activity in Canada and the United States. Foreign drilling mud markets may help offset this decline. Sales for pet litter markets probably will remain at current levels based on recent trends. A continuing decline in the paper industry and competition in the paper-filler and coating markets will hamper sales in the kaolin industry with sales likely to remain at current levels for the near term.
References Cited
Alchemy Ventures Ltd., 2002, Corporate update: Vancouver, British Columbia, Canada, Alchemy Ventures Ltd. press release, December 17, 1 p.
AMCOL International Corp., 2002a, AMCOL International Corp. Nanocor subsidiary announces Chinese distributor: Arlington Heights, IL, AMCOL International Corp. press release, February 1, 1 p.
AMCOL International Corp., 2002b, Nanocor subsidiary announces expansion of joint development program with Gitto Global Corp.: Arlington Heights, IL, AMCOL International Corp. press release, June 18, 1 p.
Black Bull Resources Inc., 2002, Environmental assessment update: Vancouver, British Columbia, Canada, Black Bull Resources Inc. press release, February 28, 1 p.
Ceramic Bulletin, 2002a, Gladding McBean buys clay plant: Ceramic Bulletin, v. 81, no. 3, March, p. 13.
Ceramic Bulletin, 2002b, WBB Minerals increases holdings in Brazil: Ceramic Bulletin, v. 81, no. 1, January, p. 11.
Chemical Industry Cybernews, 2002, Imerys announces acquisition in Thailand: Ceramic Industry Cybernews, v. 3, no. 29, July, 1 p.
Chemical Week, 2002, Court overturns $78 million verdict against Süd-Chemie: Chemical Week, v. 164, no. 43, October 30, p. 7.
Daniels, R.E., 2002a, The United States ceramic tile industry: Tile & Decorative Surfaces, v. 52, no. 7, July, p. 38-40.
Daniels, R.E., 2002b, U.S. tile sales hold steady; imports continue fueling growth: Ceramic Industry, v. 152, no. 9, August, p. 21-23.
Dolley, T.P., 2004, Silica, in Metals and minerals: U.S. Geological Survey Minerals Yearbook 2002, v. I, p. 67.1-67.18.
Engelhard Corp., 2002a, Engelhard announces market-driven actions to redeploy certain assets: Iselin, NJ, Engelhard Corp. press release, July 31, 1 p.
Engelhard Corp., 2002b, Engelhard expands presence in China, acquires specialty mineral company: Iselin, NJ, Engelhard Corp. press release, December 3, 1 p.
Engelhard Corp., 2002c, Engelhard opens kaolin pigment slurry facility in Ghent to serve papermakers in northern Europe: Iselin, NJ, Engelhard Corp. press release, April 12, 1 p.
Engelhard Corp., 2003, Annual report 2002: Iselin, NJ, Engelhard Corp., March 31, 86 p.
Freas, R.C., Alsobrook, A.F., Kogel, J.E., Pickering, S.M., Jr., and Murray, H.H., eds., 2002, Proceedings of the Conference on Global Kaolin Resources, Exploration, and Development, Savannah, GA, September 9-11, 2002: Littleton, CO, Society for Mining, Metallurgy, and Exploration, Inc., CD-ROM.
Grahl, C.L., 2002a, Remodeling, new construction drive U.S. sanitaryware sales higher: Ceramic Industry, v. 152, no. 9, August, p. 28.
Grahl, C.L., 2002b, U.S. brick sales remain steady in 2001; near-term outlook is uncertain: Ceramic Industry, v. 152, no. 9, August, p. 42.
Harris, Paul, 2002, A coat for any occasion: Industrial Minerals, no. 414, March, p. 38-43.
Hohenberger, Walter, Holzinger, Thomas, and Bernhart, Wolfram, 2002, Mineral aspect ratio: Industrial Minerals, no. 422, November, p. 64-69.
Imerys, 2002, Imerys to raise prices of paper-grade kaolin and calcium carbonate products: Atlanta, GA, Imerys press release, December 11, 1 p.
Imerys, 2003, Results 2002: Paris, France, Imerys press release, March 11, 11 p.Industrial Minerals, 2002a, Afhold to sell sepiolite cat litter: Industrial Minerals,
no. 416, May, p. 14-15.Industrial Minerals, 2002b, Alchemy completes kaolin agreement: Industrial
Minerals, no. 420, September, p. 12.Industrial Minerals, 2002c, Amcol sells UK foundry bentonite business to Minsol:
Industrial Minerals, no. 414, March, p. 15-16.Industrial Minerals, 2002d, Amcol strengthens foundry business with FNG buy:
Industrial Minerals, no. 419, August, p. 19.Industrial Minerals, 2002e, Bentonit joint venture commissioned: Industrial
Minerals, no. 417, June, p. 19.Industrial Minerals, 2002f, Gai GOK to mine bentonite: Industrial Minerals, no.
414, March, p. 21.Industrial Minerals, 2002g, Huber interest in Kaoclay kaolin: Industrial Minerals,
no. 415, April, p. 23.Industrial Minerals, 2002h, IMA to represent North American minerals industry:
Industrial Minerals, no. 417, June, p. 15-16.Industrial Minerals, 2002i, Imerys acquires majority stake in kaolin/ball clay j-v:
Industrial Minerals, no. 419, August, p. 15.Industrial Minerals, 2002j, Imerys shifts kaolin output from UK to Brazil:
Industrial Minerals, no. 415, April, p. 27.Industrial Minerals, 2002k, Ione Minerals & Refractories plant auction: Industrial
Minerals, no. 421, October, p. 21.Industrial Minerals, 2002l, Lintech to market Atlas halloysite: Industrial Minerals,
no. 422, November, p. 6.Industrial Minerals, 2002m, NARCO files Ch. 11 as RHI faces asbestos battle:
Industrial Minerals, no. 413, February, p. 21.Industrial Minerals, 2002n, Prices: Industrial Minerals, no. 420, September, p. 66.Industrial Minerals, 2002o, Prices: Industrial Minerals, no. 423, December, p. 70.Industrial Minerals, 2002p, RHI clarification: Industrial Minerals, no. 420,
September, p. 70.Industrial Minerals, 2002q, RHI focuses on Canada: Industrial Minerals, no. 417,
June, p. 26.Industrial Minerals, 2002r, Sale of stake in Dashukovsky Bentonites: Industrial
Minerals, no. 414, March, p. 22.
CLAY AND SHALE—2002 18.11
Industrial Minerals, 2002s, Silver & Baryte buys Bentonit Hungaria: Industrial Minerals, no. 412, January, p. 11.
Industrial Minerals, 2002t, Skardon kaolin approaches all systems go: Industrial Minerals, no. 415, April, p. 114.
Industrial Minerals, 2002u, Skardon kaolin recommissions dry calciner: Industrial Minerals, no. 417, June, p. 74.
Industrial Minerals, 2002v, Tricorona to sell Woxna Graphite to focus on kaolin: Industrial Minerals, no. 413, February, p. 14-15.
Industrial Minerals, 2002w, Unimin acquires Kingaroy Kaolin: Industrial Minerals, no. 416, May, p. 10.
Industrial Minerals, 2003, Süd-Chemie expands rapidly in China with Redhill Volclay buy: Industrial Minerals, no. 424, January, p. 10.
Minerals Corp. Ltd., 2002, Minerals Corp. seeks $3.7 million for Skardon River kaolin project: Sydney, Australia, Minerals Corp. Ltd. press release, May 22, 3 p.
Mining Journal, 2002, Imerys to restructure Cornish operations: Mining Journal, v. 338, no. 8677, March 22, p. 219.
Mohawk Industries, Inc., 2002, Mohawk Industries, Inc. completes acquisition of Dal-Tile International Inc.: Calhoun, GA, Mohawk Industries Inc. press release, March 20, 2 p.
North American Minerals News, 2002a, Engelhard to cut kaolin jobs in Georgia: North American Minerals News, no. 82, March, p. 3.
North American Minerals News, 2002b, Nestlé buys Ralston Purina: North American Minerals News, no. 81, February, p. 8.
North American Minerals News, 2002c, RHI files for ch 11 protection for all U.S. subsidiaries: North American Minerals News, no. 83, April, p. 6.
North American Minerals News, 2002d, Zemex buys Milwhite attapulgite: North American Minerals News, no. 82, March, p. 5.
Oil & Gas Journal, 2002, Statistics: Oil & Gas Journal, v. 100, no. 52, December 23, p. 149.
Oil-Dri Corp. of America, 2002a, Oil-Dri completes acquisition strengthening its position as the world’s largest cat litter producer and expanding its ability to service customers worldwide: Chicago, IL, Oil-Dri Corp. of America press release, December 13, 1 p.
Oil-Dri Corp. of America, 2002b, Oil-Dri reports fourth quarter and year end results: Chicago, IL, Oil-Dri Corp. of America press release, September 25, 5 p.
Petzet, Alan, 2002, Drilling declines of more than 20% forecast in U.S., Canada: Oil & Gas Journal, v. 100, no. 26, July 1, p. 80-82.
Refractory News, 2002, RHI update and clarification: Refractory News, v. 3-02, March, p. 1.
Seewald, Nancy, 2002, PCC fillers grab share from kaolin: Chemical Week, v. 164, no. 4, January 30, p. 21.Süd-Chemie Co., 2003, Annual report-2002: Munich, Germany, Süd-Chemie
Ag, 52 p.Tile and Decorative Surfaces, 2002, Mohawk Industries completes acquisition of
Dal-Tile: Tile and Decorative Surfaces, v. 52, no. 1, January, p. 21-22, 61.U.S. Census Bureau, 2000, Plumbing fixtures—1999: U.S. Census Bureau
MQ332E(99)-5, October, 24 p.
U.S. Census Bureau, 2002, Refractories—2001: U.S. Census Bureau MA327C(01)-1, October, 11 p.
U.S. Census Bureau, 2003a, Clay construction products—Summary: U.S. Census Bureau MQ327D(02)-5, July, 16 p.
U.S. Census Bureau, 2003b, Paint and allied products—2002: U.S. Census Bureau MA325F(02)-1, July, 10 p.
U.S. Department of Commerce, 2002, New residential construction in June 2003: U.S. Department of Commerce CB03-113, June 17, 6 p.
U.S. Environmental Protection Agency, 2002a, National emission standards for hazardous air pollutants for brick and structural clay products manufacturing; and national emission standards for hazardous air pollutants for clay ceramics manufacturing: Federal Register, v. 67, no. 140, July 22, p. 47894-47949.
U.S. Environmental Protection Agency, 2002b, National emission standards for hazardous air pollutants for refractory products manufacturing: Federal Register, v. 67, no. 119, June 20, p. 42108-42170.
Internet Reference Cited
Geo.net Commodities GmbH, 2003, Offers—Bentonite, accessed August 14, 2003, via URL http://geo.net.
GENERAL SOURCES OF INFORMATION
U.S. Geological Survey Publications
Clays. Ch. in Mineral Commodity Summaries, annual.Clays. Ch. in United States Mineral Resources, Professional
Paper 820, 1973.
Other
American Forest and Paper Association.China Clay Producers Association.Clays. Ch. in Mineral Facts and Problems, U.S. Bureau of
Mines Bulletin 675, 1985.Cosmetic, Toiletry, and Fragrance Association.Engineering and Mining Journal.Mining Engineering.Mining Magazine.National Paint and Coatings Association.Society of the Plastics Industry.World Mining.
1998 1999 2000 2001 2002Domestic clays sold or used by producers:
Quantity 41,900 42,200 40,800 39,600 r 39,300Value 1,670,000 1,570,000 1,520,000 1,510,000 r 1,580,000
Exports:Quantity 5,230 4,800 5,260 4,970 4,960Value 843,000 823,000 896,000 836,000 817,000
Imports for consumption:Quantity 86 90 96 148 217Value 27,700 23,000 34,900 33,900 39,400
TABLE 1SALIENT U.S. CLAY STATISTICS1, 2
(Thousand metric tons and thousand dollars)
rRevised.1Excludes Puerto Rico.2Data are rounded to no more than three significant digits.

18.12 U.S. GEOLOGICAL SURVEY MINERALS YEARBOOK—2002
CommonBall clay and Fire Fuller's
State clay Bentonite shale clay earth Kaolin Quantity ValueAlabama -- 125 2,020 -- -- 531 2,680 43,100Arizona -- W W -- -- -- W WArkansas -- -- 922 -- -- W 922 2,280California -- W 1,030 W W W 1,030 24,200Colorado -- W 214 -- -- -- 214 1,260Connecticut -- -- 55 -- -- -- 55 183Florida -- -- W -- 260 32 292 3,370Georgia -- W 1,310 -- 979 6,830 9,110 993,000Illinois -- -- 181 -- 118 -- 299 856Indiana W -- 429 -- -- -- 429 1,240Iowa -- -- 256 -- -- -- 256 763Kansas -- -- 642 -- W -- 642 4,280Kentucky W -- 925 -- -- -- 925 4,740Louisiana -- -- 667 -- -- -- 667 1,680Maine -- -- 49 -- -- -- 49 125Maryland -- -- 268 -- -- -- 268 550Massachusetts -- -- 36 -- -- -- 36 321Michigan -- -- 499 -- -- -- 499 884Minnesota -- -- 14 -- -- -- 14 15Mississippi W W 496 -- 411 -- 907 32,100Missouri -- -- 1,050 340 W -- 1,390 11,300Montana -- 181 W -- -- -- 181 14,900Nebraska -- -- 133 -- -- -- 133 338Nevada -- 6 -- -- 28 W 34 3,870New Jersey -- -- W -- -- -- W WNew Mexico -- -- 33 -- -- -- 33 175New York -- -- 641 -- -- -- 641 7,990North Carolina -- -- 2,420 -- -- W 2,420 11,900North Dakota -- -- 57 -- -- -- 57 WOhio -- -- 1,310 W -- -- 1,310 7,820Oklahoma -- -- 1,030 -- -- -- 1,030 2,250Oregon -- W 237 -- -- -- 237 662Pennsylvania -- -- 779 -- -- -- 779 2,560South Carolina -- -- 1,020 53 -- 374 1,450 25,500South Dakota -- -- 208 -- -- -- 208 WTennessee 660 -- 262 -- W W 922 29,700Texas W W 2,160 -- W 39 2,200 29,600Utah -- W 349 -- -- -- 349 5,010Virginia -- -- 827 -- W -- 827 3,320Washington -- -- 89 -- -- -- 89 169West Virginia -- -- 151 -- -- -- 151 407Wyoming -- 3,340 33 -- -- -- 3,380 145,000
Total 1,120 3,970 23,000 446 2,730 8,010 39,300 1,580,000
TABLE 2CLAYS SOLD OR USED BY PRODUCERS IN THE UNITED STATES IN 2002, BY STATE1, 2
(Thousand metric tons and thousand dollars)
W Withheld to avoid disclosing company proprietary data, included in "Total." -- Zero.1Excludes Puerto Rico.2Data are rounded to no more than three significant digits; may not add to totals shown.
Total

CLAY AND SHALE—2002 18.13
State Quantity Value Quantity Value Quantity Value Quantity Value2001:
Tennessee 254 12,700 196 r 8,400 230 7,670 680 28,800Other2 186 11,100 r W W W W 425 17,900 r
Total 440 23,800 196 r 8,400 230 7,670 1,110 46,7002002:
Tennessee 248 12,400 194 8,350 217 7,320 660 28,100Other2 196 11,500 W W W W 459 11,500
Total 444 24,000 194 8,350 217 7,320 1,120 47,000
TABLE 3BALL CLAY SOLD OR USED BY PRODUCERS IN THE UNITED STATES, BY STATE1
(Thousand metric tons and thousand dollars)
Airfloat Water-slurried Unprocessed
rRevised. W Withheld to avoid disclosing company proprietary data; included in "Grand total."1Data are rounded to no more than three significant digits, may not add to totals shown.2Includes Indiana (2002), Kentucky, Mississippi, and Texas.
Grand total
Use 2001 2002Fillers, extenders, binders2 W 25,100Floor and wall tile 387,000 395,000Miscellaneous ceramics3 135,000 169,000Pottery 20,500 23,100Refractories4 62,200 63,100Sanitaryware 247,000 246,000Miscellaneous5 70,900 r 52,200Exports6 182,000 r 146,000
Total 1,100,000 1,120,000
TABLE 4BALL CLAY SOLD OR USED BY PRODUCERS IN THE UNITED STATES, BY USE1
(Metric tons)
rRevised. W Withheld to avoid disclosing company proprietary data; included with "Miscellaneous."1Data are rounded to no more than three significant digits; may not add to totals shown.2Includes animal feed (2002), asphalt tile (2002), asphalt emulsions (2002), rubber and other fillers,
6Includes ceramics and glass, fillers, extenders and binders, and floor and wall tile.
extenders and binders.3Includes catalysts, electrical porcelain, fiber glass, fine china/dinnerware, glass, mineral wool, andmiscellaneous ceramics.4Includes firebrick, blocks, shapes, and kiln furniture.5Includes fillers, extenders, binder, and waterproofing seals.
State Quantity Value Quantity Value Quantity Value2001:
Nevada 5 758 -- r -- r 5 758Wyoming -- -- 3,330 r 153,000 3,330 r 153,000Other2 352 13,000 r 282 r 22,500 r 635 r 35,500 r
Total 357 13,700 r 3,610 r 176,000 r 3,970 r 189,000 r
2002:Nevada W W W W W WWyoming -- -- 3,340 145,000 3,340 145,000Other2 354 14,000 273 20,800 627 34,800
Total 354 14,000 3,620 166,000 3,970 180,000
TABLE 5BENTONITE SOLD OR USED BY PRODUCERS IN THE UNITED STATES, BY STATE1
(Thousand metric tons and thousand dollars)
rRevised. W Withheld to avoid disclosing company proprietary data; included with "Other." -- Zero.1Data are rounded to no more than three significant digits; may not add to totals shown.2Includes Alabama, Arizona, California, Colorado, Georgia, Mississippi, Montana, Oregon, Texas, and Utah.
Nonswelling Swelling Total

18.14 U.S. GEOLOGICAL SURVEY MINERALS YEARBOOK—2002
Use 2001 2002Domestic:
Absorbents:Pet waste absorbents 902,000 r 899,000Other absorbents W W
Adhesives 2,170 2,100Animal feed 52,200 r 42,400Ceramics (except refractories)2 W WDrilling mud 787,000 r 762,000Filler and extender applications3 49,300 r 45,700Filtering, clarifying, decolorizing 91,600 r 127,000Foundry sand 746,000 r 762,000Pelletizing (iron ore)4 522,000 r 536,000Miscellaneous refractories W WMiscellaneous5 90,700 r 117,000Waterproofing and sealing 283,000 r 269,000
Total 3,520,000 r 3,560,000Exports:
Drilling mud 73,300 r 59,200Foundry sand 244,000 r 244,000Other6 129,000 106,000
Total 446,000 r 408,000Grand total 3,970,000 r 3,970,000
TABLE 6BENTONITE SOLD OR USED BY PRODUCERS IN THE UNITED STATES, BY USE1
(Metric tons)
rRevised. W Withheld to avoid disclosing company proprietary data; included with "Miscellaneous."1Data are rounded to no more than three significant digits, may not add to totals shown.2Includes catalysts and pottery.
5Includes chemical manufacturing, heavy clay products, and other unknown uses.6Includes absorbents, fillers and extender, miscellaneous refractories, pelletizing, and other unknown uses.
3Includes asphalt tiles (2001), cosmetics, ink, medical, miscellaneous fillers and extenders applicationspaint, paperfilling, pesticides and related products, pharmaceutical, and plastics.4Excludes shipments to Canada. Total sales in North America were 570,000 metric tons in 2001 and603,000 metric tons in 2002.
State Quantity Value Quantity ValueAlabama 2,050 24,800 2,020 24,600Arkansas 989 1,440 921 2,280California 885 18,800 r 1,030 21,400Georgia 1,360 4,580 1,310 5,500Indiana 575 1,470 429 1,240Kansas 635 4,280 642 4,280Kentucky 1,010 4,230 925 4,740Michigan 595 2,280 499 884Mississippi 461 2,040 496 2,210Missouri 1,030 3,420 1,050 3,930New York 647 7,960 641 7,990North Carolina 2,340 11,100 2,420 11,900Ohio 1,320 7,410 1,310 7,820Oklahoma 783 1,910 1,030 2,250Pennsylvania 758 2,320 779 2,560
State Quantity Value Quantity ValueSouth Carolina 1,050 4,150 1,020 3,360Texas 2,120 8,750 2,160 21,200Virginia 937 1,840 827 3,320Other3 3,630 16,400 r 3,510 16,900
Total 23,200 129,000 23,000 148,000
TABLE 7COMMON CLAY AND SHALE SOLD OR USED BY PRODUCERS
IN THE UNITED STATES, BY STATE1, 2
(Thousand metric tons and thousand dollars)
2001 2002
1Data are rounded to no more than three significant digits; may not add to totals shown.2Excludes Puerto Rico.3Includes all other States except Alaska, Delaware, Hawaii, Idaho, Nevada, NewHampshire, Rhode Island, Vermont, and Wisconsin.
See footnotes at end of table.
TABLE 7--ContinuedCOMMON CLAY AND SHALE SOLD OR USED BY PRODUCERS
2001 2002
IN THE UNITED STATES, BY STATE1, 2
(Thousand metric tons and thousand dollars)

CLAY AND SHALE—2002 18.15
Use 2001 2002Ceramics and glass3 W 174,000Civil engineering and sealing W WFloor and wall tile:
Ceramic 409,000 387,000Other4 68,600 115,000
Heavy clay products:Brick, extruded 11,100,000 11,300,000Brick, other 1,680,000 1,500,000Drain tile and sewer pipe 79,900 39,000Flowerpots W 46,000Flue linings 256,000 47,700Structural tile W WOther5 71,400 110,000
Lightweight aggregate:Concrete block 2,370,000 2,370,000Highway surfacing 284,000 364,000Structural concrete 857,000 908,000Miscellaneous6 358,000 361,000
Portland and other cements 4,110,000 3,950,000Refractories7 741,000 795,000Miscellaneous8 807,000 r 556,000
Total 23,200,000 23,000,000
TABLE 8COMMON CLAY AND SHALE SOLD OR USED BY PRODUCERS
IN THE UNITED STATES, BY USE1, 2
(Metric tons)
rRevised. W Withheld to avoid disclosing company proprietary data; included with "Other" or"Miscellaneous."1Data are rounded to no more than three significant digits; may not add to totals shown.2Excludes Puerto Rico.3Includes pottery and roofing granules.4Includes quarry tile (2001) and miscellaneous floor and wall tiles (2002).
8Includes exports; miscellaneous civil engineering and sealings; miscellaneous fillers, extenders,and binders; wallboard; and other unknown uses.
5Includes flower pots, roofing tile, structural tile, terra cotta, and miscellaneous clay products.6Includes miscellaneous lightweight aggregates.7Includes firebrick, block and shapes, mortar and cement, plugs, taps, wads, and miscellaneous refractories.
State Quantity Value Quantity ValueAlabama 2,050 24,800 2,020 24,600Arkansas 989 1,440 921 2,280California 885 18,800 r 1,030 21,400Georgia 1,360 4,580 1,310 5,500Indiana 575 1,470 429 1,240Kansas 635 4,280 642 4,280Kentucky 1,010 4,230 925 4,740Michigan 595 2,280 499 884Mississippi 461 2,040 496 2,210Missouri 1,030 3,420 1,050 3,930New York 647 7,960 641 7,990North Carolina 2,340 11,100 2,420 11,900Ohio 1,320 7,410 1,310 7,820Oklahoma 783 1,910 1,030 2,250Pennsylvania 758 2,320 779 2,560
State Quantity Value Quantity ValueSouth Carolina 1,050 4,150 1,020 3,360Texas 2,120 8,750 2,160 21,200Virginia 937 1,840 827 3,320Other3 3,630 16,400 r 3,510 16,900
Total 23,200 129,000 23,000 148,000
TABLE 7COMMON CLAY AND SHALE SOLD OR USED BY PRODUCERS
IN THE UNITED STATES, BY STATE1, 2
(Thousand metric tons and thousand dollars)
2001 2002
1Data are rounded to no more than three significant digits; may not add to totals shown.2Excludes Puerto Rico.3Includes all other States except Alaska, Delaware, Hawaii, Idaho, Nevada, NewHampshire, Rhode Island, Vermont, and Wisconsin.
See footnotes at end of table.
TABLE 7--ContinuedCOMMON CLAY AND SHALE SOLD OR USED BY PRODUCERS
2001 2002
IN THE UNITED STATES, BY STATE1, 2
(Thousand metric tons and thousand dollars)

18.16 U.S. GEOLOGICAL SURVEY MINERALS YEARBOOK—2002
State Quantity Value Quantity ValueMissouri 289 4,650 r 340 7,360Other2 94 2,920 r 106 3,110
Total 383 7,570 r 446 10,500
TABLE 9FIRE CLAY SOLD OR USED BY PRODUCERS IN THE UNITED STATES, BY STATE1
(Thousand metric tons and thousand dollars)
1Data are rounded to no more than three significant digits; may not add to totals shown.2Includes California, Ohio, and South Carolina.
2001 2002
rRevised.
Use 2001 2002Heavy clay products and lightweight aggregates2 88,200 WRefractories:
Firebrick, block, shapes 146,000 20,400Other refractories3 131,000 312,000
Miscellaneous4 18,300 114,000Total 383,000 446,000
TABLE 10FIRE CLAY SOLD OR USED BY PRODUCERS IN THE UNITED STATES, BY USE1
(Metric tons)
W Withheld to avoid disclosing company proprietary data; included with "Miscellaneous."1Data are rounded to no more than three significant digits; may not add to totals shown.2Includes common brick, portland cement, and terra cotta.3Includes foundry sand, grogs and calcines, kiln furniture (2002), mortar and cement, andmiscellaneous refractories.4Includes animal feed, ceramics and glass, pottery, miscellaneous lightweight aggregates,and other unknown uses.
State Quantity Value Quantity Value Quantity Value2001:
Georgia W W W W 879 82,500 r
Southern States3 W W 764 r 75,400 r 764 r 75,400 r
Western States4 W W W W 989 r 77,300 r
Total 292 35,800 r 2,600 r 231,000 r 2,890 267,000 r
2002:Georgia W W W W 979 93,800Southern States3 W W 835 75,300 835 75,300Western States4 W W W W 736 54,800
Total 218 26,800 2,510 219,000 2,730 246,000
Attapulgite2 Montmorillonite
TABLE 11FULLER'S EARTH SOLD OR USED BY PRODUCERS IN THE UNITED STATES, BY STATE1
(Thousand metric tons and thousand dollars)
4Includes California, Illinois, Kansas, Missouri, Nevada, and Texas.
Total
rRevised. W Withheld to avoid disclosing company proprietary data; included with "Southern States" or "Total."1Data are rounded to no more than three significant digits; may not add to totals shown.2Primarily gellant-grade fuller's earth. See discussion under "Production: Fuller's Earth."3Includes Florida, Mississippi, Tennessee, and Virginia.

CLAY AND SHALE—2002 18.17
Use 2001 2002Absorbents:
Oil and grease absorbent 296,000 409,000Pet waste absorbent 1,870,000 1,580,000
Animal feed W 81,500Fertilizers 135,000 139,000Fillers, extenders, binders2 70,200 58,800Filtering, clarifying, decolorizing, animal, mineral, vegetable oils, greases 67,800 63,300Pesticides and related products 29,400 102,000Miscellaneous3 338,000 264,000Exports4 79,100 30,900
Total 2,890,000 2,730,000
TABLE 12FULLER'S EARTH SOLD OR USED BY PRODUCERS IN THE UNITED STATES, BY USE1
(Metric tons)
W Withheld to avoid disclosing company proprietary data; included with "Miscellaneous."1Data are rounded to no more than three significant digits; may not add to totals shown.2Includes adhesives, asphalt tiles, gypsum products, medical, pharmaceutical and cosmetics, paint, textiles, and otherunknown uses.3Includes animal feed (2001), drilling mud, portland cement, refractories, roofing granules, and other unknown uses.4Includes absorbents, drilling mud (2001), fillers, extenders and binders (2001), floor and wall tiles, heavy clayclay products (2001), mineral oils and greases, and other unknown uses (2001).
Use Quantity Value Quantity ValueGeorgia 7,020 818,000 r 6,830 893,000South Carolina 377 22,800 374 21,400Other2 716 r 34,400 r 806 36,600
Total 8,110 875,000 r 8,010 951,000
TABLE 13KAOLIN SOLD OR USED BY PRODUCERS IN THE UNITED STATES, BY STATE1
(Thousand metric tons and thousand dollars)
1Data are rounded to no more than three significant digits; may not add to totals shown.2Includes Alabama, Arkansas, California, Florida, Nevada, North Carolina, Tennessee, and Texas.
2001 2002
rRevised.
Kind Quantity Value Quantity ValueAirfloat 925 r 51,400 r 943 52,500Calcined2 1,370 240,000 r 1,550 284,000Delaminated 1,100 113,000 1,070 124,000Unprocessed 182 r 1,830 r 185 1,770Water washed 4,540 469,000 r 4,260 489,000
Total 8,110 875,000 r 8,010 951,000
TABLE 14KAOLIN SOLD OR USED BY PRODUCERS IN THE UNITED STATES, BY KIND1
(Thousand metric tons and thousand dollars)
1Data are rounded to no more than three significant digits; may not add to totals shown.2Includes pigment- and refractory-grade calcined kaolin.
2001 2002
rRevised.

18.18 U.S. GEOLOGICAL SURVEY MINERALS YEARBOOK—2002
State Quantity Value Quantity Value2001:
Georgia W W 730 215,000Other2 W W 39 8,350
Total 602 16,400 r 769 224,0002002:
Georgia W W 786 255,000Other2 W W 40 8,850
Total 721 20,600 826 264,000
TABLE 15CALCINED KAOLIN SOLD OR USED BY PRODUCERS IN THE UNITED STATES, BY STATE1
(Thousand metric tons and thousand dollars)
1Data are rounded to no more than three significant digits; may not add to totals shown.2Includes Alabama, Arkansas, California, South Carolina, and Texas.
Refractory-grade Pigment-grade
rRevised. W Withheld to avoid disclosing company proprietary data; included in "Total."
Kind Quantity Value Quantity ValueAirfloat 593 28,000 593 28,000Calcined2 812 217,000 r 888 258,000Delaminated 1,100 113,000 1,070 124,000Unprocessed 59 609 59 609Water washed 4,460 459,000 4,220 483,000
Total 7,020 818,000 r 6,830 893,000
TABLE 16GEORGIA KAOLIN SOLD OR USED BY PRODUCERS, BY KIND1
(Thousand metric tons and thousand dollars)
1Data are rounded to no more than three significant digits; may not add to totals shown.2Includes pigment- and refractory-grade calcined kaolin.
2001 2002
rRevised.
Use 2001 2002Domestic:
Ceramics and glass:Catalysts (oil-refining) 155,000 152,000Fiber glass 265,000 265,000Roofing granules 20,100 20,100Sanitaryware 77,200 77,000Other3 38,500 46,200
Fillers, extenders, binders:Adhesives 43,400 52,700Paint 256,000 261,000Paper coating 2,470,000 2,530,000Paper filling 413,000 449,000Plastic 46,200 45,400Rubber 60,400 61,000Other4 213,000 92,400
Heavy clay products5 17,400 17,400Refractories6 132,000 258,000Undistributed7 158,000 54,700
Total 4,370,000 4,380,000
Use 2001 2002Exports:
Paint 353,000 85,000Paper coating8 1,860,000 2,040,000Paper filling8 85,200 93,900Rubber 7,270 6,970Undistributed9 340,000 221,000
Total 2,650,000 2,450,000Grand total 7,020,000 6,830,000
TABLE 17GEORGIA KAOLIN SOLD OR USED BY PRODUCERS, BY USE1, 2
(Metric tons)
1Includes airfloat, high- and low-temperature calcined and delaminated, water washed, and unprocessed kaolin.2Data are rounded to no more than three significant digits; may not add to totals shown.3Includes electrical porcelain, fine china/dinnerware, pottery, and miscellaneous ceramics.
See footnotes at end of table.
TABLE 17--ContinuedGEORGIA KAOLIN SOLD OR USED BY PRODUCERS, BY USE1, 2
(Metric tons)
4Includes animal feed, asphalt tile, fertilizers, gypsum products, medical, pharmaceutical and cosmetics,pesticides and related products, textiles and miscellaneous fillers, extenders and binders.5Includes brick (common and face) and miscellaneous clay products.6Includes firebricks, blocks and shapes, grogs and calcines, high-alumina specialties, kiln furniture, and
binders, portland cement, miscellaneous refractories (2001).
miscellaneous refractories.7Includes absorbents (2002), chemical manufacturing, floor and wall tiles, and other unknown uses.8Some export sales may be included under domestic sales.9Includes adhesives, catalyst (oil-refining), fiber glass, sanitaryware, miscellaneous fillers, extenders and

CLAY AND SHALE—2002 18.19
Use 2001 2002Domestic:
Ceramics and glass:Catalysts (oil-refining) 155,000 152,000Fiber glass 265,000 265,000Roofing granules 20,100 20,100Sanitaryware 77,200 77,000Other3 38,500 46,200
Fillers, extenders, binders:Adhesives 43,400 52,700Paint 256,000 261,000Paper coating 2,470,000 2,530,000Paper filling 413,000 449,000Plastic 46,200 45,400Rubber 60,400 61,000Other4 213,000 92,400
Heavy clay products5 17,400 17,400Refractories6 132,000 258,000Undistributed7 158,000 54,700
Total 4,370,000 4,380,000
Use 2001 2002Exports:
Paint 353,000 85,000Paper coating8 1,860,000 2,040,000Paper filling8 85,200 93,900Rubber 7,270 6,970Undistributed9 340,000 221,000
Total 2,650,000 2,450,000Grand total 7,020,000 6,830,000
TABLE 17GEORGIA KAOLIN SOLD OR USED BY PRODUCERS, BY USE1, 2
(Metric tons)
1Includes airfloat, high- and low-temperature calcined and delaminated, water washed, and unprocessed kaolin.2Data are rounded to no more than three significant digits; may not add to totals shown.3Includes electrical porcelain, fine china/dinnerware, pottery, and miscellaneous ceramics.
See footnotes at end of table.
TABLE 17--ContinuedGEORGIA KAOLIN SOLD OR USED BY PRODUCERS, BY USE1, 2
(Metric tons)
4Includes animal feed, asphalt tile, fertilizers, gypsum products, medical, pharmaceutical and cosmetics,pesticides and related products, textiles and miscellaneous fillers, extenders and binders.5Includes brick (common and face) and miscellaneous clay products.6Includes firebricks, blocks and shapes, grogs and calcines, high-alumina specialties, kiln furniture, and
binders, portland cement, miscellaneous refractories (2001).
miscellaneous refractories.7Includes absorbents (2002), chemical manufacturing, floor and wall tiles, and other unknown uses.8Some export sales may be included under domestic sales.9Includes adhesives, catalyst (oil-refining), fiber glass, sanitaryware, miscellaneous fillers, extenders and
Kind Quantity Value Quantity ValueAirfloat 313 21,400 307 20,000Unprocessed2 63 1,400 68 1,350
Total 377 22,800 374 21,400
TABLE 18SOUTH CAROLINA KAOLIN SOLD OR USED BY PRODUCERS, BY KIND1
(Thousand metric tons and thousand dollars)
2Includes calcined kaolin.
2001 2002
1Data are rounded to no more than three significant digits; may not add to totals shown.
Kind and use 2001 2002Adhesives 12,600 r 14,700Ceramics2 102,000 104,000Rubber 140,000 116,000Refractories3 7,350 7,030Other uses4 81,700 88,900Exports5 32,700 44,200
Total 377,000 374,000
TABLE 19SOUTH CAROLINA KAOLIN SOLD OR USED BY PRODUCERS, BY KIND AND USE1
(Metric tons)
rRevised.1Data are rounded to no more than three significant digits; may not add to totals shown.2Includes catalysts (oil-refining), fine china/dinnerware; glazes, glass, and enamels, pottery,
heavy clay products, lightweight aggregates, paints, and plastics.5Includes fillers, extenders, and binders, and refractories.
roofing granules, sanitary ware, and miscellaneous ceramics.3Includes firebrick, blocks and shapes, and miscellaneous refractories.4Includes asphalt tile, brick (common and face), catalysts (oil refining), chemicalmanufacturing, civil engineering and sealings, drilling mud, fillers, extenders and binders,

18.20 U.S. GEOLOGICAL SURVEY MINERALS YEARBOOK—2002
Use 2001 2002Domestic:
Ceramics:Catalyst (oil and gas refining) 212,000 210,000Electrical porcelain 6,940 8,300Fine china and dinnerware 26,300 27,400Floor and wall tile 39,900 63,100Pottery 4,590 13,400Roofing granules 37,400 36,500Sanitaryware 81,100 85,200Miscellaneous W W
Chemical manufacture 31,600 31,600Civil engineering W WFiber glass, mineral wool 288,000 288,000Fillers, extenders, binders:
Adhesive 56,000 67,400Fertilizer 3,580 3,550Medical, pharmaceutical, cosmetic 738 754Paint 274,000 298,000Paper coating 2,480,000 2,540,000Paper filling 414,000 450,000Pesticide W WPlastic 50,800 49,700Rubber 201,000 177,000Miscellaneous 225,000 107,000
Heavy clay products:Brick, common and face 122,000 70,900Portland cement W W
Refractories:2 637,000 904,000Miscellaneous applications 225,000 91,600
Total 5,410,000 5,520,000Exports:
Ceramics 219,000 203,000Paint 365,000 85,000Paper coating 1,860,000 2,040,000Paper filling 85,200 93,900Rubber 39,600 50,700Miscellaneous 125,000 19,000
Total 2,700,000 2,490,000Grand total 8,110,000 8,010,000
TABLE 20KAOLIN SOLD OR USED BY PRODUCERS IN THE UNITED STATES, BY USE1
(Metric tons)
miscellaneous refractories.
W Withheld to avoid disclosing company proprietary data; included with "Miscellaneous" or "Miscellaneous applications."1Data are rounded to no more than three significant digits; may not add to totals shown.2Includes firebrick (blocks and shapes), grogs and calcines, high-alumina (brick and specialties), kiln furniture, and

CLAY AND SHALE—2002 18.21
Concrete Structural TotalState block concrete Other2 Total valuee
2001:Alabama 703 42 8 754 16,600Arkansas 182 91 -- 273 225Californiae 46 164 -- 211 r 9,880Florida 68 23 -- 91 1,280Indiana 137 8 -- 145 295Kansas -- -- 93 93 1,280Kentucky 109 36 -- 145 557Louisiana 319 159 53 531 1,170Missouri -- -- 134 134 2,000New York 82 54 -- 136 5,600North Carolinae 301 52 -- 353 4,050Ohioe 149 8 -- 157 764Oklahoma 22 3 -- 25 659Texase 49 157 253 459 2,520Utah 68 59 100 227 4,880Virginia 141 -- -- 141 980
Total 2,370 857 641 3,870 52,7002002:
Alabama 749 53 89 891 18,200Arkansas 203 102 -- 305 1,340California 47 181 -- 228 11,200Floridae 68 23 -- 91 1,280Indianae 137 8 -- 145 295Kansas -- -- 73 73 1,010Kentuckye 109 36 -- 145 557Louisianae 319 159 53 531 1,170Missouri -- -- 125 125 1,860New Yorke 82 54 -- 136 5,600North Carolinae 301 52 -- 353 4,050Ohioe 149 8 -- 157 764Oklahomae 22 3 -- 25 659Texase 49 157 253 459 2,520Utah -- 71 133 204 3,450Virginiae 141 -- -- 141 980
Total 2,370 908 726 4,010 54,900
TABLE 21COMMON CLAY AND SHALE USED IN LIGHTWEIGHT AGGREGATE PRODUCTION
(Thousand metric tons and thousand dollars)
IN THE UNITED STATES BY STATE1
eEstimated. -- Zero.1Data are rounded to no more than three significant digits; may not add to totals shown.2Includes highway surfacing.

18.22 U.S. GEOLOGICAL SURVEY MINERALS YEARBOOK—2002
State Quantity Valuee Quantity Valuee
Alabama 815 2,070 r 642 2,050Arkansas 478 540 464 504California 243 1,170 243 e 1,170 e
Colorado 202 1,320 176 1,130Georgia 1,160 3,180 1,110 4,100Illinois 188 874 172 763Kentucky3 483 1,840 400 2,360Maryland 198 253 200 243Mississippi 384 1,910 420 2,080North Carolina 1,890 5,290 r 1,960 6,540Ohio 837 4,450 817 4,840Oklahoma 481 829 731 1,170Pennsylvania 655 1,910 674 2,160South Carolina 778 2,600 814 2,150Texas 1,040 3,990 r 1,010 16,200Other4 2,920 7,740 r 2,950 11,600
Total 12,800 40,000 r 12,800 59,000
TABLE 22COMMON CLAY AND SHALE USED IN BUILDING BRICK PRODUCTION
(Thousand metric tons and thousand dollars)
IN THE UNITED STATES, BY STATE1, 2
2001
eEstimated.
2002
1Includes extruded and other brick.2Data are rounded to no more than three significant digits; may not add to totals shown.3Extruded brick only.
Hampshire, Rhode Island, Vermont, and Wisconsin.
4Includes all other States except Alaska, Delaware, Hawaii, Idaho, Nevada, New

CLAY AND SHALE—2002 18.23
Country Quantity Value Quantity Value Quantity Value Quantity ValueArgentina 4 99 (2) 107 (2) 76 (2) 89Australia 1 21 12 1,080 16 1,230 -- --Belgium (2) 4 4 5,290 (2) 49 (2) 50Brazil (2) 32 10 1,650 (2) 69 (2) 9Canada 51 1,820 219 13,300 32 1,520 15 1,670Finland -- -- (2) 11 -- -- -- --France -- -- (2) 520 (2) 46 (2) 34Germany (2) 3 12 950 (2) 40 (2) 81Indonesia -- -- 11 1,770 2 414 -- --Italy -- -- 1 602 -- -- 1 271Japan 1 177 174 16,900 22 2,010 -- --Korea, Republic of (2) 130 23 2,390 1 380 -- --Malaysia -- -- 15 1,420 (2) 12 2 228Mexico 3 105 20 2,050 84 7,990 1 100Netherlands (2) 25 24 10,200 55 5,770 22 1,970Singapore (2) 11 3 721 -- -- (2) 5South Africa -- -- 1 620 (2) 33 (2) 16Taiwan 16 407 28 3,940 12 774 (2) 32Thailand -- -- 12 1,290 -- -- (2) 73United Kingdom 1 64 75 7,880 (2) 67 2 300Venezuela 27 2,270 4 1,080 (2) 25 1 261Other 23 1,880 74 13,800 27 2,350 16 3,480
Total 127 7,050 722 87,600 251 22,800 60 8,670
Quantity Value Quantity Value Quantity ValueArgentina 11 1,310 1 927 16 2,610Australia 15 4,340 5 4,340 49 16,200Belgium 32 8,240 1 639 38 14,300Brazil 5 1,820 4 3,530 19 7,100Canada 783 74,500 244 42,600 1,340 135,000Finland 259 50,400 1 1,740 260 52,200France 7 1,530 2 1,600 10 3,730Germany 36 12,000 4 2,120 52 15,200Indonesia 71 15,800 3 1,270 87 19,200Italy 91 15,800 5 2,630 97 19,300Japan 866 138,000 18 8,900 1,080 166,000Korea, Republic of 175 32,500 8 6,830 207 42,300Malaysia 3 902 2 1,200 22 3,770Mexico 213 18,600 28 6,510 348 35,300Netherlands 175 28,600 20 17,400 297 64,000Singapore 3 776 3 3,810 9 4,330South Africa 4 1,830 4 1,740 9 4,240Taiwan 176 24,900 8 3,760 240 33,800Thailand 39 8,110 4 1,930 55 11,400United Kingdom 20 7,880 10 12,300 108 28,500Venezuela 23 10,000 5 1,180 60 14,800Other 339 77,500 69 28,600 546 123,000
Total 3,350 536,000 449 156,000 4,960 817,000
TABLE 23U.S. EXPORTS OF CLAYS IN 2002, BY COUNTRY1
(Thousand metric tons and thousand dollars)
Ball clay Bentonite Fire clay Fuller's earth
Kaolin Clays, n.e.c.3 Total
-- Zero.
Source: U.S. Census Bureau.
1Data are rounded to no more than three significant digits; may not add to totals shown.2Less than 1/2 unit.3Also includes chamotte or dina's earth, activated clays and earths, and artificially activated clays.

18.24 U.S. GEOLOGICAL SURVEY MINERALS YEARBOOK—2002
Quantity Value2
Kind (metric tons) (thousands)China clay or kaolin:
Brazil 142,000 16,700Canada 488 216France 645 208Germany 244 273Japan 130 184Mexico 96 96United Kingdom 13,700 4,340Other 694 289
Total 158,000 22,400Fire clay:
Canada 210 88Germany 8 27
Total 218 116Decolorizing earths and fuller's earth:
China 189 41Malaysia 16 7
Total 205 48Bentonite:
Canada 1,380 619Germany 24 29Greece 24,400 980Italy 21 64Japan 49 86Mexico 329 85Netherlands 156 62Spain 305 315Turkey 2,080 943United Kingdom 316 152Other 39 19
Total 29,100 3,350Common blue clay and other ball clay:
Canada 29 12China 14 18Germany 18 8United Kingdom 346 104
Total 407 142Other clay:
Canada 1,260 305China 305 278Germany 101 131Mexico 192 232Netherlands 32 23Spain 598 406United Kingdom 387 232Other 193 521
Total 3,070 2,130Artificially activated clay and activated earth:
Austria 53 73Canada 1,990 1,150Denmark 464 694Germany 2,880 1,930Mexico 20,000 6,230Netherlands 199 110Peru 203 102United Kingdom 336 436Other 732 536
Total 26,800 11,300Grand total 217,000 39,400
2U.S. Customs declared value.
Source: U.S. Census Bureau.
TABLE 24U.S. IMPORTS FOR CONSUMPTION OF CLAY IN 2002, BY KIND1
1Data are rounded to no more than three significant digits; may not add to totals shown.

CLAY AND SHALE—2002 18.25
Country3 1998 1999 2000 2001 2002e
Algeria4 15,655 15,491 22,708 21,286 r 27,178 5
Argentina 131,320 128,809 123,092 r 104,335 r 88,685 5
Armenia 3,000 e 3,493 2,807 3,000 e 3,000Australiae, 4 104,000 180,000 180,000 180,000 200,000Bosnia and Herzegovinae 800 800 800 800 800Brazil, beneficiated 220,000 274,623 273,975 160,381 r 165,000Bulgaria 1,176,110 242,725 295,000 250,000 e 250,000Burma 1,066 r 998 r 978 r 900 e 900Chile 721 1,104 1,314 1,695 r 632Commonwealth of Independent Statese, 6 600,000 700,000 750,000 750,000 750,000Croatia 7,581 8,441 10,013 10,580 r 11,000Cyprus 121,850 138,853 167,500 126,600 125,000Czech Republic 125,000 160,000 280,000 250,000 e 250,000Egypte 33,000 50,000 50,000 50,000 50,000Georgiae 11,000 9,891 7,084 7,000 7,000Germanye 500,000 500,000 5 500,000 500,000 500,000Greecee 950,000 950,000 5 950,000 950,000 950,000Guatemala 2,278 4,301 3,317 3,000 e 3,100Hungary 17,000 16,000 15,000 30,400 r 30,000Indonesiae 840 5 5,213 5 5,000 5,000 5,000Iran7 83,279 64,957 70,000 80,000 r 80,000Italy 592,000 500,000 500,000 e 500,000 e 500,000Kenya NA -- 64 50 r 50Japan 443,566 428,247 415,115 405,738 r 400,000Macedoniae 30,000 30,000 30,000 30,000 30,000Mexico 185,729 208,611 269,730 415,133 r 400,000Morocco 33,311 r 36,528 43,152 r 71,741 r 65,754 5
Mozambique 10,448 r 10,828 16,144 1,611 r 1,600New Zealand, processede 14,000 15,000 5 10,000 10,000 7,800 5
Pakistan 14,196 15,349 27,700 27,000 e 28,000Peru 19,563 19,659 21,059 18,217 18,200Philippines 3,900 1,844 2,800 r 5,128 r 5,500Poland8 5,400 5,000 29,700 r 29,000 r 30,000Romania 25,434 19,577 35,789 24,779 r 15,402 5
Serbia and Montenegro 68 77 75 e 75 e 75South Africa9 48,382 50,363 85,187 116,384 218,512 5
Spaine 150,000 150,000 5 150,000 150,000 150,000Tanzaniae -- r -- r -- r -- r --Turkey 565,708 899,614 636,273 600,000 600,000Turkmenistane 50,000 50,000 50,000 50,000 50,000Ukrainee 300,000 300,000 300,000 300,000 300,000United States 3,820,000 4,070,000 3,760,000 3,970,000 r 3,970,000 5
Zimbabwe9 135,785 140,000 140,000 e -- --Total 10,600,000 10,400,000 10,200,000 10,200,000 r 10,300,000
TABLE 25BENTONITE: WORLD PRODUCTION, BY COUNTRY1, 2
(Metric tons)
eEstimated. rRevised. NA Not available. -- Zero.1World totals, U.S. data, and estimated data are rounded to no more than three significant digits; may not add to totals shown.2Table includes data available through August 21, 2003.
7Year beginning March 21 of that stated.8Montmorillite type bleaching clay.9May include other clays.
3In addition to the countries listed, Canada and China are believed to produce bentonite, but output is not reported, and availableinformation is inadequate to make reliable estimates of output levels.4Includes bentonitic clays.5Reported figure.6Does not include Armenia, Georgia, Turkmenistan, and Ukraine, for which data are available and reported separately in this table.

18.26 U.S. GEOLOGICAL SURVEY MINERALS YEARBOOK—2002
Country2 1998 1999 2000 2001 2002e
Algeria 3,942 2,489 3,431 3,254 r 3,521 3
Argentinae 1,500 1,500 1,500 1,500 1,500Australia, attapulgite 15,670 5,639 5,600 r 5,600 r 6,000Germany, unprocessede 500,000 500,000 500,000 500,000 500,000Italye 30,000 30,000 30,000 30,000 30,000Mexico 48,016 47,522 51,685 148,194 r 150,000Morocco, smectite 27,650 21,956 30,665 40,664 r 42,243 3
Pakistan 14,659 15,565 15,288 15,000 e 15,000Senegal, attapulgite 80,000 e 136,000 131,000 130,000 e 176,454 3
South Africa, attapulgite 7,830 e 7,067 7,337 9,229 7,990Spain, attapulgitee 90,000 90,000 90,000 90,000 90,000United Kingdome, 4 140,000 140,000 140,000 140,000 140,000United States5 2,420,000 2,560,000 2,910,000 2,890,000 2,730,000 3
Total 3,380,000 3,560,000 3,920,000 4,000,000 r 3,890,000
2In addition to the market economy countries listed, France, India, Iran, Japan, and Turkey have reportedly produced fuller's earth in thepast and may continue to do so, but output is not reported, and available information is inadequate to make reliable estimates of output levels.3Reported figure.4Salable product.5Sold or used by producers.
TABLE 26FULLER'S EARTH: WORLD PRODUCTION, BY COUNTRY1
(Metric tons)
eEstimated. rRevised.1Excludes centrally planned economy countries and former such countries, some of which presumably produce fuller's earth, but forwhich no information is available. Table includes data available through August 21, 2003.
Country3 1998 1999 2000 2001 2002e
Algeria 13,640 16,833 11,616 13,356 r 9,505 4
Argentina 46,832 52,665 34,023 r 42,659 r 36,259 4
Australia, includes ball claye 180,000 200,000 220,000 220,000 230,000Austria, marketablee 60,000 50,000 50,000 50,000 50,000Bangladeshe, 5 7,500 7,700 7,900 8,000 8,100Belgiume 300,000 300,000 300,000 300,000 300,000Bosnia and Herzegovinae 3,000 3,000 3,000 3,000 3,000Brazil, beneficiated 1,373,892 1,516,700 1,639,673 r 1,817,419 r 1,820,000Bulgaria 73,700 97,500 108,000 100,000 e 100,000Burundi 3,500 1,597 1,500 -- --Chile 11,530 4,361 6,445 5,300 6,164 4
Colombia, includes common claye 8,000,000 8,000,000 4 8,400,000 8,500,000 8,500,000Czech Republic 3,049,000 5,183,000 5,573,000 5,500,000 e 5,500,000Denmark, salese 2,500 2,500 2,500 2,500 r 2,500Ecuador 7,000 e 20,652 11,022 8,818 9,000Egypt 285,497 290,000 290,000 300,000 e 300,000Eritrea 3,809 1,138 943 588 r 250 4
Ethiopia 378 681 1,654 1,790 e 1,800France, marketable 330,000 e 325,000 300,000 300,000 e 300,000Germany 1,800,000 e 1,800,000 1,800,000 1,800,000 e 1,800,000Greece 60,000 e 60,000 60,000 60,000 e 60,000Guatemalae 7,150 61 77 100 100Hungary, processede 7,000 7,000 7,000 7,000 7,000India:
Processed 148,000 150,000 160,000 170,000 e 170,000Salable crude 540,000 520,000 530,000 540,000 e 540,000
TABLE 27KAOLIN: WORLD PRODUCTION, BY COUNTRY1, 2
(Metric tons)
See footnotes at end of table.

CLAY AND SHALE—2002 18.27
Country3 1998 1999 2000 2001 2002e
Indonesia 8,567 21,389 15,000 e 15,000 e 15,000Iran 582,485 837,277 850,000 r 800,000 e 800,000Israele 27,000 20,000 13,000 -- r --Italy, kaolinitic earthe 9,000 9,000 10,000 10,000 10,000Japan 83,257 53,092 25,739 19,976 r 19,000Jordan 78,000 34,040 36,795 38,000 e 41,000Kazakhstane 60,000 70,000 70,000 70,000 70,000Kenya 500 e 192 793 700 r 700Korea, Republic of 2,259,809 1,858,359 2,097,450 2,383,833 2,831,027 4
Madagascare 200 r 120 r 170 r 170 r 50Malaysia 198,930 213,973 233,885 364,458 r 258,273 4
Mexico 339,013 489,993 532,268 681,709 r 680,000New Zealand 26,000 16,700 r 16,300 r 15,000 r 16,000Nigeriae 110,000 110,000 4 110,000 110,000 110,000Pakistan 70,777 64,692 49,574 50,000 e 50,000Paraguay 66,700 66,600 66,500 66,500 e 66,700Peru 4,968 1,332 6,165 5,532 5,500Poland, washed 82,450 e 88,792 100,756 129,123 142,000Portugale 180,000 175,000 175,000 175,000 175,000Romania 24,724 25,456 19,007 21,867 r 22,514 4
Russia, concentrate 50,000 40,600 45,000 45,000 e 45,000Serbia and Montenegro:
Crude 75,092 40,321 39,475 60,900 r 60,000Washede 7,000 3,000 4,000 10,000 r 10,000
Slovakia 28,000 22,000 32,000 30,000 e 30,000Slovenia:e
Crude 10,000 10,000 10,000 10,000 10,000Washed 4,000 4,000 4,000 4,000 4,000
South Africa 138,300 122,400 98,897 85,556 91,380 4
Spain, marketable, crude and washede, 6 300,000 320,000 365,000 4 350,000 350,000Sri Lanka 11,110 12,573 12,230 9,403 r 8,613 4
Swedene 450 450 -- r -- r --Tanzania -- r -- r -- r -- r --Taiwan -- 171 409 147 --Thailand, beneficiated 248,461 113,005 201,226 168,063 r 165,000Turkey 403,733 449,954 r 400,000 600,000 e 600,000Uganda NA 198 14 90 90Ukraine 201,670 221,526 225,000 e 225,000 e 225,000United Kingdom, sales7 2,391,595 2,303,607 2,420,000 2,400,000 e 2,400,000United States8 9,640,000 9,160,000 8,800,000 8,110,000 8,010,000 4
Uzbekistane 5,500,000 5,500,000 5,300,000 5,500,000 5,500,000Venezuela 4,000 12,000 -- -- --Vietname 350,000 r 398,000 r 520,000 r 600,000 r 600,000
Total 39,900,000 r 41,500,000 r 42,800,000 r 42,900,000 r 43,200,000eEstimated. rRevised. NA Not available. -- Zero.
TABLE 27--ContinuedKAOLIN: WORLD PRODUCTION, BY COUNTRY1, 2
(Metric tons)
1World totals, U.S. data, and estimated data are rounded to no more than three significant digits; may not add to totals shown.2Table includes data available through August 21, 2003.3In addition to the countries listed, China, Morocco, and Suriname may also have produced kaolin, but information is inadequate to makereliable estimates of output levels.
8Kaolin sold or used by producers.
4Reported figure.5Data for year ending June 30 of that stated.6Includes crude and washed kaolin and refractory clays not further described.7Dry weight.