claude resources inc. q1 2015 conference call and webcast
TRANSCRIPT

Q1 2015 Earnings Call
May 8,2015

2
Cautionary Note Regarding Forward-Looking InformationThis document contains certain forward-looking statements relating but not limited to the Company’s expectations, intentions, plans and beliefs.Forward-looking information can often be identified by forward-looking words such as “anticipate”, “believe”, “expect”, “goal”, “plan”, “intent”,“estimate”, “may” and “will” or similar words suggesting future outcomes or other expectations, beliefs, plans, objectives, assumptions, intentions orstatements about future events or performance. Forward-looking information may include reserve and resource estimates, estimates of futureproduction, unit costs, costs of capital projects and timing of commencement of operations, and is based on current expectations that involve anumber of business risks and uncertainties. Factors that could cause actual results to differ materially from any forward-looking statement include,but are not limited to, failure to establish estimated resources and reserves, the grade and recovery of mined ore varying from estimates, capitaland operating costs varying significantly from estimates, delays in obtaining or failures to obtain required governmental, environmental or otherproject approvals, inflation, changes in exchange rates, fluctuations in commodity prices, delays in the development of projects and other factors.Forward-looking statements are subject to risks, uncertainties and other factors that could cause actual results to differ materially from expectedresults.
Potential shareholders and prospective investors should be aware that these statements are subject to known and unknown risks, uncertainties andother factors that could cause actual results to differ materially from those suggested by the forward-looking statements. Shareholders arecautioned not to place undue reliance on forward-looking information. By its nature, forward-looking information involves numerous assumptions,inherent risks and uncertainties, both general and specific, that contribute to the possibility that the predictions, forecasts, projections and variousfuture events will not occur. Claude Resources undertakes no obligation to update publicly or otherwise revise any forward-looking informationwhether as a result of new information, future events or other such factors which affect this information, except as required by law.
Cautionary Note to U.S. Investors Concerning Resource EstimateThe resource estimates in this document were prepared in accordance with National Instrument 43-101, adopted by the Canadian SecuritiesAdministrators. The requirements of National Instrument 43-101 differ significantly from the requirements of the United States Securities andExchange Commission (the “SEC”). In this document, we use the terms “measured”, “indicated” and “inferred” resources. Although these terms arerecognized and required in Canada, the SEC does not recognize them. The SEC permits U.S. mining companies, in their filings with the SEC, todisclose only those mineral deposits that constitute “reserves”. Under United States standards, mineralization may not be classified as a reserveunless the determination has been made that the mineralization could be economically and legally extracted at the time the determination is made.United States investors should not assume that all or any portion of a measured or indicated resource will ever be converted into “reserves”.Further, “inferred resources” have a great amount of uncertainty as to their existence and whether they can be mined economically or legally, andUnited States investors should not assume that “inferred resources” exist or can be legally or economically mined, or that they will ever be upgradedto a higher category.
Cautionary Statement

3
Key Highlights
Record quarterly gold production of 21,067 86% increase vs. Q1 2014
Mill head grade of 10.17 g/t 77% increase vs. Q1 2014
Santoy Gap deposit ramp up on pace to achieve 500 tonnes per day
Total cash cost per ounce of gold sold (1) of $675 (U.S. $544) 31% decrease vs.
Q1 2014
All-in sustaining cost per ounce of gold sold (1) of $1,374 (U.S. $1,107) 28%
decrease vs. Q1 2014
Net profit of $5.1 million, or $0.03 per share, a $10.2 million improvement from
Q1 2014
(1) See description and reconciliation of non-IFRS financial measures in the “Non-IFRS Financial Measures and Reconciliations” section of the Company’s Q1 2015 MD&A.
Delivered record production & lower costs
4
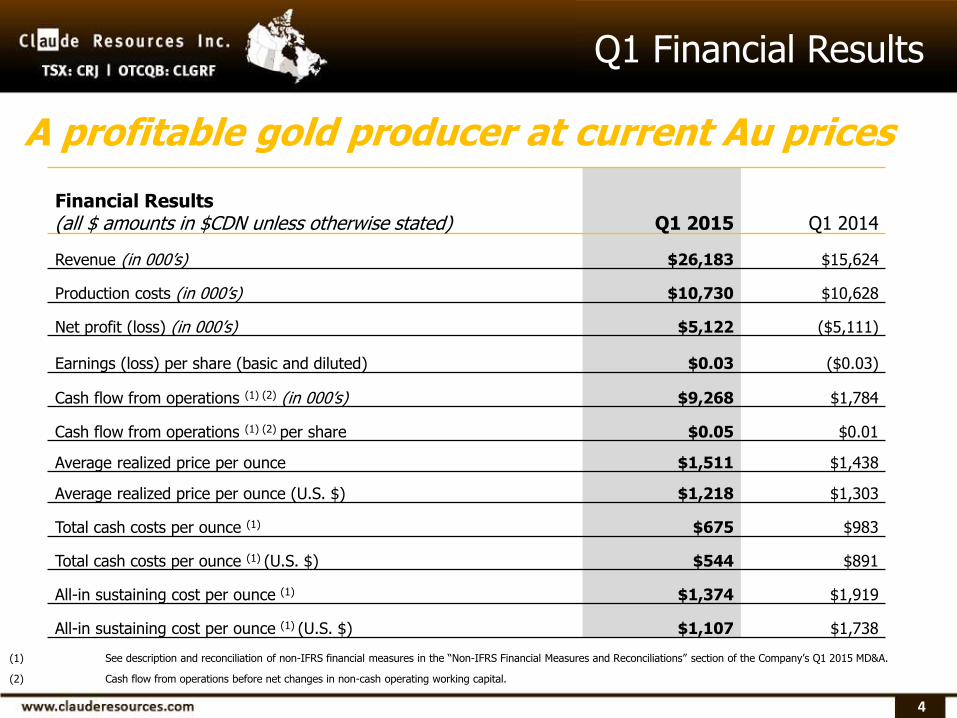
Q1 Financial Results
(1) See description and reconciliation of non-IFRS financial measures in the “Non-IFRS Financial Measures and Reconciliations” section of the Company’s Q1 2015 MD&A.
(2) Cash flow from operations before net changes in non-cash operating working capital.
Financial Results(all $ amounts in $CDN unless otherwise stated) Q1 2015 Q1 2014
Revenue (in 000’s) $26,183 $15,624
Production costs (in 000’s) $10,730 $10,628
Net profit (loss) (in 000’s) $5,122 ($5,111)
Earnings (loss) per share (basic and diluted) $0.03 ($0.03)
Cash flow from operations (1) (2) (in 000’s) $9,268 $1,784
Cash flow from operations (1) (2) per share $0.05 $0.01
Average realized price per ounce $1,511 $1,438
Average realized price per ounce (U.S. $) $1,218 $1,303
Total cash costs per ounce (1) $675 $983
Total cash costs per ounce (1) (U.S. $) $544 $891
All-in sustaining cost per ounce (1) $1,374 $1,919
All-in sustaining cost per ounce (1) (U.S. $) $1,107 $1,738
A profitable gold producer at current Au prices

5
Stronger Balance Sheet
De-risked balance sheet & improved financial structure
Debt reduction through $300,000/month principal payments ($3.6 million annually)
Strong liquidity position with $15.4 million in cash and an undrawn line of credit of up to $8.5 million
Balance sheet strength and debt reduction remain a key priority
All amounts in $CDN millions March 31, 2015 March 31, 2014
Long Term Debt $21.7 $25.0
Line of Credit - $1.2
Short Term Loans - $2.3
Total debt $21.7 $28.5
Cash $15.4 -
Net debt ($6.3) ($28.5)

6
Strong Start to 2015
Set new quarterly gold production record in Q1 2015
Excellent results in what is typically our most challenging quarter
Driven by mine sequencing and by higher grades from L62 and Santoy Gap
Future head grade to come more in-line with reserve grades
Production Statistics Q1 2015 Q1 2014 Change
Tonnes Milled 67,249 64,370 4%
Head Grade (g/t) 10.17 5.76 77%
Recovery 95.8% 95.1% 1%
Gold Ounces
Produced 21,067 11,344 86%
Sold 17,326 10,865 59%

7
Seabee Mine (L62 Deposit)
Illustration of Alimak Mining process
• Alimak mining method continues to perform well – dilution rates continue to be below budget
• Q1 performance driven by:
• Positive reconciliation on grade and ounces versus budget
• Mine sequencing – developed stope in Q4 2014 was milled in Q1 2015
• Forecast to be 40% of 2015 annual gold production tonnage
Faster, Cheaper More Productive
L62: The source of higher grade ore
Seabee Mine – L62 Deposit

Santoy Gap
• Production to date – over 87,500 tonnes @ 8.18 g/t
• On pace to achieve 500 tonnes per day
• Forecast to be 60% of 2015 annual gold production tonnage
• Infrastructure upgrades on-going to ramp up to 600-700 tonnes per day
2015 Production
2014 Production
Higher Grade + Wider Veins = More Ounces Per Vertical Metre
8

9
Prospective Gold Camp
• Large land position – 17,200 Hectares
• Control the entire greenstone belt
• Underexplored gold camp
• Well established infrastructure
• 35,000 m drill program at Seabee• 15,000 m of exploration (surface and underground)
• 35,000 m underground drill program at Santoy
• Follow up on hole 692: 18.8 g/t over 13.86 m

10
2015 Outlook
Gold production of 60,000 to 65,000 ounces
Unit cash costs – CDN $785 to $850 per ounce (includes NSR royalty)
All in sustaining costs – CDN $1,175 to $1,275 per ounce
Expected FCF in 2015 @ CDN $1,300 Au/oz (U.S. $1,040 Au/oz*)
Our performance & profitability is sustainable
Our focus will remain on cost containment, margins and production growth
*Assuming U.S./CDN exchange rate of $0.80

11
(1) See footnotes located on page 17
Claude Resources Inc.Experience. Stability. Potential.
Creating the Capacity to
Discover. Develop. Deliver.
TSX: CRJ OTCQB: CLGRF
200 – 219 Robin CresSaskatoon, Saskatchewan, S7L 6M8Canada
P. 306.668.7505F. 306.668.7500E: [email protected]

12
Appendix A: Executive Team
Brian Skanderbeg, P.Geo.
President &CEO
Mr. Skanderbeg joined the Company in April 2007.He was appointed as President & CEO in November2014. Prior to his current position, he was the Sr.VP and COO. He previously worked for Goldcorp,Inco Ltd. and Helio Resources, holding positions inboth exploration and operations. He holds a B.Sc.from the University of Manitoba, an M.Sc. fromRhodes University, South Africa and bringsextensive experience in gold systems, operationalmanagement, cost and asset optimization as wellas strategic analysis.
Rick Johnson, CPA, CA
Chief Financial OfficerVice President Finance
Mr. Johnson joined Claude Resources in 1996. Hewas appointed to his present position in 2004,having previously served as Company Controller. Mr.Johnson holds a Bachelor of Commerce degreefrom the University of Saskatchewan and is amember of the CPA Canada.
13
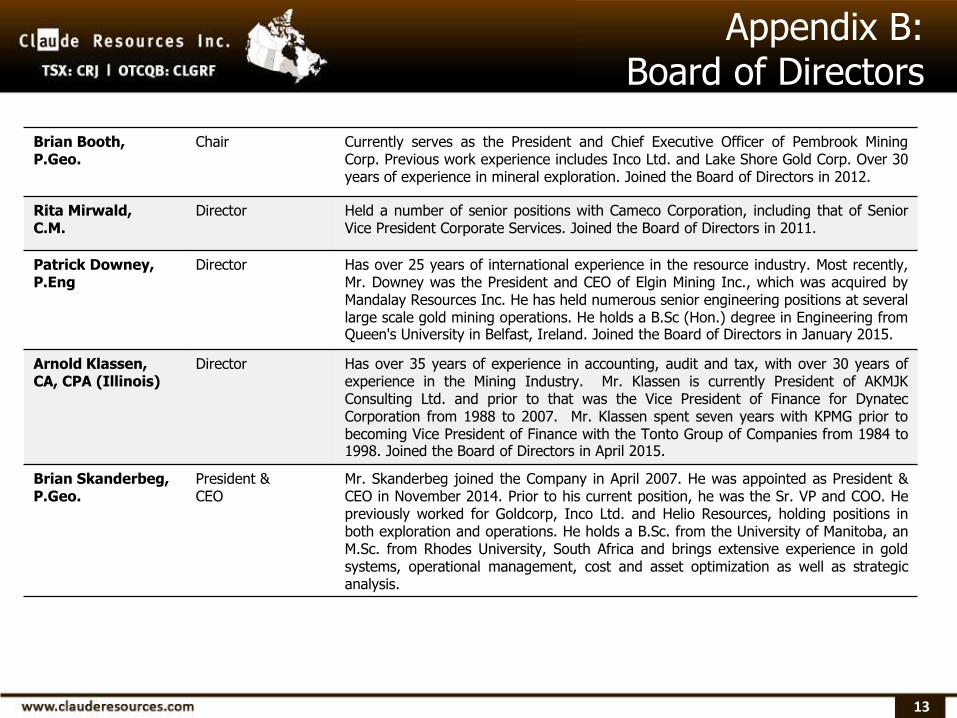
Appendix B: Board of Directors
Brian Booth, P.Geo.
Chair Currently serves as the President and Chief Executive Officer of Pembrook MiningCorp. Previous work experience includes Inco Ltd. and Lake Shore Gold Corp. Over 30years of experience in mineral exploration. Joined the Board of Directors in 2012.
Rita Mirwald, C.M.
Director Held a number of senior positions with Cameco Corporation, including that of SeniorVice President Corporate Services. Joined the Board of Directors in 2011.
Patrick Downey, P.Eng
Director Has over 25 years of international experience in the resource industry. Most recently,Mr. Downey was the President and CEO of Elgin Mining Inc., which was acquired byMandalay Resources Inc. He has held numerous senior engineering positions at severallarge scale gold mining operations. He holds a B.Sc (Hon.) degree in Engineering fromQueen's University in Belfast, Ireland. Joined the Board of Directors in January 2015.
Arnold Klassen, CA, CPA (Illinois)
Director Has over 35 years of experience in accounting, audit and tax, with over 30 years ofexperience in the Mining Industry. Mr. Klassen is currently President of AKMJKConsulting Ltd. and prior to that was the Vice President of Finance for DynatecCorporation from 1988 to 2007. Mr. Klassen spent seven years with KPMG prior tobecoming Vice President of Finance with the Tonto Group of Companies from 1984 to1998. Joined the Board of Directors in April 2015.
Brian Skanderbeg, P.Geo.
President &CEO
Mr. Skanderbeg joined the Company in April 2007. He was appointed as President &CEO in November 2014. Prior to his current position, he was the Sr. VP and COO. Hepreviously worked for Goldcorp, Inco Ltd. and Helio Resources, holding positions inboth exploration and operations. He holds a B.Sc. from the University of Manitoba, anM.Sc. from Rhodes University, South Africa and brings extensive experience in goldsystems, operational management, cost and asset optimization as well as strategicanalysis.