classifying breast cancer by using decision tree … · ... j. and kamber,m ... and witten i. 2016....
TRANSCRIPT

Classifying Breast Cancer By Using
Decision Tree Algorithms

Nusaibah AL-SALIHY,
Turgay IBRIKCI (Presenter)
Cukurova University, TURKEY

What Is A Decision Tree?
Why A Decision Tree?
Why Decision TreeClassification?
Dataset And Features
What Is A Classification?
Classify By Decision Tree?
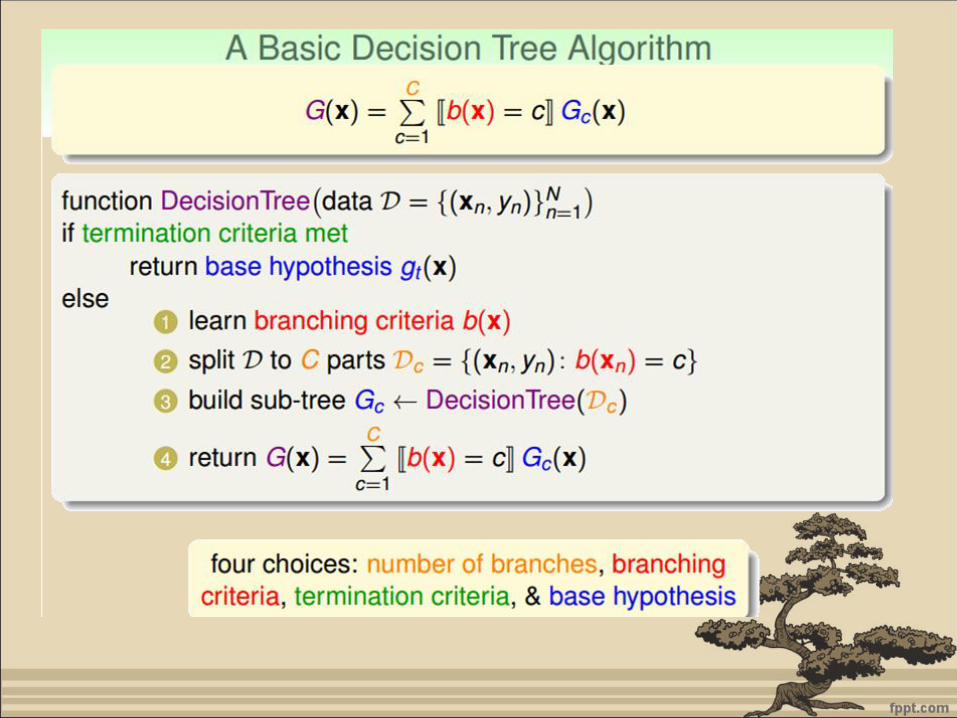
A Basic Decision Tree Algorithms
Decision Tree Algorithms
Some Measures Applied In B.C Dataset
Conclusion
Selected References

What is a Decision Tree?
An characterized by the inference of general laws from particular
instances learning task.
Use specific facts to draw more popularize conclusions
A predictive model according on a branching series of logical
and arithmetic test.
These smaller tests are less complex than a one-stage classifier
because, decision tree break-down a dataset into smaller and
smaller sets whilst keeping in the same time linked decision tree is
gradually progressing.

Block diagram for decision tree
Where:-
A. Nodes of the tree
B. Leaves nodes of the tree /
(terminal nodes)
C. Branches of the tree / (decision
point)
Root node
AA
BBBB
C
Figure 1. Simple model for decision tree

Why Decision Tree Classification
• Decision trees are a simple and soft, also very powerful form of
diversified variable analysis.
•Obtain similar and sometimes better accuracy compared to other
models
•Their outcomes are interpretable.
•They do not need any special parameters.
•The construction process is comparatively fast.
•Decision Tree is excessively used by many researchers in healthcare
field.
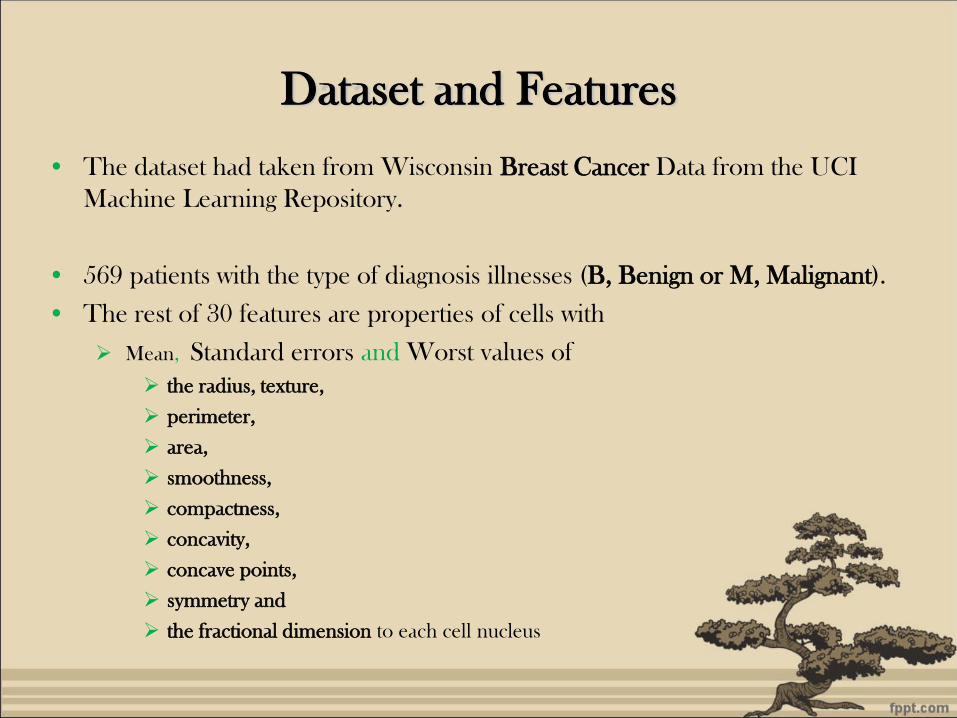
Dataset and Features
• The dataset had taken from Wisconsin Breast Cancer Data from the UCI
Machine Learning Repository.
• 569 patients with the type of diagnosis illnesses (B, Benign or M, Malignant).
• The rest of 30 features are properties of cells with
Mean, Standard errors and Worst values of
the radius, texture,
perimeter,
area,
smoothness,
compactness,
concavity,
concave points,
symmetry and
the fractional dimension to each cell nucleus

Description of dataset included types, no. of attributes, instances and classes.
Dataset
Characteristics
Multivariate No. of
Attributes: 31
Attribute
Characteristics
Real No. of
Instances: 569
Associated Tasks Classification No. of Classes: 2
Dataset
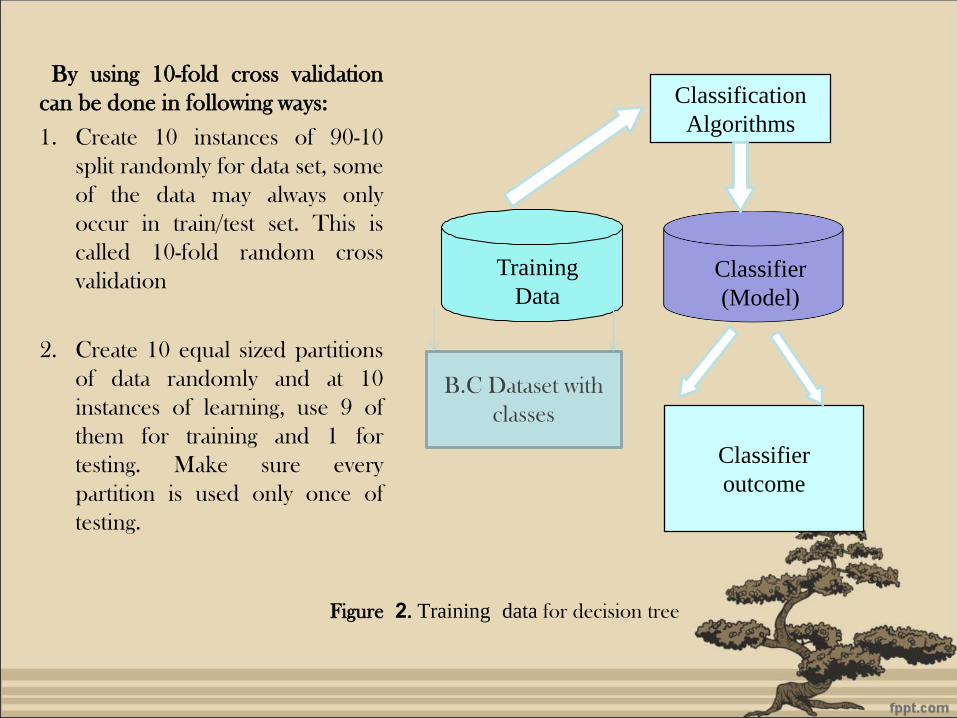
Figure 2. Training data for decision tree
By using 10-fold cross validation
can be done in following ways:
1. Create 10 instances of 90-10
split randomly for data set, some
of the data may always only
occur in train/test set. This is
called 10-fold random cross
validation
2. Create 10 equal sized partitions
of data randomly and at 10
instances of learning, use 9 of
them for training and 1 for
testing. Make sure every
partition is used only once of
testing.
Training
Data
Classification
Algorithms
Classifier
(Model)
Classifier
outcome
B.C Dataset with
classes

Decision Tree Algorithms J48 Algorithm
•J48 it’s one of widespread decision
tree algorithms, because it’s actives
with specific attributes, lost or missed
values of the dataset
•By J48 can be increased a precision
by pruning .
•To classify a dataset by a perfectly
as possible, J48 algorithm builds
decision trees for data from a set of
training data.
Figure 3 Result J48 via
Weka
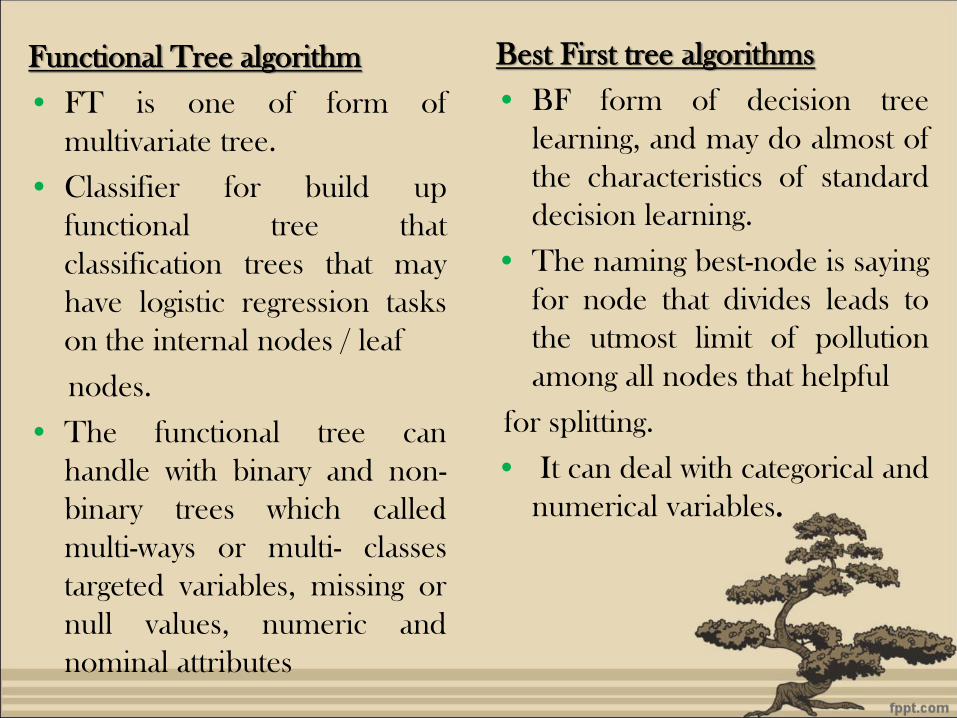
Best First tree algorithms
• BF form of decision tree
learning, and may do almost of
the characteristics of standard
decision learning.
• The naming best-node is saying
for node that divides leads to
the utmost limit of pollution
among all nodes that helpful
for splitting.
• It can deal with categorical and
numerical variables.
Functional Tree algorithm
• FT is one of form of
multivariate tree.
• Classifier for build up
functional tree that
classification trees that may
have logistic regression tasks
on the internal nodes / leaf
nodes.
• The functional tree can
handle with binary and non-
binary trees which called
multi-ways or multi- classes
targeted variables, missing or
null values, numeric and
nominal attributes
Alternating Decision Tree Algorithm
• AD created by Yoav Freund and
Llew Mason.
• AD includes two types nodes are
decision / forecast nodes.
• Each decision-node contains a
division test, whereas all forecast
nodes contain a real number for
valued.
Decision Stump Algorithm
• A D.S is fundamentally a decision
tree with only one single split.
• A tree in this algorithm divided at
the root-level, which depend on a
specified feature value pair.
• Sometimes D.S called 1-rule.
Random Forest Tree Algorithm
• RF called random decision forest.
• RF classifier is data mining method
developed by Beriman that is fast in
learning and, runs efficiently in big
datasets.
• RF increasingly for ML because RF
offers two aspects that are very useful in
data mining: high forecasting accuracy
and new information on variable
importance for classification methods .

Evaluation Metrics Applied in B.C Data Set

• Precision(Specificity): is a measure of true postive rate accuracy. It is ration
of the true positive-number to total number for forecasted positive samples
(1)
• Recall(Sensivity) : is measure of accuracy. It is the proportion of positive
samples that were correctly identified to the total number of positive
samples. It is also known as sensitivity or true positive rate (TPR).
(2)
• Accuracy: is a measure of ratio for correctly forecasting.
(3)
• F-Measure: is the mean of precision t and recall. It is an important measure
as it gives equal importance to accuracy and recall.
(4)

Decision Tree Precision Recall F-
Measure
ROC
Curve
FT 0.977 0.977 0.977 0.990
J48 0.934 0.933 0.933 0.931
RF 0.967 0.967 0.967 0.989
DS 0.891 0.889 0.887 0.874
AD 0.940 0.940 0.940 0.985
BF 0.930 0.930 0.930 0.938
Receiver Operating
Characteristic
(ROC) Curve is effective
method of evaluating the quality
or performance of diagnostic
tests. TPR is plotted along the y
axis and FP is plotted along the x
axis.Figure 4. Comparison of D.T by Line chart according
to Precision, Recall, F-Measure, and ROC Curves
Table 2. Comparison of D.T classification algorithms

Figure 5.Performance correct instances analysis (Accuracy) in percentage values by Line chart
Algorithms Accuracy
FT 97.7%
J48 93.1%
RF 96.6%
DS 88.0%
AD 94.0%
BF 92.0%
Table 3. Accuracy percentage of test instances D.T algorithms to
and best / worst percentage

.
Figure 6. The taken time to test model on training/testing data for each D.T algorithms
Algorithms Time (sec. )
FT 0.03
J48 0.22
RF 0.15
DS 0.13
AD 0.11
BF 0.04
Table 4 Shows time taken to test model on training / testing data
for each D.T algorithms
Conclusions• Decision Trees could be deal with multidimensional dataset.
• Depending on precision for J48, FT, AD, Random Forest,
BF and Decision stump algorithms using different precision
measures part.
• The experiential results showed that highest precision 97.7%
found in FT classifier with highest correctly numbers instance
(550) but, precision 88% is found in Decision stump with
lowest correctly numbers instance (509).

• Quinlan, J. R.1986. Induction of Decision Trees.Mach. Learn., 81-106.
• Cobain EF, Hayes DF. 2015. Indications for prognostic gene expression profiling in early breast
cancer. Curr. Treat Options Oncol.16(5):23.
• Sharma,P., Ratnoo,S. 2014, A review on Discovery of Classification Rules using Pittsburgh
Approach, Int. J. Artif. Intell. Know l. Discov., 4(3): 16.
• Han, J. and Kamber,M. 2001. Data Mining: Concepts and Techniques, Morgan Kaufmann.
• Breiman, L., 2001. Random forests, Machine Learning 45(1), 5-32.
• Iba, W.; and Langley, P. 1992; Induction of One-Level Decision Trees, in ML92: Proceedings
of the Ninth Int. Conf. on Mach. Learn, 233–240.
• Holte, Robert C. 1993. Very Simple Classification Rules Perform Well on Most Commonly
Used Datasets, Machine Learning. 11:63-91.
• Frank, E., Hal, M. A., and Witten I. 2016. The WEKA Workbench. Online Appendix for Data
Mining: Practical Machine Learning Tools and Techniques, Morgan Kaufman.
• UCI Machine Learning Repository: 1995. Center for Mach. Learn. and Intelligent Systems.
Breast cancer Wisconsin (diagnostic) dataset.
• Buck,Carol J. 2016. Step-by-Step Medical Coding, Elsevier Health Sciences (Book).
Selected References
