classification of virgin and virgin-recycled fiber …2016)/p.301-309.pdf · fiber or recycled...
TRANSCRIPT
CELLULOSE CHEMISTRY AND TECHNOLOGY
Cellulose Chem. Technol., 50 (2), 301-309 (2016)
CLASSIFICATION OF VIRGIN AND VIRGIN-RECYCLED FIBER BLEND
HYGIENIC TISSUE PAPER BY MULTIVARIATE ANALYSIS
LI-PING XIN,
* XIN-SHENG CHAI,
*,** HUI-CHAO HU,
* CHUN-XIA CHEN
** and
RUN-QUAN CHEN**
*State Key Laboratory of Pulp and Paper Engineering, South China University of Technology, Guangzhou,
China **
National Paper Products Quality Supervision Inspection Center, Dongguan, China ✉Corresponding author: Xin-Sheng Chai, [email protected]
Received October 9, 2014
This paper presents an application of multivariate analysis for classing virgin and non-virgin tissue paper products. The
brightness, fluorescent whiteness, fiber fibrillation and effective residual ink concentration of commercial tissue paper
products were measured according to ISO standard methods. Based on these parameters, the multivariate analysis
techniques, i.e., principal component analysis (PCA) performed on the preliminary study of the data set structure, soft
independent modeling of class analogy (SIMCA), and partial least square discriminant analysis (PLS-DA), were used
to develop classification models. The results showed that the PLS-DA model provided better classification in the
applications.
The present method is simple and accurate. It is suitable for use in quality control testing of tissue papers during the
manufacturing, as well as in the analysis of point-of-sale samples from commercial markets.
Keywords: tissue paper, virgin fiber, recycled fiber, multivariate analysis
INTRODUCTION
Hygienic tissue paper refers to a class of soft,
absorbent, disposable papers and is commonly used
for facial tissue (paper handkerchiefs), napkins,
bathroom tissue and household towels. This kind of
tissue products can be made from 100% chemical
pulp (virgin fiber) to 100% recycled fiber or a
combination of the two. Typically, a chemical pulp
with longer fiber length is introduced to improve
the product strength. Although the utilization of
recycled fiber can significantly reduce the use of
raw material and energy in tissue paper production,1
some toxic substances, such as mineral oils and
heavy metals, remain in the recycled fibers and
could contaminate the new products.2-4
Another
common practice amongst the paper mills is the
addition of a fluorescent whitening agent (also toxic)
in order to offset the effect of residual ink in
recycled fiber on the paper brightness.5,6
Therefore,
the use of recycled fiber in the production of
hygienic tissue paper poses a risk for users to
potentially come in contact with these harmful
substances. Both EU and US have established
regulations around the limit of these harmful
substances, such as organochlorine, formaldehyde,
dyes, inks, and heavy metals.7,8 The procedures
involved in these tests are very complicated and
time consuming. As a result, there is still a risk to
use the recycled fiber added products because of
the presence of many unidentified harmful
substances. Therefore, some countries and districts9
have resorted to establishing regulations that forbid
the use of recycled fiber in the production of the
tissue papers that are used for personal cleaning and
hygienic purpose, typically facial tissue. In order to
validate whether point-of-sales samples are
following regulations, an effective method to
identify the presence of recycled fiber used in these
tissue products is needed.
Considering the features of recycled fiber,1,10
there are several parameters, such as fibrillation,
LI-PING XIN et al.
302
ink content, brightness, fluorescent strength and
others, that are widely used for checking if the
products are made from recycled fibers. However,
in many cases the portion of recycled fiber blended
into the products is very small and as a result makes
detection very difficult. There are also some minor
contaminations because the labeled ink or
fluorescent substances when using commercial pulp
board or the process are different for different
products. Therefore, based on the single parameter
mentioned above, it is difficult to judge if the
products are truly virgin fiber made or not.
Moreover, it is also hard to develop a mathematical
equation that can provide a quantitative relationship
between the product types (i.e., made from virgin
fiber or recycled fiber blend) and these tested
parameters.
Compared with the traditional approaches,
multivariate analysis (also called chemometrics)
methods11
have been found to be very useful for the
classification analysis in many areas.12-14
Multivariate analysis allows valuable information
to be extracted from multivariate data arrays, which
are difficult to handle using classical univariate
statistical methods. They were successfully used in
many complex case studies, such as in food
classification, environmental monitoring and
papermaking process,15-17
in which there were
multiple parameters whose interpretation is far
from simple. Multivariate analysis methods provide
tools for finding relationships between groups of
analyzed samples and/or related variables or
parameters.18,19 Therefore, multivariate analysis
should be capable to be used for the classification
of virgin and virgin-recycled fiber blend hygienic
tissue paper products.
The aim of the present study was to a develop
multivariate analysis method for the classification
of virgin and virgin-recycled fiber blend tissue
paper products, based on the traditional parameters
in the paper testing, including fluorescent strength,
brightness, residual ink content, and so on.
Multivariate analysis techniques were attempted in
the classification investigation.
EXPERIMENTAL
Samples and the parameters tested
56 samples of tissue papers and relevant base papers
and pulps from nine manufacturers (A to I) were
obtained from different production sections and 11
samples were prepared in our laboratory according to a
known recipe. The samples were divided into two groups
(i.e., virgin fiber only and virgin-recycled fiber blend)
and detailed information on the samples is provided in
Table 1. The related parameters, i.e., fluorescence
intensity, brightness, fluorescent whiteness, effective
residual ink concentration (ERIC), and fiber fibrillation
of the samples, were tested using standard methods.20-23
The testing apparatus included a UV analyzer (ZF-1,
SHANGHAI GUCUN OPTIC INSTRUMENT
FACTORY, Shanghai, China), a Digital Whiteness meter
(SE071, Lorentzen & Wettre, Shanghai, China) and a
Fiber analyzer (XWY-V1, Huazhi Technology Co. Ltd.,
Zhuhai, China).
Methods in multivariate analysis
Principal components analysis (PCA)
In multivariate analysis, PCA (unsupervised pattern
recognition) is often the first step of exploratory data
analysis to detect groups in the measured data. PCA is
also a very effective data reduction technique that can
provide low-dimensional representations (using
extracted orthogonal PCs) of complex datasets through a
visually interpretable score plot and a loading plot.24
The
scores are the projections of the original data onto the
new vector space, defined by PCs. The score plot shows
that the observations cluster in different groups.
Loadings are the weights to quantify how much of each
of the original variables are used to define each PC, and
with which original variables to form the scores. The
loading plot is also able to show the correlation structure
between the variables.
Soft independent modeling of class analogy (SIMCA)
SIMCA (supervised pattern recognition) is a
commonly used class-modeling technique based on
disjoint PCA modeling realized for each class in the
calibration set. For unknown samples, they are compared
to the class models and assigned to classes according to
their analogy with the calibration samples.
In SIMCA, the model distance critical limit (D-Crit)
is used for classing new samples and D-Crit is calculated
using an inverse cumulative F-distribution function.25
The normalized distances to model (DMod (Norm)) for
samples in the calibration set (workset) or in the
prediction set26,27
are respectively calculated by the
following equations, i.e.,
( ) ( )
2
1
2
1 1
0
×
×
K
ik
k
N K
ik
i k
e
K ADModX
e
N A A K A
ν=
= =
−=
− − −
∑
∑∑
, 1
N
N Aν =
− −
(1)
and
Paper
303
( ) ( )
2
1
2
1 1
0×
K
ik
k
N K
ik
i k
e
K ADModXPS
e
N A A K A
=
= =
−=
− − −
∑
∑∑
(2)
where K = number of X variables; A = number of
components in the model or the selected number of
components; eik = X-residuals of sample i; v is a
correction factor (function of the number of observations
and the number of components) and is slightly larger
than one; A0 = 1 if model is centered, 0 otherwise; N =
number of samples in the workset. The difference in the
formula is obvious, in comparison with the calculation of
DModX, the correction factor is not present in the
calculation of DModXPS.
If the sample distance to the model was larger than
the critical limit (D-Crit), this sample didn’t belong to
the corresponding class. The smaller the distance of the
sample to the model, the higher the probability that the
sample belonged to the corresponding class.
Partial least square discriminant analysis (PLS-DA)
PLS-DA, supervised pattern recognition, is a
classification method based on partial least squares
regression (PLS-R).28,29
The objective of PLS-DA is to
find models that allow the maximum separation among
classes of samples. A dummy variable can be constructed,
representing the sample properties (e.g., virgin fiber
group = 1, virgin-recycled fiber blend group = 0), and
then used as Y-variable. The prediction from a PLS-DA
model is a value of nominally zero or one, not exactly
equals to 0 or 1 but close to 0 or 1, which is justified by
the natural variability of the sample constituents. A value
close to 1 or 0 indicates that the new sample is in the
modeled class or not. In practice, a threshold is
determined, above or below which the sample is
considered to be in the class or not.
Assessment of the methods
The percentage of correct classification (%CC) is the
criterion used to compare classification results obtained
by the multivariate analysis methods:
% 100c
c ic
NCC
N N
= ×
+
(3)
wherecN and
icN represent the numbers of correct
classifications and incorrect classifications,
respectively.30
Software
Principal component analysis (PCA), soft
independent modeling of class analogy classification
(SIMCA) and partial least square discriminant analysis
(PLS-DA) were performed using commercial
chemometrics software, i.e., SIMCA-P (UMETRICS AB,
Sweden).
RESULTS AND DISCUSSION
Classification of virgin fiber and virgin-recycled
fiber blend samples by a single parameter
(variable)
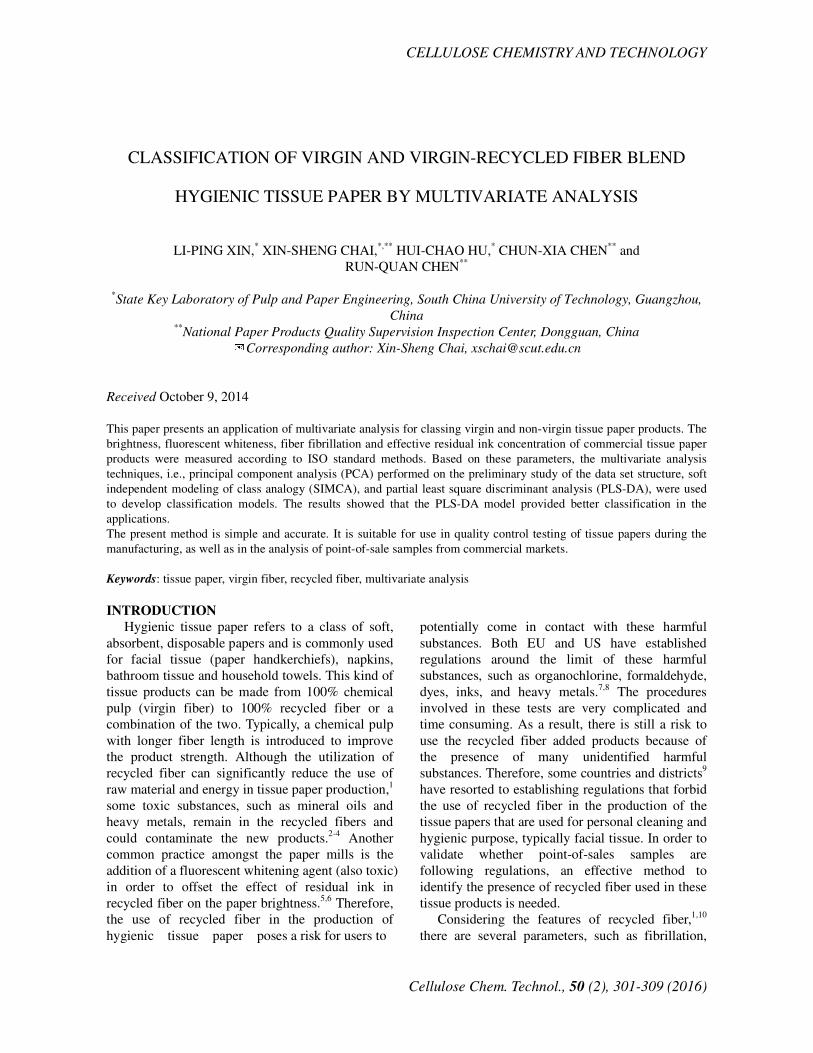
Fluorescence intensity
Although it can only provide qualitative
information, the fluorescence intensity test is a
traditional way used for judging if the products use
recycled fiber or not.31
For the products with
addition of recycled fiber, the fluorescence intensity
test must be positive. Fig. 1 shows the results from
the fluorescence intensity test for the samples. It is
noticed that 7 samples from the virgin fiber group
(among 39 samples), i.e., about 18% of the samples,
are positive in the fluorescence intensity test.
Therefore, fluorescence intensity cannot be used as
a single parameter in the classification.
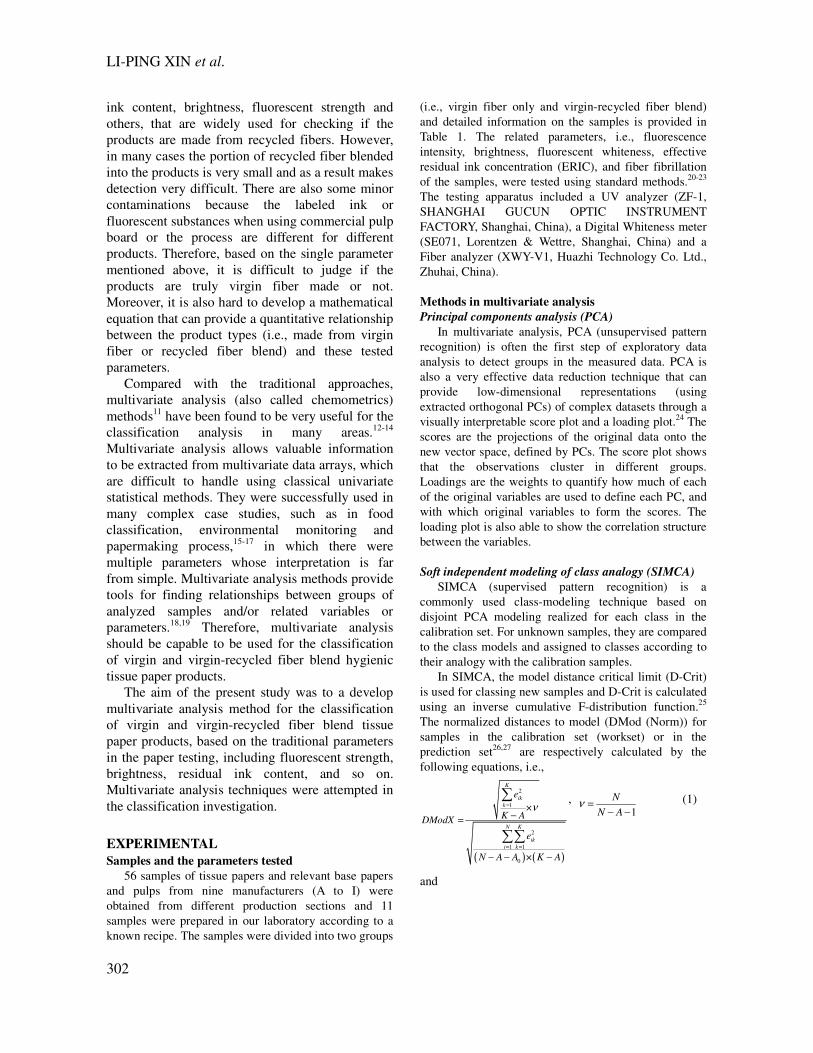
Brightness
For pulp and paper, brightness is a parameter
that reflects the removal degree of chromophore
species (e.g., residual lignin) from pulps in the
bleaching process. However, from the application
point of view, it is not necessary for tissue products
to use pulp with high brightness. For recycled fibers,
brightness is also a good indicator to judge the
effectiveness of the deinking process. As can be
noted from Fig. 2, the brightness of the tested
samples was quite close regardless of whether they
were made of virgin fiber or virgin-recycled fiber
blend. Therefore, it can be concluded that
brightness is not a reasonable parameter for
classifying the products either.
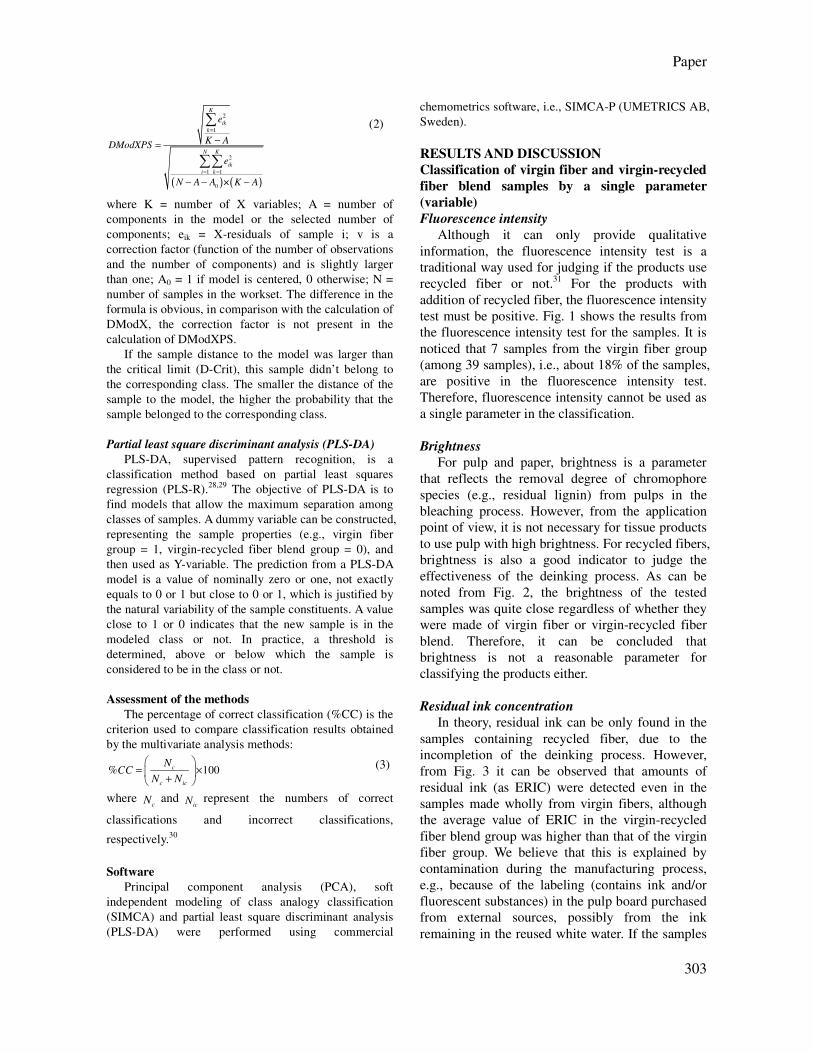
Residual ink concentration
In theory, residual ink can be only found in the
samples containing recycled fiber, due to the
incompletion of the deinking process. However,
from Fig. 3 it can be observed that amounts of
residual ink (as ERIC) were detected even in the
samples made wholly from virgin fibers, although
the average value of ERIC in the virgin-recycled
fiber blend group was higher than that of the virgin
fiber group. We believe that this is explained by
contamination during the manufacturing process,
e.g., because of the labeling (contains ink and/or
fluorescent substances) in the pulp board purchased
from external sources, possibly from the ink
remaining in the reused white water. If the samples
LI-PING XIN et al.
304
are blended with a small amount of recycled fiber
or if the deinking process is very effective, the
values of ERIC in the samples (e.g., samples 14-17)
are basically the same as those for the virgin fibers.
Thus, there is a risk to use ERIC for the
classification.
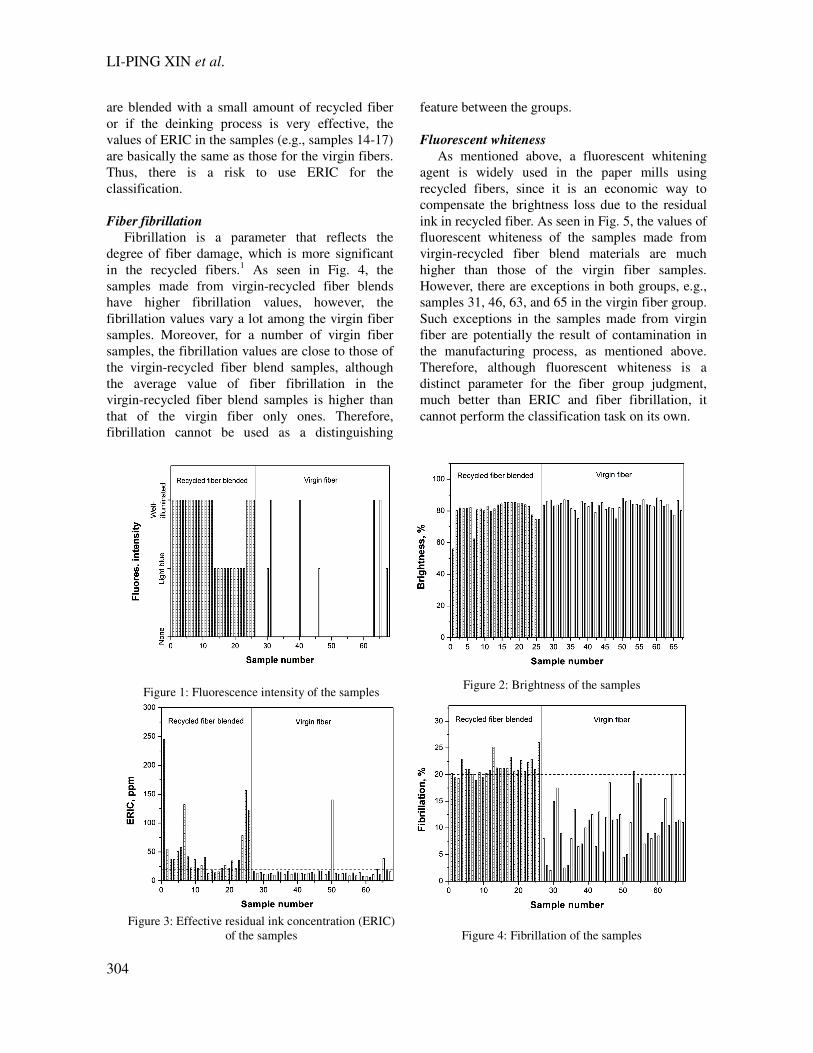
Fiber fibrillation
Fibrillation is a parameter that reflects the
degree of fiber damage, which is more significant
in the recycled fibers.1 As seen in Fig. 4, the
samples made from virgin-recycled fiber blends
have higher fibrillation values, however, the
fibrillation values vary a lot among the virgin fiber
samples. Moreover, for a number of virgin fiber
samples, the fibrillation values are close to those of
the virgin-recycled fiber blend samples, although
the average value of fiber fibrillation in the
virgin-recycled fiber blend samples is higher than
that of the virgin fiber only ones. Therefore,
fibrillation cannot be used as a distinguishing
feature between the groups.
Fluorescent whiteness
As mentioned above, a fluorescent whitening
agent is widely used in the paper mills using
recycled fibers, since it is an economic way to
compensate the brightness loss due to the residual
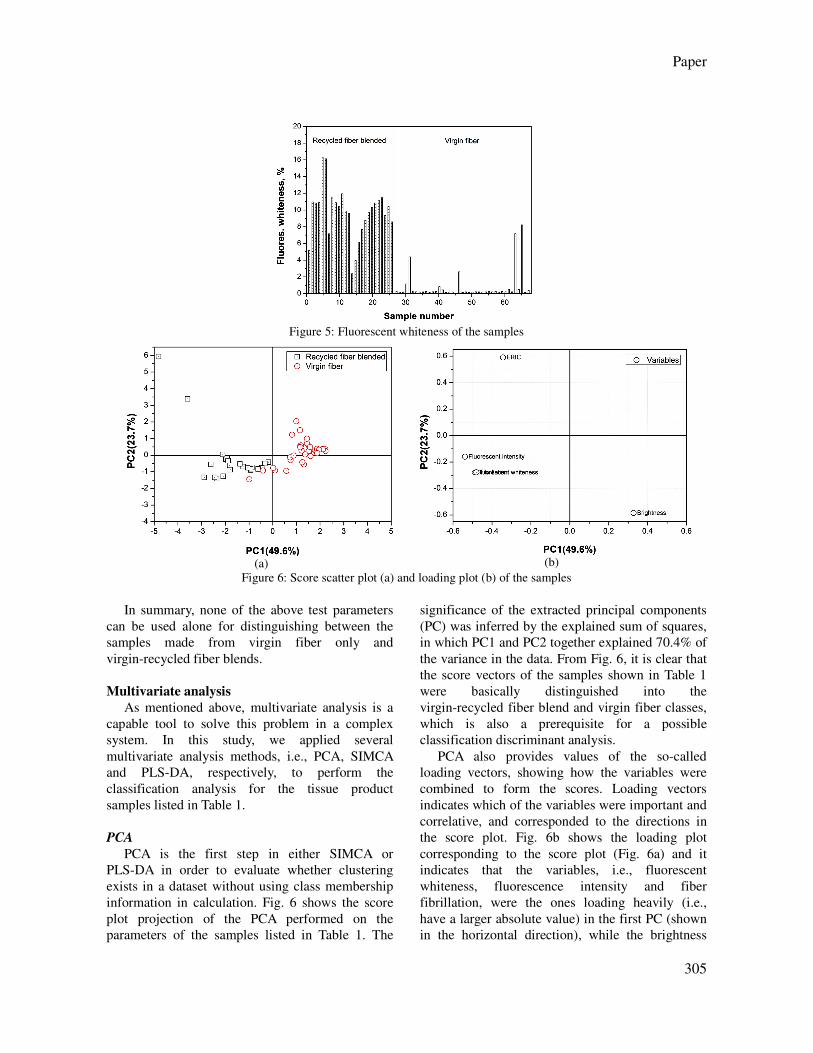
ink in recycled fiber. As seen in Fig. 5, the values of
fluorescent whiteness of the samples made from
virgin-recycled fiber blend materials are much
higher than those of the virgin fiber samples.
However, there are exceptions in both groups, e.g.,
samples 31, 46, 63, and 65 in the virgin fiber group.
Such exceptions in the samples made from virgin
fiber are potentially the result of contamination in
the manufacturing process, as mentioned above.
Therefore, although fluorescent whiteness is a
distinct parameter for the fiber group judgment,
much better than ERIC and fiber fibrillation, it
cannot perform the classification task on its own.
Figure 1: Fluorescence intensity of the samples Figure 2: Brightness of the samples
Figure 3: Effective residual ink concentration (ERIC)
of the samples
Figure 4: Fibrillation of the samples
Paper
305
Figure 5: Fluorescent whiteness of the samples
(a)
(b)
Figure 6: Score scatter plot (a) and loading plot (b) of the samples
In summary, none of the above test parameters
can be used alone for distinguishing between the
samples made from virgin fiber only and
virgin-recycled fiber blends.
Multivariate analysis
As mentioned above, multivariate analysis is a
capable tool to solve this problem in a complex
system. In this study, we applied several
multivariate analysis methods, i.e., PCA, SIMCA
and PLS-DA, respectively, to perform the
classification analysis for the tissue product
samples listed in Table 1.
PCA
PCA is the first step in either SIMCA or
PLS-DA in order to evaluate whether clustering
exists in a dataset without using class membership
information in calculation. Fig. 6 shows the score
plot projection of the PCA performed on the
parameters of the samples listed in Table 1. The
significance of the extracted principal components
(PC) was inferred by the explained sum of squares,
in which PC1 and PC2 together explained 70.4% of
the variance in the data. From Fig. 6, it is clear that
the score vectors of the samples shown in Table 1
were basically distinguished into the
virgin-recycled fiber blend and virgin fiber classes,
which is also a prerequisite for a possible
classification discriminant analysis.
PCA also provides values of the so-called
loading vectors, showing how the variables were
combined to form the scores. Loading vectors
indicates which of the variables were important and
correlative, and corresponded to the directions in
the score plot. Fig. 6b shows the loading plot
corresponding to the score plot (Fig. 6a) and it
indicates that the variables, i.e., fluorescent
whiteness, fluorescence intensity and fiber
fibrillation, were the ones loading heavily (i.e.,
have a larger absolute value) in the first PC (shown
in the horizontal direction), while the brightness
LI-PING XIN et al.
306
and ERIC, respectively far to the top and bottom,
were the ones loading heavily in the second PC
(shown in the vertical direction). Hence, it could be
concluded that the clustering of samples was
mainly reflected in the fluorescent whiteness,
fluorescence intensity and fiber fibrillation
variables. These three variables are closer to each
other, indicating that there is a better correlation
between them.
Table 1
Sample source and description
Sample No. Description Sample No. Description
Virgin-recycled fiber blend 34 B-short fiber
1 A-before flotation 35 B-bagasse pulp
2 A-after flotation 36 B-base paper
3 A-base paper 37 C-bamboo pulp
4 A-roll paper 38 C-wood pulp
5 E-pulp 39 C-pulp board
6 E-base paper 40 C-base paper
7 G-not deinking 41 D-long fiber
8 G-after deinking 42 D-bamboo pulp
9 G-before defibrillation 43 D-Nourishing Sweet
10 G-after defibrillation 44 D-short fiber
11 G-after defibrillation+chemicals 45 D-wet bagasse
12 G-manufacture forbay 46 D-base paper
13 G-base paper 47 F-bamboo pulp
14 L-ratio 5% 48 F-Guitang Eucalyptus
15 L-ratio 10% 49 F-eucalyptus (two middle)
16 L-ratio 20% 50 F-eucalyptus (Brazil)
17 L-ratio 30% 51 F-Yingxing long fiber
18 L-ratio 40% 52 F-before defibrillation
19 L-ratio 50% 53 F-after defibrillation
20 L-ratio 60% 54 F-after defibrillation+additives
21 L-ratio 70% 55 F-base paper
22 L-ratio 80% 56 H-pulp board
23 L-ratio 90% 57 H-base paper
24 X2-roll paper 58 I-pulp board
25 X3-coiling towel 59 I-base paper
26 X8-towel 60 X1-roll paper
Virgin fiber 61 X4-roll paper
27 A-Jingfeng-long fiber 62 X5-roll paper
28 A-Dingfeng-short fiber 63 X6-roll paper
29 A-Yingwu-short fiber 64 X7-roll paper
30 A-base paper 65 X9-roll paper
31 A-roll paper 66 X10-roll paper
32 B-long fiber 67 X11-roll paper
33 B-mid fiber
Table 2
Results for SIMCA classification
Calibration set Prediction set Sample
Number %CC Number %CC
Virgin-recycled fiber blend 23 91.3 3 67
Virgin fiber 33 93.9 8 75
Paper
307
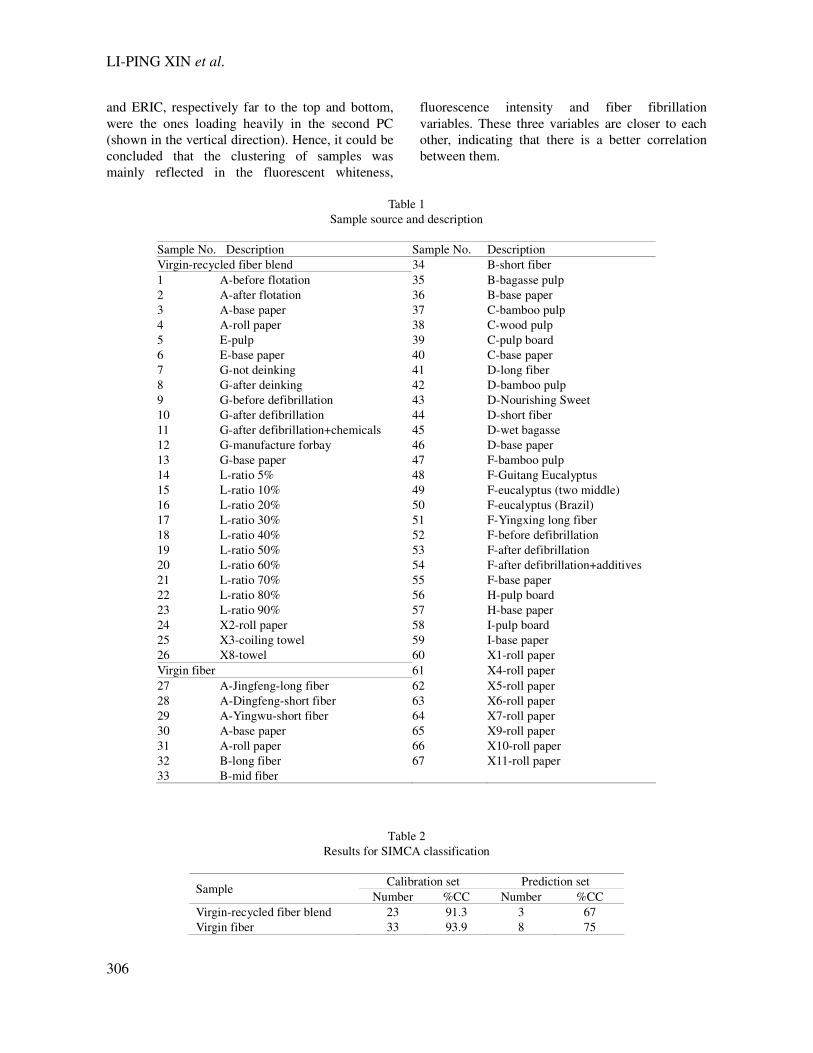
Figure 7: Cooman’s plot of the samples Figure 8: Predicted class scatter plot
SIMCA
Due to the promising results of unsupervised
PCA shown above, the SIMCA classification (PCA
supervised) was applied to the calibration dataset.
Both the virgin-recycled fiber blend and the virgin
fiber sample classes were respectively modeled
using the PCA for all variables, and the critical
distances (DCrit-1 and DCrit-2) corresponding to
the two class models were calculated by an inverse
cumulative F-distribution function. For each object
in the calibration and prediction set, the distance to
the two class models (DMod-1, DMod-2) was
computed and plotted with the critical distance
DCrit-1 and DCrit-2 to form Cooman’s plot.25 Fig.
7 is Cooman’s plot (showing class separation) of
the SIMCA model with the calibration sample set
and the prediction sample set. There are four zones
(i.e., I, II, III and V) divided by lines 1 and 2. The
samples located in zones II and V belong to the
virgin-recycled fiber blend class and the virgin fiber
class, respectively. If the sample is located in zone I
or zone III, it can not be classified. It can be seen
from Fig. 7 that there are three samples in the
prediction set that cannot be judged. Table 2 lists
the results from SIMCA classification, which
shows that the percentages of correct classification
(%CC) for the predicted samples are below 75%,
although they are higher than 90% for the
calibration samples. Therefore, SIMCA is not
suitable for the classification of the given tissue
samples.
PLS-DA
Primary analysis
Compared with SIMCA, PLS-DA could provide
a more accurate and reliable classification due to
the partial least squares based regression. Fig. 8
shows the results obtained by PLS-DA, which
include sample prediction from both the calibration
set and the prediction set, based on the information
listed in Table 1. The predicted Y values close to
zero (between -0.5 and 0.5) indicate that the
samples belong to the virgin-recycled fiber blend
class, while the predicted Y values close to one
(between 0.5 and 1.5) point that the samples belong
to the virgin fiber class. If the predicted Y value is
not located in the zone between -0.5 to 1.5, the
sample cannot be identified. From Fig. 8, we found
that although there are two samples located on the
border line in the predicted set, the classification
using PLS-DA is more accurate than that by
SIMCA.
Table 3 lists the results for the percentages of
correct classification (%CC) of the sample sets,
which indicate that there is still some uncertainty
regarding the virgin fiber set as classified by
PLS-DA.
Table 3
Results of PLS-DA classification
Calibration set Prediction set Sample
Number %CC Number %CC
Virgin-recycled fiber blend 23 100 3 100
Virgin fiber 33 97.0 8 100
LI-PING XIN et al.
308
Table 4
Results of optimized PLS-DA classification
Calibration set Prediction set Sample
Number %CC Number %CC
Virgin-recycled fiber blend 23 100 3 100
Virgin fiber 33 100 8 100
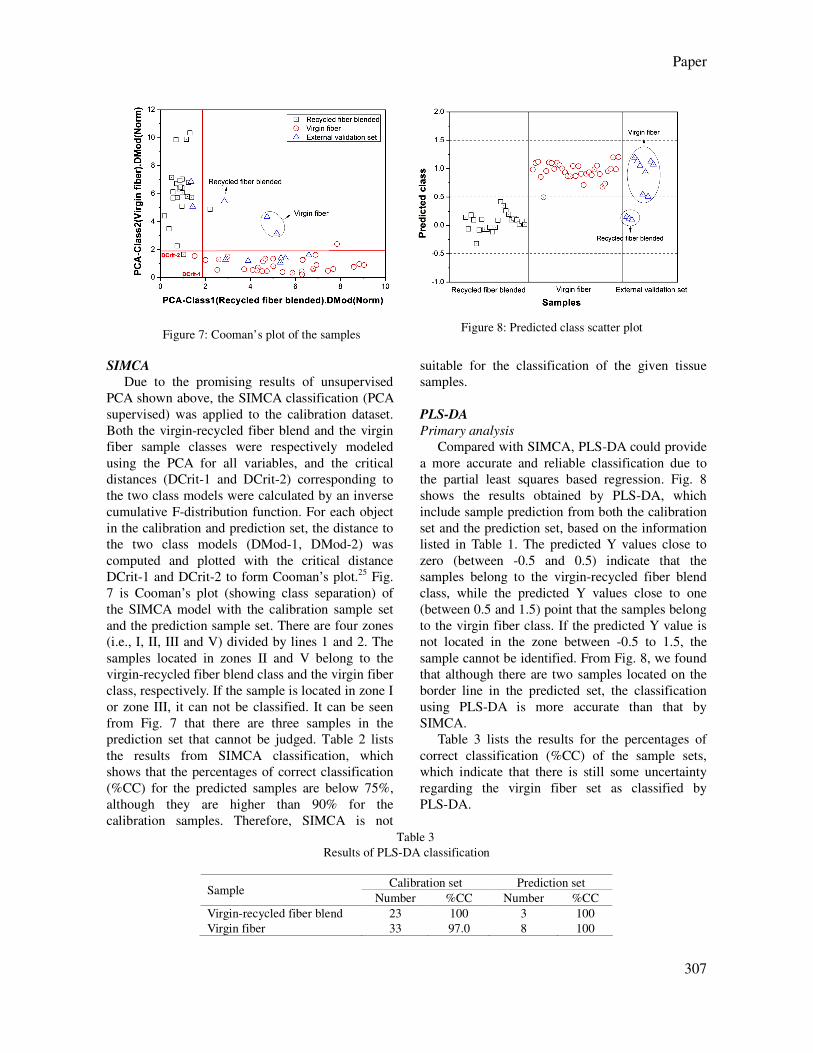
Figure 9: Plot of variable importance for the projection
Figure 10: Predicted class scatter plot (fluorescence
intensity and brightness variables removed)
Optimized analysis
In multivariate analysis, it is common practice to
purposely select the variable number and/or
variables for modeling in order to achieve good
results.32,33
The loading plot in PCA and variable
importance for the projection (VIP) plot in
PLA-DA provide a good guidance in selecting the
variable. From the loading plot (Fig. 6b), we noted
that there are good correlations between the
variables, i.e., fluorescent whiteness, fluorescence
intensity and fiber fibrillation. Fig. 9 shows the VIP
plot in the classification, which indicates that the
fluorescent whiteness, fluorescence intensity and
fiber fibrillation variables were more important
than the brightness and ERIC variables.
According to these results, we tried different
modeling ways by removing either the less
important variable(s) or the highly relevant
variable(s) in the classification study based on
PLS-DA. The results showed that the best
classification could be performed when we
excluded the brightness and fluorescence intensity
from the variables for the modeling. Fig. 10 shows
that the two class samples for both the calibration
set and the prediction set can be clearly divided.
The results shown in Table 4 also indicate that the
percentages of correct classification (%CC) are
100% for both the calibration samples and the
prediction samples. The reason is most likely due to
the fact that fluorescence intensity is a variable
relevant to fluorescent whiteness and only provides
qualitative information. Clearly, the optimized
PLS-DA method provided better results than those
based on SIMCA analysis in the tissue sample
classification.
CONCLUSION
We have demonstrated the methods for the
classification of tissue paper products made from
virgin-recycled fiber blends and virgin fiber only. It
can be concluded that the multivariate analysis
technique could provide a better judgment on the
sample classes than using only a single variable.
Amongst different multivariate analysis methods,
the regression based PLS-DA technique with the
fluorescent whiteness, effective residual ink
concentration (ERIC), and fiber fibrillation
variables provided the best results in sample
classification. The presented method is suitable for
use in the examination of point-of-sale tissue paper
samples from commercial markets.
ACKNOWLEDGEMENT: This work was
supported by the General Administration of Quality
Supervision, Inspection and Quarantine of the
People's Republic of China (Project No.
2012104018-1).
Paper
309
REFERENCES 1 H. Holik (Ed.), “Handbook of Paper and Board”,
Wiley, 2006. 2 M. Biedermann and K. Grob, Eur. Food Res.
Technol., 230, 785 (2010). 3 A. Vollmer, M. Biedermann, F. Grundbock, J.-E.
Ingenhoff, S. Biedermann-Brem et al., Eur. Food Res.
Technol., 232, 175 (2011). 4 M. J. Hagenbarth, Food Addit. Contam., 22, 1042
(2005). 5 H. Zhang, Z. He, Y. Ni, H. Hu and Y. Zhou, Pulp
Pap.-Can., 110, 20 (2009). 6 L. B. M. Tirado, M. C. Area and H. E. Evélez,
Cellulose Chem. Technol., 43, 179 (2009). 7 Commission Decision 2009/568/EC of 9 July 2009
establishing the ecological criteria for the award of the
Community Eco-label for tissue paper, Official Journal
of Legislation, 197, 87 (2009). 8 GS-9, GREEN SEAL™ Environmental Standard for
Paper Towels and Paper Napkins, 1993. 9 Guo Zhi Jian Zhi No. 2003[289], General
Administration of Quality Supervision, Inspection and
Quarantine of the People's Republic of China, 2003. 10 K. N. Law, X. L. Song and C. Daneault, Cellulose
Chem. Technol., 40, 335 (2006). 11 D. L. Massart, B. G. M. Vandeginste, S. N. Deming,
Y. Michotte and L. Kaufman (Eds.), “Chemometrics: A
Textbook”, Elsevier, 1988. 12 O. Galtier, O. Abbas, Y. Le Dréau, C. Rebufa, J.
Kister et al., Vib. Spectrosc., 55, 132 (2011). 13 L. Xu, C. B. Cai, H. F. Cui, Z. H. Ye and X. P. Yu,
Meat Sci., 92, 506 (2012). 14 W.-S. Lin, C.-M. Yang and B.-J. Kuo, Chemometr.
Intell. Lab., 115, 25 (2012). 15 E. Ivorra, J. Girón, A. J. Sánchez, S. Verdú, J. M.
Barat et al., Food Eng., 117, 342 (2013). 16 B. Stumpe, T. Engel, B. Steinweg and B. Marschner,
Environ. Sci. Technol., 46, 3964 (2012). 17 A. Björk and L.-G. Danielsson, Chemometr. Intell.
Lab., 85, 63 (2007). 18 A. L. Missio, B. D. Mattos, D. A. Gatto and E. A.
Lima, J. Wood Chem. Technol., 34, 191 (2014).
19 W. He and H. Hu, J. Wood Chem. Technol., 33, 52
(2013). 20 GB/T5009.78-2003, Inspection and Quarantine of the
People's Republic of China, 2003. 21 ISO 2470-2:2008, International Organization for
Standardization, 2008. 22 T567 om-04, TAPPI, 2004. 23 GB/T 22836-2008, Inspection and Quarantine of the
People's Republic of China, 2008. 24 S. Wold, K. Esbensen and P. Geladi, Chemometr.
Intell. Lab., 2, 37 (1987). 25 MKS Umetrics. User Guide to SIMCA (Version 13),
User guide edition date: April 23, 2012, ID#2043. 26 S. Wold, Pattern Recogn., 8, 127 (1976). 27 B. R. Kowalski (Ed.), “Chemometrics: Theory and
Application”, ACS Symposium Series 52, 1977, p. 243. 28 S. Wold, M. Sjöström and L. Eriksson, Chemometr.
Intell. Lab., 58, 109 (2001). 29 M. Barker and W. Rayens, J. Chemometr., 17, 166
(2003). 30 P. Ciosek, Z. Brzózka, W. Wróblewski, E. Martinelli,
C. D. Natale et al., Talanta, 67, 590 (2005). 31 S. Kawanobe and T. Okayama, Sen-i Gakkaishi, 66,
43 (2010). 32 J. Xing, W. Saeys and J. D. Baerdemaeker, Electron.
Agr., 56, 1 (2007). 33 M. Felipe-Sotelo, R. Tauler, I. Vives and J. O.
Grimalt, Sci. Total Environ., 404, 148 (2008).