classification of photographs based on perceived aesthetic ... · pdf fileclassification of...

1
Classification of Photographs based on Perceived Aesthetic Quality Jeff Hwang, Sean Shi Department of Electrical Engineering, Stanford University Aesthetic Classification Feature Extraction Methodology Experimental Results Hue: count # of distinct hues Saturation: compute average saturation Contrast: variance of pixel intensity Spatial Correlation of Features Extract features from each tile in partitioned image. Allow machine learning algorithm to infer relationships between the tiles. Feature Selection Entropy: measure of simplicity Blur: variance of the Laplacian Detail: ratio of subject edges to pixels Dataset Scraped 2300 images from photo.net, each photograph rated between 1 and 7. We only consider photographs rated below 4.3 or above 6. K-fold Cross Validation Performance was measured using 10-fold cross validation. Balanced number of positive/negative examples used. Classifier Tuning Selected regularization, gamma, and kernel parameters of SVM via grid search. 80.96% 26.78% 19.04% 73.22% Predicted Actual Label True False True False SVM Gaussian Kernel, C=1, =0.08 10-fold Cross Validation Success 1 0 1 0

Upload: vandiep

Post on 06-Feb-2018

219 views

Category:

Documents


0 download

TRANSCRIPT

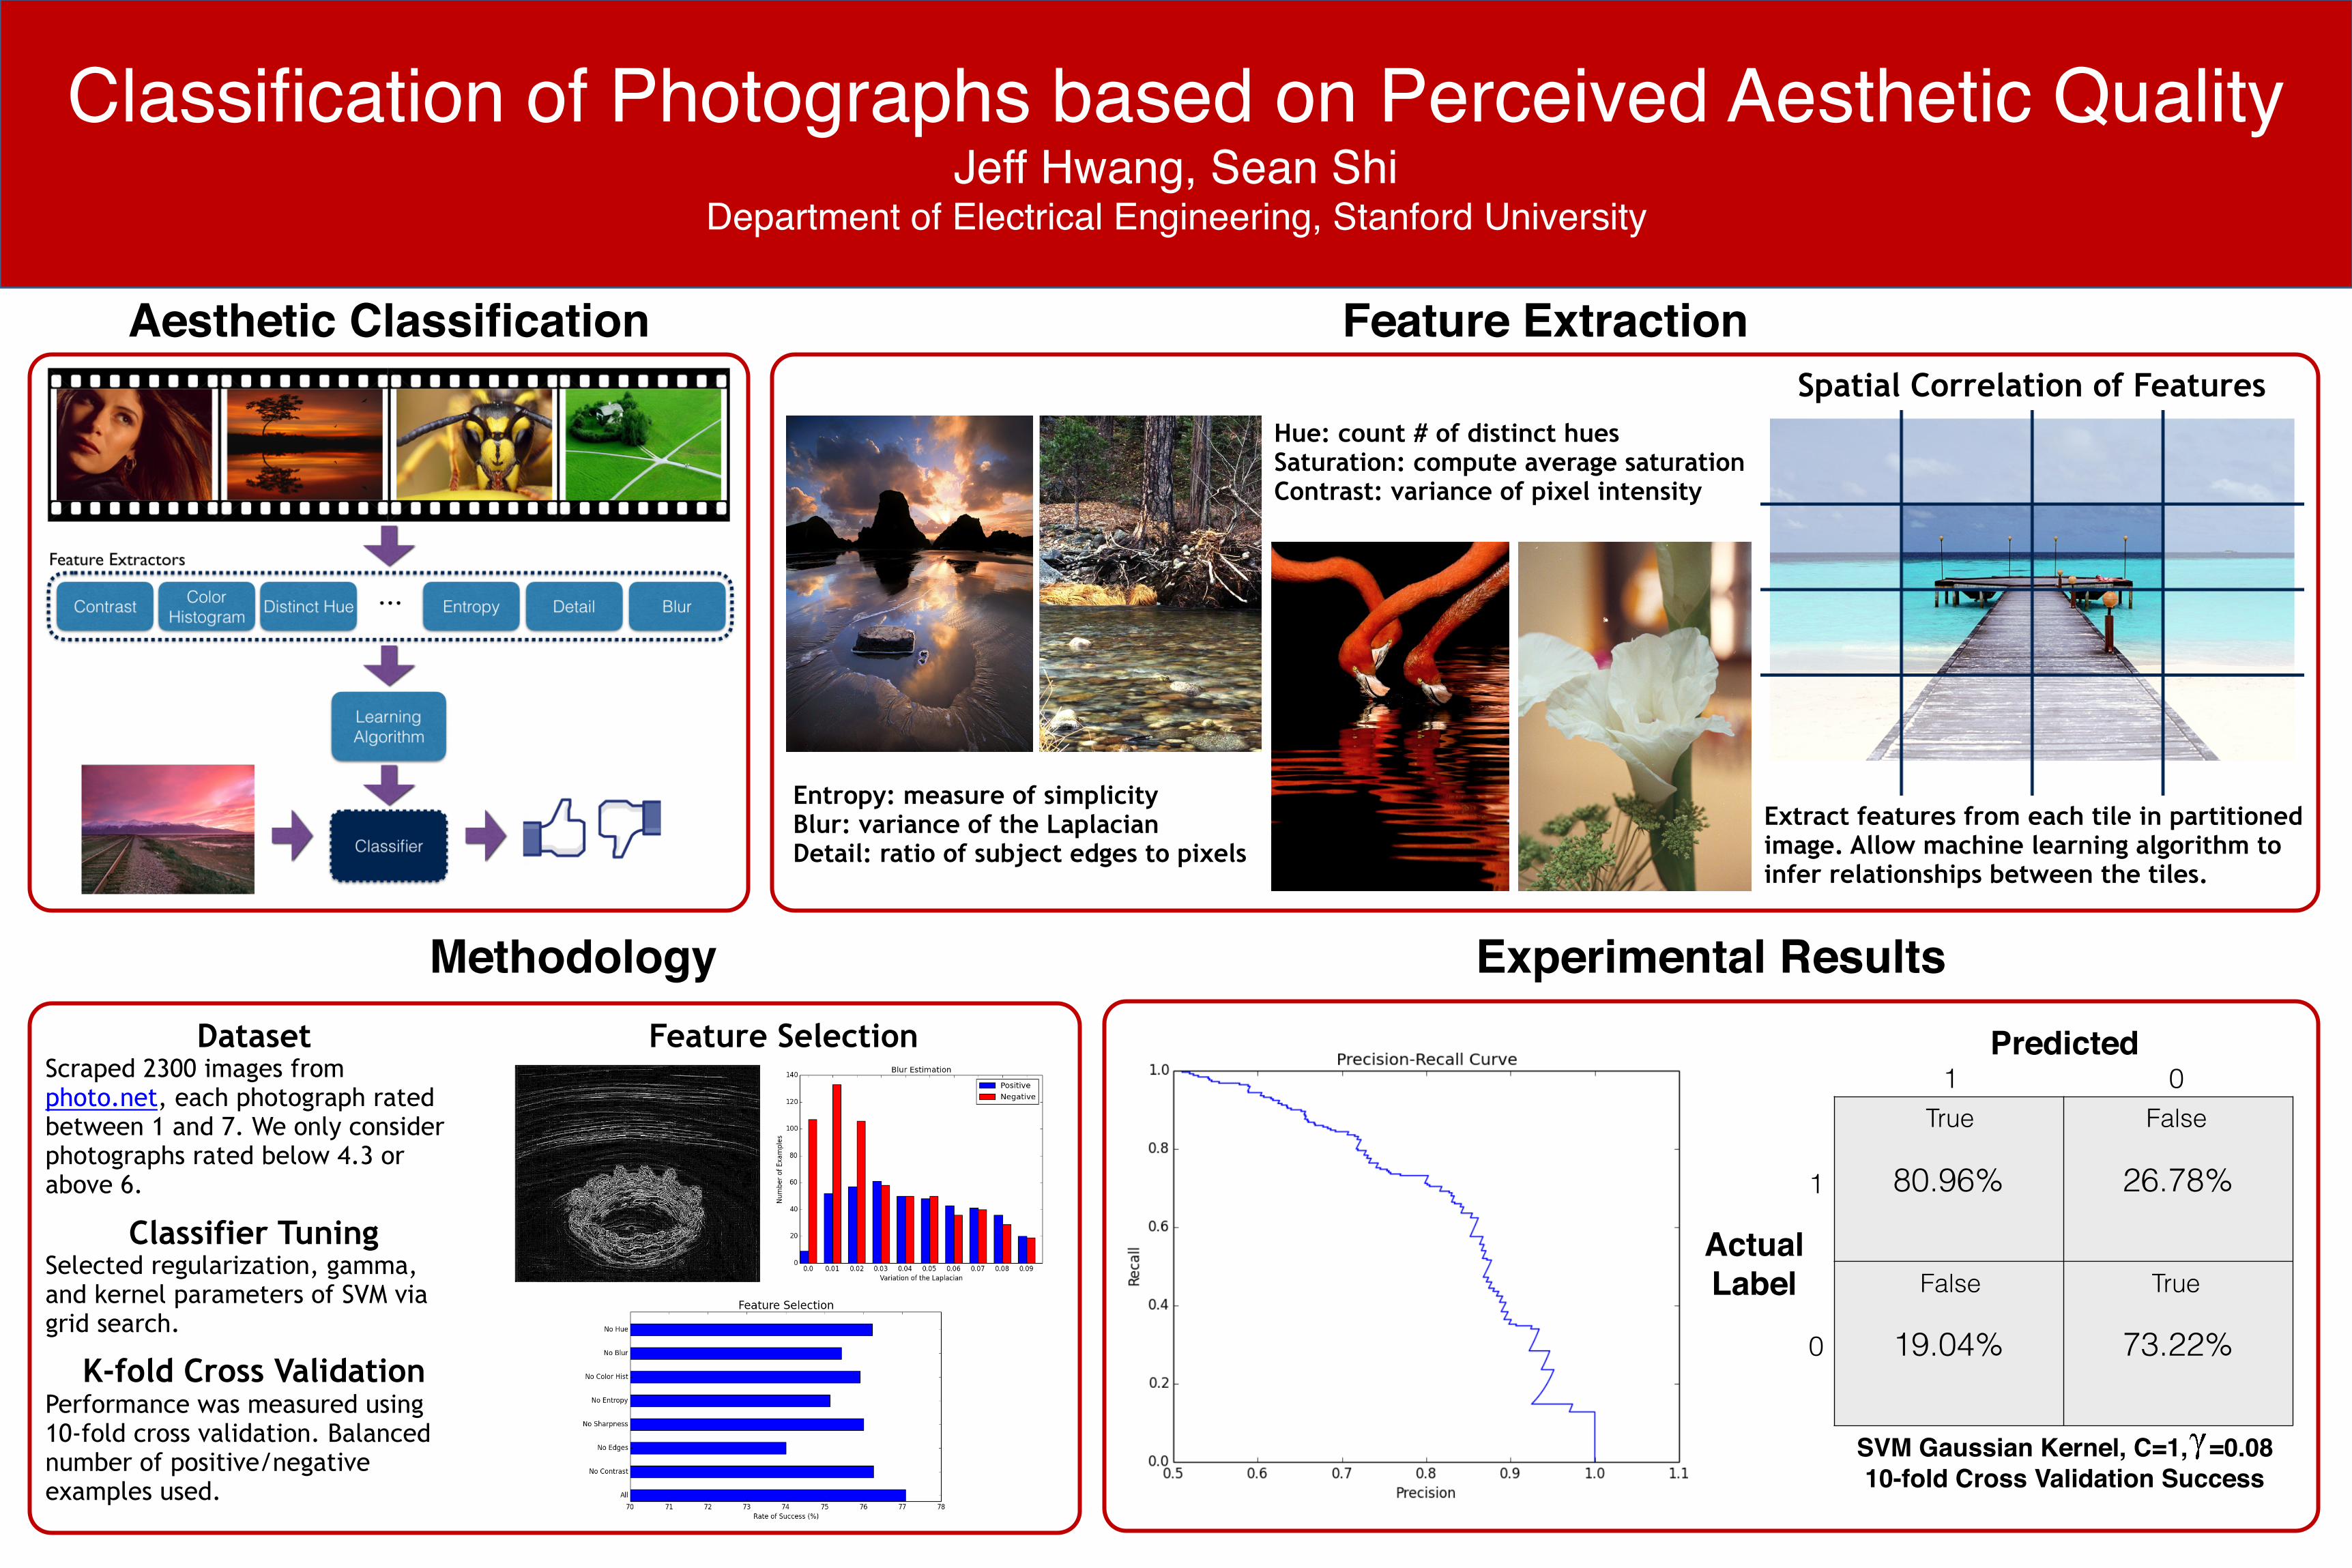
Classification of Photographs based on Perceived Aesthetic QualityJeff Hwang, Sean Shi

Department of Electrical Engineering, Stanford University

Aesthetic Classification Feature Extraction

Methodology Experimental Results

Hue: count # of distinct hues Saturation: compute average saturation Contrast: variance of pixel intensity

Spatial Correlation of Features

Extract features from each tile in partitioned image. Allow machine learning algorithm to infer relationships between the tiles.

Feature Selection

Entropy: measure of simplicity Blur: variance of the Laplacian Detail: ratio of subject edges to pixels

Dataset Scraped 2300 images from photo.net, each photograph rated between 1 and 7. We only consider photographs rated below 4.3 or above 6.

K-fold Cross Validation Performance was measured using 10-fold cross validation. Balanced number of positive/negative examples used.

Classifier Tuning Selected regularization, gamma, and kernel parameters of SVM via grid search.

80.96% 26.78%

19.04% 73.22%

Predicted

ActualLabel

True

False True

False

SVM Gaussian Kernel, C=1, =0.0810-fold Cross Validation Success

1

0

1 0