classification of imbalance data using tomek link (t-link
TRANSCRIPT

Classification of Imbalance Data using Tomek Link (T-Link) Combined withRandom Under-sampling (RUS) as a Data Reduction MethodElhassan T1, Aljurf M1, Al-Mohanna F2,3 and Shoukri M2*,3
1Oncology Center, King Faisal Specialist Hospital and Research Center, Saudi Arabia2Department of Cell Biology, Research Center, King Faisal Specialist Hospital and Research Center, Saudi Arabia3College of Medicine, Al-Faisal University, Saudi Arabia*Corresponding author: Shoukri M, Department of Cell Biology, Research Center, King Faisal Specialist Hospital and Research Center, P.O. Box3345 11211-Riyadh, Saudi Arabia, Tel: +966509491454; E-mail: [email protected]
Received date: Mar 31, 2016; Accepted date: May 30, 2016; Published date: Jun 06, 2016
Copyright: © 2016 Elhassan AT, et al. This is an open-access article distributed under the terms of the Creative Commons Attribution License,which permits unrestricted use, distribution, and reproduction in any medium, provided the original author and source are credited.
Abstract
The problem of classifying subjects into disease categoriesis of common occurrence in medical research. Machinelearning tools such as Artificial Neural Network (ANN),Support Vector Machine (SVM) and Logistic Regression(LR) and Fisher’s Linear Discriminant Analysis (LDA) arewidely used in the areas of prediction and classification.The main objective of these competing classificationstrategies is to predict a dichotomous outcome (e.g.disease/healthy) based on several features.
Like any of the well-known statistical inferential models;machine learning tools are faced with a problem knownas “class imbalance”. A data set is imbalanced if theclassification categories are not approximately equallyrepresented. When learning from highly imbalanced data,most classifiers are affected by the majority class leadingto an increase in the false negative rate. Increasedinterests in applying machine learning techniques to "real-world" problems, whose data are characterized by severeimbalance, have emerged as can be seen in numerouspublications in medicine and biology.
Predictive accuracy, a popular choice for evaluatingperformance of a classifier, might not be appropriatewhen the data is imbalanced and/or when the costs ofdifferent errors vary markedly.
In this paper, we use the T-Link algorithm in thepreprocessing phase as a method of data cleaning inorder to remove noise. We combine T-Link with othersampling method such as RUS, ROS and SyntheticMinority Oversampling Technique (SMOTE) in order tomaintain a balanced class distribution. Classification wasthen utilized using several ML algorithms such as ANN, RFand LR. Classifiers performance was evaluated usingseveral performance measures deemed more appropriatefor classifying data with sever imbalance. These methodsare applied to arterial blood pressures data and Ecoli2data set.
Results: Using TLink in combination with RUS and SMOTEdemonstrated a superior performance compared toresampling techniques such among different classificationalgorithms such as SVM, ANN, RF and LR.
Keywords: Logistic regression; Neural network; Supportvector machine; Imbalance data; T-Link
IntroductionMost of data in the real-word are imbalance in nature. This
situation occurs when the distribution of the target class is notuniform among the different class levels. Classification of thistype of data is one of the most challenging problems in thefield of machine learning and has recently gained a great dealof interest [1]. This is because most of the known machineslearning algorithms were developed with an optimal goal ofmaximizing the overall accuracy, which is the percentage ofcorrect predictions made by a classifier. This results inclassifiers with a high accuracy but very low sensitivity towardsthe positive class [2]. Therefore, the optimal goal needs to beshifted toward maximizing the sensitivity of positive class andnegative class separately rather than focusing on the overallaccuracy. Several methods were developed to overcome thisproblem; these methods include methods based on samplingtechniques, cost-sensitive learning, Ensemble learning, Featureselection and algorithmic modification [3].
Classification has many applications in the medical field.Classifying patients in to different medical diagnosis usingdifferent machine learning algorithms has attracted theinterest of many researchers in clinical medicine. This isbecause most of the diagnosis techniques can be transformedin to intelligent data classification systems where diagnosis canbe made based on some features such as medical finding.
With increased applications of medical informaticsalgorithms and software, medical databases can now beutilized to extract different features associated with differenttypes of diagnoses. Therefore, automated diagnosis systemscan be developed to aid clinicians and biomedical scientiststhroughout the diagnosis process. In terms of machine
Research Article
iMedPub Journalshttp://www.imedpub.com/
Journal of Informatics and Data Mining
ISSN 2472-1956Vol.1 No.2:11
2016
© Copyright iMedPub | This article is available from: http://datamining.imedpub.com/archive.php 1

learning, building an automated diagnosis classification systemis an optimization problem with an ultimate objective ofincreasing the diagnostic accuracy. However, this problembecomes difficult when the target class has imbalancedistribution of the class levels.
Splitting the whole dataset into training and testing datasetsusing random sampling technique without any adjustment ofthe class distribution will not solve the imbalance problem.This is because the training data will have the samedistribution of the original data set, a problem that will persistduring the learning phase. There are two methods to deal withthis situation; one is sampling-based method and the other is acost-sensitive method.
Sampling methods tend to adjust the prior distribution ofthe minority and majority classes in the training data to have abalanced class distribution. Re-sampling techniques can beclassified into basic sampling techniques and advancedsampling techniques. Basic sampling techniques includemethods such as Random under-sampling (RUS) of majorityclass, Random over-sampling (ROS) of minority class, and ahybrid of both. On the other hand, advanced samplingtechniques are basically based on the idea of a guidedsampling approach which has been utilized using specialmethods. These methods include Tomek Link (T-Link) [4],Synthetic Minority Oversampling Technique (SMOTE) [5], One-Sided Selection (OSS) [6-27], Neighborhood Cleaning Rule(NCR) [7], Edited Nearest Neighbor Rule (ENN) [8], CondensedNearest Neighbor (CNN) [9] and Bootstrap-based OverSampling (Boot-OS) [10] etc.
Cost-sensitive learning is used in situations wheremisclassification cost varies with the type of errors. In this casewe are faced with two issues: Skewed class distribution anddifferent misclassification cost. This type of learning is used indomains such as fraud detection [11], medical diagnosis andrisk management [12-14]. Cost-sensitive learning can beclassified into direct cost-sensitive learning and Meta-LearningMethods (MLM). The MLM are used when directimplementation of misclassification cost into the learningalgorithm is not provided. Implementation of these methods isutilized through meta-learning thresholding and meta-learningsampling [15-18].
Ensemble learning is a machine learning method that usesmultiple learners-called base learners-to learn from multiplebootstrap samples generated from the training data set. It hasa strong generalizability as compared to machine learners thatuse a single learner because of its ability to boost weaklearners in to stronger learners and finally aggregate theresults and make the predictions based on the majority ofvotes. Ensemble learning method is based on the work doneby Breiman [19]. It includes methods such as bagging andboosting. Feature selection is a method of feature reductionwhere only relevant features are used in the learning process.It is usually used with high-dimensional data [20]. However, incase of unbalanced data, the process of feature selection needto be adjusted to select features that lead to more classseparability [21].
Algorithmic modification approach works on the algorithmiclevel where the learning algorithm is adjusted to fit theimbalance data context. This method can be implemented bythree methods; proposing new splitting criteria [22], adjustingthe distribution reference in the Decision Tree (DT), andadjusting the Offset Entropy [23].
In this paper we focused on sampling techniques using basicand advanced methods. We hypothized that applying a guideddata reduction method such as T-Link followed by a randomunder-sampling (RUS) will improve the classification modelsensitivity toward the minority class compared to othersampling methods.
Different sampling techniques were utilized to emphasizethe comparative performance of different classificationalgorithms such as Artificial Neural Networks (ANN), SupportVector Machine (SVM), Random Forest (RF) and LogisticRegression (LR).
Classification accuracy was evaluated using differentmeasures such as weighted accuracy, sensitivity, specificity, G-mean, F-statistics, NPV, and area under the ROC curve. Thepaper is structured as follows: In Section 2 we introduce a briefdescription of sampling-based methods used in this study.Section 3 introduces the research methodology andframework. Section 4 presents two experimental studieswhere the different studying sampling techniques wereapplied to different ML algorithms. R studio and Weka 3.8 formachine learning were utilized.
Sampling-based Methods
Basic sampling methods
Over sampling
It is a non-heuristic method that balances the classdistribution by duplicating examples of minority class. Thereare two types of over-sampling; a Random Over-Sampling(ROS) in which examples to be duplicated are randomlychosen; Focus Over-Sampling (FOS) where duplication processincludes only examples that are located in the bordersbetween the two classes.
Under sampling
It is a non-heuristic method where subset of majority class ischosen to create a balanced class distribution. There are twotypes of under-sampling; Radom Under-Sampling (RUS) wheresome of the majority class examples are removed randomly;and Focused Under-Sampling (FUS) that excludes majorityexamples that are located on the borders between the twoclasses [24]. The advantage of this method is that; theelimination of some examples could significantly reduce thesize of the data and therefore decrease the run-time costespecially in case of big data. However, ignoring someexamples from the majority class might lead to loss of someimportant information that might contribute to the learningprocess [25].
Journal of Informatics and Data Mining
ISSN 2472-1956 Vol.1 No.2:11
2016
2 This article is available from: http://datamining.imedpub.com/archive.php

Other methods such as Tomek-Link [26], Condensed NearestNeighbor and One-sided selection were proposed to improvethe performance of random undersampling.
Advanced sampling methods
Tomek Link (T-Link):
Let x be an instance of class A and y an instance of class B.
Let d(x, y) be the distance between x and y.
(x, y) is a T-Link, if for any instance z, d(x, y) < d(x, z) or d(x, y)< d( y, z)
If any two examples are T-Link then one of these examples isa noise or otherwise both examples are located on theboundary of the classes.
T-Link method can be used as a method of guided under-sampling where the observations from the majority class areremoved.
Several researches use T-link as a method of under sampling[28-31].
Synthetic Minority Oversampling Technique (SMOTE)
SMOTE is an advance method of over-sampling developedby Chawala [4]. It aims to enrich the minority class boundariesby creating artificial examples in the minority class ratherreplicating the existing examples to avoid the problem ofoverfitting. The algorithm works as follows:
Let A be the minority class and let B be the majority class.
Then, for each observation x belongs to class A, a k-nearestneighbors of “x” were identified,
A few neighbors are randomly selected (the number ofneighbors depends on the rate of over-sampling),
Artificial observations are then generated and spread alongthe line joining the “x” to its nearest neighbors.
Several methods have been developed to improve theoriginal SMOTE algorithm such as dealing with nominalfeatures. New methods include SMOTE-NC (Synthetic MinorityOver-sampling Technique Nominal Continuous) and SMOTE-N(Synthetic Minority Over-sampling Technique Nominal). Thesemethods can be considered as a generalization of the originalSMOTE algorithm to handle data sets with mixed Features(continuous and nominal).
Several works have been done in this field. Estabrooks et al.[32] proposed a multiple re-sampling method that selects the
most appropriate re-sampling rate. Jo et al. [33] introduced acluster-based over-sampling method which considers thebetween-class imbalance and within-class imbalancesimultaneously. Guo et al. [34] focused on the hard examplesof the majority and minority classes using the boostingalgorithm, and then generated new synthetic examples fromhard examples and add them to the data sets. Han et al. [35]presented two new minority over-sampling methods based onSMOTE method, borderline-SMOTE1 and borderline-SMOTE2,where only the minority examples near the borderline areoversampled. These approaches achieve better sensitivity rateand F-value as compared to SMOTE and random over-samplingmethods.
MethodologyThis study can be divided into three phases, Figures 1 and 2:
Figure 1: Simple illustration of ANN.
The preprocessing phaseThis phase is dived into sub phases as follows:
Data reduction: In this phase T-Link method was utilized asmethods of data reduction. Applying this method noise wasremoved from the majority class in order to improve theclassification process. Therefore, this method is considered asa guided under-sampling where only noise data are removedfrom the majority class.
Resampling: Different resampling techniques were appliedto the reduced data as well as the original (imbalanced) datasets. Resampling methods include, RUS, ROS, SMOTE. Theoutput of this phase is a group of six resampled data setswhich are: RUS, ROS, SMOTE, TLink/RUS, TLink/ROS and TLink/SMOTE.
Journal of Informatics and Data Mining
ISSN 2472-1956 Vol.1 No.2:11
2016
© Copyright iMedPub 3
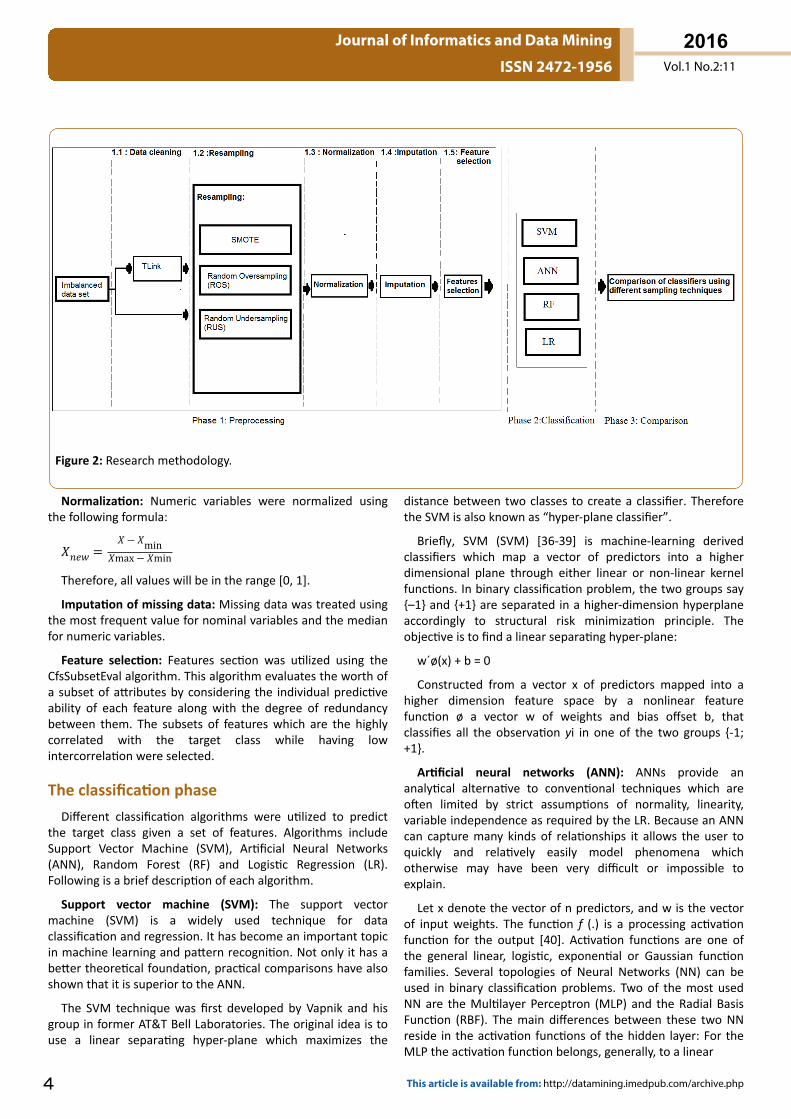
Figure 2: Research methodology.
Normalization: Numeric variables were normalized usingthe following formula:���� = � − �min�max− �min
Therefore, all values will be in the range [0, 1].
Imputation of missing data: Missing data was treated usingthe most frequent value for nominal variables and the medianfor numeric variables.
Feature selection: Features section was utilized using theCfsSubsetEval algorithm. This algorithm evaluates the worth ofa subset of attributes by considering the individual predictiveability of each feature along with the degree of redundancybetween them. The subsets of features which are the highlycorrelated with the target class while having lowintercorrelation were selected.
The classification phaseDifferent classification algorithms were utilized to predict
the target class given a set of features. Algorithms includeSupport Vector Machine (SVM), Artificial Neural Networks(ANN), Random Forest (RF) and Logistic Regression (LR).Following is a brief description of each algorithm.
Support vector machine (SVM): The support vectormachine (SVM) is a widely used technique for dataclassification and regression. It has become an important topicin machine learning and pattern recognition. Not only it has abetter theoretical foundation, practical comparisons have alsoshown that it is superior to the ANN.
The SVM technique was first developed by Vapnik and hisgroup in former AT&T Bell Laboratories. The original idea is touse a linear separating hyper-plane which maximizes the
distance between two classes to create a classifier. Thereforethe SVM is also known as “hyper-plane classifier”.
Briefly, SVM (SVM) [36-39] is machine-learning derivedclassifiers which map a vector of predictors into a higherdimensional plane through either linear or non-linear kernelfunctions. In binary classification problem, the two groups say{–1} and {+1} are separated in a higher-dimension hyperplaneaccordingly to structural risk minimization principle. Theobjective is to find a linear separating hyper-plane:
w´ø(x) + b = 0
Constructed from a vector x of predictors mapped into ahigher dimension feature space by a nonlinear featurefunction ø a vector w of weights and bias offset b, thatclassifies all the observation yi in one of the two groups {-1;+1}.
Artificial neural networks (ANN): ANNs provide ananalytical alternative to conventional techniques which areoften limited by strict assumptions of normality, linearity,variable independence as required by the LR. Because an ANNcan capture many kinds of relationships it allows the user toquickly and relatively easily model phenomena whichotherwise may have been very difficult or impossible toexplain.
Let x denote the vector of n predictors, and w is the vectorof input weights. The function f (.) is a processing activationfunction for the output [40]. Activation functions are one ofthe general linear, logistic, exponential or Gaussian functionfamilies. Several topologies of Neural Networks (NN) can beused in binary classification problems. Two of the most usedNN are the Multilayer Perceptron (MLP) and the Radial BasisFunction (RBF). The main differences between these two NNreside in the activation functions of the hidden layer: For theMLP the activation function belongs, generally, to a linear
Journal of Informatics and Data Mining
ISSN 2472-1956 Vol.1 No.2:11
2016
4 This article is available from: http://datamining.imedpub.com/archive.php
Neural Networks (NN) methods have been used extensivelyin classification problems.��(�) = ∑� = 1� �����
Or logistic activation function family:�(�) = 11 + exp(− �)For the RBF function the activation function belongs to the
Gaussian family:��(�) = exp − 12(� − ��)′∑�−1(� − ��)ANN is generally trained in a set of iterations (epochs) for a
subset (epochs) for a subset of the data (train set) and testedfor the remained subset (test set). The vector of synapticweights (w) of the NN is upgraded in each iteration in way tomaximize the correct classification errors; either a function ofthe sum of squares of the errors for a continuous criterion:��� = 12∑� = 1� (��− ��)2 or the Cross-entropy error functionfor a binary criterion:��� = − ∑� = 1� ��1�� ���� + (1− ��)��(1− ��)��
Random forest (RF): It takes a bootstrap sample from thedata and fits a classification or regression tree. When buildingdecision trees, each time a split is considered, a randomsample of m predictors is chosen as split candidates from thefull set of p predictors.
The split is allowed to use only one of those m predictors. Afresh sample of m predictors is taken at each split, andtypically we take m = √. Where, p is number of predictors.
The best split on the selected m variables is then found andtree is grown. The final predication is made by voting forclassification and by averaging for regression [19].
Logistic regression (LR): Binomial Logistic regression (LR)models the probability of occurrence of one (success) of thetwo classes of dichotomous criterion. A linear combination ofpredictors is used to fit a Logit transformation of theprobability of success for each subject (πi) as�� ��/(1− ��) = �0+ �1�1�+ ....������
Regression coefficients are fitted by maximum likelihoodestimation, and by solving the Logit in order to πi theprobability of success for each subject is estimated as
�� = ��0 + �1�1�+ ...�����1 + ��0 + �1�1�+ ...�����If for subject i the estimated probability �� is greater than
0.5 (or other user pre-defined threshold value), the subject isclassified into the success group; otherwise, it is classified intothe failure group. Detailed descriptions can be found in [41].
The comparison phaseIn this phase, the improvement of model sensitivity towards
the minority class using different sampling techniques was
assessed. Model performance was evaluated using differentmeasures such as weighted accuracy, sensitivity, specificity,precision and AUC. Following is a brief definition of eachmeasure.
Sensitivity: The True Positive rate (TP) = ����+ ��Specificity: The True Negative rate (TN) =����+ �� = 1− ������Precision: Positive predictive value (PPV) = ����+ ��Negative Predictive Value (NPV)= ����+ ��� − ���������� = 2 *��������� * ��������������������+ ������������ −���� = ����������� * �����������Weighted accuracy = 0.5* Sensitivity + 0.5* Specificity
AUC: A single scalar value represents the exceptedperformance of ROC curve. AUC calculates the area under theROC curve. It calculates the probability that the classifier willrank a randomly chosen positive instance higher than arandomly chosen negative instance.��� = �����������+ �����������2
AUC has an advantage over other performance measures;that is; AUC is invariant to relative class distributions, andclass-specific error costs.
Experimental StudiesFor any classifier, there is always a tradeoff between true
positive rate and true negative rate; and the same applies forrecall and precision. In the case of learning extremelyimbalanced data, usually the rare class is of great interest.
In many applications such as drug discovery and diseasediagnosis, it is desirable to have a classifier that gives highprediction accuracy over the minority (positive) class (Acc+),while maintaining reasonable accuracy for the majority(negative) class (Acc−).
In this section, we applied the previously discussedtechniques to improve the classifier predictive ability of thepositive class using two imbalanced data sets.
Following is a description for the two studying data sets.
Data setsFamilial data: This is a highly structured clustered familial
data that has two levels of hierarchy, where bloodmeasurements were taken on parents (level two) and theiroffspring (level one) together with other anthropometricfeatures [42]. Familial data sets are notorious of havingconsiderable “within-cluster” correlation due to thehomogeneous nature of family members. The goal is to classifythe offspring blood pressure status based on parents BP andother anthropometric features.
Journal of Informatics and Data Mining
ISSN 2472-1956 Vol.1 No.2:11
2016
© Copyright iMedPub 5
The data set contains 223 families with a mean number ofsiblings equal to 3 siblings per family. The outcome variable inthis data set is a binary variable which is offspring bloodpressure status (High (+) vs. Normal (-)) (Table 1). The data has12 attributes described as follows:
1. Father age
2. Mother age
3. Father systolic blood pressure
4. Father diastolic blood pressure
5. Mother systolic blood pressure
6. Mother diastolic blood pressure
7. Mother arm girth
8. Father arm girth
9. sibling age
10. sibling sex
11. sibling arm girth
12. Number of siblings
Table 1: Patient’s characteristics.
Variables Median (range=(25th, 75th))/n (%)
Father age 58 (47,65)
Mother age 53 (44,61)
Father systolic blood pressure 140 (120,155)
Father diastolic blood pressure 80 (70,90)
Mother systolic blood pressure 145 (130,170)
Mother diastolic blood pressure 85 (75,95)
Mother arm girth 10 (9.8,11.8)
Father arm girth 9.8 (9,10.5)
sibling age 23 (14,33)
sibling sex
Male 550 (88%)
Female 76 (12%)
sibling arm girth 9.2 (8,10.3)
Number of siblings 4 (3,5)
Ecoli2 data: This data is about protein localization sites. Thisdata is created and maintained by Kenta Nakai [43].
The outcome variable is a binary class that represents theprotein localization site. It has two levels {positive andnegative}.
The positive examples belong to class pp and the negativeexamples belong to the rest.
This data contains 363 instances and 7 attributes (Table 2).Following is a description for the attributes of this data set:
mcg: McGeoch's method for signal sequence recognition.
gvh: von Heijne's method for signal sequence recognition.
lip: von Heijne's Signal Peptidase II consensus sequencescore. Binary attribute.
chg: Presence of charge on N-terminus of predictedlipoproteins. Binary attribute.
aac: Score of discriminant analysis of the amino acid contentof outer membrane and periplasmic proteins.
alm1: Score of the ALOM membrane spanning regionprediction program.
alm2: Score of ALOM program after excluding putativecleavable signal regions from the sequence.
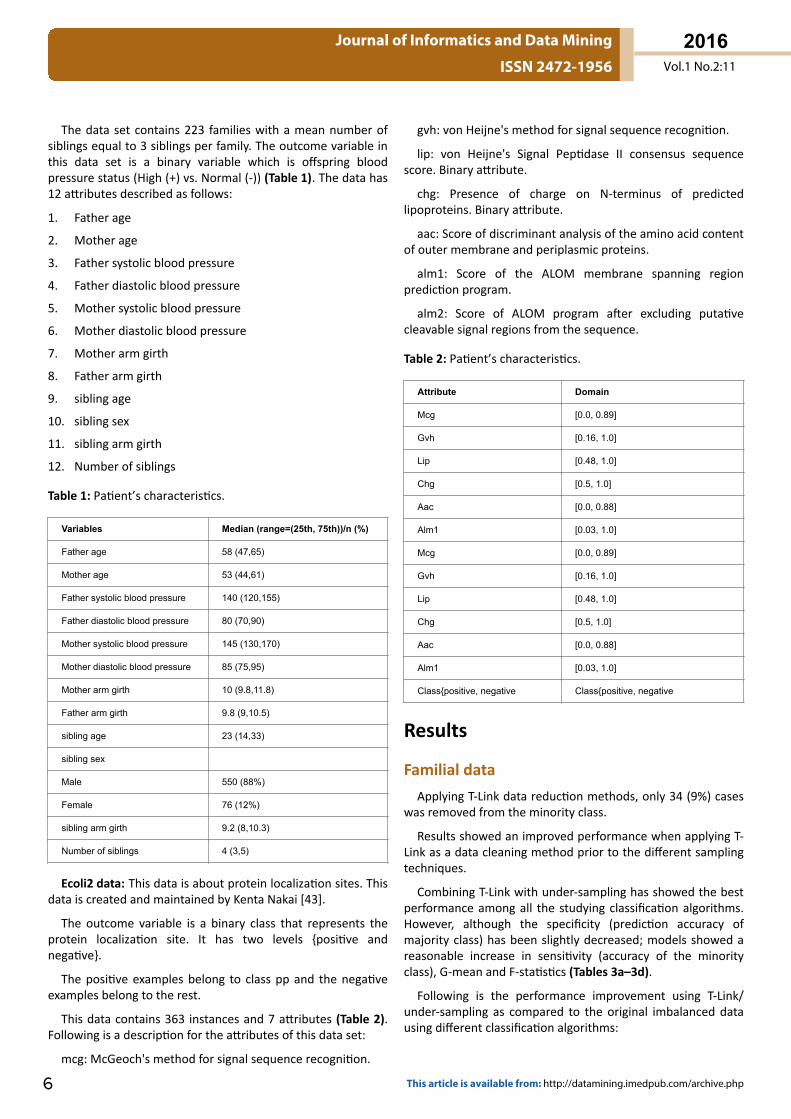
Table 2: Patient’s characteristics.
Attribute Domain
Mcg [0.0, 0.89]
Gvh [0.16, 1.0]
Lip [0.48, 1.0]
Chg [0.5, 1.0]
Aac [0.0, 0.88]
Alm1 [0.03, 1.0]
Mcg [0.0, 0.89]
Gvh [0.16, 1.0]
Lip [0.48, 1.0]
Chg [0.5, 1.0]
Aac [0.0, 0.88]
Alm1 [0.03, 1.0]
Class{positive, negative Class{positive, negative
Results
Familial dataApplying T-Link data reduction methods, only 34 (9%) cases
was removed from the minority class.
Results showed an improved performance when applying T-Link as a data cleaning method prior to the different samplingtechniques.
Combining T-Link with under-sampling has showed the bestperformance among all the studying classification algorithms.However, although the specificity (prediction accuracy ofmajority class) has been slightly decreased; models showed areasonable increase in sensitivity (accuracy of the minorityclass), G-mean and F-statistics (Tables 3a–3d).
Following is the performance improvement using T-Link/under-sampling as compared to the original imbalanced datausing different classification algorithms:
Journal of Informatics and Data Mining
ISSN 2472-1956 Vol.1 No.2:11
2016
6 This article is available from: http://datamining.imedpub.com/archive.php

SVM: Performance measures such as F-statistic, G-mean,sensitivity and weighted accuracy has been increased from 7%,19%, 4% and 52% to 45%, 74%, 74% and 74% in the originaldata as compared to T-Link/under-sampled data respectively.AUC has also been increased from 69% to 78% in the originaldata and T-Link/under-sampled data respectively.
ANN: Using original imbalanced data, F-statistic, G-mean,sensitivity and weighted accuracy were 30%, 45%, 26% and59%. However, using T-Link/under-sampling performancemeasures have been increased to 41%, 72%, 78% and 72%respectively. AUC was also improved from 70% to 79% usingoriginal data and T-Link/under-sampled data respectively.
Random Forest: using T-Link/under-sampling, F-statistic, G-mean, sensitivity and weighted accuracy have been increasedfrom 25%, 38%, 15% and 57% using original data to 37%, 67%,67% and67%. AUC has also been improved from 71% to 75%using the original data and T-Link/under-sampling respectively.
Logistic regression: LR also showed an improvedperformance using T-Link/under-sampling as compared tooriginal data. F-statistic, G-mean, sensitivity and weightedaccuracy have been increased from 7% to 42%, 19% to 71%,and 4 % to 66% and from 52% to 71% using the original dataand T-Link/under-sampled data respectively. AUC has alsoshowed an improved performance using T-Link/under-sampling (74% vs.79%).
Tables 3a-3d and Figure 3 shows comparative performanceresults of different classifiers using different samplingtechniques.
Ecoli2 data: Applying T-Link data reduction methods, only 36(13%) cases was removed from the minority class. Resultsshowed a comparable performance when applying T-Link priorto the different sampling techniques. Combining T-Link withunder-sampling has also showed a comparable performance ascompared to other sampling methods. Applying resamplingmethods, models showed a reasonable increase in sensitivity,G-mean and F-statistics (Tables 4a–4d). Following is theperformance improvement using T-Link/undersampling ascompared to the original imbalanced data using differentclassification algorithms:
SVM: The best results were shown using Tlink/undersampling as a re-sampling method. Performance
measures such as F-statistic, G-mean, sensitivity and weightedaccuracy has been increased from 63%, 74%, 58% and 76% to923%, 923%, 92% and 92% in the original data as compared toT-Link/under-sampled data respectively. AUC has also beenincreased from 91% to 95% in the original data and T-Link/under-sampled data respectively.
ANN: The best results were shown using Tlink/SMOTE re-sampling method. Using original imbalanced data, F-statistic,G-mean, sensitivity and weighted accuracy were 83%, 90%,85% and 90%. However, using T-Link/SMOTE performancemeasures have been increased to 96%, 96%, 94% and 96%respectively. AUC was also improved from 95% to 97% usingoriginal data and T-Link/under-sampled data respectively.
Random Forest: The best results were shown using T-link/SMOTE re-sampling method. Using T-Link/under-sampling, F-statistic, G-mean, sensitivity and weighted accuracy have beenincreased from 85%, 89%, 81% and 89% using original data to95%, 96%, 92% and 96%. AUC has also been improved from96% to 99% using the original data and T-Link/under-samplingrespectively.
Figure 3: Performance of different ML algorithms usingdifferent sampling techniques (family data).
Table 3: Performance measures of different sampling techniques using different leaning algorithms (familial data set).
Support VectorMachine Original T-link SMOTE SMOTE/T-Link
Over-sampling Over/T-link
Under-sampling Under/T-link
Sensitivity 0.037 0.037 0.481 0.481 0.519 0.556 0.667 0.741
Specificity 1 0.976 0.752 0.714 0.708 0.696 0.602 0.74
Accuracy 0.862 0.844 0.713 0.681 0.681 0.676 0.612 0.74
Weighted accuracy 0.519 0.506 0.617 0.598 0.613 0.626 0.635 0.74
Precision 1 0.2 0.245 0.22 0.23 0.234 0.22 0.323
NPV 0.861 0.861 0.896 0.891 0.898 0.903 0.915 0.944
Journal of Informatics and Data Mining
ISSN 2472-1956 Vol.1 No.2:11
2016
© Copyright iMedPub 7

F-statistics 0.071 0.063 0.325 0.302 0.318 0.33 0.33 0.449
G-mean 0.192 0.19 0.602 0.586 0.606 0.622 0.634 0.74
AUC 0.695 0.69 0.705 0.72 0.736 0.754 0.745 0.784
a) Support Vector Machine (SVM)
Artificial NeuralNetwork Original T-link SMOTE
SMOTE/T-Link
Over-sampling Over/T-link
Under-sampling Under/T-link
Sensitivity 0.259 0.333 0.444 0.481 0.556 0.481 0.704 0.778
Specificity 0.919 0.894 0.807 0.857 0.72 0.807 0.689 0.658
Accuracy 0.824 0.814 0.755 0.803 0.697 0.761 0.691 0.676
W-accuracy 0.589 0.614 0.626 0.669 0.638 0.644 0.697 0.718
Precision 0.35 0.346 0.279 0.361 0.25 0.295 0.275 0.276
NPV 0.881 0.889 0.897 0.908 0.906 0.903 0.933 0.946
F-statistics 0.298 0.34 0.343 0.413 0.345 0.366 0.396 0.408
G-mean 0.488 0.546 0.599 0.642 0.633 0.624 0.697 0.716
AUC 0.7 0.74 0.726 0.76 0.715 0.724 0.71 0.79
b) Artificial Neural Network (ANN)
Logistic regression Original T-link SMOTESMOTE/T-Link
Over-sampling Over/T-link
Under-sampling Under/T-link
Sensitivity 0.037 0.037 0.407 0.407 0.37 0.407 0.407 0.667
Specificity 1 1 0.82 0.783 0.853 0.795 0.776 0.752
Accuracy 0.862 0.862 0.761 0.729 0.781 0.739 0.723 0.739
W-accuracy 0.519 0.519 0.614 0.595 0.611 0.601 0.592 0.709
Precision 1 1 0.275 0.239 0.303 0.25 0.234 0.31
NPV 0.861 0.861 0.892 0.887 0.887 0.889 0.887 0.931
F-statistics 0.071 0.071 0.328 0.301 0.333 0.31 0.297 0.424
G-mean 0.192 0.192 0.578 0.565 0.562 0.569 0.562 0.708
AUC 0.74 0.73 0.712 0.722 0.737 0.73 0.704 0.792
c) Logistic Regression (LR)
Random Forest Original T-link SMOTESMOTE/T-Link
Over-sampling Over/T-link
Under-sampling Under/T-link
Sensitivity 0.148 0.222 0.259 0.37 0.296 0.296 0.63 0.667
Specificity 0.994 0.988 0.901 0.851 0.95 0.957 0.708 0.671
Accuracy 0.872 0.878 0.809 0.782 0.856 0.862 0.697 0.67
W-accuracy 0.571 0.605 0.58 0.611 0.623 0.626 0.669 0.669
Precision 0.8 0.75 0.304 0.294 0.5 0.533 0.266 0.254
PVP 0.874 0.883 0.879 0.89 0.89 0.89 0.919 0.923
F-statistics 0.25 0.343 0.28 0.328 0.372 0.381 0.374 0.367
G-mean 0.384 0.468 0.483 0.561 0.531 0.532 0.668 0.669
AUC 0.71 0.723 0.706 0.702 0.713 0.721 0.749 0.754
d) Random Forest (RF)
Journal of Informatics and Data Mining
ISSN 2472-1956 Vol.1 No.2:11
2016
8 This article is available from: http://datamining.imedpub.com/archive.php
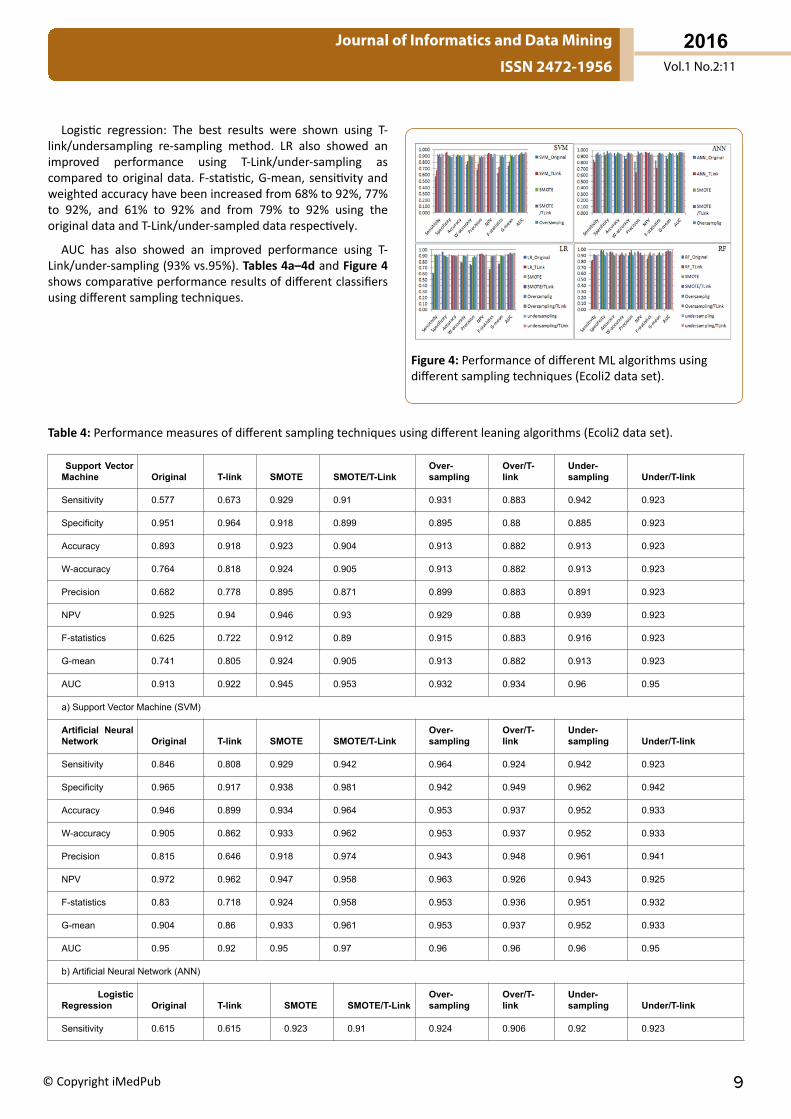
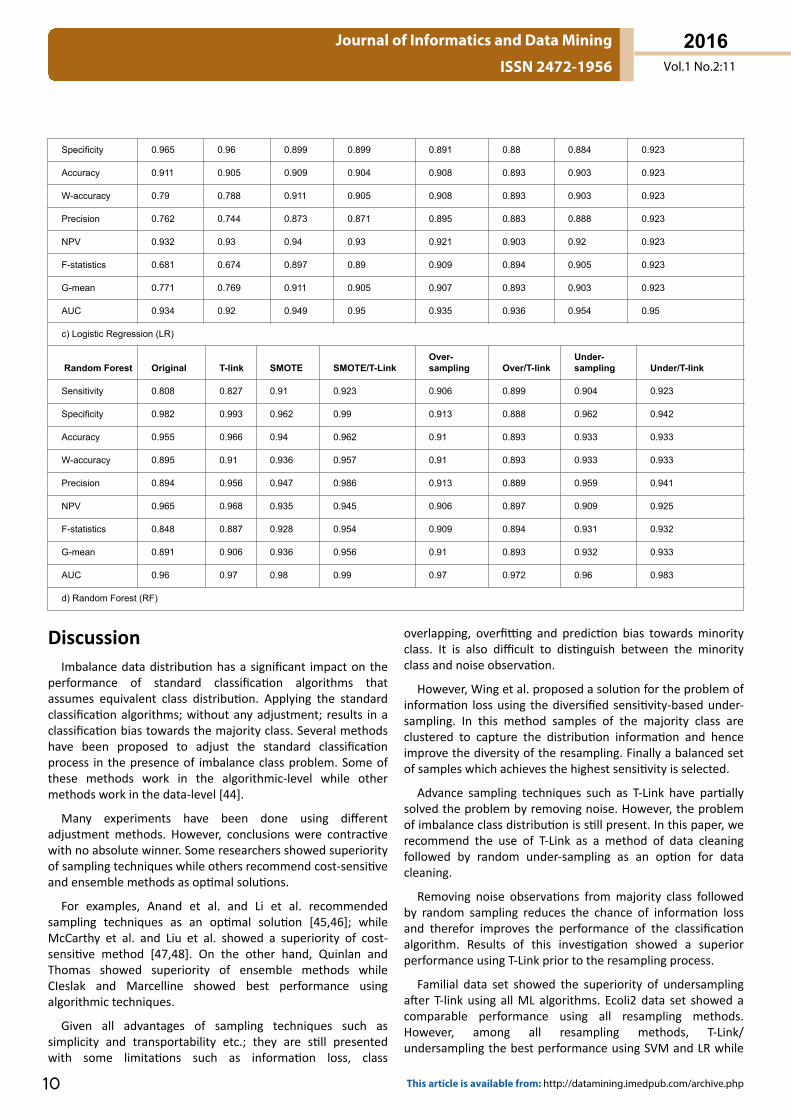
Logistic regression: The best results were shown using T-link/undersampling re-sampling method. LR also showed animproved performance using T-Link/under-sampling ascompared to original data. F-statistic, G-mean, sensitivity andweighted accuracy have been increased from 68% to 92%, 77%to 92%, and 61% to 92% and from 79% to 92% using theoriginal data and T-Link/under-sampled data respectively.
AUC has also showed an improved performance using T-Link/under-sampling (93% vs.95%). Tables 4a–4d and Figure 4shows comparative performance results of different classifiersusing different sampling techniques.
Figure 4: Performance of different ML algorithms usingdifferent sampling techniques (Ecoli2 data set).
Table 4: Performance measures of different sampling techniques using different leaning algorithms (Ecoli2 data set).
Support VectorMachine Original T-link SMOTE SMOTE/T-Link
Over-sampling
Over/T-link
Under-sampling Under/T-link
Sensitivity 0.577 0.673 0.929 0.91 0.931 0.883 0.942 0.923
Specificity 0.951 0.964 0.918 0.899 0.895 0.88 0.885 0.923
Accuracy 0.893 0.918 0.923 0.904 0.913 0.882 0.913 0.923
W-accuracy 0.764 0.818 0.924 0.905 0.913 0.882 0.913 0.923
Precision 0.682 0.778 0.895 0.871 0.899 0.883 0.891 0.923
NPV 0.925 0.94 0.946 0.93 0.929 0.88 0.939 0.923
F-statistics 0.625 0.722 0.912 0.89 0.915 0.883 0.916 0.923
G-mean 0.741 0.805 0.924 0.905 0.913 0.882 0.913 0.923
AUC 0.913 0.922 0.945 0.953 0.932 0.934 0.96 0.95
a) Support Vector Machine (SVM)
Artificial NeuralNetwork Original T-link SMOTE SMOTE/T-Link
Over-sampling
Over/T-link
Under-sampling Under/T-link
Sensitivity 0.846 0.808 0.929 0.942 0.964 0.924 0.942 0.923
Specificity 0.965 0.917 0.938 0.981 0.942 0.949 0.962 0.942
Accuracy 0.946 0.899 0.934 0.964 0.953 0.937 0.952 0.933
W-accuracy 0.905 0.862 0.933 0.962 0.953 0.937 0.952 0.933
Precision 0.815 0.646 0.918 0.974 0.943 0.948 0.961 0.941
NPV 0.972 0.962 0.947 0.958 0.963 0.926 0.943 0.925
F-statistics 0.83 0.718 0.924 0.958 0.953 0.936 0.951 0.932
G-mean 0.904 0.86 0.933 0.961 0.953 0.937 0.952 0.933
AUC 0.95 0.92 0.95 0.97 0.96 0.96 0.96 0.95
b) Artificial Neural Network (ANN)
LogisticRegression Original T-link SMOTE SMOTE/T-Link
Over-sampling
Over/T-link
Under-sampling Under/T-link
Sensitivity 0.615 0.615 0.923 0.91 0.924 0.906 0.92 0.923
Journal of Informatics and Data Mining
ISSN 2472-1956 Vol.1 No.2:11
2016
© Copyright iMedPub 9
Specificity 0.965 0.96 0.899 0.899 0.891 0.88 0.884 0.923
Accuracy 0.911 0.905 0.909 0.904 0.908 0.893 0.903 0.923
W-accuracy 0.79 0.788 0.911 0.905 0.908 0.893 0.903 0.923
Precision 0.762 0.744 0.873 0.871 0.895 0.883 0.888 0.923
NPV 0.932 0.93 0.94 0.93 0.921 0.903 0.92 0.923
F-statistics 0.681 0.674 0.897 0.89 0.909 0.894 0.905 0.923
G-mean 0.771 0.769 0.911 0.905 0.907 0.893 0.903 0.923
AUC 0.934 0.92 0.949 0.95 0.935 0.936 0.954 0.95
c) Logistic Regression (LR)
Random Forest Original T-link SMOTE SMOTE/T-LinkOver-sampling Over/T-link
Under-sampling Under/T-link
Sensitivity 0.808 0.827 0.91 0.923 0.906 0.899 0.904 0.923
Specificity 0.982 0.993 0.962 0.99 0.913 0.888 0.962 0.942
Accuracy 0.955 0.966 0.94 0.962 0.91 0.893 0.933 0.933
W-accuracy 0.895 0.91 0.936 0.957 0.91 0.893 0.933 0.933
Precision 0.894 0.956 0.947 0.986 0.913 0.889 0.959 0.941
NPV 0.965 0.968 0.935 0.945 0.906 0.897 0.909 0.925
F-statistics 0.848 0.887 0.928 0.954 0.909 0.894 0.931 0.932
G-mean 0.891 0.906 0.936 0.956 0.91 0.893 0.932 0.933
AUC 0.96 0.97 0.98 0.99 0.97 0.972 0.96 0.983
d) Random Forest (RF)
DiscussionImbalance data distribution has a significant impact on the
performance of standard classification algorithms thatassumes equivalent class distribution. Applying the standardclassification algorithms; without any adjustment; results in aclassification bias towards the majority class. Several methodshave been proposed to adjust the standard classificationprocess in the presence of imbalance class problem. Some ofthese methods work in the algorithmic-level while othermethods work in the data-level [44].
Many experiments have been done using differentadjustment methods. However, conclusions were contractivewith no absolute winner. Some researchers showed superiorityof sampling techniques while others recommend cost-sensitiveand ensemble methods as optimal solutions.
For examples, Anand et al. and Li et al. recommendedsampling techniques as an optimal solution [45,46]; whileMcCarthy et al. and Liu et al. showed a superiority of cost-sensitive method [47,48]. On the other hand, Quinlan andThomas showed superiority of ensemble methods whileCIeslak and Marcelline showed best performance usingalgorithmic techniques.
Given all advantages of sampling techniques such assimplicity and transportability etc.; they are still presentedwith some limitations such as information loss, class
overlapping, overfitting and prediction bias towards minorityclass. It is also difficult to distinguish between the minorityclass and noise observation.
However, Wing et al. proposed a solution for the problem ofinformation loss using the diversified sensitivity-based under-sampling. In this method samples of the majority class areclustered to capture the distribution information and henceimprove the diversity of the resampling. Finally a balanced setof samples which achieves the highest sensitivity is selected.
Advance sampling techniques such as T-Link have partiallysolved the problem by removing noise. However, the problemof imbalance class distribution is still present. In this paper, werecommend the use of T-Link as a method of data cleaningfollowed by random under-sampling as an option for datacleaning.
Removing noise observations from majority class followedby random sampling reduces the chance of information lossand therefor improves the performance of the classificationalgorithm. Results of this investigation showed a superiorperformance using T-Link prior to the resampling process.
Familial data set showed the superiority of undersamplingafter T-link using all ML algorithms. Ecoli2 data set showed acomparable performance using all resampling methods.However, among all resampling methods, T-Link/undersampling the best performance using SVM and LR while
Journal of Informatics and Data Mining
ISSN 2472-1956 Vol.1 No.2:11
2016
10 This article is available from: http://datamining.imedpub.com/archive.php

SMOTE/T-Link showed the best performance using RF andANN. Removing noise observations from majority classfollowed by random sampling reduces the chance ofinformation loss and therefor improves the performance ofthe classification algorithm.
Our finding comes along with the finding by Hartayuni andSanti where they showed that using combine samplingmethod; in their case; (SMOTE and T-Link) has an improvedperformance in terms of F-statistic, G-mean and AUC usingSVM as a classification algorithm[46]. By looking at (Table 4a),our data showed that using SMOTE and T-Link as a combinedsampling method has a better performance over T-Linksampling and the original data. However, in our study combingT-Link with under-sampling showed the best results.
Cost-sensitive techniques have a robust sense but stilllimited to some learning algorithms such as decision trees andneural networks. Cost-sensitive learning can lead to aclassification biased toward positive class because the positiveclass is assigned high misclassification error cost.Consequently, the decision region created by the algorithmwill be located far away from the positive instance. In this case,the learning algorithm needs to be modified in order to pushthe decision boundaries toward the positive samples to avoidclassification bias. Another problem using cost-sensitivelearning is that the real cost is usually unknown.
Ensemble methods are more casual and need minimalsetting. They run through many iterations that makes themmore accurate. The problem of this method is that they needlarge data and they are limited to decision trees. Algorithmicmethods are effective but they are limited by developmentcomplexity and have limited options.
ConclusionLearning from imbalanced data sets is an important topic,
both practically and for research. When learning fromimbalanced data, the classifiers are usually overwhelmed bythe majority class, so the minority class examples tend to bemisclassified.
The data presented in this study was severely imbalanced.Our main objective was to demonstrate that an improvementin the classification performance of the standard classificationalgorithms towards prediction of positive (rare) class usingpreprocessing techniques could be achieved.
Using T-Link method as a tool of data cleaning to removenoise prior to resampling methods such as randomundersampling and SMOTE identified the best performeramong different classification algorithms such as SVM, ANN,RF and LR. For this highly structured data set, under-samplingtechniques showed superiority in performance compared toover-sampling techniques among all studied classifiers.
AcknowledgementThe authors acknowledge the constructive comments made
by two anonymous reviewers.
References1. Qiang Yang, Xindong Wu (2006) 10 Challenging Problems in Data
Mining Research. International Journal of InformationTechnology & Decision Making 4: 597-604.
2. Gu J, Zhou Y, Zuo X (2007) Making Class Bias Useful: A Strategyof Learning from Imbalanced Data. Lecture Notes in ComputerScience, Intelligent Data Engineering and Automated Learning -IDEAL.
3. Choi MJ (2010) A Selective Sampling Method for ImbalancedData Learning on Support Vector Machines, Graduate Theses,Ioawa State University.
4. Tomek Ivan (1976) An Experiment with the Edited Nearest-Neighbor Rule. IEEE Transactions on Systems. Man, andCybernetics 6: 448-452.
5. Chawla NV, Bowyer KW, Hall LO, Kegelmeyer WP (2002) SMOTE:Synthetic Minority Over-sampling Technique. Journal of ArtificialIntelligence Research 16: 321-357.
6. Kubat M, Matwin S (1997) Addressing the curse of imbalancedtraining sets: One-sided selection. ICML, pp: 179-186.
7. Laurikkala J (2001) Improving Identification of Difficult SmallClasses by Balancing Class Distribution. AIME, LNAI 2101, pp:63-66.
8. Wilson DL (1972) Asymptotic Properties of Nearest NeighborRules Using Edited Data. IEEE Transactions on Systems. Man,and Communications 2: 408-421.
9. Angiulli F, Bucci P (2005) Fast condensed nearest neighbor ruleAppearing in Proceedings of the 22nd International Conferenceon Machine Learning, Bonn, Germany.
10. Jingbo Z, Eduard H (2007) Active Learning for Word SenseDisambiguation with Methods for Addressing the ClassImbalance Problem, Proc. of the Joint Conference on EmpiricalMethods in Natural Language Processing and ComputationalNatural Language Learning, pp: 783-790.
11. Shen A, Tong R, Deng Y (2007) Application of ClassificationModels on Credit Card Fraud Detection. InternationalConference on Service Systems and Service Management, IEEE.
12. Domingos P (1999) Metacost: A general method for makingclassifiers costsensitive. In Proceedings of the 5th internationalconference on knowledge discovery and data mining, pp:155-164.
13. Pazzani M, Merz C, Murphy P, Ali K, Hurne K, et al. (1994)Reducing misclassification costs: Knowledge-intensiveapproaches to learning from noisy data. In Proceedings of theEleventh International Conference on Machine Learningm, pp:217-225.
14. Zadrozny B, Langford J, Abe N (2003) Cost-sensitive learning bycostproportionate example weighting. In Proceedings of the 3rdIEEE international conference on data mining (ICDM’03), pp:435-442.
15. Sheng VS, Ling CX (2006) Thresholding for Making ClassifiersCost-sensitive. In Proceedings of the 21st National Conferenceon Artificial Intelligence pp: 476-481.
16. Chai X, Deng L, Yang Q, Ling CX (2004) Test-Cost Sensitive NaïveBayesian Classification. In Proceedings of the Fourth IEEEInternational Conference on Data Mining, UK.
Journal of Informatics and Data Mining
ISSN 2472-1956 Vol.1 No.2:11
2016
© Copyright iMedPub 11

17. Thai-Nghe Nguyen, Gantner Zeno, Schmidt-Thieme Lars (2010)Cost-Sensitive Learning Methods for Imbalanced Data. Inf. Syst.& Machine Learning Lab, Univ. Hildesheim, Germany.
18. Breiman L (1996) Bagging Predictors, Machine Learning, KluwerAcademic Publishers 24: 123-140.
19. Guyon I, Elissee A (2003) An introduction to variable and featureselection. Journal of Machine Learning Research 3: 1157-1182.
20. Chawla NV, Japkowicz N, (2004) Editorial: Special Issue onLearning from Imbalanced Data Sets. SIGKDD Explorations 6: 1.
21. Dietterich T, Kearns M, Mansour Y, (1996) Applying the weaklearning framework to understand and improve C4.5. In Proc13th International Conference on Machine Learning, pp: 96-100.
22. Marcellin S, Zighed DA, Ritschard G (2006) Detection of breastcancer using an asymmetric entropy measure. In: COMPSTAT-Proced. In Computational Statistics, pp: 975-982.
23. Drummond C, Holte RC (2003) C4.5, class imbalance, and costsensitivity: Why under sampling beats over-sampling. InWorkshop on Learning from Imbalanced Datasets II, held inconjunction with ICML.
24. Japkowicz N (2000) Learning from imbalanced data sets: acomparison of various strategies. AAAI Tech Report WS-00-05.
25. Tomek Ivan (1976) An Experiment with the Edited Nearest-Neighbor Rule. IEEE Transactions on Systems, Man, andCybernetics 6: 448-452.
26. Thai-Nghe N, Do TN, Schmidt-Thieme L (2000) Learning OptimalThreshold on Resampling Data to Deal with Class Imbalance.Proc. of the 8th IEEE International Conference on Computing.
27. Batista G, Carvalho A, Monard MC (2000) Applying One-sidedSelection to Unbalanced Datasets. In Proceedings of MICAI,315-325.
28. Estabrooks A, Jo T, Japkowicz N (2004) Multiple ResamplingMethod for Learning from Imbalanced Data Sets. ComputationalIntelligence 20: 18-36.
29. Taeho Jo, Japkowicz N (2004) Class Imbalances versus SmallDisjunction. Sigkdd Explorations 6: 40-49.
30. Guo H, Viktor HL (2004) Learning from Imbalanced Data Setswith Boosting and Data Generation: The Data Boost-IMApproach. Sigkdd Explorations 6: 30-39.
31. Hui Han, Wen-Yuan Wang, Bing-Huan Mao (2005) Borderline-SMOTE: A New Over-Sampling Method in Imbalanced Data SetsLearning. pp: 878-887.
32. Vapnik, Vladimir N (1995) The Nature of Statistical LearningTheory.
33. Noble W (2006) What is a support vector machine?. NatureBiotechnology 24: 1565-1567.
34. Cortes C, Vapnik V (1995) Support-vector network. MachineLearning 20: 273-297.
35. Cristianini N, Taylor S (2000) An Introduction to Support VectorMachines. Cambridge University Press, Cambridge, UK.
36. Cheng B, Titterington DM (1994) Neural Networks: A reviewfrom a Statistical Perspective. Statistical Science 9: 2-54.
37. Hosmer D, Lemeshow S (1989) Applied Logistic Regression. JWiley & Sons, NY: USA.
38. Miall WE, Oldham PO (1955) A study of arterial blood pressureand its inheritance in a sample of the general population.Clinical Science 14: 459-487.
39. http://sci2s.ugr.es/keel/dataset.php?cod=138#sub1
40. https://archive.ics.uci.edu/ml/machine-learning-databases/ecoli/ecoli.names
41. Wing W, Yeung DS (2014) Diversified Sensitivity-BasedUndersampling for Imbalance Classification Problems. IeeeTransactions on Cybernetics.
42. Anand A, Pugalenthi G, Fogel GB, Suganthan PN (2010) Anapproach for classification of highly imbalanced data usingweighting and under-sampling. Amino Acids 39: 5.
43. Li Q, Wang Y, Bryant S H (2009) A novel method for mininghighly imbalanced high-throughput Screening data in PubChem.Bioinformatics 25: 3310-3316.
44. McCarthy K, Zabar B, Weiss GM (2005) Does Cost-SensitiveLearning Beat Sampling for Classifying Rare Classes?. Proc. Int’lWorkshop Utility-Based Data Mining, pp: 69-77.
45. Liu XY, Zhou ZH (2006) The influence of class imbalance on costsensitive learning: An Empirical study. in Proceedings of the 6thICDM. Washington, DC, USA, pp: 970-974.
46. David CA (2009) Finding problems in, proposing solutions to,and performing analysis on imbalanced data. PhD Dissertation,University of Notre Dame, Indiana.
47. Marcellin Simon (2008) Arbres de décision en situationd’asymétrie. Phd Thesis informatique, Université Lumière LyonII, France.
48. Kotsiantis S, Kanellopoulos D, Pintelas P (2006) Handlingimbalanced datasets: A review. GESTS. InternationalTransactions on Computer Science and Engineering 30: 25-36.
Journal of Informatics and Data Mining
ISSN 2472-1956 Vol.1 No.2:11
2016
12 This article is available from: http://datamining.imedpub.com/archive.php