classification of aerosols over saudi arabia from 2004–2016
TRANSCRIPT

Journal Pre-proof
Classification of aerosols over Saudi Arabia from 2004–2016
Md Arfan Ali, Janet E. Nichol, Muhammad Bilal, Zhongfeng Qiu, Usman Mazhar, MdWahiduzzaman, Mansour Almazroui, M. Nazrul Islam
PII: S1352-2310(20)30517-3
DOI: https://doi.org/10.1016/j.atmosenv.2020.117785
Reference: AEA 117785
To appear in: Atmospheric Environment
Received Date: 24 February 2020
Revised Date: 3 July 2020
Accepted Date: 12 July 2020
Please cite this article as: Ali, M.A., Nichol, J.E., Bilal, M., Qiu, Z., Mazhar, U., Wahiduzzaman, M.,Almazroui, M., Islam, M.N., Classification of aerosols over Saudi Arabia from 2004–2016, AtmosphericEnvironment (2020), doi: https://doi.org/10.1016/j.atmosenv.2020.117785.
This is a PDF file of an article that has undergone enhancements after acceptance, such as the additionof a cover page and metadata, and formatting for readability, but it is not yet the definitive version ofrecord. This version will undergo additional copyediting, typesetting and review before it is publishedin its final form, but we are providing this version to give early visibility of the article. Please note that,during the production process, errors may be discovered which could affect the content, and all legaldisclaimers that apply to the journal pertain.
© 2020 Published by Elsevier Ltd.

CRediT authorship contribution statement
Md. Arfan Ali: Conceptualization, Data curation, Methodology, Formal analysis, Investigation,
Validation, Visualization, Writing - original draft. Janet E. Nichol: Supervision, Investigation,
Writing - review & editing. Muhammad Bilal: Conceptualization, Investigation, Visualization,
Writing - review & editing. Zhongfeng Qiu: Supervision, Writing - review & editing. Usman
Mazhar: Data curation. Md Wahiduzzaman: Data curation. Mansour Almazroui: Data
curation. M. Nazrul Islam: Data curation.
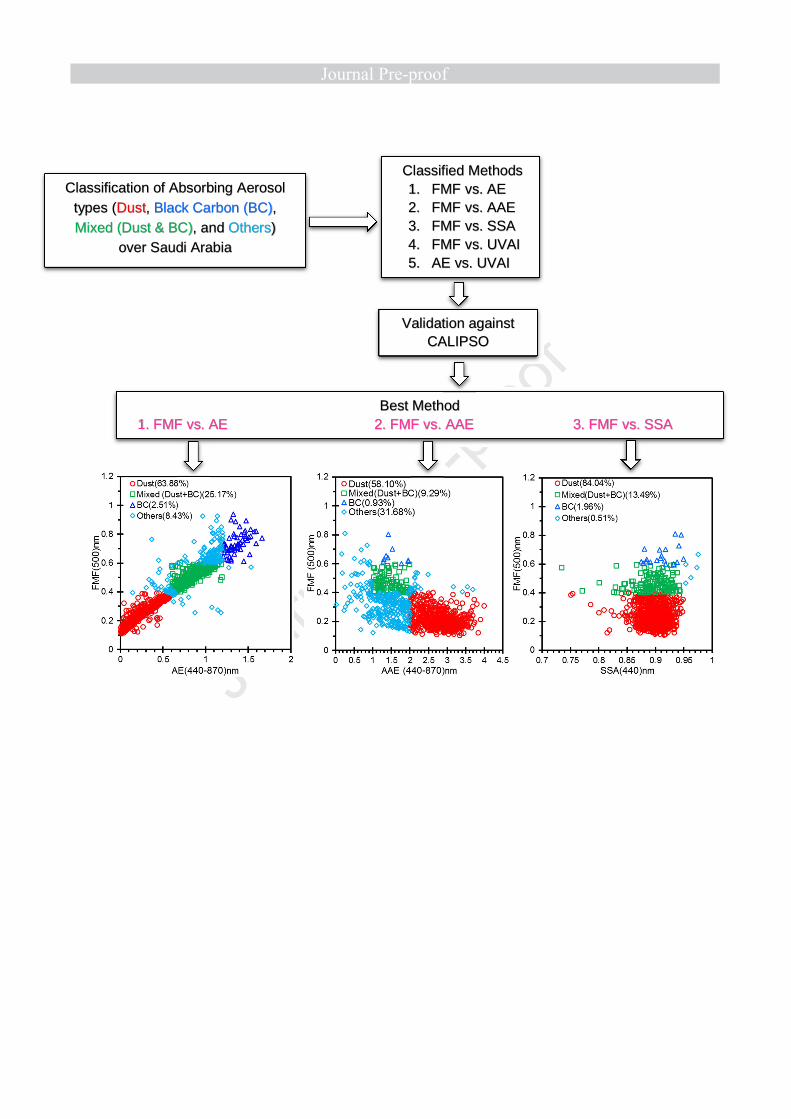
Classified Methods 1. FMF vs. AE 2. FMF vs. AAE 3. FMF vs. SSA 4. FMF vs. UVAI 5. AE vs. UVAI
Classification of Absorbing Aerosol types (Dust, Black Carbon (BC), Mixed (Dust & BC), and Others)
over Saudi Arabia
Validation against CALIPSO
Best Method 1. FMF vs. AE 2. FMF vs. AAE 3. FMF vs. SSA
1
Classification of aerosols over Saudi Arabia from 2004−2016 1
2
Md. Arfan Ali 1, †, Janet E. Nichol2, †, Muhammad Bilal1*, Zhongfeng Qiu1, Usman Mazhar3, 3
Md Wahiduzzaman4, Mansour Almazroui5, M. Nazrul Islam5 4
1School of Marine Sciences, Nanjing University of Information Science and Technology, 5
Nanjing 210044, China 6
2Department of Geography, School of Global Studies, University of Sussex, UK 7
3School of Remote Sensing and Geomatics Engineering, Nanjing University of Information 8
Science and Technology, Nanjing 210044, China 9
4Institute for Climate and Application Research, Nanjing University of Information Science and 10
Technology, Nanjing 210044, China. 11
5Center of Excellence for Climate Change Research/Department of Meteorology, King 12
Abdulaziz University, Jeddah 21589, Saudi Arabia 13
*Email: [email protected] 14
†Authors with equal contributions. 15
Abstract 16
Knowledge of aerosol size and composition is very important for investigating the 17
radiative forcing impacts of aerosols, distinguishing aerosol sources, and identifying harmful 18
particulate types in air quality monitoring. The ability to identify aerosol type synoptically would 19
greatly contribute to the knowledge of aerosol type distribution at both regional and global 20
scales, especially where there are no data on chemical composition. In this study, aerosol 21
classification techniques were based on aerosol optical properties from remotely-observed data 22
from the Ozone Monitoring Instrument (OMI) and Aerosol Robotic Network (AERONET) over 23
Saudi Arabia for the period 2004−2016 and validated using data from the Cloud-Aerosol Lidar 24
and Infrared Pathfinder Satellite Observation (CALIPSO). For this purpose, the OMI-based 25
2
Aerosol Absorption Optical Depth (AAOD) and Ultra-Violet Aerosol Index (UVAI), and 26
AERONET-based AAOD, Ångström Exponent (AE), Absorption Ångström Exponent (AAE), 27
Fine Mode Fraction (FMF), and Single Scattering Albedo (SSA) were obtained. Spatial analysis 28
of the satellite-based OMI-AAOD showed the dominance of absorbing aerosols over the study 29
area, but with high seasonal variability. The study found significant underestimation by OMI 30
AAOD suggesting that the OMAERUV product may need improvement over bright desert 31
surfaces such as the study area. Aerosols were classified into (i) Dust, (ii) Black Carbon (BC), 32
and (iii) Mixed (BC and Dust) based on the relationships technique, between the aerosol 33
absorption properties (AAE, SSA, and UVAI) and size parameters (AE and FMF). Additionally, 34
the AE vs. UVAI and FMF vs. UVAI relationships misclassified the aerosol types over the study 35
area, and the FMF vs. AE, FMF vs. AAE and FMF vs. SSA relationships were found to be 36
robust. As expected, the dust aerosol type was dominant both annually and seasonally due to 37
frequent dust storm events. Also, fine particulates such as BC and Mixed (BC and Dust) were 38
observed, likely due to industrial activities (cement, petrochemical, fertilizer), water desalination 39
plants, and electric energy generation. This is the first study to classify aerosol types over Saudi 40
Arabia using several different aerosol property relationships, as well as over more than one site, 41
and using data over a much longer time-period than previous studies. This enables classification 42
and recognition of specific aerosol types over the Arabian Peninsula and similar desert regions. 43
Keywords: Aerosols; AERONET; Single Scattering Albedo; Absorption Ångström Exponent; 44
Ozone Monitoring Instrument; Aerosol Absorption Optical Depth. 45
46
1 Introduction 47
Atmospheric aerosol particles comprise solid and liquid materials differing in size from a 48
few nanometers to larger than 100 micro-meters, with intricate composition and volatility in their 49
physiochemical properties (Ali et al., 2019; Ali and Assiri, 2019; Almazroui, 2019). Over Asia, 50
an immense diversity of aerosol types exist, due to rapid industrialization and urbanization. This 51
creates uncertainty in assessing global climate change (Eck et al., 2010). Atmospheric aerosols 52
are considered a major element of the earth’s climate system, as they remodel the climate and 53
radiative balance directly by scattering and absorbing incoming solar radiation (Ali et al., 2017), 54
whilst indirectly changing cloud optical properties and providing condensation nuclei (Kaufman 55
3
et al., 2005). Classification of aerosols into different types can improve the precision of radiative 56
balance, and assist climate modelling. 57
Aerosol types such as dust, organics, sea salt, and sulfate are predominantly reflective 58
and scatter incoming solar radiation back to space, thus cooling the atmosphere (Bilal et al., 59
2013). However, other aerosols have more absorbing than scattering properties (Li et al., 2016). 60
The main absorbers in the aerosol mixture are iron oxides from dust, and Black Carbon (BC) 61
released from biomass burning and combustion processes and Brown Carbon (BrC) from organic 62
mattter combustion (Wang et al., 2011). Moreover, iron oxides, BC and (BrC) show the greatest 63
absorption from the ultraviolet (UV) to the visible region (Eck et al., 2010; Liakakou et al., 64
2020), while BC particles display constant absorption across the entire solar region (Bergstrom et 65
al., 2002). A thorough understanding of climate forcing due to aerosol requires knowledge of 66
aerosol concentration, its composition, size, and optical properties such as absorption or 67
scattering. The aerosol size distribution and absorption properties can be used to classify the 68
aerosols over the region (Higurashi and Nakajima, 2002; Lee et al., 2010). These properties vary 69
spatially and temporally (Choi et al., 2009) according to the season, emission sources, and 70
aerosol transportation (Ram et al., 2016). 71
The ground-based Aerosol Robotic Network (AERONET) provides aerosol absorptivity, 72
from the Absorption Ångström Exponent (AAE) at 440‒870 nm and Single Scattering Albedo 73
(SSA) at 440 nm data. Complementing this, the Ozone Monitoring Instrument (OMI) on the 74
Aura satellite also provides aerosol absorbing properties such as the Ultra-Violet Aerosol Index 75
(UVAI) and Aerosol Absorption Optical Depth (AAOD) (Eq. 1) calculated in the UV and visible 76
bands (Adesina et al., 2016) (Table 1). Light absorbing particles (e.g., dust, BC, or BrC) in the 77
atmosphere can be determined by single scattering albedo (SSA) and absorbing aerosol optical 78
depth (AAOD) (Shin et al., 2019). The AAOD is the columnar aerosol loading (i.e. AOD) due to 79
light absorption based on the relationship 80
AAOD = (1-SSA) × AOD (1) 81
This is the most important parameter for the evaluation of atmospheric warming due to light 82
absorbing aerosols. Hu et al. (2016) reported that high AAOD levels commonly found over East 83
4
Asia result mainly from aerosol mixtures comprising desert dust, industrial pollutants, and smoke 84
from biomass burning. The study and classification of absorbing aerosols over the globe based 85
on AERONET and satellite observations is well established (Cazorla et al., 2013; Logan et al., 86
2013; Logothetis et al., 2020; Kedia et al., 2014; Rupakheti et al., 2019, 2019a; Shen et al., 87
2019). Dubovik et al. (2002) established the relationship technique, which uses relationships 88
between different optical properties of aerosols derived from AERONET and laboratory 89
measurements, for the classification of global aerosols. Thus the relationship techniques of FMF 90
(Fine Mode Fraction) vs. AE, FMF vs. AAE, FMF vs. SSA, AE vs. UVAI, and FMF vs. UVAI 91
can be used to distinguish the major aerosol types (Tables 1 and 2). Since then, studies have used 92
different relationship techniques, including FMF vs. AE (Eck et al., 2010), FMF vs. AAE (Giles 93
et al., 2011), FMF vs. SSA (Lee et al., 2010; Giles et al., 2012), AE vs. UVAI and FMF vs. 94
UVAI (Bibi et al., 2017) to classify aerosols into dust modes and BC). For example, low values 95
of FMF vs. AE indicate coarse mode dust aerosol (Aloysius et al., 2009); and high values of 96
FMF (> 0.6) and intermediate values of AAE (1.0 < AAE < 2.00) indicate BC aerosols (Giles et 97
al., 2011). Similarly, values of SSA (SSA ≤ 0.95) and high values of FMF also indicate BC 98
aerosols (Lee et al., 2010; Giles et al., 2012). Several studies have used relationship techniques 99
from ground-based instruments alone, including Schmeisser et al. (2017), Jose et al. (2016) who 100
classified absorbing aerosols over Hyderabad, India, Alam et al. (2016) over urban areas of 101
Pakistan, and Gharibzadeh et al., (2018) over Iran. A validation and comparison of the 102
classifications done based on FMF vs. SSA are suggested to be included with the previous 103
studies done by Srivastava et al. (2012) and Tiwari et al. (2015) at different locations in India 104
and Pakistan. Bibi et al. (2016; 2017) classified aerosol types using ground-based and satellite-105
based aerosol optical properties over Karachi (Pakistan) and the Indo-Gangetic Plain (IGP). 106
However, only a few such studies are available over the Middle-East. Of these, Farahat et 107
al. (2016) reported only a single aerosol type: dust, over the Middle-East and North Africa. Al-108
Salihi (2018) classified aerosols based on AOD and AE relationship and over only one site, 109
Baghdad, Iraq, reporting four different aerosol types (maritime, dust, urban, and biomass 110
burning). The few aerosol classification studies conducted over Saudi Arabia have used only 111
one site in Saudi Arabia, the Solar Village, as part of larger studies in other regions. For 112
example, Logothetis et al. (2020) classified aerosols into eight types (Fine (highly, moderately, 113

5
slightly, and non-absorbing), mixed (absorbing and non-absorbing), coarse (absorbing and non-114
absorbing)) based on FMF, SSA, and AE relationships over Europe, the Middle East, North-115
Africa and Arabian Peninsula. Kaskaoutis et al. (2007) classified aerosols into four types (clean 116
maritime, biomass burning-urban, desert dust, and mixed) using relationship techniques over 117
four continents and other studies include Chen et al. (2016) and Mao et al. (2019) who also 118
included Saudi Arabia’s Solar Village, Riyadh site as part of a larger study. None included the 119
KAUST Campus site in Jeddah, which is situated at the other side of the country (Figure 1), and 120
thus could offer a wider perspective of aerosol properties. Because Saudi Arabia has distinctive 121
geographical and climatic environments, which differentiate it from other countries, accurate 122
classification of aerosols cannot rely on universal classifications. High aerosol concentrations 123
over Saudi Arabia have traditionally been attributed to frequent dust storms (Awad and Mashat, 124
2014; Almazroui et al., 2015; Awad et al., 2015; Kumar et al., 2018; Ali and Assiri, 2016, 2019; 125
Mashat et al., 2019, 2020). However, the booming oil, and gas industry generating 126
unprecedented economic growth, have stimulated, rapid urbanization and industrial 127
128
129
130
131
132
133
134
135
136
137
6
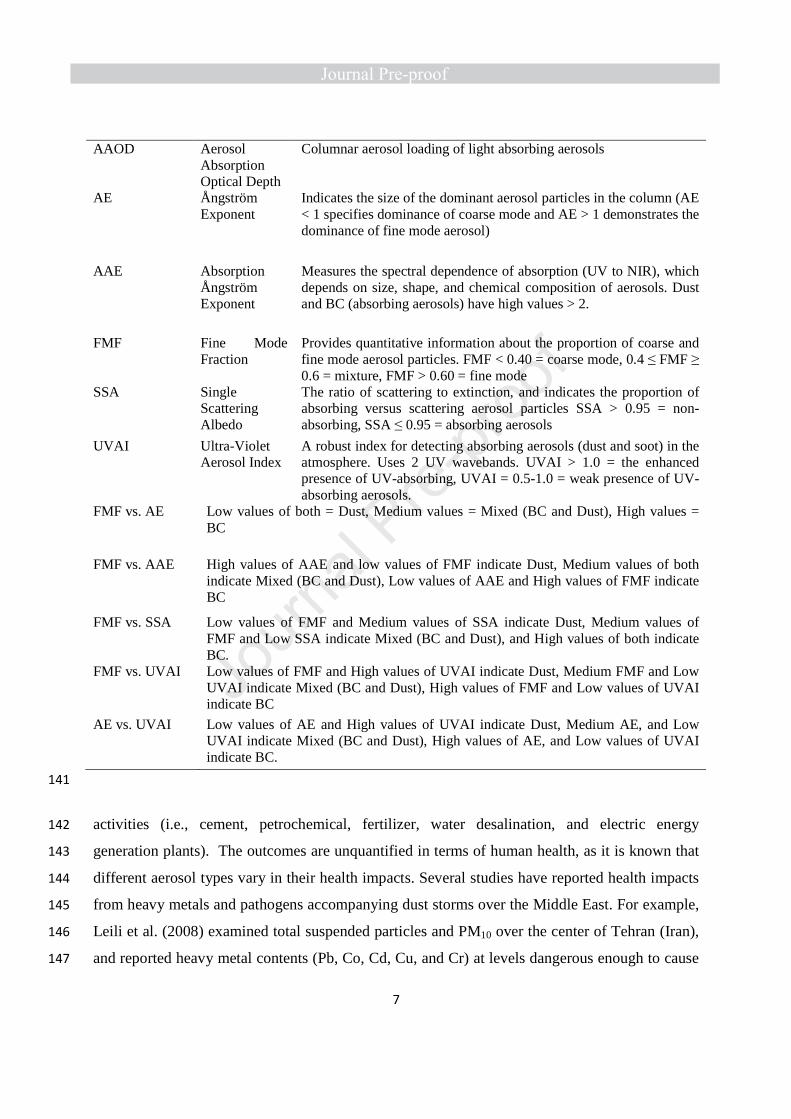
Table 1 Definition of aerosol optical properties and relationship indicators. 138
139
140
Index designation
Name Indicator
7
141
activities (i.e., cement, petrochemical, fertilizer, water desalination, and electric energy 142
generation plants). The outcomes are unquantified in terms of human health, as it is known that 143
different aerosol types vary in their health impacts. Several studies have reported health impacts 144
from heavy metals and pathogens accompanying dust storms over the Middle East. For example, 145
Leili et al. (2008) examined total suspended particles and PM10 over the center of Tehran (Iran), 146
and reported heavy metal contents (Pb, Co, Cd, Cu, and Cr) at levels dangerous enough to cause 147
AAOD Aerosol Absorption Optical Depth
Columnar aerosol loading of light absorbing aerosols
AE Ångström Exponent
Indicates the size of the dominant aerosol particles in the column (AE < 1 specifies dominance of coarse mode and AE > 1 demonstrates the dominance of fine mode aerosol)
AAE Absorption Ångström Exponent
Measures the spectral dependence of absorption (UV to NIR), which depends on size, shape, and chemical composition of aerosols. Dust and BC (absorbing aerosols) have high values > 2.
FMF Fine Mode Fraction
Provides quantitative information about the proportion of coarse and fine mode aerosol particles. FMF < 0.40 = coarse mode, 0.4 ≤ FMF ≥ 0.6 = mixture, FMF > 0.60 = fine mode
SSA Single Scattering Albedo
The ratio of scattering to extinction, and indicates the proportion of absorbing versus scattering aerosol particles SSA > 0.95 = non-absorbing, SSA ≤ 0.95 = absorbing aerosols
UVAI Ultra-Violet Aerosol Index
A robust index for detecting absorbing aerosols (dust and soot) in the atmosphere. Uses 2 UV wavebands. UVAI > 1.0 = the enhanced presence of UV-absorbing, UVAI = 0.5-1.0 = weak presence of UV-absorbing aerosols.
FMF vs. AE Low values of both = Dust, Medium values = Mixed (BC and Dust), High values = BC
FMF vs. AAE High values of AAE and low values of FMF indicate Dust, Medium values of both indicate Mixed (BC and Dust), Low values of AAE and High values of FMF indicate BC
FMF vs. SSA Low values of FMF and Medium values of SSA indicate Dust, Medium values of FMF and Low SSA indicate Mixed (BC and Dust), and High values of both indicate BC.
FMF vs. UVAI Low values of FMF and High values of UVAI indicate Dust, Medium FMF and Low UVAI indicate Mixed (BC and Dust), High values of FMF and Low values of UVAI indicate BC
AE vs. UVAI Low values of AE and High values of UVAI indicate Dust, Medium AE, and Low UVAI indicate Mixed (BC and Dust), High values of AE, and Low values of UVAI indicate BC.
8
neurodevelopmental and behavioral defects in children. Other findings of high heavy metal 148
content of airborne dust in the Middle East include Foroushani et al. (2019) in western Iran, and 149
Farahmandkia et al. (2010) in Tehran. Studies, which linked heavy metals in dust with serious 150
human health concerns, include Leili et al. (2008) in Tehran, Jiries et al. (2003) in Amman, 151
Jordan, and Al-Rajhi et al. (1996) in Riyadh. In addition to heavy metals, Gerivani et al. (2011) 152
found that dust storms in Iran can contain and transport viruses, which affect human populations 153
and Saeedi et al. (2012) reported dust particles containing polycyclic aromatic hydrocarbons 154
(PAHs) in Teheran. A potentially beneficial impact of dust particles, is their role in carrying 155
nutrients to the marine ecosystem of the Northern Red Sea (Jeddah) and their contribution to 156
nutrient balance continues largely unexplored (Prakash et al., 2015). The amplified threats of 157
climate change for desert animals world-wide are magnified in Saudi Arabia (Williams et al., 158
2012). Thus, the classification of aerosols over the Arabian Peninsula for accurate estimates of 159
climate forcing and health impacts is urgent. This study uses available ground-based AERONET 160
sites within Saudi Arabia i.e., the Solar Village and KAUST Campus sites, combined with 161
satellite data from the Ozone Monitoring Instrument (OMI) to classify the predominant types of 162
aerosols over Saudi Arabia. 163
The main contributions of the current research are (a) the long-term period and spatial 164
spread of observations that makes the results more robust and (b) the selection of the most 165
appropriate technique (classification scheme) for the determination of different aerosol types 166
over Arabia, based on comparison with CALIPSO. 167
2 Study area and Data-sets 168
2.1 Study Area 169
Saudi Arabia is the largest country in the Middle-East, covering 80% of the Arabian 170
Peninsula with an area of approximately 2,218,000 km2 (Figure 1), and is bordered by the 171
Arabian Gulf and the Red Sea. The largest desert, the Rub al Khali or Empty Quarter covers 172
647,500 Km2 in the southern part of the country and is a source of frequent dust outbreaks and 173
severe dust storms. The country comprises 13 provinces and a total of 104 cities, of which the 20 174
largest have over 100,000 residents. This study was accomplished over the two AERONET 175
ground stations in Saudi Arabia: Solar Village and KAUST Campus (Figure 1). The Solar 176
Village (24.91˚ N, 46.41˚ E and 764 m a.s.l) is approximately 50 km from the north-west 177
9
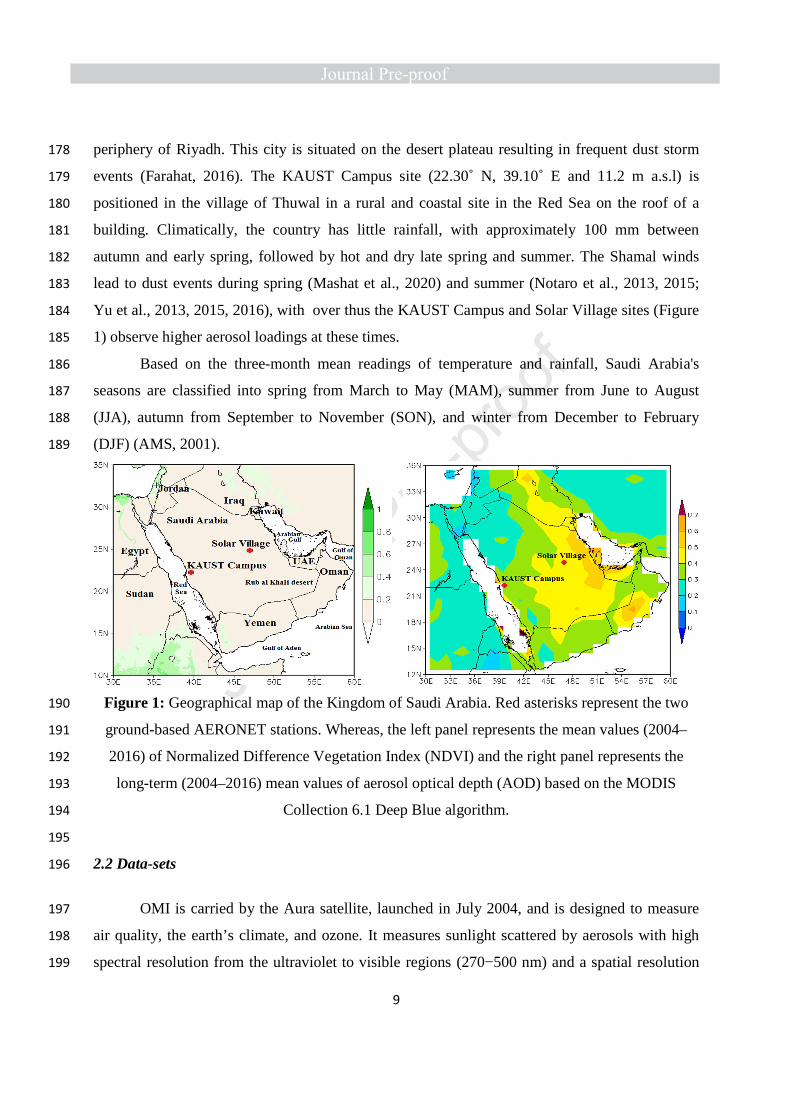
periphery of Riyadh. This city is situated on the desert plateau resulting in frequent dust storm 178
events (Farahat, 2016). The KAUST Campus site (22.30˚ N, 39.10˚ E and 11.2 m a.s.l) is 179
positioned in the village of Thuwal in a rural and coastal site in the Red Sea on the roof of a 180
building. Climatically, the country has little rainfall, with approximately 100 mm between 181
autumn and early spring, followed by hot and dry late spring and summer. The Shamal winds 182
lead to dust events during spring (Mashat et al., 2020) and summer (Notaro et al., 2013, 2015; 183
Yu et al., 2013, 2015, 2016), with over thus the KAUST Campus and Solar Village sites (Figure 184
1) observe higher aerosol loadings at these times. 185
Based on the three-month mean readings of temperature and rainfall, Saudi Arabia's 186
seasons are classified into spring from March to May (MAM), summer from June to August 187
(JJA), autumn from September to November (SON), and winter from December to February 188
(DJF) (AMS, 2001). 189
Figure 1: Geographical map of the Kingdom of Saudi Arabia. Red asterisks represent the two 190
ground-based AERONET stations. Whereas, the left panel represents the mean values (2004–191
2016) of Normalized Difference Vegetation Index (NDVI) and the right panel represents the 192
long-term (2004–2016) mean values of aerosol optical depth (AOD) based on the MODIS 193
Collection 6.1 Deep Blue algorithm. 194
195
2.2 Data-sets 196
OMI is carried by the Aura satellite, launched in July 2004, and is designed to measure 197
air quality, the earth’s climate, and ozone. It measures sunlight scattered by aerosols with high 198
spectral resolution from the ultraviolet to visible regions (270−500 nm) and a spatial resolution 199

10
of 13−24 km (Levelt et al., 2006). The OMI near-UV aerosol retrieval algorithm (OMAERUV) 200
can be used to measure prominent absorbing aerosols such as dust and carbonaceous aerosols 201
(Torres et al., 2007). The OMAERUV algorithm utilizes the near-UV spectral region for 202
estimation of AAOD and UVAI products. Of major interest in the near-UV measurements is the 203
powerful interaction between aerosol absorption and scattering in this spectral region, which 204
facilitates the calculation of aerosol absorption capacity. For this study, OMI Level 2 and Level 3 205
OMAERUV OMI AAOD (500 nm) data were obtained from 206
https://giovanni.gsfc.nasa.gov/mapss/ and "https://giovanni.gsfc.nasa.gov/giovanni/", 207
respectively. 208
The Cloud-Aerosol Lidar and Infrared Pathfinder Satellite Observation (CALIPSO) was 209
launched on 28th April 2006 on the CloudSat satellite to study the roles of aerosols and clouds in 210
earth’s air quality, weather and climate. The CALIPSO gives information on aerosol vertical 211
profiles and 3-dimensional information of aerosol properties throughout day and night over the 212
globe (Winker et al., 2003), based on the Cloud-Aerosol Lidar with Orthogonal Polarization 213
(CALIOP) sensor. The aerosol lidar ratio, a key parameter for extinction retrieval, is determined 214
for each aerosol subtype based on measurements, modelling, and the cluster analysis of a 215
multiyear Aerosol Robotic Network (AERONET) dataset (Omar et al., 2005, 2009), they are 216
considered more accurate than other measurements (Su et al., 2020). In version 3 (V3) and 217
earlier, the CALIOP level 2 aerosol classification and lidar ratio selection algorithm defined six 218
aerosol types: clean marine, dust, polluted continental, clean continental, polluted dust, and 219
smoke (Omar et al., 2009). Each type is assigned an extinction-to-backscatter ratio (i.e., lidar 220
ratio) with an associated uncertainty that defines the limits of its expected natural variability 221
(https://www.atmos-meas-tech.net/11/6107/2018/amt-11-6107-2018.pdf). This study used the 222
Level 2 CALIPSO version 4.10 aerosol-type profiles for aerosol classification. These images 223
were downloaded from https://www-224
calipso.larc.nasa.gov/products/lidar/browse_images/std_v4_index.php. The temporal resolution 225
of 16 days for CALIPSO makes it unsuitable for continuous monitoring, but due to its accuracy, 226
it is used in this study for validation. 227
The AERONET is NASA’s ground-based aerosol network, which has more than 700 228
stations over the globe (Holben et al., 1998). The data are commonly used for validating satellite-229
11
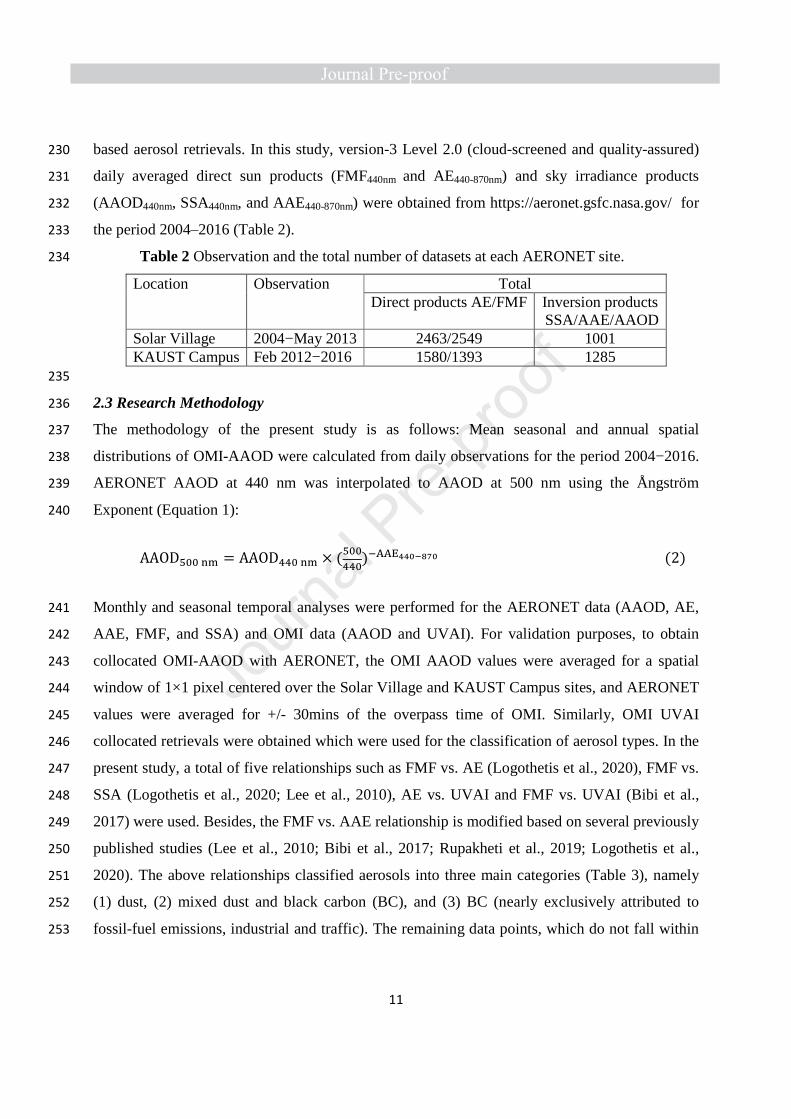
based aerosol retrievals. In this study, version-3 Level 2.0 (cloud-screened and quality-assured) 230
daily averaged direct sun products (FMF440nm and AE440-870nm) and sky irradiance products 231
(AAOD440nm, SSA440nm, and AAE440-870nm) were obtained from https://aeronet.gsfc.nasa.gov/ for 232
the period 2004‒2016 (Table 2). 233
Table 2 Observation and the total number of datasets at each AERONET site. 234
Location Observation Total Direct products AE/FMF Inversion products
SSA/AAE/AAOD Solar Village 2004−May 2013 2463/2549 1001 KAUST Campus Feb 2012−2016 1580/1393 1285 235
2.3 Research Methodology 236
The methodology of the present study is as follows: Mean seasonal and annual spatial 237
distributions of OMI-AAOD were calculated from daily observations for the period 2004−2016. 238
AERONET AAOD at 440 nm was interpolated to AAOD at 500 nm using the Ångström 239
Exponent (Equation 1): 240
AAOD��� �� = AAOD� �� × (���
�)����������� (2)
Monthly and seasonal temporal analyses were performed for the AERONET data (AAOD, AE, 241
AAE, FMF, and SSA) and OMI data (AAOD and UVAI). For validation purposes, to obtain 242
collocated OMI-AAOD with AERONET, the OMI AAOD values were averaged for a spatial 243
window of 1×1 pixel centered over the Solar Village and KAUST Campus sites, and AERONET 244
values were averaged for +/- 30mins of the overpass time of OMI. Similarly, OMI UVAI 245
collocated retrievals were obtained which were used for the classification of aerosol types. In the 246
present study, a total of five relationships such as FMF vs. AE (Logothetis et al., 2020), FMF vs. 247
SSA (Logothetis et al., 2020; Lee et al., 2010), AE vs. UVAI and FMF vs. UVAI (Bibi et al., 248
2017) were used. Besides, the FMF vs. AAE relationship is modified based on several previously 249
published studies (Lee et al., 2010; Bibi et al., 2017; Rupakheti et al., 2019; Logothetis et al., 250
2020). The above relationships classified aerosols into three main categories (Table 3), namely 251
(1) dust, (2) mixed dust and black carbon (BC), and (3) BC (nearly exclusively attributed to 252
fossil-fuel emissions, industrial and traffic). The remaining data points, which do not fall within 253

12
the classification thresholds, are denoted as other aerosol types. Finally, the identified aerosol 254
types were confirmed by comparison with satellite aerosol products from CALIPSO datasets. 255
Table 3 Classification of aerosol types over Saudi Arabia using threshold values taken from 256
previous studies. 257
258
3 Results and Discussion 259
3.1 Spatial distribution of OMI-based AAOD 260
Figures 2 and 3 show the mean annual and seasonal Level-3 OMI-AAOD retrievals at 500 nm of 261
over Saudi Arabia for 2004−2016. Figure 2 shows high AAOD values (greater than 0.03) over 262
the Eastern provinces, moderate AAOD (0.018 to 0.03) over most parts of the country, and low 263
AAOD (0.01 to 0.018) in the North-Western region. These AAOD values are less than 10% of 264
the columnar AOD values, which suggests that absorbing aerosols are much fewer than 265
scattering aerosols over Saudi Arabia. High AAOD is mainly distributed near the sources of dust, 266
BC, and OC (Islam et al., 2019; Kang et al., 2017). The seasonal distributions (Figure 3) show 267
the highest AAOD (greater than 0.03) in spring, and over the Eastern and Southern provinces, 268
followed by summer, winter, and autumn. This is because dust storms originate in the Sahara 269
Desert due to depressions passing eastwards over the Mediterranean Sea, and strong ground 270
heating produces turbulence, local pressure gradients, and the Shamal (wind) pattern (Shao, 271
2008; Prakash et al., 2015; Mashat et al., 2019). April to May (spring) experiences by peak 272
dustiness over Eastern regions, and May-June over Southern and Central regions of Saudi Arabia 273
(Sabbah and Hasan, 2008; Yu et al., 2013). However, an anticyclonic pattern is developed in 274
autumn leading to weak dust activity resulting lowest columnar AAOD over Saudi Arabia (Kang 275
et al., 2017; Mashat et al., 2019). 276
277
278
Aerosol Types FMF vs AE FMF vs AAE FMF vs SSA
Dust FMF<0.4 AE<0.6 FMF<0.4 AAE>2.0 FMF<0.4 SSA≤0.95 Mixed (BC & Dust) 0.4≤FMF≤0.6 0.6≤AE≤1.2 0.4≤FMF≤0.6 1.0<AAE<2.0 0.4≤FMF≤0.6 SSA≤0.95
BC FMF>0.6 AE> 1.2 FMF>0.6 1.0<AAE<2.0 FMF>0.6 SSA≤0.95 AE vs UVAI FMF vs UVAI
Dust 0.0<AE<0.4 UVAI>1.57 0.1<FMF<0.3 UVAI>1.57 Mixed (BC & Dust) 0.0<AE<1.0 0.5<UVAI<1.55 0.1<FMF<0.55 0.5<UVAI<1.55
BC 1.0<AE>1.55 0.5<UVAI<1.52 0.55<FMF>1.0 0.5<UVAI<1.50

13
279
Figure 2: Annual mean Aerosol Absorption Optical Depth (AAOD) obtained from the OMI 280
instrument over Saudi Arabia averaged over the period 2004−2016. 281

14
Figure 3: Mean seasonal spatial distribution of Aerosol Absorption Optical Depth (AAOD) for 282
(a) Winter, (b) Spring, (c) Summer, and (d) Autumn obtained from OMI instrument over Saudi 283
Arabia averaged over the period 2004−2016. 284
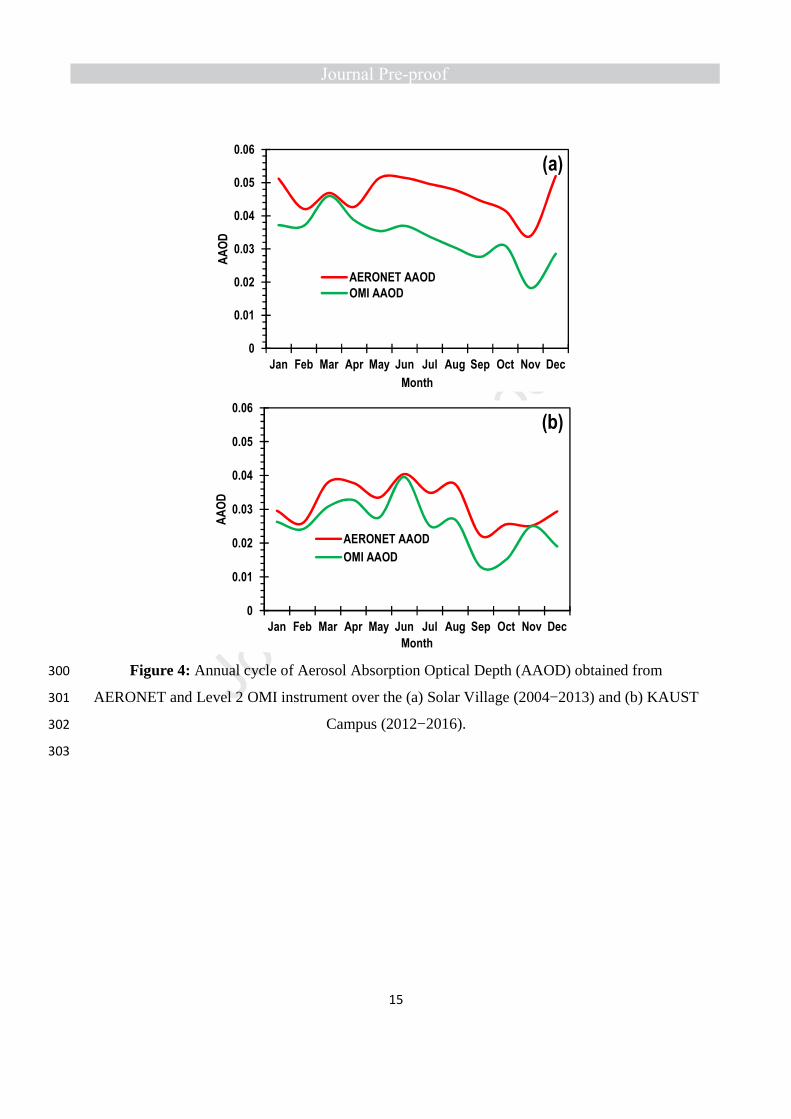
Figure 4 shows a more detailed annual cycle of both AERONET- and OMI-based Level-285
2 AAOD over the Solar Village (2004‒2013) and KAUST Campus (2012‒2016) sites. Higher 286
values of AERONET and OMI AAOD retrievals over Solar Village in the east of the Peninsula 287
indicate more absorbing aerosols present than over the KAUST Campus site. This may be due to 288
a larger number of dust storm events compared to the KAUST region, as reported by Butt et al., 289
2017 using ground-based meteorological data. Results showed that OMI-AAOD retrievals 290
followed the same temporal pattern as the AERONET-AAOD measurements (Figure 4). Figure 5 291
shows significant underestimations for both low and high aerosol loadings as indicated by lower 292
values of the slope, which suggested the inappropriate use of the aerosol model as well as error 293
in the estimated surface reflectance. The underestimation during the low aerosol loadings is 294
caused by the overestimation in the estimated in the surface reflectance (Bilal et al., 2013; Bilal 295
and Nichol, 2015). Error in these parameters might be responsible for the underestimation in the 296
AAOD retrieved by the OMAERUV algorithm. This may suggest that improvements in the OMI 297
algorithm (OMAERUV) are required for a better estimation of AAOD over bright desert 298
surfaces. 299
15
Figure 4: Annual cycle of Aerosol Absorption Optical Depth (AAOD) obtained from 300
AERONET and Level 2 OMI instrument over the (a) Solar Village (2004−2013) and (b) KAUST 301
Campus (2012−2016). 302
303
0
0.01
0.02
0.03
0.04
0.05
0.06
Jan Feb Mar Apr May Jun Jul Aug Sep Oct Nov Dec
AA
OD
Month
(a)
AERONET AAOD
OMI AAOD
0
0.01
0.02
0.03
0.04
0.05
0.06
Jan Feb Mar Apr May Jun Jul Aug Sep Oct Nov Dec
AA
OD
Month
(b)
AERONET AAOD
OMI AAOD

16
304
Figure 5: Scatterplot between OMI AAOD and AERONET AAOD) over the (a) Solar Village 305
(2004−2013) and (b) KAUST Campus (2012−2016). 306
Figure 6 represents the annual cycle of AERONET- and OMI-based aerosol optical 307
properties over the Solar Village and KAUST Campus sites for the period 2004−2016. These 308
properties describe both aerosol size and absorptivity, including Ångström Exponent (AE), 309
Absorption Ångström Exponent (AAE), Fine Mode Fraction (FMF), Single Scattering Albedo 310
(SSA), and Aerosol Index (UVAI). The AE indicates the size of the dominant aerosol particles in 311
the column, where small values of AE (< 1) indicate the dominance of coarse mode aerosols and 312
large values of AE (> 1) demonstrate the dominance of fine mode aerosol such as BC, sulfate, 313
and organic carbon released from manmade activities (Eck et al., 1999). The annual values of AE 314
(Table 4) suggest coarse mode aerosols over both AERONET sites (Solar Village: 0.48, KAUST 315
Campus: 0.64), as well as in all seasons. AE reaches its minimum in May (Solar Village: 0.20, 316
KAUST Campus: 0.35) and maximum in November (Solar Village: 0.86, KAUST Campus: 317
0.97) (Figure 6). These results suggest substantially more coarse mode aerosols in spring 318
compared with other seasons. Trend analysis showed no significant increasing or decreasing 319
trends in AE over either site (Table 4). 320
The Absorption Ångström Exponent (AAE) indicates the absorption contrast in relation 321
to wavelength, which depends on particle size, shape, and chemical composition of the absorbing 322
aerosols, which have a unique value (Russel et al., 2010; Li et al., 2016). For example, values of 323
AAE < 2 and AAE > 2 indicate the fine mode and coarse mode absorbing aerosols respectively. 324
Annual average values of AAE suggest coarse mode absorbing aerosols over both AERONET 325
y = 0.247x + 0.0227R² = 0.0489
0
0.05
0.1
0.15
0.2
0 0.05 0.1 0.15 0.2
OM
I AA
OD
(50
0 n
m)
Solar Village AAOD (500nm)
(a) y = 0.5895x + 0.0077R² = 0.3882
0
0.05
0.1
0.15
0.2
0 0.05 0.1 0.15 0.2
OM
I AA
OD
(50
0 n
m)
KAUST Campus (500 nm)
(b)
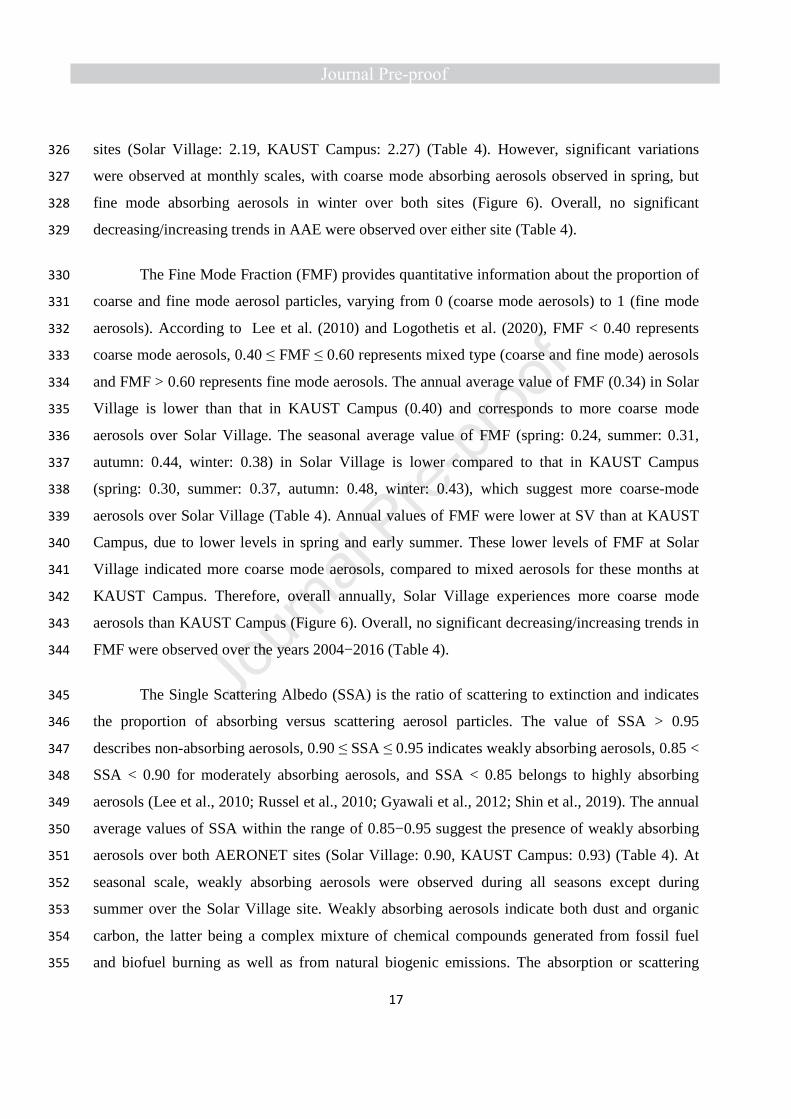
17
sites (Solar Village: 2.19, KAUST Campus: 2.27) (Table 4). However, significant variations 326
were observed at monthly scales, with coarse mode absorbing aerosols observed in spring, but 327
fine mode absorbing aerosols in winter over both sites (Figure 6). Overall, no significant 328
decreasing/increasing trends in AAE were observed over either site (Table 4). 329
The Fine Mode Fraction (FMF) provides quantitative information about the proportion of 330
coarse and fine mode aerosol particles, varying from 0 (coarse mode aerosols) to 1 (fine mode 331
aerosols). According to Lee et al. (2010) and Logothetis et al. (2020), FMF < 0.40 represents 332
coarse mode aerosols, 0.40 ≤ FMF ≤ 0.60 represents mixed type (coarse and fine mode) aerosols 333
and FMF > 0.60 represents fine mode aerosols. The annual average value of FMF (0.34) in Solar 334
Village is lower than that in KAUST Campus (0.40) and corresponds to more coarse mode 335
aerosols over Solar Village. The seasonal average value of FMF (spring: 0.24, summer: 0.31, 336
autumn: 0.44, winter: 0.38) in Solar Village is lower compared to that in KAUST Campus 337
(spring: 0.30, summer: 0.37, autumn: 0.48, winter: 0.43), which suggest more coarse-mode 338
aerosols over Solar Village (Table 4). Annual values of FMF were lower at SV than at KAUST 339
Campus, due to lower levels in spring and early summer. These lower levels of FMF at Solar 340
Village indicated more coarse mode aerosols, compared to mixed aerosols for these months at 341
KAUST Campus. Therefore, overall annually, Solar Village experiences more coarse mode 342
aerosols than KAUST Campus (Figure 6). Overall, no significant decreasing/increasing trends in 343
FMF were observed over the years 2004−2016 (Table 4). 344
The Single Scattering Albedo (SSA) is the ratio of scattering to extinction and indicates 345
the proportion of absorbing versus scattering aerosol particles. The value of SSA > 0.95 346
describes non-absorbing aerosols, 0.90 ≤ SSA ≤ 0.95 indicates weakly absorbing aerosols, 0.85 < 347
SSA < 0.90 for moderately absorbing aerosols, and SSA < 0.85 belongs to highly absorbing 348
aerosols (Lee et al., 2010; Russel et al., 2010; Gyawali et al., 2012; Shin et al., 2019). The annual 349
average values of SSA within the range of 0.85−0.95 suggest the presence of weakly absorbing 350
aerosols over both AERONET sites (Solar Village: 0.90, KAUST Campus: 0.93) (Table 4). At 351
seasonal scale, weakly absorbing aerosols were observed during all seasons except during 352
summer over the Solar Village site. Weakly absorbing aerosols indicate both dust and organic 353
carbon, the latter being a complex mixture of chemical compounds generated from fossil fuel 354
and biofuel burning as well as from natural biogenic emissions. The absorption or scattering 355

18
property of dust grains depends on their size and composition, whether predominantly 356
silicate or graphite, thus these results are compatible with the results of FMF and AE, 357
which suggest coarse aerosols to be dominant at both sites. Overall, no significant 358
decreasing/increasing trends in SSA were observed (Table 4). 359
The Ultra-Violet Aerosol Index (UVAI) is a well-known index for detecting the 360
absorbing aerosols (dust and biomass burning) in the atmosphere. It uses the UV spectrum to 361
distinguish absorbing from non-absorbing aerosols (Graaf et al., 2005). The threshold UVAI > 362
0.5 is useful to identify absorbing aerosols (Torres et al., 2009). The value of UVAI > 1.0 shows 363
the enhanced presence of UV-absorbing aerosols (e.g., dust or smoke or biomass burning), and 364
0.5 < UVAI < 1.0 indicates the weak presence of UV-absorbing aerosols (Washington et al., 365
2003). The observed values of UVAI suggest the weak presence of UV-absorbing aerosols over 366
both AERONET sites except in spring at Solar Village and summer at KAUST Campus (Table 367
4) and this is confirmed by the monthly values (Figure 6). These findings support Kaskaoutis et 368
al. (2010) report of dust particles as indicated by the AI (0.5 to 0.6) over the South Greek sea 369
regions. Overall, a significant increasing trend in UVAI was observed at KAUST Campus (Table 370
4). 371
0
0.5
1
1.5
2
2.5
3
0
0.2
0.4
0.6
0.8
1
1.2
1.4
Jan Feb Mar Apr May Jun Jul Aug Sep Oct Nov Dec
AA
E
AE
, F
MF
, SS
A a
nd
UV
AI
Month
(a)
AEFMFSSAUVAIAAE

19
Figure 6: Annual cycle of averaged Aerosol Optical Properties obtained from AERONET (AE, 372
AAE, FMF, and SSA), and OMI (UVAI) over the (a) Solar Village site (2004−2013) and (b) 373
KAUST Campus site (2012−2016). 374
375
As can be seen from the above aerosol descriptions in this section 3.2, the analysis based 376
on the individual parameters describe, whether fine or coarse mode (AE and FMF), whether fine 377
or coarse mode absorbing aerosols (AAE), and whether absorbing or non-absorbing aerosols 378
(SSA and UVAI). However, these individual parameters cannot identify the exact nature of the 379
aerosol types such as dust or BC or mixed. Therefore, section 3.3 evaluates the combination of 380
these parameters to classify aerosols into specific types. 381
382
0
0.5
1
1.5
2
2.5
3
0
0.2
0.4
0.6
0.8
1
1.2
1.4
Jan Feb Mar Apr May Jun Jul Aug Sep Oct Nov Dec
AA
E
AE
, F
MF
, SS
A a
nd
UV
AI
Month
(b)
AEFMFSSAUVAIAAE

20
383
Table 4 Mean seasonal and annual variability of aerosol optical properties (AE, AAE, FMF, SSA, and UVAI) with their trends over 384
the Solar Village and KAUST Campus sites for the period 2004−2016. 385
386
3.3 Classification of aerosols 387
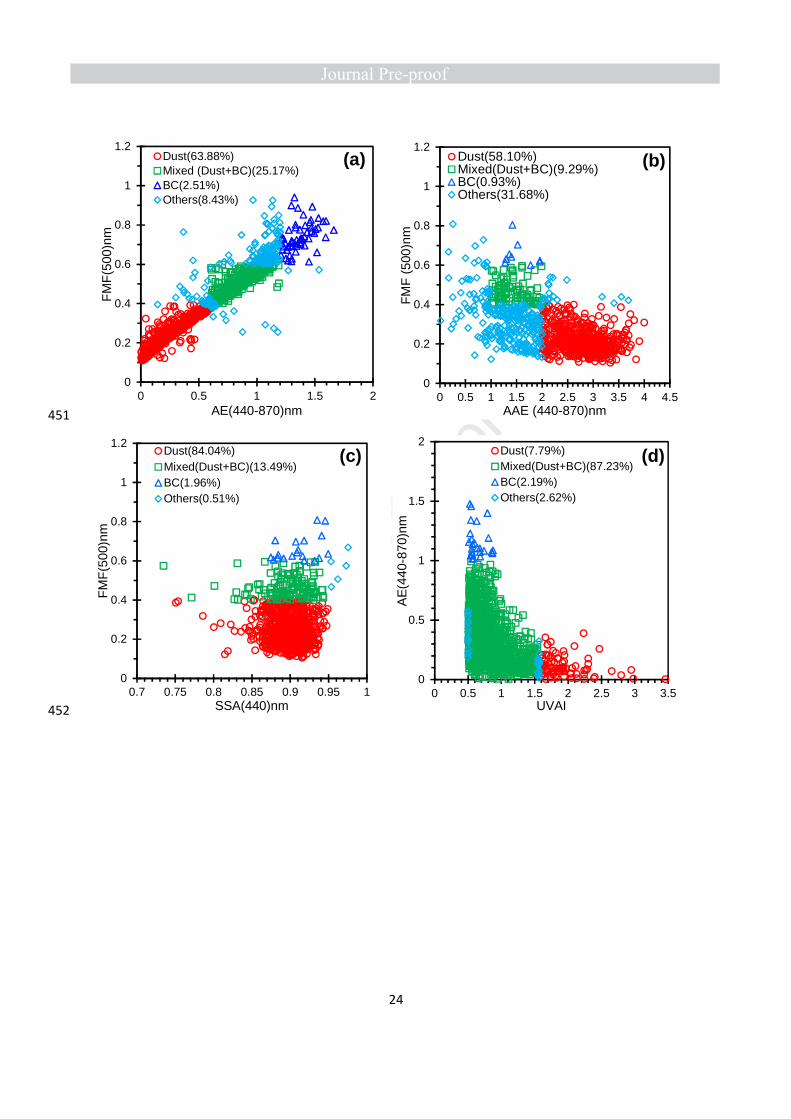
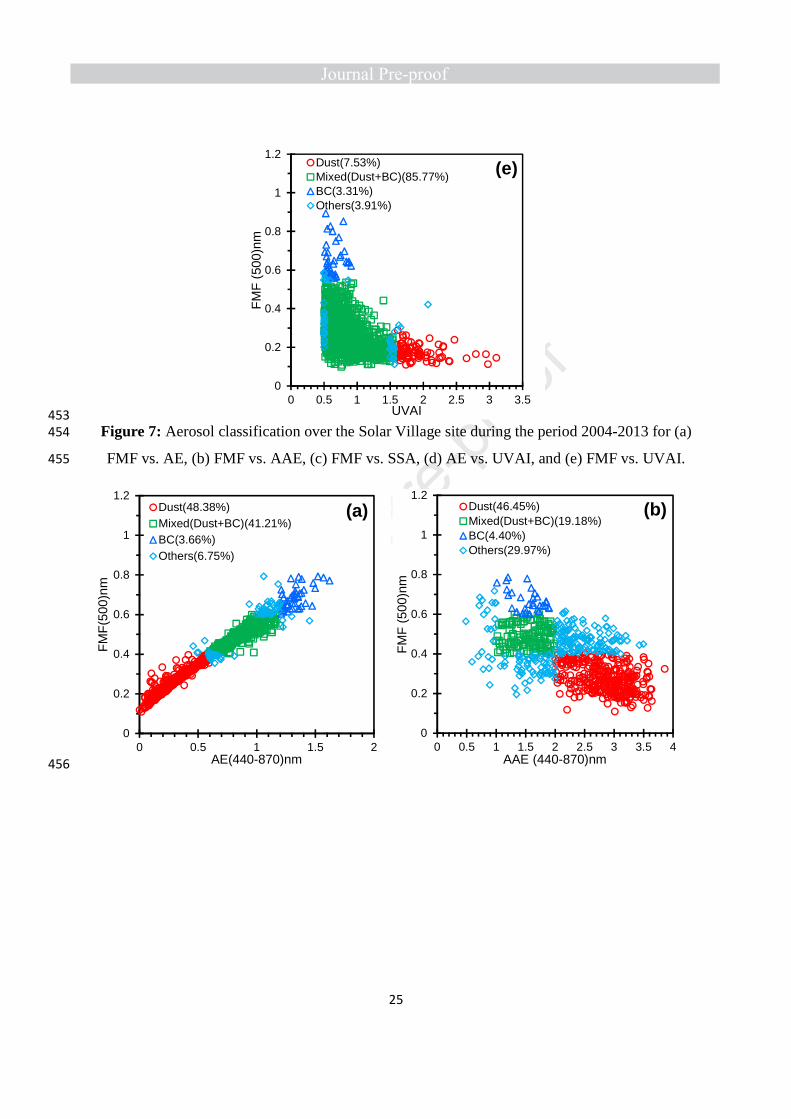
The relationships of different parameters, namely FMF vs. AE, FMF vs. AAE, FMF vs. SSA, AE vs. UVAI, and FMF vs. 388
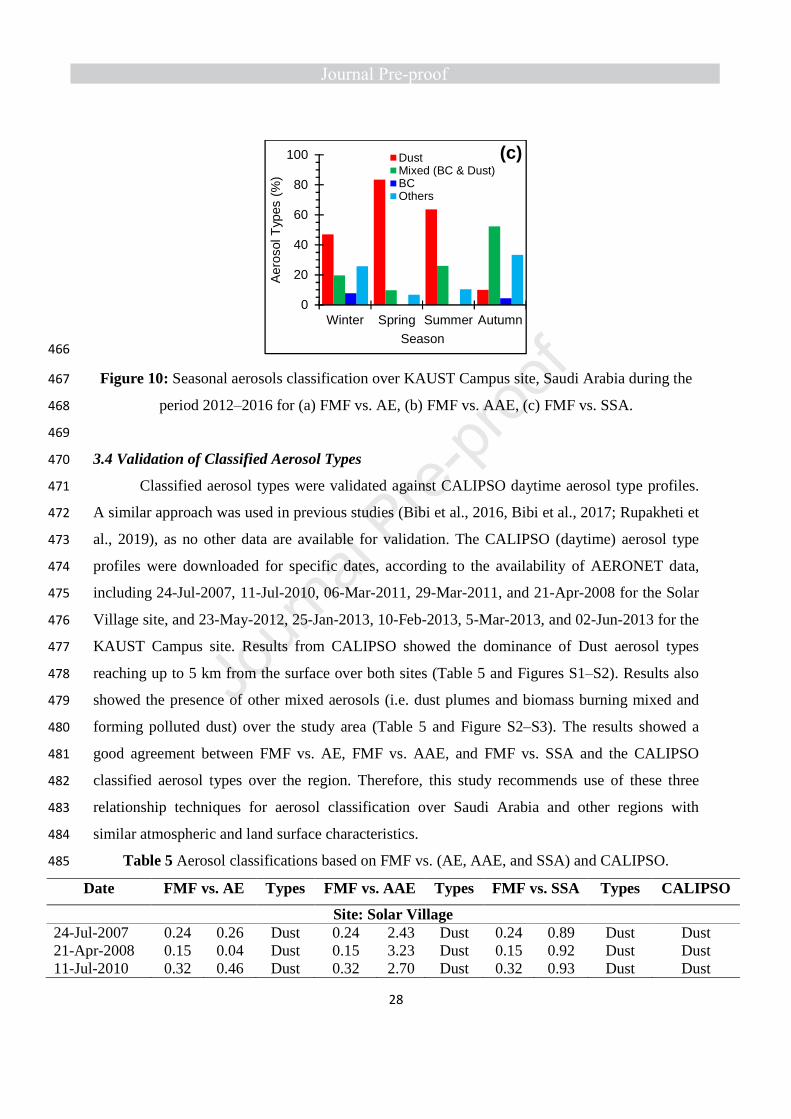
UVAI were used to classify aerosols into three types: Dust, Mixed (Dust and BC), and BC (Figure 7‒10). Results based on FMF vs. 389
AE, FMF vs. AAE, and FMF vs. SSA demonstrated the dominance of Dust type aerosols followed by Mixed (BC and Dust), then BC 390
over both sites, (Figures 7−10). Thus on Figures 7 and 8 (a‒c), the relationships showing the dominance of Dust type aerosols were 391
FMF vs. SSA (Solar Village: 84.04%%, KAUST Campus: 50.50%) followed by FMF vs. AE (Solar Village: 63.88%, KAUST 392
Campus: 48.38%), and FMF vs. AAE (Solar Village: 58.10%, KAUST Campus: 46.45%). The results support observations of 393
frequent dust storms (Kaskaoutis et al, 2007), as well as several studies reporting more dusty days over the Solar Village as compared 394
to the KAUST Campus site (Yu et al., 2013; Butt et al., 2017), as many dust storms emanate from the desert of Iraq, North-East of 395
Saudi Arabia, and Southern Iran, directly influencing to the Solar Village site (Prospero et al., 2003; Farahat et al., 2016 ). Therefore, 396
dust aerosols are persistently prevalent over the Solar Village site. However, when we consider the relationships of AE vs. UVAI and 397
Parameters Solar Village KAUST Campus
Winter Spring Summer Autumn Annual Trends Winter Spring Summer Autumn Annual Trends AE 0.54±0.17 0.23±0.12 0.41±0.17 0.70±0.18 0.48±0.25 -0.012 0.68±0.20 0.39±0.08 0.55±0.17 0.91±0.12 0.64±0.24 0.023
AAE 2.14±0.93 2.72±0.36 2.18±0.70 1.70±0.66 2.19±0.71 -0.044 2.19±0.40 2.80±0.28 2.48±0.48 1.77 ± 0.47 2.27±0.57 0.067
FMF 0.38±0.08 0.24±0.07 0.31±0.08 0.44±0.08 0.34±0.11 -0.008 0.43±0.07 0.30±0.04 0.37±0.07 0.48±0.05 0.40±0.09 0.007
SSA 0.900±0.03 0.902±0.01 0.897±0.01 0.903±0.20 0.90±0.02 -0.001 0.94±0.01 0.92±0.01 0.93±0.01 0.95±0.01 0.93±0.01 0.002
UVAI 0.78±0.17 1.09±0.20 0.97±0.20 0.73±0.12 0.88±0.23 0.012 0.79±0.15 0.98±0.20 1.05±0.24 0.75±0.11 0.89±0.22 0.015*
21
FMF vs. UVAI, these suggest the dominant aerosol type to be Mixed (BC and Dust) followed by Dust, and then BC (Figures 7 and 8 398
(d‒e)). Since very 399

22
low levels of Dust are indicated by the two relationships AE (Dust: 0.0<AE<0.4) vs. UVAI 400
(Dust: >1.57) and FMF (Dust: 0.1<FMF<0.3) vs. UVAI (Dust: >1.57) over both sites, whereas 401
the other three relationships show high dust levels, supported by the single parameters and by 402
many other studies and reports, these results suggest that AE vs. UVAI and FMF vs. UVAI 403
relationships cannot provide a meaningful aerosol types classification. This may be due to 404
underestimation by the OMAERUV algorithm-based UVAI data (see Figures 4 and 5), as the 405
UVAI alone suggested the dominance of absorbing aerosols over both sites. Therefore, the study 406
indicates that the OMAERUV algorithm may need improvement for better estimating the OMI 407
UVAI over bright-reflecting surfaces. 408
409
The value of FMF < 0.6 demonstrates coarse-mode dominated aerosols, which were 410
associated with a mixture of different types of aerosols (Wu et al., 2015). Pérez-Ramírez et al., 411
(2015), noted a similar finding over Granada, Spain. This interpretation is supported by Wu et al. 412
2015, who used a value of FMF < 0.6 to identify coarse-mode dominated aerosols which are 413
associated with a mixture of different types of aerosols, and a similar finding was reported by 414
Pérez-Ramírez et al., (2015) over Granada, Spain. The FMF (0.4 ≤ FMF ≤ 0.6) vs. AE (0.6 ≤ AE 415
≤ 1.2), FMF (0.4 ≤ FMF ≤ 0.6) vs. AAE (1.0 < AAE < 2.0), and FMF (0.4 ≤ FMF ≤ 0.6) 416
vs. SSA (≤ 0.95) thresholds represent Mixed (Dust and BC) type aerosols. These Mixed type 417
aerosols are best represented by FMF vs. AE (Solar Village: 25.17%, KAUST Campus: 41.21%), 418
with the FMF vs. SSA and FMF vs. AAE giving lower percentages (Figures 7 and 8 (a‒c)). 419
Finally, Figures 7 and 8 (a‒c) show a small percentages of BC aerosols based on the above-420
mentioned three relationships over the both sites. Higher FMF (> 0.6) values indicate fine mode 421
aerosols, which correspond to BC, which may be due to local industrial activities (cement, 422
petrochemical, and fertilizer), water desalination plants, and electric energy generation (Farahat 423
et al., 2016). Some aerosol types were not classified namely ’Other’ type (Figures 7−10). These 424
were best represented by FMF vs. AE (31.68%) over the Solar Village and by FMF vs. AAE 425
(29.97%) over the KAUST Campus site (Figures 7 and 8 (a‒c). These aerosols may be formed 426
due to the mixing of natural and anthropogenic aerosols atmospheric water vapor over the study 427
area (Kaskaoutis et al., 2011). 428
429
23
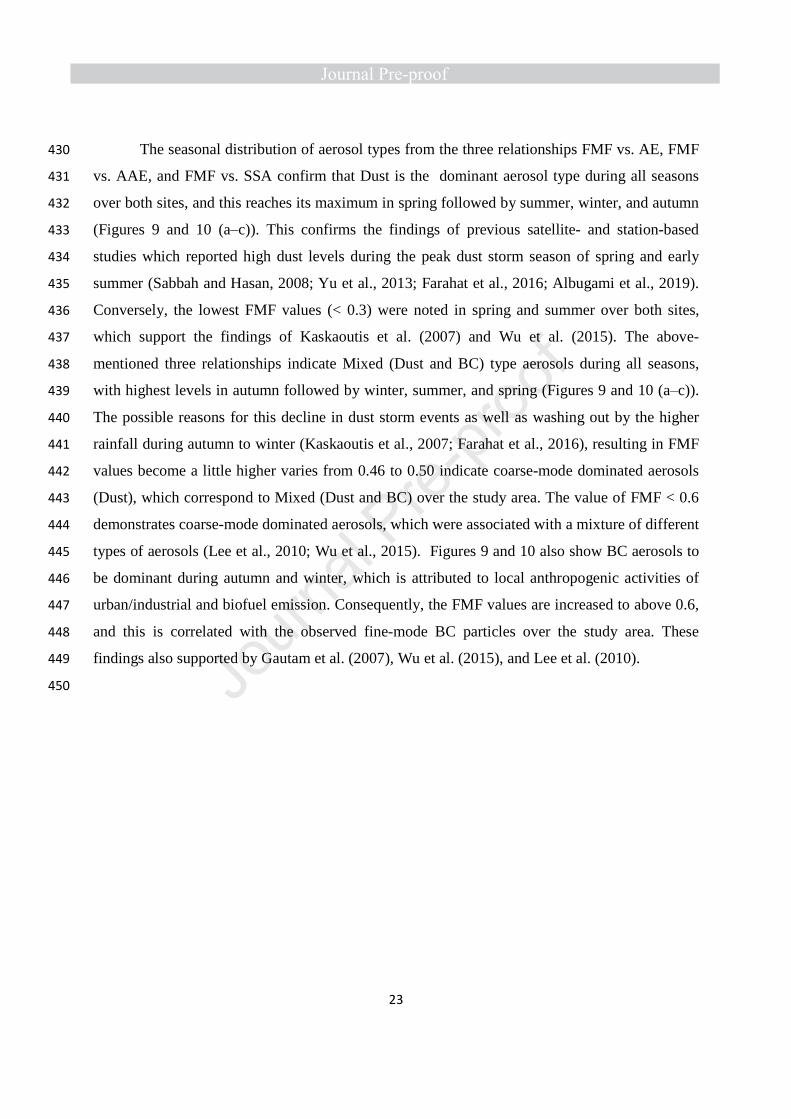
The seasonal distribution of aerosol types from the three relationships FMF vs. AE, FMF 430
vs. AAE, and FMF vs. SSA confirm that Dust is the dominant aerosol type during all seasons 431
over both sites, and this reaches its maximum in spring followed by summer, winter, and autumn 432
(Figures 9 and 10 (a‒c)). This confirms the findings of previous satellite- and station-based 433
studies which reported high dust levels during the peak dust storm season of spring and early 434
summer (Sabbah and Hasan, 2008; Yu et al., 2013; Farahat et al., 2016; Albugami et al., 2019). 435
Conversely, the lowest FMF values (< 0.3) were noted in spring and summer over both sites, 436
which support the findings of Kaskaoutis et al. (2007) and Wu et al. (2015). The above-437
mentioned three relationships indicate Mixed (Dust and BC) type aerosols during all seasons, 438
with highest levels in autumn followed by winter, summer, and spring (Figures 9 and 10 (a‒c)). 439
The possible reasons for this decline in dust storm events as well as washing out by the higher 440
rainfall during autumn to winter (Kaskaoutis et al., 2007; Farahat et al., 2016), resulting in FMF 441
values become a little higher varies from 0.46 to 0.50 indicate coarse-mode dominated aerosols 442
(Dust), which correspond to Mixed (Dust and BC) over the study area. The value of FMF < 0.6 443
demonstrates coarse-mode dominated aerosols, which were associated with a mixture of different 444
types of aerosols (Lee et al., 2010; Wu et al., 2015). Figures 9 and 10 also show BC aerosols to 445
be dominant during autumn and winter, which is attributed to local anthropogenic activities of 446
urban/industrial and biofuel emission. Consequently, the FMF values are increased to above 0.6, 447
and this is correlated with the observed fine-mode BC particles over the study area. These 448
findings also supported by Gautam et al. (2007), Wu et al. (2015), and Lee et al. (2010). 449
450
24
451
452
0
0.2
0.4
0.6
0.8
1
1.2
0 0.5 1 1.5 2
FM
F(5
00)n
m
AE(440-870)nm
(a)Dust(63.88%)Mixed (Dust+BC)(25.17%)BC(2.51%)Others(8.43%)
0
0.2
0.4
0.6
0.8
1
1.2
0 0.5 1 1.5 2 2.5 3 3.5 4 4.5F
MF
(50
0)nm
AAE (440-870)nm
(b)Dust(58.10%)Mixed(Dust+BC)(9.29%)BC(0.93%)Others(31.68%)
0
0.2
0.4
0.6
0.8
1
1.2
0.7 0.75 0.8 0.85 0.9 0.95 1
FM
F(5
00)n
m
SSA(440)nm
(c)Dust(84.04%)Mixed(Dust+BC)(13.49%)BC(1.96%)Others(0.51%)
0
0.5
1
1.5
2
0 0.5 1 1.5 2 2.5 3 3.5
AE
(440
-870
)nm
UVAI
(d)Dust(7.79%)Mixed(Dust+BC)(87.23%)BC(2.19%)Others(2.62%)
25
453
Figure 7: Aerosol classification over the Solar Village site during the period 2004-2013 for (a) 454
FMF vs. AE, (b) FMF vs. AAE, (c) FMF vs. SSA, (d) AE vs. UVAI, and (e) FMF vs. UVAI. 455
456
0
0.2
0.4
0.6
0.8
1
1.2
0 0.5 1 1.5 2 2.5 3 3.5
FM
F (
500)
nm
UVAI
(e)Dust(7.53%)Mixed(Dust+BC)(85.77%)BC(3.31%)Others(3.91%)
0
0.2
0.4
0.6
0.8
1
1.2
0 0.5 1 1.5 2
FM
F(5
00)n
m
AE(440-870)nm
(a)Dust(48.38%)Mixed(Dust+BC)(41.21%)BC(3.66%)Others(6.75%)
0
0.2
0.4
0.6
0.8
1
1.2
0 0.5 1 1.5 2 2.5 3 3.5 4
FM
F (
500)
nm
AAE (440-870)nm
(b)Dust(46.45%)Mixed(Dust+BC)(19.18%)BC(4.40%)Others(29.97%)

26
457
458
Figure 8: Aerosol classification over KAUST Campus site during the period 2012-2016 for (a) 459
FMF vs. AE, (b) FMF vs. AAE, (c) FMF vs. SSA, (d) AE vs. UVAI, and (e) FMF vs. UVAI. 460
0
0.2
0.4
0.6
0.8
1
1.2
0.85 0.9 0.95 1
FM
F (
500)
nm
SSA (440)nm
(c)Dust(50.50%)Mixed(Dust+BC)(28.51%)BC(2.55%)Others(18.44%)
0
0.2
0.4
0.6
0.8
1
1.2
0 0.5 1 1.5 2 2.5 3 3.5 4 4.5A
E(4
40-8
70)n
mUVAI
(d)Dust (10.89%)Mixed(Dust+BC)(80.94%)BC(4.54%)Others(3.63%)
0
0.2
0.4
0.6
0.8
1
0 0.5 1 1.5 2 2.5 3 3.5 4 4.5
FM
F (
500)
nm
UVAI
(e)Dust(10.89%)Mixed(Dust+BC)(80.94%)BC(4.54%)Others(3.63%)

27
461
462
Figure 9: Seasonal aerosols classification over the Solar Village site during the period 2004-463
2013 for (a) FMF vs. AE, (b) FMF vs. AAE, (c) FMF vs. SSA. 464
465
0
20
40
60
80
100
Winter Spring Summer Autumn
Aer
osol
Typ
es
(%)
Season
(a) DustMixed (BC & Dust)BCOthers
0
20
40
60
80
100
Winter Spring Summer Autumn
Aer
osol
Typ
es (
%)
Season
(b) DustMixed (BC & Dust)BCOthers
0
20
40
60
80
100
Winter Spring Summer Autumn
Aer
osol
Typ
es (
%)
Season
(c) DustMixed (BC & Dust)BCOthers
0
20
40
60
80
100
Winter Spring Summer Autumn
Aer
osol
Typ
es (
%)
Season
(a)DustMixed (BC & Dust)BCOthers
0
20
40
60
80
100
Winter Spring Summer Autumn
Aer
osol
Typ
es (
%)
Season
(b)DustMixed (BC & Dust)BCOthers
28
466
Figure 10: Seasonal aerosols classification over KAUST Campus site, Saudi Arabia during the 467
period 2012‒2016 for (a) FMF vs. AE, (b) FMF vs. AAE, (c) FMF vs. SSA. 468
469
3.4 Validation of Classified Aerosol Types 470
Classified aerosol types were validated against CALIPSO daytime aerosol type profiles. 471
A similar approach was used in previous studies (Bibi et al., 2016, Bibi et al., 2017; Rupakheti et 472
al., 2019), as no other data are available for validation. The CALIPSO (daytime) aerosol type 473
profiles were downloaded for specific dates, according to the availability of AERONET data, 474
including 24-Jul-2007, 11-Jul-2010, 06-Mar-2011, 29-Mar-2011, and 21-Apr-2008 for the Solar 475
Village site, and 23-May-2012, 25-Jan-2013, 10-Feb-2013, 5-Mar-2013, and 02-Jun-2013 for the 476
KAUST Campus site. Results from CALIPSO showed the dominance of Dust aerosol types 477
reaching up to 5 km from the surface over both sites (Table 5 and Figures S1‒S2). Results also 478
showed the presence of other mixed aerosols (i.e. dust plumes and biomass burning mixed and 479
forming polluted dust) over the study area (Table 5 and Figure S2‒S3). The results showed a 480
good agreement between FMF vs. AE, FMF vs. AAE, and FMF vs. SSA and the CALIPSO 481
classified aerosol types over the region. Therefore, this study recommends use of these three 482
relationship techniques for aerosol classification over Saudi Arabia and other regions with 483
similar atmospheric and land surface characteristics. 484
Table 5 Aerosol classifications based on FMF vs. (AE, AAE, and SSA) and CALIPSO. 485
Date FMF vs. AE Types FMF vs. AAE Types FMF vs. SSA Types CALIPSO
Site: Solar Village 24-Jul-2007 0.24 0.26 Dust 0.24 2.43 Dust 0.24 0.89 Dust Dust 21-Apr-2008 0.15 0.04 Dust 0.15 3.23 Dust 0.15 0.92 Dust Dust 11-Jul-2010 0.32 0.46 Dust 0.32 2.70 Dust 0.32 0.93 Dust Dust
0
20
40
60
80
100
Winter Spring Summer Autumn
Aer
osol
Typ
es (
%)
Season
(c)DustMixed (BC & Dust)BCOthers

29
06-Mar-2011 0.25 0.36 Dust 0.25 3.45 Dust 0.25 0.88 Dust Dust 29-Mar-2011 0.13 0.01 Dust 0.13 2.92 Dust 0.13 0.92 Dust Dust
Site: KAUST Campus 23-May-2012 0.29 0.23 Dust 0.29 2.89 Dust 0.29 0.90 Dust Dust 25-Jan-2013 0.48 0.91 Mixed 0.48 1.41 Mixed 0.48 0.93 Mixed Mixed 10-Feb-2013 0.37 0.55 Dust 0.37 2.01 Dust 0.37 0.93 Dust Dust 5-Mar-2013 0.37 0.56 Dust 0.37 2.49 Dust 0.37 0.94 Dust Dust 02-Jun-2013 0.19 0.10 Dust 0.19 3.15 Dust 0.19 0.90 Dust Dust
486
4. Conclusion 487
In this paper, aerosol types over Saudi Arabia were classified using the aerosol property 488
relationships technique and data from OMI (AAOD, UVAI) and AERONET (AAOD, AE, AAE, 489
FMF, SSA). Based on the three relationships FMF vs. AE, FMF vs. AAE, and FMF vs. SSA, the 490
study found dust to be the most common and abundant aerosol type at both annual and seasonal 491
scales, and this was expected, due to the frequent dust storm activity over the study area. Notable 492
temporal variations in aerosol type were observed and attributed to seasonal climatic changes, 493
especially the greater percentage of Dust aerosol types in spring due to depressions passing 494
eastwards over the Sahara Desert, a major dust source. Local dust sources are also more 495
significant during the hot and dry seasons of spring to early summer; spatial variations are also 496
significant, with high AAOD values over the Eastern and Southern provinces, due mainly to 497
local dust sources, and lower AAOD over the Northern Province. Besides Dust, significant 498
amounts of BC and Mixed (Dust and BC) aerosols were observed, though in lesser amounts than 499
Dust, which are attributed to increasing industrial activities (cement, petrochemicals and 500
fertilizers), water desalination plants, infrastructure, and electric energy generation. These release 501
absorbing and fine particles, which often become mixed with dust. Significant underestimation in 502
OMI UVAI and AAOD products was observed, suggesting that significant improvements are 503
required for the OMI OMAERUV algorithm for better estimation of AAOD over bright desert 504
surfaces. Consequently the study found that the relationships FMF vs. UVAI and AE vs. UVAI 505
(with UVAI derived from OMI) relationships misclassified aerosol types over the study area, 506
therefore the relationships FMF vs. AE, FMF vs. AAE, and FMF vs. SSA are recommended for 507
aerosol classification over Saudi Arabia and areas with similar land and atmospheric 508
characteristics. Validation of the classified aerosol types against CALIPSO data showed that the 509
recommended aerosol classifiation relationships (FMF vs. AE, FMF vs. AAE, and FMF vs. SSA) 510
are robust and effective for aerosol classsification over Saudi Arabia. In view of increased 511

30
knowledge of the harmful health effects of dust-borne synthetic compounds, the aerosol 512
relationships for identifying the specific aerosol types described here, should be of benefit in 513
future air quality control programs, as well as in global studies of climatic forcing due to aerosol 514
in arid regions. 515
516
Acknowledgment 517
The authors are grateful to the NASA Goddard Space Flight Center and Goddard Earth Sciences 518
Data and Information Services Center (GESDISC) for providing OMI (UVAI and AAOD) and 519
AERONET data. We would like to give special thanks to the scientific teams of CALIPSO for 520
making the data available for this study. This research is supported by the Special Project of 521
Jiangsu Distinguished Professor (1421061801003 and 1421061901001), the National Natural 522
Science Foundation of China (Grant No. 41976165), and the Startup Foundation for Introduction 523
Talent of NUIST (2017r107). The foremost author (Md. Arfan Ali) is highly grateful to the 524
China Scholarship Council (CSC) and NUIST to grant the fellowship and providing the required 525
supports. 526
527
References 528
Adesina, J.A., Kumar, K.R., Sivakumar, V., Piketh, S.J., 2016. Intercomparison and assessment 529
of long-term (2004−2013) multiple satellite aerosol products over two contrasting sites in 530
South Africa. J. Atmos. Sol. Terr. Phys. 148, 82−95. 531
Alam, K., Shaheen, K., Blaschke, T., Chishtie, F., Khan, H.U., Haq, B.S., 2016. Classification of 532
Aerosols in an Urban Environment on the Basis of Optical Measurements. Aerosol and 533
Air Quality Research, 16: 2535–2549. 534
Albugami, S., Palmer, S., Cinnamon, J., Meersmans, J., 2019. Spatial and Temporal Variations 535
in the Incidence of Dust Storms in Saudi Arabia Revealed from In Situ Observations. 536
Geosciences 9, 162; doi: 10.3390/geosciences9040162. 537
Ali, M.A., Assiri, M.E., 2016. Spatio-temporal analysis of aerosol con-centration over Saudi 538
Arabia using satellite remote sensing tech-niques. Malays J Soc Sp 12:1–11. 539
Ali, M.A., Assiri, M.E., 2019. Analysis of AOD from MODIS‑ Merged DT–DB Products over 540
the Arabian Peninsula. Earth Syst Environ 3, 625–636. 541
31
Ali, M.A., Assiri, M., Dambul, R., 2017. Seasonal Aerosol Optical Depth (AOD) variability 542
using satellite data and its comparison over Saudi Arabia for the period 2002–2013. 543
Aerosol Air Qual. Res. 17, 1267–1280. 544
Ali, M.A., Islam, M.M., Islam, M.N., Almazroui, M., 2019. Investigations of MODIS AOD and 545
cloud properties with CERES sensor based net cloud radiative effect and a NOAA 546
HYSPLIT Model over Bangladesh for the period 2001–2016. Atmos. Res. 215, 268−283. 547
Almazroui, M., 2019. A comparison study between AOD data from MODIS deep blue 548
collections 51 and 06 and from AERONET over Saudi Arabia. Atmos. Res. 225, 88−95. 549
Almazroui, M., Dambul, R., Islam, M.N., Jones, P.D., 2015. Atmospheric circulation patterns in 550
the Arab region and its relationships with Saudi Arabian surface climate: a preliminary 551
assessment. Atmos. Res. 161–162, 36–51. 552
Aloysius, M., Mohan, M., Suresh Babu, S., Parameswaran, K., Moorthy, K.K., 2009. Validation 553
of MODIS derived aerosol optical depth and an investigation on aerosol transport over 554
the South East Arabian sea during ARMEX-II. Ann. Geophys. 27, 2285−2296. 555
AMS, 2001. Statement on seasonal to inter-annual climate prediction. Bull. Am. Meteorol. Soc. 556
82, 701–703. 557
Al-Rajhi, M.A., Seaward, M.R.D., Al-Aamer, A.S., 1996. Metal levels in indoor and outdoor 558
dust in Riyadh, Saudi Arabi. Environment International, 22, 315-324. 559
Al-Salihi, A.M., 2018. Characterization of aerosol type based on aerosol optical properties over 560
Baghdad, Iraq. Arab. J. Geosci. 11, 633. 561
Awad, A., Mashat, A., 2014. The synoptic patterns associated with spring widespread dusty days 562
in central and eastern Saudi Arabia. Atmosphere 5 (4), 889–913. 563
Awad, A.M., Mashat, A.S., Salem, F.F.A., 2015. Diagnostic study of spring dusty days over the 564
southwest region of the Kingdom of Saudi Arabia. Arab. J. Geosci. 8, 2265–2282. 565
Bergstrom, R.W., Russell, P.B., Hignett, P., 2002. Wavelength dependence of the absorption of 566
black carbon particles: predictions and results from the TARFOX experiment and 567
implications for the aerosol single scattering albedo. J. Atmos. Sci. 59, 567−577. 568
Bibi, H., Alam, K., Bibi, S., 2016. In-depth discrimination of aerosol types using multiple 569
clustering techniques over four locations in Indo-Gangetic plains. Atmos. Res. 181, 570
106−114. 571

32
Bibi, S., Alam, K., Chishtie, F., Bibi, H., 2017. Characterization of absorbing aerosol types using 572
ground and satellites based observations over an urban environment. Atmos. Environ. 573
150, 126−135. 574
Bilal, M., Nichol, J.E. 2015. Evaluation of MODIS aerosol retrieval algorithms over the Beijing-575
Tianjin-Hebei region during low to very high pollution events. . Geophys. Res. 576
Atmos.,120, doi:10.1002/2015JD023082. 577
Bilal, M., Nichol, J.E., Bleiweiss, M.P., Dubois, D.W. 2013. A Simplified high resolution 578
MODIS Aerosol Retrieval Algorithm (SARA) for use over mixed surfaces. Rem. Sens. 579
Environ. 136, 135–145. 580
Cazorla, A., Bahadur, R., Suski, K., Cahill, J.F., Chand, D., Schmid, B., Ramanathan, V., 581
Prather, K., 2013. Relating aerosol absorption due to soot, organic carbon, and dust to 582
emission sources determined from in-situ chemical measurements. Atmos. Chem. Phys. 583
13, 9337−9350. 584
Chen, Q.X., Yuan, Y., Shuai, Y., Tan, H.P., 2016. Graphical aerosol classification method using 585
aerosol relative optical depth. Atmos. Environ. 135, 84–91. 586
Choi, Y.-S., Ho, C.-H., Oh, H.-R., Park, R.J., Song, C.-G., 2009. Estimating bulk optical 587
properties of aerosols over the western North Pacific by using MODIS and CERES 588
measurements. Atmos. Environ. 43, 5654−5660. 589
Dubovik, O., Holben, B.N., Eck, T.F., Smirnov, A., Kaufman,Y.J., King, M.D.,Tanre, D., 590
Slutsker,I., 2002. Variability of absorption and optical properties of key aerosol types 591
observed in worldwide locations. J. Atmos. Sci. 59, 590–608. 592
Eck, T., Holben, B.N., Reid, J., Dubovik, O., Smirnov, A., O’Neill, N., Slutsker, I., Kinne, S., 593
1999. Wavelength dependence of the opticaldepth of biomass burning, urban, and desert 594
dust aerosols. J. Geophys. Res. 104(D24), 31333– 31349. 595
Eck, T.F., Holben, B.N., Sinyuk, A., Pinker, R., Goloub, P., Chen, H., Chatenet, B., Li, Z., 596
Singh, R.P., Tripathi, S.N., 2010. Climatological aspects of the optical properties of 597
fine/coarse mode aerosol mixtures. J. Geophys. Res. 115, D19205. 598
Farahat, A., 2016. Air pollution in the Arabian Peninsula (Saudi Arabia, the United Arab 599
Emirates, Kuwait, Qatar, Bahrain, and Oman): Causes, effects, and aerosol 600
categorization. Arab. J. Geosci. 9, 196. 601

33
Farahat, A., El-Askary, H., Adetokunbo, P., Fuad, A.-T., 2016. Analysis of aerosol absorption 602
properties and transport over North Africa and the Middle East using AERONET data. 603
Ann. Geophys., 34, 1031–1044. 604
Farahmandkia, Z., Mehrasbi, M.R., Sekhavatjou, M.S., 2010. Relationship between 605
concentrations of heavy metals in wet precipitation and atmospheric PM10 particles in 606
Zanjan, Iran. Iranian Journal of Environmental Health and Sciences Engineering, 8, 607
49−56. 608
Foroushani, M.A., Opp, C., Groll, M., 2019. Chemical Characterization of Aeolian Dust 609
Deposition in Southern and Western Iran. Asian J. Geograph. Res. 2,1−22. 610
Gautam, R., Hsu, N.C., Kafatos, M., Tsay, S.-C., 2007. Influences of winter haze on fog/low 611
cloud over the Indo-Gangetic plains. J. Geophys. Res. 112, D05207, 612
doi:10.1029/2005JD007036. 613
Gerivani, H., Lashkaripour, G.R., Ghafoori, M., Jalali, N., The source of dust storm in Iran: A 614
case study based on geological information and rainfall data. Carpathian J. Earth Environ. 615
Sci. 2011, 6. 616
Gharibzadeh, M., Alam, K., Abedini, Y., Bidokhti, A.A., Masoumi, A., Bibi, H., 2018. 617
Characterization of aerosol optical properties using multiple clustering techniques over 618
Zanjan, Iran, during 2010-2013. Appl Opt. 57:2881−2889. 619
Gyawali, M., Arnott, W.P., Zaveri, R.A., Song, C., Moosmüller, H., Liu, L., Mishchenko, M.I., 620
Chen, L.-W.A., Green, M.C.,Watson, J.G., Chow, J.C., 2012. Photoacoustic optical 621
propertiesat UV, VIS, and near IR wavelengths for laboratory generatedand winter time 622
ambient urban aerosols. Atmos. Chem. Phys. 12, 2587–2601. 623
Giles, D.M., Holben, B.N., Eck, T.F., Sinyuk, A., Smirnov, A., Slutsker, I., Dickerson, R., 624
Thompson, A., Schafer, J., 2012. An analysis of AERONET aerosol absorption properties 625
and classifications representative of aerosol source regions. J. Geophys. Res. 117, 626
D17203. 627
Giles, D.M., Holben, B.N., Tripathi, S.N., Eck, T.F., Newcomb, W.W., Slutsker, I., Dickerson, 628
R.R., Thompson, A.M., Mattoo, S., Wang, S.H., 2011. Aerosol properties over the Indo-629
Gangetic Plain: a mesoscale perspective from the TIGERZ experiment. J. Geophys. Res. 630
116, D18203. 631
34
Goudie, A.S., 2014. Desert dust and human health disorders. Environment International 63, 101-632
113. 633
Graaf, D.M., Stammes, P., Torres, O., Koelemeijer, R., 20 634
05. Absorbing aerosol index: sensitivity analysis, application to GOME and comparison with 635
TOMS. J. Geophys. Res. 110, D01201. 636
Hermida, L., Merino, A., Sánchez, J.L., Fernández-González, S., García-Ortega, E., López, L., 637
2017. Characterization of synoptic patterns causing dust outbreaks that affect the Arabian 638
Peninsula. Atmos. Res., 199, 29−39. 639
Higurashi, A., Nakajima, T., 2002. Detection of aerosol types over the East China Sea near Japan 640
from four-channel satellite data. Geophys. Res. Lett. 29, 1836. 641
Holben, B.N., Eck, T., Slutsker, I., Tanre, D., Buis, J., Setzer, A., Vermote, E., Reagan, J.A., 642
Kaufman, Y., Nakajima, T., 1998. AERONETda federated instrument network and data 643
archive for aerosol characterization. Rem. Sens. Environ. 66, 1−16. 644
Hu, Z., Zhao, C., Huang, J., Leung Ruby, L., Qian, Y., Yu, H., Huang, L., Kalashnikova, O., 645
2016. Trans-Pacific transport and evolution of aerosols: Evaluation of quasi-global WRF-646
Chem simulation with multiple observations. Geosci. Model Dev. 9, 1725–1746. 647
Hsu, N.C., Gautam, R., Sayer, A.M., Bettenhausen, C., Li, C., Jeong, M.J., Tsay, S.-C., Holben, 648
B.N., 2012. Global and regional trends of aerosol optical depth over land and ocean using 649
SeaWiFS measurements from 1997 to 2010. Atmos. Chem. Phys. 12, 8037–8053. 650
Islam, M.N., Ali, M.A., Islam, M.M. 2019. Spatiotemporal Investigations of Aerosol Optical 651
Properties Over Bangladesh for the Period 2002–2016. Earth Syst Environ 3, 563–573. 652
Jiries, A., 2003. Vehicular Contamination of Dust in Amman, Jordan. The Environmentalist 23, 653
205–210. 654
Jose, S., Niranjan, K., Gharai, B., Rao, P.V.N., Nair, V.S., 2016. Characterisation of absorbing 655
aerosols using ground and satellite data at an urban location, Hyderabad. Aeros. Air Qual. 656
Res. 16, 1427−1440. 657
Kang, J. Liu, T., Keller, J., Lin, H., 2013. Asian dust storm events are associated with an acute 658
increase in stroke hospitalisation. J. Edipemiol. Community Health 67, 125−131. 659
Kang, L., Chen, S., Huang, J., Zhao, S., Ma, X., Yuan, T., Zhang, X., Xie, T., 2017. The Spatial 660
and Temporal Distributions of Absorbing Aerosols over East Asia. Remote Sens. 9, 661
1050; doi:10.3390/rs9101050. 662

35
Kaskaoutis, D.G., Kambezidis, H.D., Hatzianastassiou, N., Kosmopoulos, P.G., Badarinath, 663
K.V.S., 2007. Aerosol Climatology: On the discrimination of aerosol types over four 664
AERONET sites. Atmos. Chem. Phys. Discuss. 7, 6357−6411. 665
Kaskaoutis, D.G., Kumar Kharol, S., Sinha, P.R., Singh, R.P., Kambezidis, H.D., Rani Sharma, 666
A., Badarinath, K.V.S., 2011. Extremely large anthropogenic aerosol component over the 667
Bay of Bengal during winter season. Atmos. Chem. Phys. 11, 7097−7117. 668
Kaskaoutis, D.G., Nastos, P.T., Kosmopoulos, P.G., Kambezidis, H.D., Kharol, S.K., 669
Badarinath, K.V.S., 2010. The Aura-OMI Aerosol Index distribution over Greece. 670
Atmos. Res, 98, 28-39. 671
Kaufman, Y., Boucher, O., Tanre, D., Chin, M., Remer, L., Takemura, T., 2005. Aerosol 672
anthropogenic component estimated from satellite data. Geophys. Res. Lett. 32, L17804. 673
http://dx.doi.org/10.1029/2005GL023125. 674
Kedia, S., Ramachandran, S., Holben, B.N., Tripathi, S., 2014. Quantification of aerosol type, 675
and sources of aerosols over the Indo-Gangetic Plain. Atmos. Environ. 98, 607−619. 676
Khaniabadi, Y.O., Daryanoosh, S.M., Amrane, A., Polosa, R., Hopke, P.K. et al.. 2017. Impact 677
of Middle Eastern Dust storms on human health. Atmos. Poll. Res. 8, 606−613. 678
Kim, D., Chin, M., Bian, H., Tan, Q., Brown, M.E., Zheng, T., You, R., Diehl, T., Ginoux, P., 679
Kucsera, T., 2013. The effect of the dynamic surface bareness on dust source function, 680
emission, and distribution, J. Geophys. Res. 118, 1–16. 681
Kumar, K.R., Attada, R., Dasari, H.P., Vellore, R.K., Langdon, S., Abualnaja,Y.O., Hoteit, I., 682
2018. Aerosol Optical Depth variability over the Arabian Peninsula as inferred from 683
satellite measurements. Atmos. Environ. 187, 346−357. 684
Lee, K., Chung, C., 2012. Observationally-constrained estimates of global small mode AOD. 685
Atmos. Chem. Phys. Discuss. 12, 31663−31698. 686
Lee, J., Kim, J., Song, C., Kim, S., Chun, Y., Sohn, B., Holben, B.N., 2010. Characteristics of 687
aerosol types from AERONET sunphotometer measurements. Atmos. Environ. 44, 688
3110−3117. 689
Leili, M., Naddafi, K., Nabizadeh, R., Yunesian, M., Mesdaghinia, A., 2008. The study of TSP 690
and PM10 concentration and their heavy metal content in central area of Tehran, Iran. Air 691
Qual Atmos Health 1, 159–166. 692

36
Levelt, P.F., Hilsenrath, E., Leppelmeier, G.W., van den Oord, G.H., Bhartia, P.K., Tamminen, 693
J., de Haan, J.F., Veefkind, J.P., 2006. Science objectives of the ozone monitoring 694
instrument. IEEE Geosci. Remote Sens. Lett. 44, 1199−1208. 695
Li, J., Liu, C., Yin, Y., Kumar, K.R., 2016. Numerical investigationon the Ångström Exponent of 696
black carbon aerosols. J. Geophys.Res. 121, 3506–3518. 697
Logan, T., Xi, B., Dong, X., Li, Z., Cribb, M., 2013. Classification and investigation of Asian 698
aerosol absorptive properties. Atmos. Chem. Phys. 13, 2253−2265. 699
Logothetis, S.-A., Salamalikis, V., Kazantzidis, A., 2020. Aerosol classification in Europe, 700
Middle East, North Africa and Arabian Peninsula based on AERONET Version 3. 701
Atmos. Res., 239, 104893. 702
Mashat, A.W.S., Awad, A.M., Alamoudi, A.M., Assiri, M.E., 2019. Monthly and seasonal 703
variability of dust events over northern Saudi Arabia. Int. J. Climatol. 2019, 1–23. 704
Mashat, A.W.S., Awad, A.M., Assiri, M.E., Labban, A.H., 2020. Dynamic and synoptic study of 705
spring dust storms over northern Saudi Arabia. Theor. Appl. Climatol. 140, 619–634. 706
Omar, A.H., Won, J.-G., Winker, D.M., Yoon, S.-C., Dubovik, O., McCormick, M.P., 2005. 707
Development of global aerosol models using cluster analysis of Aerosol Robotic Network 708
(AERONET) measurements. J. Geophys. Res., 110, D10S14. 709
Omar, A.H., Winker, D.M., Vaughan, M.A., Hu, Y., Trepte, C.R., Ferrare, R.A., Lee, K.P., 710
Hostetler, C.A., Kittaka, C., Rogers, R.R., Kuehn, R.E., 2009. The CALIPSO Automated 711
Aerosol Classification and Lidar Ratio Selection Algorithm. J. Atmos. Ocean. Tech. 26, 712
1994–2014. 713
Onishi, K. Otani, S., Yoshida, A., Mu, H., Kurozawa, Y., 2012. Adverse Health Effects of Asian 714
Dust Particles and Heavy Metals in Japan. Asia-Pacific Journal of Public Health Asia Pac 715
J Public Health 27, NP1719-26. 716
Pérez-Ramírez, D., Veselovskii, I., Whiteman, D.N., Suvorina, A., Korenskiy, M., et al., 2015. 717
High temporal resolution estimates of columnar aerosol microphysical parameters from 718
spectrum of aerosol optical depth by linear estimation: application to long-term 719
AERONET and star-photometry measurements. Atmos. Meas. Tech. 8, 3117–3133. 720
Prakash, P.J., Stenchikov, G., Kalenderski, S., Osipov, S., Bangalath, H., 2015. The impact of 721
dust storms on the Arabian Peninsula and the Red Sea. Atmos. Chem. Phys. 15, 199–222. 722

37
Prospero, J.M., Ginoux, P., Torres, O., Nicholson, S.E., Thomas, E.G., 2002. Environmental 723
characterization of global sources of atmospheric soil dust identified with Nimbus 7 total 724
ozone mapping spectrometer (TOMS) absorbing aerosol product. Rev. Geophys. 40: 2‒725
31. 726
Ram, K., Singh, S., Sarin, M., Srivastava, A., Tripathi, S., 2016. Variability in aerosol optical 727
properties over an urban site, Kanpur, in the Indo-Gangetic Plain: a case study of haze 728
and dust events. Atmos. Res. 174, 52−61. 729
Rupakheti, D., Kang, S., Bilal, M., Gong, J., Xia, X., Cong, Z., 2019. Aerosol optical depth 730
climatology over Central Asian countries based on Aqua-MODIS Collection 6.1 data: 731
Aerosol variations and sources. Atmos. Environ. 207, 205‒214. 732
Rupakheti, D., Kang, S., Rupakheti, M., Cong, Z., Panday, A.K., Holben, B.N., 2019a. 733
Identification of absorbing aerosol types at a site in the northern edge of Indo‑Gangetic 734
Plain and a polluted valley in the foothills of the central Himalayas. Atmos. Res. 223, 15-735
23. 736
Russell, P., Bergstrom, R., Shinozuka, Y., Clarke, A., DeCarlo, P., Jimenez, J.,Livingston, J., 737
Redemann, J., Dubovik, O., Strawa, A., 2010. Absorption Ångström Exponent in 738
AERONET and related data as an indicator of aerosol composition. Atmos. Chem. Phys. 739
10, 1155−1169. 740
Sabbah, I., Hasan, F.M., 2008. Remote sensing of aerosols over the Solar Village, Saudi Arabia. 741
Atmos. Res. 90, 170–179. 742
Saeedi, M. Li, L.Y., Salmanzadeh, M., 2012. Heavy metals and polycyclic aromatic 743
hydrocarbons: Pollution and ecological risk assessment in street dust of Tehran. Journal 744
of Hazardous Materials 227–228, 9–17. 745
Schmeisser, L., Andrews, E., Ogren, J. A., Sheridan, P., Jefferson, A., et al., 2017. Classifying 746
aerosol type using in situ surface spectral aerosol optical properties. Atmos. Chem. Phys. 747
17, 12097−12120. 748
Shao, Y., 2008. Physics and Modelling of Wind Erosion, Springer, Berlin, Germany. 749
Shen, X., Bilal, M., Qiu, Z., Sun, D., Wang, S., Zhu, W., 2019. Long-term spatiotemporal 750
variations of aerosol optical depth over Yellow and Bohai Sea. Environ. Sci. Poll. Res. 751
26, 7969‒7979. 752
38
Shin, S.K., Tesche, M., Noh, Y., Müller, D. 2019. Aerosol-type classification based on 753
AERONET version 3 inversion products. Atmos. Meas. Tech., 12, 3789–3803. 754
Shin, S.K., Tesche, M., Müller, D., Noh, Y. 2019. Technical note: Absorption aerosol optical 755
depth components from AERONET observations of mixed dust plumes. Atmos. Meas. 756
Tech., 12, 607–618. 757
Srivastava, A. K., S. N. Tripathi, S. Dey, V. P. Kanawade, S. Tiwari, 2012. Inferring aerosol 758
types over the Indo-Gangetic Basin from ground based sunphotometer measurements. 759
Atmos. Res. 109−110, 64−75. 760
Su, B., Li, H., Zhang, M., Bilal, M., Wang, M., Atique, L., Zhang, Z., Zhang, C., Han, G., Qiu, 761
Z., Ali, M.A. 2020. Optical and Physical Characteristics of Aerosol Vertical Layers over 762
Northeastern China. Atmosphere, 11, 501. 763
Tiwari, S., Srivastava, A.K., Singh, A.K., Singh, S., 2015. Identification of aerosol types over 764
Indo-Gangetic Basin: implications to optical properties and associated radiative forcing. 765
Environ. Sci. Poll. Res. 22, 12246–12260. 766
Torres, O., Chen, Z., Ahn, C., 2009. Aerosol absorption measurements from space by the Aura-767
OMI sensor. In: Proc. STAR Science Seminar, NOAA-NESDIS, Camp Springs, MD. 768
https://www.star.nesdis.noaa.gov/star/documents/seminardocs/Torres_20090702.pdf. 769
Torres, O., Tanskanen, A., Veihelmann, B., Ahn, C., Braak, R., Bhartia, P.K., Veefkind, P., 770
Levelt, P., 2007. Aerosols and surface UV products from Ozone Monitoring Instrument 771
observations: an overview. J. Geophys. Res. 112, D24S47. 772
Wang, S., Fang, L., Gu, X., Yu, T., Gao, J., 2011. Comparison of aerosol optical properties from 773
Beijing and Kanpur. Atmos. Environ. 45, 7406−7414. 774
Wilks, D.S., 2006. Statistical Methods in the Atmospheric Sciences, Academic Press, 775
Amsterdam Boston, Heidelberg, London. 776
Williams, J.B., Shobrak, M., Wilms, T.M., Arif, I.A., Khan, H.A., 2012. Climate change and 777
animals in Saudi Arabia. Saudi Journal of Biological Sciences 19, 121–130. 778
Winker, D.M., Pelon, J.R., McCormick, M.P., 2003. The CALIPSO mission: spaceborne lidar 779
for observation of aerosols and clouds. In: Third International Asia-Pacific 780
Environmental Remote Sensing of the Atmosphere, Ocean, Environment, and Space. 781
International Society for Optics and Photonics,pp. 1e11. Proc. SPIE 4893. 782
39
Wu, Y.L., Li, H.W., Chien, C.H., Lai, Y.C., Wang, L.C., 2010. Monitoring and Identification of 783
Polychlorinated Dibenzo-p-dioxins and Dibenzofurans in the Ambient Central Taiwan. 784
Aeros. Air Qual. Res. 10, 463–471. 785
Wu, Y., Zhu, J., Che, H., Xia, X., Zhang, R., 2015. Column-integrated aerosol optical properties 786
and direct radiative forcing based on sun photometer measurements at a semi-arid rural 787
site in Northeast China. Atmos. Res. 157, 56–65. 788
Yu, Y., Notaro, M., Liu, Z., Kalashnikova, O., Alkolibi, F., Fadda, E., Bakhrjy, F., 2013. 789
Assessing temporal and spatial variations in atmospheric dust over Saudi Arabia through 790
satellite, radiometric, and station data. J. Geophys. Res. Atmos. 118, 13253–13264. 791

Highlights
• AERONET, OMI, and CALIPSO datasets were used for classifying aerosols
• OMI AAOD shows the dominance of absorbing aerosols with high seasonal variability
• Dust, then mixed black carbon and dust dominated over the study area, Saudi Arabia
• Mixed aerosol types suggest increasing fossil fuel and biogenic emissions
• FMF vs. (AE, AAE, and SSA) are the best techniques for classifying aerosols