classification and regression trees on aggregate data ... · classification and regression trees on...
TRANSCRIPT

HAL Id: hal-00660042https://hal.archives-ouvertes.fr/hal-00660042
Submitted on 2 Feb 2012
HAL is a multi-disciplinary open accessarchive for the deposit and dissemination of sci-entific research documents, whether they are pub-lished or not. The documents may come fromteaching and research institutions in France orabroad, or from public or private research centers.
L’archive ouverte pluridisciplinaire HAL, estdestinée au dépôt et à la diffusion de documentsscientifiques de niveau recherche, publiés ou non,émanant des établissements d’enseignement et derecherche français ou étrangers, des laboratoirespublics ou privés.
Classification and Regression Trees on Aggregate DataModeling: An Application in Acute Myocardial
InfarctionC. Quantin, Lynne Billard, M. Touati, N. Andreu, Y. Cotin, M. Zeller, F.
Afonso, G. Battaglia, D. Seck, G. Le Teuff, et al.
To cite this version:C. Quantin, Lynne Billard, M. Touati, N. Andreu, Y. Cotin, et al.. Classification and Regression Treeson Aggregate Data Modeling: An Application in Acute Myocardial Infarction. Journal of Probabilityand Statistics, 2011, 2011 (523937), pp.19. <10.1155/2011/523937>. <hal-00660042>

Hindawi Publishing CorporationJournal of Probability and StatisticsVolume 2011, Article ID 523937, 19 pagesdoi:10.1155/2011/523937
Research ArticleClassification and Regression Trees on AggregateData Modeling: An Application in AcuteMyocardial Infarction
C. Quantin,1, 2 L. Billard,3 M. Touati,4 N. Andreu,1, 2 Y. Cottin,5M. Zeller,5 F. Afonso,4 G. Battaglia,4 D. Seck,4 G. Le Teuff,1, 2
and E. Diday4
1 INSERM EMI 0106, 21000 Dijon, France2 Universite de Bourgogne, Service de Biostatistique et Informatique Medicale, CHU, 21000 Dijon,boulevard Jeanne d’Arc BP 77908, 21079 Dijon Cedex, France
3 Department of Statistics, University of Georgia, Athens, GA 30602-1952, USA4 CEREMADE CNRS UMR 7534, Universite de Paris, Dauphine 75775 Paris Cedex 16, France5 Service de Cardiologie, Centre Hospitalier du Bocage, BP 77908, 21079 Dijon Cedex, France
Correspondence should be addressed to C. Quantin, [email protected]
Received 22 October 2010; Revised 24 March 2011; Accepted 25 May 2011
Academic Editor: Peter van der Heijden
Copyright q 2011 C. Quantin et al. This is an open access article distributed under the CreativeCommons Attribution License, which permits unrestricted use, distribution, and reproduction inany medium, provided the original work is properly cited.
Cardiologists are interested in determining whether the type of hospital pathway followed bya patient is predictive of survival. The study objective was to determine whether accountingfor hospital pathways in the selection of prognostic factors of one-year survival after acutemyocardial infarction (AMI) provided a more informative analysis than that obtained by theuse of a standard regression tree analysis (CART method). Information on AMI was collectedfor 1095 hospitalized patients over an 18-month period. The construction of pathways followedby patients produced symbolic-valued observations requiring a symbolic regression tree analysis.This analysis was compared with the standard CART analysis using patients as statistical unitsdescribed by standard data selected TIMI score as the primary predictor variable. For the 1011(84, resp.) patients with a lower (higher) TIMI score, the pathway variable did not appear asa diagnostic variable until the third (second) stage of the tree construction. For an ecologicalanalysis, again TIMI score was the first predictor variable. However, in a symbolic regression treeanalysis using hospital pathways as statistical units, the type of pathway followed was the keypredictor variable, showing in particular that pathways involving early admission to cardiologyunits produced high one-year survival rates.

2 Journal of Probability and Statistics
1. Introduction
Predictive variables of in-hospital mortality after acute myocardial infarction (AMI) havebeen studied for many years and include age [1], the severity of disease at admission [2],previous history of AMI, family history of coronary disease [3], and comorbidities suchas excess weight [4, 5], diabetes [6–8], systemic hypertension [9], and dyslipidemia [10].As part of these clinical variables, the time between occurrence of the first symptoms andadmission into intensive care units (ICU) or into cardiology units represents another verywell-known determinant of in-hospital mortality after myocardial infarction (MI), as this isa measure of the quickness of therapeutic intervention and care [11]. It is well known thatthe severity of the AMI at admission governs the process of care especially the decision(s)to move the patient to an intensive care unit or to cardiology. Earlier studies such as [12–14] have suggested that patients treated by cardiologists had better survival rates than thosetreated by noncardiologists. In [15], rather than treatment by a cardiologist, attention focusedon admission to a cardiology unit.
It is, therefore, natural that cardiologists and other clinical researchers in generalare becoming increasingly interested in the role and impact of the pathway followed bya patient as a potential factor associated with survival, taking into account the influenceof other prognostic factors. Hospital pathway herein is defined as the temporal processfollowed covering all hospital stays within the same hospital and across multiple healthcareinstitutions. A simple pathway is onewhere a patient is admitted to, for example, a cardiologyunit and then discharged or a more complicated pathway is when the patient after admissionto an intensive care unit (ICU) is subsequently moved to a cardiology unit at the same oranother hospital. There are many possible pathways involving patients moving in and out ofcardiology and noncardiology units not necessarily at the same institution.
As a consequence, the aim is not only to consider the effect of a patient’s admissiondirectly into a cardiology unit compared to admission into an unspecialized hospital unitas was done in [15] but also to take into account the complexity of the patient’s pathwaysfor treatment of AMI across multiple hospitals and multiple units. We have two questions:how can complex pathways be considered in the analysis, and what is the influence of thesepathways on prognosis?
Unfortunately, standard analyses in which pathway type is a covariate in the modelare questionable, because the pathway itself may not only affect the outcome but also dependon some patients’ characteristics associated with survival. Therefore, pathway type is partlya mediating variable for other prognostic factors. If so, then adjusting these other factors forpathway, and vice versa, is problematic and may bias the results.
To avoid such problems, an alternative approach is to replace the “individual” dataanalysis by an ecological comparison of “groups of patients”, with patients following thesame pathway forming a group. In fact, this method takes into account the hierarchicalstructure of the data (e.g., the patients hospitalized in the same hospitals and followingthe same pathways may share the same sociodemographics characteristics such as place ofresidence and clinical characteristics such as the severity of the disease). Thus, rather thanattempting to estimate the effects of these other factors adjusted for pathway, the ecologicalanalysis would investigate which characteristics of patients who follow the same pathwaysare associated with better survival rates.
This poses two problems. First, it is often difficult to analyse a large number ofmodalities especially for multilevel analysis. Second, these analyses of pathways requiresaggregation of those patients who follow a given pathway. Standard ecological analyses of

Journal of Probability and Statistics 3
these aggregated data replace individual data values by their group-level aggregate values,usually the mean value for continuous variables or proportional values for binary variables.These values reflect central tendency only, ignoring variations among those individuals whomade up that group or pathway. Yet, ignoring this variation in the predictor values acrossindividuals in the same group is known to induce systematic bias; see, for example, [16–19].
So-called symbolic analytic methods provide an alternative approach to analyzinggrouped data. In contrast to standard ecological analyses, symbolic analyses take into accountnot only the central tendency but also the internal variations of the individuals within thegrouped data. This is achieved by retaining all the aggregated information as, for example,lists, interval- or histogram-valued data, instead of replacing the individual values by theone central tendency value; see Section 2.3 for a description of symbolic data. It is possibleto show that the total variation of (say) interval-valued data equals the sum of the withinintervals variations and the between intervals variation [20]. Thus, ecological analyses whichuse the central tendency are ignoring the within observation variations and so base theirresults on the between observations (i.e., groups) variations only. This loss of informationclearly impacts on the results of the analyses. Attempts have been made to overcome this byreplacing the observed interval value by its end points values; the results are unsatisfactoryand tend to reflect those obtained when using central tendency values. In both cases, theinternal variations in the data are not observed by, nor used in, an ecological or standardanalysis.
The objective of the present study is to illustrate potentially new insights that couldbe obtained by a symbolic analysis of the role of hospital pathways on the survival ofpatients one year after acute myocardial infarction. To this end, we compare results of aconventional classical CART (classification and regression trees, [21]) analysis on individualpatients and on the ecological pathways central tendency values, and on the symbolic valuesof the pathways using a symbolic version of the classical CART methodology. One feature ofthis symbolic CART methodology is that when observations are classical values, the classicalCART results come out as a special case of the symbolic CART. The methods are describedbriefly in Section 3 with the results in Section 4.
2. Data
2.1. The Patients
The study population was made up of 1095 patients who were hospitalized for myocardialinfarction (AMI) at 6 healthcare institutions: the teaching hospital of Dijon, one privatehospital located in the suburbs of Dijon (Fontaines), and 4 public local hospitals (Beaune,Chatillon, Montbard, and Semur) over a period of 18 months (from June, 2001 to December,2002) in the French administrative area of the Cote d’Or. One hospital had three differentcardiology units, while the others had one such unit, to which patients could be admitted.These patients were identified through the French Registry of AMI of the Cote d’Or, whereall AMI cases hospitalized in public or private hospitals in this area are recorded.
Patient characteristics were drawn from this French registry which also containsinformation on treatment and patient outcomes. These clinical data were linked to the healthadministrative database in each hospital in order to collect information on hospital stay usingthe French Diagnosis Related Groups (DRGs) information system [22]. This system describeshospital activity by recording a discharge abstract for each patient stay.

4 Journal of Probability and Statistics
Table 1: Random variables.
(a) Variable (b) A pathwayYj Description Categories Oj observationY1 Gender {Female, Male} {Female , 0.1; Male , 0.9}Y2 Angina {Yes, No} {No , 1.0}Y3 Smoker {Yes, No} {Yes , 0.9; No , 0.1}Y4 Heredity {Yes, No} {Yes , 0.4; No , 0.6}Y5 Prior AMI {Yes, No} {No , 1.0}Y6 Diabetes {Yes, No} {Yes , 0.1; No , 0.9}Y7 Arterial hypertension {Yes, No} {Yes , 0.9; No , 0.1}Y8 Cholesterol {Yes, No} {Yes , 0.1; No , 0.9}Y9 ST deviation {Yes, No} {Yes , 0.1; No , 0.9}Y10 TIMI score {0, 1, . . . , 14} {1, 0.11; 2, 0.11; 3, 0.11; 4, 0.22; 5, 0.11; 7, 0.33}Y11 Expert class {1, . . . , 8} {7, 0.5; 8, 0.5}Ya12 Survived one year {Yes, No} {Yes , 0.4; No , 0.6}
aExplanatory variable.
2.2. Description of Variables
From the 218 measurements recorded per patient, eleven variables were selected as beingimportant for the present study. These were gender (gender: female, male); did the patienthave a previous experience of acute myocardial infarction or angina (angina: yes, no); dids/he have a history of smoking (smoker: yes, no); is there a family history of coronarydisease, of myocardial infarction or angina (heredity: yes, no); had the patient experienced aprior myocardial infarction (prior AMI: yes, no); was the patient diabetic (diabetes: yes, no);was the patient being treated for systemic arterial hypertension (arterial hypertension: yes,no); did the patient have dyslipidemia and treated for hypercholesterol (cholesterol treated:yes, no); did the patient experience acute myocardial infarction with or without ST-segmentdeviation (ST elevation: yes, no); severity of disease at admission, that is, thrombolysis inmyocardial infarction (TIMI) score (TIMI: 0,. . ., 14). The TIMI risk score is a weighted integerscore based on 8 clinical risk indicators that can be easily ascertained at presentation (seeTable 1 in [23]). For each patient, the score is calculated as the arithmetic sum of the points foreach risk feature present. Note that obesity per se was not considered as a separate variableas measures of excess weight are factored into the TIMI score likewise age.
The eleventh variable, called “Expert Class” (Expert: 1,. . ., 8) related to the type ofhealthcare at admission; see Section 2.3. It is this concept that is the focus of the presentstudy. Also selected as the explanatory variable in the regression tree analysis was whetheror not the patient survived at least one year after admission. A summary of these variates isprovided in Table 1(a).
2.3. Hospital Pathways
The patient hospital pathway was defined as the temporal process covering all hospital stayswithin the same hospital and across multiple healthcare institutions by using the dischargeabstracts; that is, it is the exact order that a patient followed. For example, a patient maybe hospitalized directly in one of the 8 intensive care units (ICU) of cardiology of the Coted’Or. However, some patients may be hospitalized in another medical unit, such as geriatrics

Journal of Probability and Statistics 5
DIJON teaching hospital
DIJON teaching hospital
Home
Home
Cardiologyintensivecare unit
Patient 1
SEMUR hospital
Geriatricunit
Cardiologyunitintensive
care unit
Cardiologiccare unitIntensive
Patient 2
Hospital pathway for treatment of first acutemyocardial infarction. (Hospitalizations in 2 health care centers consecutive)
Figure 1: Two examples of pathways.
or neurology before being cared for in a cardiology unit, in so far as AMI diagnosis is notsystematically assessed at the patient’s admission. Moreover, transfers between hospitalsmay be needed in order to perform complementary investigations such as revascularization.
Examples of two possible pathways are depicted in Figure 1. Patient 1 was admitteddirectly into a cardiology intensive care unit at the Dijon Teaching Hospital before beingreleased (and sent home). Patient 2 was admitted to the geriatric unit at the Semur Hospitaland moved to the Semur intensive care unit; this patient was then transferred to the DijonTeaching Hospital first to the cardiology intensive care unit and later to the cardiology unitand was subsequently released and sent home.
To identify the different types of pathways, we started by ordering the first hospitalunit according to their frequencies by which admissions occurred. Then, for each of thosehospital units, we added the second hospital unit to which a patient was transferred, and weordered all the resulting paths by their frequencies and so on (with the triples, quadruples,etc.) as long as the “tuple” frequencies remained higher than a given threshold. The pathwaysthat emerged were called the “strong pattern” pathways. These are described in Table 2. Alsoshown are the number of patients who followed each type of pathway, as well as, the numberof different pathwaysmatching that pattern description. A hospital pathway is based on threetypes of information: the type of healthcare institution, the type of hospital unit, and thechronological order of admission to the unit.
Each patient followed a pathway. There were m = 204 distinct pathways for the 1095patients in the study. These m pathways fell into one of ten pathway patterns; see Table 2.Thus, pattern 1 identifies 8 of the 204 pathways as being such that a patient was admitted toa cardiology unit at a single hospital before being discharged and sent home; for example, acardiology unit at Dijon Hospital (as in Patient 1 in Figure 1). This pattern accounted for 403of the patients. On the other hand, if a patient spent time at more than one institution andwas admitted to noncardiology units before eventual admission to cardiology (e.g., Patient2 of Figure 1), then the pattern 10 pertains. The aggregation of individual patient values bypathway perforce produces symbolic data.

6 Journal of Probability and Statistics
Table 2: “Patterns” of hospital pathways.
Pattern Expert Description Pathways Patients
Class # % # %
1 1 Single unit: UF1∗: cardiology 8 3.9 403 36.82 2 Single unit: UF1: no cardiology 2 1.0 2 0.2
3 3 Transfer: single hospital, multiunitsUF1: cardiology, UF2∗∗: no cardiology 10 4.9 14 1.3
4 3 Transfer: single hospital, multiunitsUF1: cardiology, UF2: cardiology 48 23.5 427 39.0
5 4Transfer: single hospital, multiunitsUF1: no cardiologist, UF2: nocardiology
5 2.5 5 0.4
6 5 Transfer: single hospital, multiunitsUF1: no cardiology, UF2: cardiology 32 15.7 43 3.9
7 6 Transfer: multi hospital, multiunitsUF1: cardiology, UF2: no cardiology 2 1.0 3 0.3
8 7 Transfer: multi hospital, multiunitsUF1: cardiology, UF2: cardiology 78 38.2 177 16.2
9 8 Transfer: multi hospital, multiunitsUF1: no cardiology, UF2: no cardiology 1 0.5 1 0.1
10 8 Transfer: multi hospital, multiunitsUF1: no cardiology, UF2: cardiology 18 8.8 20 1.8
∗UF1: first hospital unit ∗∗UF2: second hospital unit.
Since this pathways variable only takes into account the type of hospital unit and thechronological order of the patient’s transfer, the type of healthcare institution at admissionwas introduced as another covariate (called Expert Class) in the analysis.
2.4. Symbolic Data
Symbolic data methodology extends standard classical categorical or numerical variablesto the case where the variable values may be intervals, histograms, lists of categoricalvalues, and so forth. These kinds of variable values emerge when we aggregate observationsmeasuring the clinical information between patients within the same pathways. To illustrate,consider the observations of Table 3, where for each patient the first hospital unit to whichthey were admitted is identified, and suppose also that age is recorded by year and smokinghistory is recorded as one of no, light, heavy smoker. When the focus of interest is theadmitting hospital rather than the individual patients per se, the statistical unit is nowthat hospital. Therefore, when we aggregate over those patients who were admitted to thathospital, we obtain (for the classical data of Table 3), the symbolic data of Table 4. Thus,the variable age has the observed interval value of [70, 82] for Hospital 1 and [69, 80] forHospital 2. Classical values are special cases; for example, for Hospital 3, age is in the interval[76, 76]. The variable for smoking history has a realization for Hospital 1 that reads as 25%were light and 75% were heavy smokers. This variable is now a modal-valued categoricalvariable. Categorical symbolic realizations are lists of possible (discrete) values. When noweights are attached, it is assumed the listed outcomes are equally likely. Interval-valuedrealizations are assumed to take specific values that are uniformly distributed across thatinterval.

Journal of Probability and Statistics 7
Table 3: Sample of patient records.
Patient Hospital Age SmokerPatient1 Hospital 1 74 heavyPatient2 Hospital 1 78 lightPatient3 Hospital 2 69 noPatient4 Hospital 2 73 heavyPatient5 Hospital 2 80 lightPatient6 Hospital 1 70 heavyPatient7 Hospital 1 82 heavyPatient8 Hospital 3 76 no...
......
...
Table 4: Symbolic data by hospital.
Hospital Age SmokerHospital 1 [70, 82] {light 1/4, heavy 3/4}Hospital 2 [69, 80] {no, light, heavy}Hospital 3 [76, 76] {no}...
......
Sometimes, because of underlying conditions, it can be that what seem to berectangular observations are more accurately hypercubes. For example, suppose the tworandom variables Y1 and Y2 take values on the intervals [100, 120] and [95, 115], respectively.Then, the observed value is the rectangle Rect = [100, 120] × [95, 115]. Suppose, however,that Y1 ≥ Y2 (as, e.g., when systolic blood pressure is greater than diastolic blood pressure).Under this condition, values inside the triangle with vertices (100, 100), (100, 115) and(115, 115) are not possible. Thus the effective observation space is the hypercube with vertices(100, 95), (120, 95), 120, 115), (115, 115), and (100, 100).
In general, datasets become symbolic-valued after aggregation of a larger dataset ofclassical or symbolic valued observations. Many forms of aggregation could apply for anyone dataset, the actual aggregation(s) adopted being driven by the scientific questions behindthe study itself. For example, an insurance company (with its database running into millionsof individual records) is less interested in one specific person’s medical-care usage than it isinterested in the pattern of forty-year old women (say) or sixty-year old cardiac victims, andso on.
To use standard methodology on the resulting symbolic data will be inadequate. Forexample, suppose that a person’s weight W fluctuates over the interval W1 = [160, 166] inpounds and a second person’s weight ranges across W2 = [157, 169]. When we take theclassical valuedmidpoint (or, more generally, a central tendencymeasure), here 163 in each ofW1 and W2, we would obtain the same results. Yet, these observations are differently valuedand any analysis should reflect these differences. Thus, an analysis on the midpoints ignoresthe information that the first interval W1 is internally less variable than is the second W2
(with internal variations of 3 and 12, resp.). Symbolic analytic techniques take these internalvariations into account.
In a different direction, symbolic data can be used to maintain data confidentiality. Forexample, rather than pulse rate = 64, the value can be recorded as 64−δ1, 64+δ2 (with δ1 /= δ2),

8 Journal of Probability and Statistics
for example, pulse rate = [60, 71]. In the current application, we replaced the description ofeach of the patients by the description of pathways; thus, it is difficult to identify patientswithin a given pathway.
Some measurements are inherently imprecise or fuzzy. Rather than trying to take asingle measure such as the mean to serve as the surrogate for the measurements, the rangeof actual values over a specific time period can be retained as an interval-valued datapoint(or, histogram-valued, or other suitable symbolic-valued variable). For example, [24] (alongwith several other researchers such as [25]) discusses how the level of systolic pressure andits changes over time are an important aspect on strokes and how difficult it is to obtain anaccurate single measurement due to its highly variable nature especially over time. The study[24] goes on to describe how the researcher can be misled if the left ventricular hypertrophyis used as a marker for systolic blood pressure. In contrast, if, for example, all systolicmeasurements over the time period were aggregated, then a symbolic valued observationemerges. In some cases (e.g., smoking levels, other social and educational measures; see, e.g.,[26]), issues surrounding residual confounding (but not necessarily confounding in and ofitself) are obviated (see, e.g., [27]).
In the context of the current study, the scientific question revolves around thepathways (or patterns) encountered by cardiac patients rather than any one patient per se.Are certain pathways more or less likely to predict survival; are certain predictor variablesmore indicative of particular pathway tracks, and so on? The example of Tables 3 and 4would represent a pathway of but one step, the admitting hospital. In the actual study, thepathways are those described earlier; see Table 2. The observed realization for the outcomeand predictor variables is what pertains when the observed values for the individual patients,who collectively make up a pathway, are aggregated. These resulting observations areperforce symbolic valued being lists, interval-valued, and/or modal-valued, as appropriate.Table 1(b) gives the results for one such pathway. For a more extensive review of symbolicdata, see [28–30].
3. Methods
In order to select the potential covariates associated with one-year survival, we use theCART method [21]. This nonparametric approach is interesting when the type or nature ofcandidate covariates is important. How this applies in the standard classical setting when theunits are individual patients is described in Section 3.1. When the units are the pathways,there are two methods. First, the ecological pathway values can be used as described inSection 3.2. The adaptation of the classical CART method to the pathways symbolic data isdiscussed in Section 3.3.
3.1. Regression Tree Analysis (Classical CART Method) on Patients
To explore the potential determinants of one-year mortality after AMI, we first used theusual classification and regression tree (CART) method [21] on the 1095 individual patientsthemselves (so as to compare these results with the counterpart results based on thepathways). A CART analysis uses regression techniques in order to find a classification thatbest explains the relationships between given categorical variables. The predictor/regressionvariables (such as weight, TIMI score, and smoker, etc.) are used to inform the analyst howthe classification tree should be constructed. This is now a well-established technique and

Journal of Probability and Statistics 9
has been applied extensively to a wide variety of statistical settings. Recent use of CART tocardiology patients in a hospital environment can be found in, for example, [21, 22, 31], andin cancer [32].
3.2. Regression Tree Analysis (Ecological CART Method) on Pathways
The primary focus, however, is on pathways as the statistical unit. Note that any particularpathway has one or more individual patients who follow the same pathway. For an ecologicalanalysis, central tendency values of the individual values in each pathway are used asthe “observation” for each variable. Then, the standard classical CART methodology asdescribed above is run using these “observation” values. For our study, the mean valueswere calculated, and hence, the CART methodology was applied to the 204 pathways.
3.3. Regression Tree Analysis (Symbolic CART Method) on Pathways
Rather than taking a central tendency value as in the ecological analysis, the pathway valueswere retained as symbolic observations such as lists or intervals; see Section 2.3. Since an“observation” for a pathway will in general be a hypercube in p-dimensional space ratherthan the point in p-dimensional space of standard/classical data associated with a patient, aso-called symbolic CART analysis is required. This is achieved by combining the concepts ofsymbolic regression analysis (see, e.g., [33–35])with the basic ideas of the CARTmethod [21]as follows.
Both the classical CART method and the symbolic regression tree analysis are basedon a divisive top-down classification tree method, restricted to recursive binary partitions,until a suitable stopping rule prevents further divisions. The binary partition is induced bythe variable which implies the best binary splitting of the variables for a given criterion.The criterion used by the CART method is a discrimination criterion D(N) which measuresthe impurity of a node N with respect to the prior partition (G1, . . . , GJ). Like the classicalCART, the discrimination criterion used for the symbolic CART is the Gini measure. The Ginimeasure of node impurity is a measure which reaches a value of zero when only one class ispresent at a node. With priors estimated from class sizes, the Gini measure is computed asthe sum of products of all pairs of class proportions for classes present at the node; it reachesits maximum value when class sizes at the node are equal. Therefore, following Breiman etal. [21],
D(N) =∑i /= f
pipf = 1 −∑
i=1,...,J
p2i , (3.1)
with pi = ni/n, ni =card(N ∩ Gi) and n =card(N) in the classical case. In the symbolic case,ni= number of individuals belonging to N which verify the current description of N and atthe same time belong to Gi and n = the total number of the individuals belonging to N. Tonormalize D(N), we multiply by J/(J − 1)where J is the number of prior classes; it then liesin the interval [0, 1].

10 Journal of Probability and Statistics
To construct the tree, we partition the node N into two nodes N = (N1,N2). The ideais to find that node and partitioning which maximizes the reduction in total variation. Thatis, we want to maximize
ΔD = D(N) −D(N1,N2) = D(N) −D(N1) −D(N2). (3.2)
If the variable Yj is the partitioning variable from the complete set of variables Y =(Y1, . . . , Yp), then the cut point is cj , say. For modal multivalued data (as in our dataset),we find this cj as follows. Suppose that the set of possible categorical values for eachYj is Oj = {mj1, . . . , mjs}, j = 1, . . . , p. Then, a particular observation u takes the valuesYuj = {mujk, pujk; k = 1, . . . , s} for u = 1, . . . , ni, j = 1, . . . , p, where ni is the number ofobservations at nodeN and pujk is the probability (or relative frequency) that the kth categorymjk occurred for the jth variable by the uth observation, with
∑k pujk = 1. (When a particular
category does not occur, its probability is zero.) For each k in turn, the pujk are ordered fromsmallest to largest. Then, the cut point, cjkr , for the category mjk is the probability
cjkr =
(pjkr + pjk,r+1
)2
, r = 1, . . . , nk − 1, k = 1, . . . , s, (3.3)
where nk < s is the number of distinct values of pjkr . Likewise, pairs of categories mujk1 andmujk2 have probability (pujk1 + pujk2) which are ordered from the smallest to the largest, andthen the potential cut point between the pairs of categories is the mean of these probabilitypairs. Similarly, in sets of three, four, and so on, categories from Oj are taken and ordered.The methodology then considers all possible partitions based on these possible cut points tofind that partition which maximizes ΔD of (3.2).
The methodology is performed by the STREE (symbolic regression TREE) algorithm.The algorithm includes boosting, bagging, and cross-validation components. A simpleexample illustrating the method is given in [36]. In [36], a comparison of the classicalCART and STREE on learning and test datasets (in a variety of scenarios) showed that themisclassification rate for STREE was considerably less than for CART. Note that when allthe input variables have classical point values (e.g., classical x = a is equivalent to symbolicx = [a, a]), the STREE methodology is the same as the CART methodology.
Here, we apply the regression tree method to the whole population (considered as aclass) in two ways. First we refer to the classical regression tree as the case where the unitsare the patients described by their (classical) numerical or categorical clinical variables (asdeveloped by the CART algorithm). In the second case, we apply the symbolic regressiontree methodology where the units are the pathways described by symbolic-valued variables.
4. Results
4.1. Description of Pathways
The mining of the administrative database for the frequent sequential patterns identified204 different hospital pathways followed by the 1095 patients. However, 14 pathways werefollowed by more than 73% of the patients. Most of the patients were hospitalized for thesame episode of AMI in at least two different units (646 patients, i.e., 59% of the studypopulation). Those patients hospitalized in three or more units were actually transferred

Journal of Probability and Statistics 11
from a local hospital to a tertiary level hospital such as the teaching hospital of Dijon or theprivate hospital healthcare institution (Clinique Fontaine). The step variable represented thechronological order of a patient’s admission defined by the pair: hospital unit × healthcareinstitution at a given time. These pathways fell into one of ten patterns identified in Table 2.
There are eight expert classes identified by cardiologists, and how they match patternsis shown in Table 2. In the classical analysis, these patterns/classes were considered as themodalities of a covariate, expert class. In the symbolic analysis, these patterns for each of the8 expert classes were symbolic-valued realizations.
4.2. Regression Tree Analyses on 1095 Patients
The classical regression tree analysis on the 1095 patients produced the hierarchical treeshown in Figure 2. The most important factor is TIMI score with a cutoff value of 7.5.Regarding patients with TIMI ≥ 7.5, expert class is the next important factor, while regardingthe others, the second cut is led by TIMI score again, but with a threshold of 3.5. For the 510patients with 3.5 ≤ TIMI ≤ 7.5, the further important variables are, respectively, whether ornot these patients were treated for high cholesterol, and there was a hereditary component.Expert class is the third important factor regarding patients with TIMI < 3.5. Most of thepatients with TIMI ≥ 7.5 (N2) have the worst survival rate (95.6%). Although TIMI is themain important factor, the pathway did, however, play a role: at the second cut for the few(84) patients for whom TIMI ≥ 7.5 and at the third cut separating out the 25 patients whowent to a noncardiology unit on admission.
4.3. Ecological Analysis on 204 Pathways
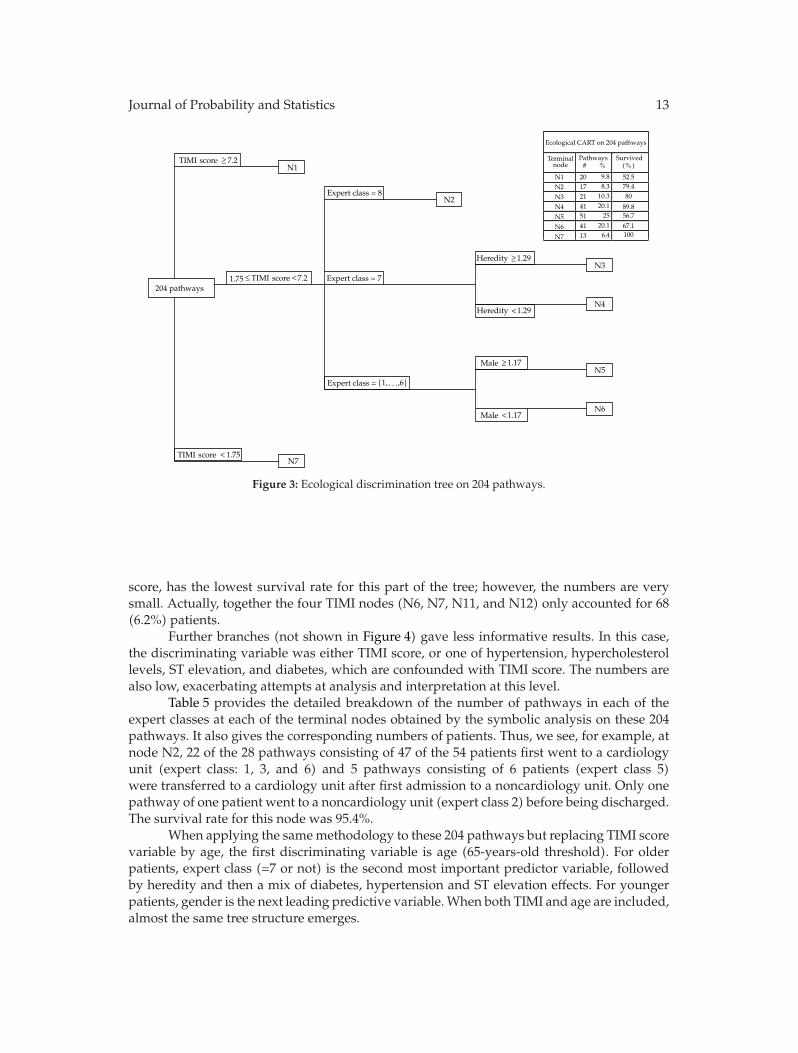
A CART analysis on the “mean” values of the 204 pathways, that is, the so-called ecologicalanalysis, produced the tree shown in Figure 3. As for the analysis on the individual patients,TIMI score is the most important predictor variable for survival: higher TIMI scores ≥ 7.2(N1) correspond to the poorest survival rate (52.5%) whereas lowest TIMI < 1.75 (N7) areassociated with a perfect survival (100%). However, expert class is this time the intermediatesecond predictor variable for pathways having 1.75 ≤ TIMI ≤ 7.2. Regarding those pathways,greatest survival rates (89.9% at N4 and 80.0% at N3) are reached for expert class 7, that is, forpatients who were both admitted in cardiology and transferred to a cardiology department.
Patients in expert class 8 (pathways in which patients first went to a noncardiologyunit) had a survival rate of 79.4% (terminal node N2). Further cuts then occur for expertclass 7, related to heredity, with a lower survival rate (80.0%) in the case of high probabilityof heredity (N3) rather than in low heredity pathways (N4, 89.9%). For lower expert classpathways, the next variable is gender, with a higher proportion of males (N5) having a lowsurvival rate at 56.7%, while women (N6) have a better but still relatively poor survival rateof 67.1%.
4.4. Symbolic Analysis on 204 Pathways
The symbolic analysis on the 204 pathways described by symbolic values, produced theclassification tree shown in Figure 4. Pathways are the most important prognostic factor, withthe variable expert class (equal to 7 or not) being the first discriminating factor. Expert class

12 Journal of Probability and Statistics
CART analysis on 1095 patients
Terminal node
Patients
N1 31 71N2 53 32.1 N3 213 72.3 N4 70 60N5 227 89.9 N6 476 95.6 N7 25 64
2.8 4.8
19.5 6.4
20.7 43.5
2.3
# %
Expert class = {3, 8}
Cholesterol treated =1095 patients
Heredity =
Heredity =
N1
N2
N3
N4
N5
N6
N7
Expert class = {1, 4, 5, 7}
TIMI < 7.5
TIMI < 3.5
Expert class =
Expert class = {4, 5, 6}
Cholesterol treated =
TIMI core 7.5≥
TIMI 3.5≥
urvivedS(% )
yes
yes
no
no
s
cores
cores
cores
{1, 2, 3, 7, 8}
Figure 2: Discrimination tree on 1095 patients.
7 relates to pathways for which both the first and second units were cardiology units albeitit at multiple hospitals. The 77 pathways all coming from expert class 7 (N1 to N7) had ahigh one-year survival rate of 91.9% while the 127 pathways with a probability less than0.69 of containing only cardiology units had an overall survival rate of 76.7%. Thus, at theoutset, not only is pathway/class category important, this analysis identifies the importanceof admission to cardiology units when experiencing a heart attack.
Regarding pathways with expert class 7, while the overall survival rate is 91.9%, weobserve that nodes N2 and N3 have very high survival rates of 95.4% and 100%, respectively.In addition to being pathways dominated by admission to cardiology units, these also havelow probability of family history of heart problems (second cut). In contrast, at node N5the survival is only 38.9%; however, the numbers here are small (only 9 pathways and 16patients).
While pathways with low probability of “expert class 7” have an overall survivalrate of 76.7% and terminal nodes’ survival rates range from 29.2% to 85.1%. The best ratehere 85.1% occurred at node N13, where most pathways began in cardiology units but thenumbers are relatively small.
Notice that in sharp contrast to the classical analysis on the individual patients, TIMIscore does not appear as a discriminating variable until the fourth cut stage of the treeconstruction. Moreover, node N6 which is identified by a high probability of a low TIMI
Journal of Probability and Statistics 13
Ecological CART on 204 pathways
Terminalnode
Pathways#
N1N2N3N4N5N6N7
20 9.8
17 8.3
21 10.3
41 20.1
51 25
41 20.1
13
52.579.480
89.856.7
67.11006 4.
Expert class = 8
Expert class = 7204 pathways
Heredity <1.29
1.75
Male <1.17
Expert class = {1, ,6}
N1
N2
N3
N4
N5
N6
N7
.2TIMI core 7≥
≤ .2TIMI core 7<
Heredity 1.29≥
Male 1.17≥
TIMI core < 1.75
urvivedS(% )%
s
s
s
. . .
Figure 3: Ecological discrimination tree on 204 pathways.
score, has the lowest survival rate for this part of the tree; however, the numbers are verysmall. Actually, together the four TIMI nodes (N6, N7, N11, and N12) only accounted for 68(6.2%) patients.
Further branches (not shown in Figure 4) gave less informative results. In this case,the discriminating variable was either TIMI score, or one of hypertension, hypercholesterollevels, ST elevation, and diabetes, which are confounded with TIMI score. The numbers arealso low, exacerbating attempts at analysis and interpretation at this level.
Table 5 provides the detailed breakdown of the number of pathways in each of theexpert classes at each of the terminal nodes obtained by the symbolic analysis on these 204pathways. It also gives the corresponding numbers of patients. Thus, we see, for example, atnode N2, 22 of the 28 pathways consisting of 47 of the 54 patients first went to a cardiologyunit (expert class: 1, 3, and 6) and 5 pathways consisting of 6 patients (expert class 5)were transferred to a cardiology unit after first admission to a noncardiology unit. Only onepathway of one patient went to a noncardiology unit (expert class 2) before being discharged.The survival rate for this node was 95.4%.
When applying the samemethodology to these 204 pathways but replacing TIMI scorevariable by age, the first discriminating variable is age (65-years-old threshold). For olderpatients, expert class (=7 or not) is the second most important predictor variable, followedby heredity and then a mix of diabetes, hypertension and ST elevation effects. For youngerpatients, gender is the next leading predictive variable.When both TIMI and age are included,almost the same tree structure emerges.

14 Journal of Probability and Statistics
(Expert class = 7) >0.69
204 pathways
(Heredity = n) > 0.33
(ST elevation = ) > 0.67
(Diabetic = ) > 0.25
(TIMI core = 2) >0.7
N2
N3
N5
N6
N7
N8
N9
N10
N11
N12
N13
N14
(Smoker = ) > 0.45
(Hypertension = ) > 0.24
(Angina = ) >0.75
(Prior AMI = ) >0.17
(ST elevation = ) > 0.33
(TIMI core = 3) > 0.22
(TIMI score = 3) > 0.67
N1
N4
Prior AMI = ) > 0.5(
yes
yes
yes
yes
no
no
(ST elevation = ) > 0.33no
no
no
s
s
(Prior AMI = ) 0.17no ≤
(TIMI core = 2) 0.7≤
(TIMI score = 3) 0.22≤
(TIMI score = 3) 0.67≤(Hypertension = ) 0.24no ≤
Prior AMI = ) 0.5( yes ≤
(Diabetic = ) 0.25yes ≤
(ST elevation = ) 0.67yes ≤
(Heredity = n) 0.33no ≤
(Expert class = 7) 0.69≤
(Smoker = ) 0.45yes ≤
urvivedS(%)% %
sSymbolic analysis on 204 pathways
Terminal Pathways Patients
node # # N1 3 3 0.3 66.7 N2 28 54 4.9 95.4 N3 18 75 6.8 100 N4 2 3 0.3 50 N5 9 16 1.5 38.9 N6 2 2 0 .2 50 N7 15 20 1.8 92.2 N8 5 5 0.5 40 N9 38 197 83.6
N10 29 624 69.7 N11 6 10 0.9 76.7 N12 14 36 3.3 29.2 N13 15 29 2.6 85.1 N14 20 21 1.9 65
13.78.8
1
4.4
18.6
17.42.4
14.2
yes
(Angina = ) 0.75≤yes
5718
2.96.9
7.49.8
1.5
Figure 4: Symbolic discrimination tree on 204 pathways.
Table 5: Expert class-terminal node: symbolic analysis on pathways.
Number of pathways Number of patientsExpert class Expert class
Node 1 2 3 4 5 6 7 8 Total 1 2 3 4 5 6 7 8 TotalN1 · · 1 · · 2 · · 3 · · 1 · · 2 · · 3N2 2 1 2 . 5 18 · · 28 3 1 2 · 6 42 · · 54N3 1 2 1 · · 14 · · 18 9 8 20 · · 38 · · 75N4 · · · · · 2 · · 2 · · · · · 3 · · 3N5 · · 1 · · 6 · 2 9 · · 1 · · 13 · 2 16N6 · · · · · 2 · · 2 · · · · · 2 · · 2N7 2 1 4 · 1 7 · · 15 2 1 4 · 1 12 · · 20N8 · · · · 3 2 · · 5 · · · · 1 2 · · 5N9 · 4 4 6 3 18 · 3 38 · 19 5 15 6 149 · 3 197N10 · · 2 1 2 21 1 2 29 · · 2 1 2 508 109 2 624N11 · 1 · · 2 3 · · 6 · 1 · · 6 3 · · 10N12 · · 1 · · 12 · 1 14 · · 1 · · 32 · 3 36N13 · 1 2 · · 12 · · 15 · 1 2 · · 26 · · 29N14 · 3 4 1 3 9 · · 20 · 4 4 1 3 9 · · 21∑
5 13 22 8 19 128 1 8 204 14 35 42 17 27 841 109 10 1095

Journal of Probability and Statistics 15
5. Discussion
Comparing the results from the different analyses, we see immediately that the symbolicanalysis does indeed identify pathways as an important factor. In this case, the cardiologycomponents of pathways (since, e.g., expert class = 7 contains only cardiology units) is thefirst and most important discriminating prognostic variable. This feature did not emerge inthe hierarchical tree when conducting the classical analysis with patients as the statistical unit(see Section 4.2) until the third cut for most (1011) of the patients, and at the second cut forthose 84 patients with TIMI >7.5. These results show that the classical analysis identified theTIMI score as the most important predictor of survival, whereas the new methodology basedon the pathway units identified the pathway through the expert class variable as the mainpredictor of the survival rate along with other relevant covariates such as smoking, heredity,diabetes, hypertension, having a prior infarction or angina, and ST-segment deviation.
A further analysis of subsequent nodes in the symbolic tree also identified highersurvival rates at nodes that had predominately cardiology units at the first or second stepsalong the pathway. Thus, our analysis has expanded the earlier conclusions of [12–14]whichlooked at only the admitting physician (cardiologist or not) or of [15]which considered whatin the pathway setup was the first step only, to conclusions that show the complete sequenceof steps in a pathway is an important predictor of survival.
The ecological analysis, like the symbolic analysis, also considered pathways but didnot use all the information contained in the pathways. The ecological analysis used only thecentral tendency value obtained from among all the individuals included in the respectivepathways, whereas the symbolic analysis used all the information. As a consequence, thesymbolic analysis is able to identify pathways as the first predictor of survival somethingmissed in the ecological study as shown in the comparison between the ecological andsymbolic analyses of the present cardiology study. The ecological analysis did not identify thepathway as being the most important (in the sense that this was not the first cutting variableselected in the tree construction), but did identify this variable at the second branching ofthe tree; see Section 4.3. The classical and ecological analyses started with TIMI score as theirfirst explanatory variable. In this sense then, the ecological analysis can be viewed as havingprovided a more informative analysis than the classical one but still not as good as wasthe symbolic analysis. Thus, the symbolic analysis has all the advantages of the ecologicalanalysis but does not have the ecological analysis’ disadvantages.
From a clinical point of view, the different results in the selection of factors associatedwith higher in-hospital one-year mortality provided by the three classification trees areto be questioned. The classical regression tree with patients as statistical units as wellas the ecological tree based on central tendency values of the pathways as the statisticalunit indicated that the TIMI score was the primary discriminant variable. This result wasexpected in as much as the severity score was a recognized prognostic factor after AMI[37]. Surprisingly, while differences appeared in the risk of death due to disease severityat admission when patients’ pathways were considered as statistical units, neither the typeof healthcare institution nor the “reduced” hospital paths (as expressed through the “expertclass” variable)were discriminant variables in the standard regression tree; see Figure 2. Yet,it is well known that the severity of AMI at admission will govern the process of care andespecially the indication of transfer to an intensive care unit or department of cardiology at ateaching hospital [12, 15]. The ecological analysis gave some improvement with its selectionof the pathway variable at the second cut of the tree. The interim nature of the ecologicalresult is a natural consequence of the fact that these values take the central tendency values

16 Journal of Probability and Statistics
of the symbolic values but ignore the internal variation information used in the analysis ofthe symbolic data.
Several explanations can be proffered to explain such discrepancies between classicaland symbolic data regression trees. The main explanation may be the following. The variable“hospital pathway” can be considered as an almost intermediate variable in the relationshipbetween AMI severity and death by AMI. Indeed, patient characteristics such as age, AMIseverity or distance of the patient’s residence from a specialized care center govern theindication of hospital pathway. However, the type of hospital pathway also determines thepattern of care as well as the quickness of therapeutic interventions and, as a consequence,the outcome of acute myocardial infarction. In this case, it is difficult to consider the variable“hospital pathway” as a potential explanatory variable of death by AMI at the same level asother determinants of patient’s mortality such as age, medical history of coronary events,or comorbidities. Introducing “hospital pathway” as a “classical” independent variablealong with the other independent variables in a regression model exposes the risk of overadjustment of the model. This makes it more interesting to use symbolic data analysis, sinceit allows for consideration of the types of hospital pathways as statistical units instead ofas an explanatory variable of death by AMI. However, using types of hospital pathways asstatistical units implies that independent variables in symbolic data analysis explain deathby AMI within hospital pathways rather than patient death by itself.
As a consequence, these discrepancies were then somewhat expected since theinterpretation of the three regression trees was different. With the classical or ecologicalregression trees, we determined which variables could discriminate patients according totheir living status after AMI whatever their pathway. In the symbolic approach, we areinterested in identifying the variables that can explain the death of patients who followedthe same hospital pathway for myocardial infarction (AMI). Our symbolic analysis has thenshown that pathway itself becomes an important, indeed themost important additional entitybut the interpretation of the covariates’ effect on death probability is not straightforwardwhen the statistical unit is the patient’s pathway instead of the patient. We are not used tointerpreting these results, as classical analyses do not allow for the inclusion of pathwaysinstead of patients as statistical units. A first step in this direction is proposed by themultilevel regression analysis which allows us to consider pathways. However, symbolicanalysis enables us to go much further. Of course, epidemiologists may be wary at first ofthis new way of analysing and interpreting data.
From a methodological point of view, an advantage of the symbolic approach is thatthe paradigm makes it possible to create higher level statistical units described by symbolicdata, therefore, enabling the scientist to settle and solve new questions. Here, the newstatistical units are the pathways. A different question could be “which logical combinationof biological, demographic or clinical variables discriminates pathways or subpathways(described by symbolic data) of nonsurviving patients against pathways of living patients”.
A general advantage of the symbolic approach is the reduction in the number of units.This advantage is particularly important for very large databases, where in theory, there isno problem but in practice the usual classical analyses can become problematical due to itssize. Further, a result of these aggregations is that the problem of missing values is reducedconsiderably. Also, there is an improvement in confidentiality issues.

Journal of Probability and Statistics 17
6. Conclusion
In this work, we have presented a new approach of data analysis in the framework ofdata mining: symbolic data analysis applied to medical data. Symbolic data analysis hasthe advantage of discovering potential associations between variables in taking advantageof the natural hierarchical structure of the data. It is achieved by the definition of newstatistical units corresponding to a level of aggregation higher than the patient. It allowsfor the extraction of statistical information from complex data such as a complete historyof hospital pathways of patients hospitalized for AMI, allowing epidemiologists to discovernew relations that do not appear in, nor can they be identified by, a standard statisticalanalysis.
References
[1] K. Barakat, P. Wilkinson, A. Deaner, D. Fluck, K. Ranjadayalan, and A. Timmis, “How should ageaffect management of acute myocardial infarction? A prospective cohort study,” Lancet, vol. 353, no.9157, pp. 955–959, 1999.
[2] P. De Araujo Goncalves, J. Ferreira, C. Aguiar, and R. Seabra-Gomes, “TIMI, PURSUIT, and GRACErisk scores: sustained prognostic value and interaction with revascularization in NSTE-ACS,”European Heart Journal, vol. 26, no. 9, pp. 865–872, 2005.
[3] A. Menotti and M. Lanti, “Coronary risk factors predicting early and late coronary deaths,” Heart,vol. 89, no. 1, pp. 19–24, 2003.
[4] A. Nigam, R. S. Wright, T. G. Allison et al., “Excess weight at time of presentation of myocardialinfarction is associated with lower initial mortality risks but higher long-term risks includingrecurrent re-infarction and cardiac death,” International Journal of Cardiology, vol. 110, no. 2, pp. 153–159, 2006.
[5] G. D. Thakker, N. G. Frangogiannis, M. Bujak et al., “Effects of diet-induced obesity on inflammationand remodeling after myocardial infarction,”American Journal of Physiology, vol. 291, no. 5, pp. H2504–H2514, 2006.
[6] G. Casella, S. Savonitto, F. Chiarella et al., “Clinical characteristics and outcome of diabetic patientswith acute myocardial infarction. Data from the BLITZ-1 study,” Italian Heart Journal, vol. 6, no. 5, pp.374–383, 2005.
[7] M. Kamalesh, U. Subramanian, A. Ariana, S. Sawada, and W. Tierney, “Similar decline in post-myocardial infarction mortality among subjects with and without diabetes,” American Journal of theMedical Sciences, vol. 329, no. 5, pp. 228–233, 2005.
[8] G. Hu, P. Jousilahti, Q. Qiao, S. Katoh, and J. Tuomilehto, “Sex differences in cardiovascular andtotal mortality among diabetic and non-diabetic individuals with or without history of myocardialinfarction,” Diabetologia, vol. 48, no. 5, pp. 856–861, 2005.
[9] M. G. Abrignani, L. J. Dominguez, G. Biondo et al., “In-hospital complications of acute myocardialinfarction in hypertensive subjects,”American Journal of Hypertension, vol. 18, no. 2, part 1, pp. 165–170,2005.
[10] K. A. Eagle, M. J. Lim, O. H. Dabbous et al., “A validated prediction model for all forms of acutecoronary syndrome estimating the risk of 6-month postdischarge death in an international registry,”Journal of the American Medical Association, vol. 291, no. 22, pp. 2727–2733, 2004.
[11] J. C. Beer, G. Dentan, L. Janin-Magnificat et al., “Beneficial effects of direct call to Emergency MedicalServices on time delays and management of patients with acute myocardial infarction. The RICO(obseRvatoire des Infarctus de la Cote-d’Or) data,” Annales de Cardiologie et d’Angeiologie, vol. 51, no.1, pp. 8–14, 2002.
[12] P. N. Casale, J. L. Jones, F. E. Wolf, Y. Pei, and L. M. Eby, “Patients treated by cardiologists have a lowerin-hospital mortality for acute myocardial infarction,” Journal of the American College of Cardiology, vol.32, no. 4, pp. 885–889, 1998.
[13] J. G. Jollis, E. R. Delong, E. D. Peterson et al., “Outcome of acutemyocardial infarction according to thespecialty of the admitting physician,” New England Journal of Medicine, vol. 335, no. 25, pp. 1880–1887,1996.
[14] M. F. Dorsch, R. A. Lawrance, R. J. Sapsford et al., “An evaluation of the relationship between

18 Journal of Probability and Statistics
specialist training in cardiology and implementation of evidence-based care of patients followingacute myocardial infarction,” International Journal of Cardiology, vol. 96, no. 3, pp. 335–340, 2004.
[15] M.Gottwik, R. Zahn, R. Schiele et al., “Differences in the treatment and outcome of patients with acutemyocardial infarction admitted to hospitals with compared to without departments of cardiology.Results from the pooled data of the Maximal Individual Theraphy in Acute Myocardial Infarction(MITRA1+2) Registries and the MyocardialInfarction Registry MIR,” European Heart Journal, vol. 22,pp. 1794–1801, 2001.
[16] M. H. Gail, S. Wieand, and S. Piantadosi, “Biased estimates of treatment effect in randomizedexperiments with nonlinear regressions and omitted covariates,” Biometrika, vol. 71, no. 3, pp. 431–444, 1984.
[17] N. Keiding, P. K. Andersen, and J. P. Klein, “The role of frailty models and accelerated failure timemodels in describing heterogeneity due to omitted covariates,” Statistics in Medicine, vol. 16, no. 1–3,pp. 215–224, 1997.
[18] C. Schmoor and M. Schumacher, “Effects of covariate omission and categorization when analysingrandomized trials with the Cox model,” Statistics in Medicine, vol. 16, no. 1–3, pp. 225–237, 1997.
[19] R. A. Betensky, D. N. Louis, and J. G. Cairncross, “Influence of unrecognized molecular heterogeneityon randomized clinical trials,” Journal of Clinical Oncology, vol. 20, no. 10, pp. 2495–2499, 2002.
[20] L. Billard, “Sample covariance functions for complex quantitative data,” in Proceedings World CongressInternational Association Statistical Computing, 2008.
[21] L. Breiman, J. H. Freidman, R. A. Olshen, and C. J. Stone, Classication and Regression Trees, Wadsorth,1984.
[22] O. Montagne, C. Chaix, A. Harf, A. Castaigne, and I. Durand-Zaleski, “Costs for acute myocardialinfarction in a tertiary care centre and nationwide in france,” PharmacoEconomics, vol. 17, no. 6, pp.603–609, 2000.
[23] D. A. Morrow, E. M. Antman, A. Charlesworth et al., “TIMI risk score for ST-elevation myocardialinfarction: a convenient, bedside, clinical score for risk assessment at presentation: an IntravenousnPA for Treatment of Infarcting Myocardium Early II trial substudy,” Circulation, vol. 102, no. 17, pp.2031–2037, 2000.
[24] G. Davey Smith and A. N. Phillips, “Confounding in epidemiological studies: why ’independent’effects may not be all they seem,” British Medical Journal, vol. 305, no. 6856, pp. 757–759, 1992.
[25] M. Egger, M. Schneider, and G. D. Smith, “Meta-analysis spurious precision? Meta-analysis ofobservational studies,” British Medical Journal, vol. 316, no. 7125, pp. 140–144, 1998.
[26] J. M. Oakes, “The (mis)estimation of neighborhood effects: causal inference for a practicable socialepidemiology,” Social Science and Medicine, vol. 58, no. 10, pp. 1929–1952, 2004.
[27] J. S. Kaufman, R. S. Cooper, and D. L. McGee, “Socioeconomic status and health in blacks and whites:the problem of residual confounding and the resiliency of race,” Epidemiology, vol. 8, no. 6, pp. 621–628, 1997.
[28] H.-H. Bock and E. Diday, Eds., Analysis of Symbolic Data: Exploratory Methods for Extracting StatisticalInformation from Complex Data, Studies in Classification, Data Analysis, and Knowledge Organization,Springer, Berlin, Germany, 2000.
[29] L. Billard and E. Diday, “From the statistics of data to the statistics of knowledge: symbolic dataanalysis,” Journal of the American Statistical Association, vol. 98, no. 462, pp. 470–487, 2003.
[30] L. Billard and E. Diday, Symbolic Data Analyses: Conceptual Statistics and Data Mining, Wiley Series inComputational Statistics, John Wiley & Sons, Chichester, UK, 2006.
[31] G. C. Fonarow, K. F. Adams, W. T. Abraham, C. W. Yancy, and W. J. Boscardin, “Risk stratificationfor in-hospital mortality in acutely decompensated heart failure: classification and regression treeanalysis,” Journal of the American Medical Association, vol. 293, no. 5, pp. 572–580, 2005.
[32] K. R. Hess, M. C. Abbruzzese, R. Lenzi, M. N. Raber, and J. L. Abbruzzese, “Classification andregression tree analysis of 1000 consecutive patients with unknown primary carcinoma,” ClinicalCancer Research, vol. 5, no. 11, pp. 3403–3410, 1999.
[33] L. Billard and E. Diday, “Regression analysis for interval-valued data,” in Data Analysis, Classification,and Related Methods, H. A. L. Kiers, J.-P. Rasson, P.J. F. Groenen, and M. Schader, Eds., Studies inClassification, Data Analysis, and Knowledge Organization, pp. 369–374, Springer, Berlin, Germany,2000.
[34] L. Billard and E. Diday, “Symbolic regression analysis,” in Classification, Clustering, and Data Analysis,K. Jajuga, A. Sokolowski, and H.-H. Bock, Eds., pp. 281–288, Springer, Berlin, Germany, 2002.
[35] F. Afonso, L. Billard, E. Diday, and M. Liman, “Symbolic linear regression methodology,” in SymbolicData Analysis and the SODAS Software, E. Diday and M. Noirhomme-Fraiture, Eds., pp. 359–372, John

Journal of Probability and Statistics 19
Wiley & Sons, Chichester, UK, 2008.[36] D. Seck, L. Billard, E. Diday, and F. Afonso, “A decision tree for interval-valued data with modal
dependent variable,” COMPSTAT, vol. 19, pp. 1621–1628, 2010.[37] M. Singh, G. S. Reeder, S. J. Jacobsen, S. Weston, J. Killian, and V. L. Roger, “Scores for post-myocardial
infarction risk stratification in the community,” Circulation, vol. 106, no. 18, pp. 2309–2314, 2002.