classification of emg signals using wavelet neural...
TRANSCRIPT

A
rdhnmstoW©
K
1
sdoaSttmkpvoaosf
0d
Journal of Neuroscience Methods 156 (2006) 360–367
Classification of EMG signals using wavelet neural network
Abdulhamit Subasi a,∗, Mustafa Yilmaz b, Hasan Riza Ozcalik a
a Kahramanmaras Sutcu Imam University, Department of Electrical and Electronics Engineering, 46500 Kahramanmaras, Turkeyb University of Gaziantep, Faculty of Medicine, Department of Neurology, 27310 Gaziantep, Turkey
Received 5 January 2006; received in revised form 9 February 2006; accepted 3 March 2006
bstract
An accurate and computationally efficient means of classifying electromyographic (EMG) signal patterns has been the subject of considerableesearch effort in recent years. Quantitative analysis of EMG signals provides an important source of information for the diagnosis of neuromuscularisorders. Following the recent development of computer-aided EMG equipment, different methodologies in the time domain and frequency domainave been followed for quantitative analysis. In this study, feedforward error backpropagation artificial neural networks (FEBANN) and waveleteural networks (WNN) based classifiers were developed and compared in relation to their accuracy in classification of EMG signals. In theseethods, we used an autoregressive (AR) model of EMG signals as an input to classification system. A total of 1200 MUPs obtained from 7 normal
ubjects, 7 subjects suffering from myopathy and 13 subjects suffering from neurogenic disease were analyzed. The success rate for the WNN
echnique was 90.7% and for the FEBANN technique 88%. The comparisons between the developed classifiers were primarily based on a numberf scalar performance measures pertaining to the classification. The WNN-based classifier outperformed the FEBANN counterpart. The proposedNN classification may support expert decisions and add weight to EMG differential diagnosis.2006 Elsevier B.V. All rights reserved.ssive m
tpcadMcfa
ccasOm
eywords: Electromyography (EMG); Motor unit potential (MUP); Autoregre
. Introduction
More than 100 neuromuscular disorders that influence thepinal cord, nerves or muscles are present. Early finding andiagnosis of these diseases by clinical examination and lab-ratory tests is crucial for their management as well as theirnticipation through prenatal diagnosis and genetic counselling.uch information is also valuable in research, which may lead
o the understanding of the nature and eventual treatment ofhese diseases (Christodoulou and Pattichis, 1999). Motor unit
orphology can be studied by recording its electrical activity,nown as electromyography (EMG). In clinical EMG motor unitotentials (MUPs) are recorded using a needle electrode at slightoluntary contraction. The MUP reflects the electrical activityf a single anatomical motor unit. It represents the compoundction potential of those muscle fibres within the recording range
f the electrode. Features of MUPs extracted in the time domainuch as duration, amplitude and phases proved to be very help-ul in differentiating between muscle and nerve diseases with∗ Corresponding author. Tel.: +90 344 219 12 53; fax: +90 344 219 10 52.E-mail address: [email protected] (A. Subasi).
sdpttcs
165-0270/$ – see front matter © 2006 Elsevier B.V. All rights reserved.oi:10.1016/j.jneumeth.2006.03.004
www.MatlabSite.c
ethod (AR); Wavelet neural networks (WNNs)
he duration measure being the key parameter used in clinicalractice (Pattichis and Pattichis, 1999). With increasing mus-le force, the EMG signal shows an increase in the number ofctivated MUPs recruited at increasing firing rates, making itifficult for the neurophysiologist to distinguish the individualUP waveforms. EMG signal decomposition and MUP classifi-
ation into groups of similar shapes give significant informationor the assessment of neuromuscular pathology (Christodoulound Pattichis, 1999).
Nevertheless, the measurement of the duration parameter is aomplicated task depending on the neurophysiologist and/or theomputer-aided method used. The description of an extensivelyccepted criterion that will allocate the computer-aided mea-urement of this parameter is still absent (Stalberg et al., 1986).n the other hand, frequency domain features of MUPs like theean or median frequency, bandwidth and quality factor give
upplementary information for the assessment of neuromuscularisorders and it has recently been shown that the discriminativeower of the MUP mean or median frequency is comparable to
he duration measure (Pattichis and Elia, 1999) or the spike dura-ion measure (Pfeiffer and Kunze, 1993). Recent advances inomputer technology have made automated EMG analysis fea-ible. Although a number of computer-based quantitative EMGom | متلب سایت
scien
ama(tMcdoa
satoapttni(twaatdbayp
twfintiadit1te(aatfwmofa
te
pssvwppt(arm
2
2
dDiwwf7r(aari2
tEcsltwttl(51t
2
A. Subasi et al. / Journal of Neuro
nalysis algorithms have been developed, some of them are com-ercially available, practically none of them have gained broad
cceptance for widespread routine clinical use. Pattichis and Elia1999) used autoregressive and cepstral analyses combined withime domain analysis in classification of EMG signals. Also De
ichele et al. (2003) described how the proper use of the waveletross-correlation analysis on surface signals of the above twoifferent muscles allows a more comprehensive classificationf subjects and, at the same time, a reliable temporal evolutionnalysis of Parkinson’s disease.
Pattichis et al. (1995) used MUP parameters as input to aequential parametric pattern recognition classifier. Loudon etl. (1992) used eight MUP features as input to a statistical pat-ern recognition technique for classification. The decompositionf superimposed waveforms used a combination of proceduralnd knowledge-based methods. Finally Hassoun et al. (1994a,b)roposed a system called neural network extraction of repeti-ive vectors for electromyography (NNERVE), and they usedhe time domain waveform as input to a three-layer artificialeural network (ANN) with a “pseudo unsupervised” learn-ng algorithm for classification. Christodoulou and Pattichis1999) used two different pattern recognition techniques forhe classification of MUPs. They used an artificial neural net-ork (ANN) technique based on unsupervised learning, usingmodified version of the self-organizing feature maps (SOFM)lgorithm and learning vector quantization (LVQ) and a sta-istical pattern recognition technique based on the Euclideanistance. In addition, Schizas and Pattichis (1997) used genetics-ased machine learning as pattern classifiers in EMG. Therere numerous limitations in the existing quantitative EMG anal-sis methods, which limit their wider applicability in clinicalractice.
The theory of wavelets can be exploited in understandinghe universal approximation properties of wavelet neural net-orks (WNNs), and in providing initialization heuristics for
ast training. WNNs offer a good compromise between robustmplementations resulting from the redundancy characteristic ofon-orthogonal wavelets and neural systems, and efficient func-ional representations that build on the time–frequency local-zation property of wavelets (Daubechies, 1992; Sureshbabund Farrell, 1999; Xu and Ho, 2002). Much research has beenone on applications of WNNs, which combine the capabil-ty of artificial neural networks in learning from processes andhe capability of wavelet decomposition (Zhang and Benveniste,992; Pati and Krishnaparasad, 1993), for identification and con-rol of dynamic systems (Sureshbabu and Farrell, 1999; Zhangt al., 1995; Wong and Leung, 1998). Zhang and Benveniste1992), proposed a new notation of wavelet network as anlternative to feedforward neural networks for approximatingny square-integrable non-linear functions based on the waveletransform theory, and a backpropagation algorithm is adoptedor wavelet network training. Zhang et al. (1995) described aavelet-based neural network for function learning and esti-
ation, and the structure of this network is similar to thatf the radial basis function network except that the radialunctions are replaced by orthonormal scaling functions. Inddition, Zhang (1997) presented wavelet network construc-
tr(
www.MatlabSite.com
ce Methods 156 (2006) 360–367 361
ion algorithms for the purpose of non-parametric regressionstimation.
This paper presents a comprehensive investigation of theracticality of using an AR model and WNN to extract clas-ifiable features from EMG. Here, AR power spectral den-ity (PSD) was used to define EMG signal representations. Aariety of features based on this model were classified withavelet neural network. The system is intended to decom-ose EMG signals at low to moderate force levels. The pro-osed techniques were successfully applied in the classifica-ion and decomposition of EMG signals recorded from normalNOR) subjects and subjects suffering from myopathy (MYO)nd neurogenic (NEU) disorder. By using AR PSD and WNNesulted in the best classification percentages than FEBANNethod.
. Materials and method
.1. Subjects and data acquisition
All the measurements from patients and control group wereone in Neurology Department of University of Gaziantep.iagnostic criteria for the subjects selected were based on clin-
cal findings; on the other hand, if it is required, muscle biopsyas performed. Normal, myopathic and neurogenic subjectsere evaluated by expert doctors. All the EMG data, collected
rom 27 subjects have been analyzed. Data were recorded fromhealthy subjects (three males and four females) with ages
anging from 10 to 43 years (mean age ± standard deviationS.D.): 30.2 ± 10.8 years), 7 myopathic subjects (four malesnd three females) with ages ranging from 7 to 46 years (meange ± standard deviation (S.D.): 21.5 ± 13.3 years) and 13 neu-ogenic subjects (eight males, five females) with ages rang-ng from 7 to 55 years (mean age ± standard deviation (S.D.):5.1 ± 17.2 years).
An EMG system (Keypoint; Medtronic Functional Diagnos-ics, Skovlunde, Denmark) with standard settings was used. TheMG signal was acquired from the biceps brachii muscle using aoncentric needle electrode (0.45 mm diameter with a recordingurface area 0.07 mm2; impedance at 20 Hz below 200 k). Ateast 20 different MUPs were obtained from each muscle via fiveo seven muscle insertion. Between two sites, the needles wereithdrawn for at least 5 mm. The position of the needle near
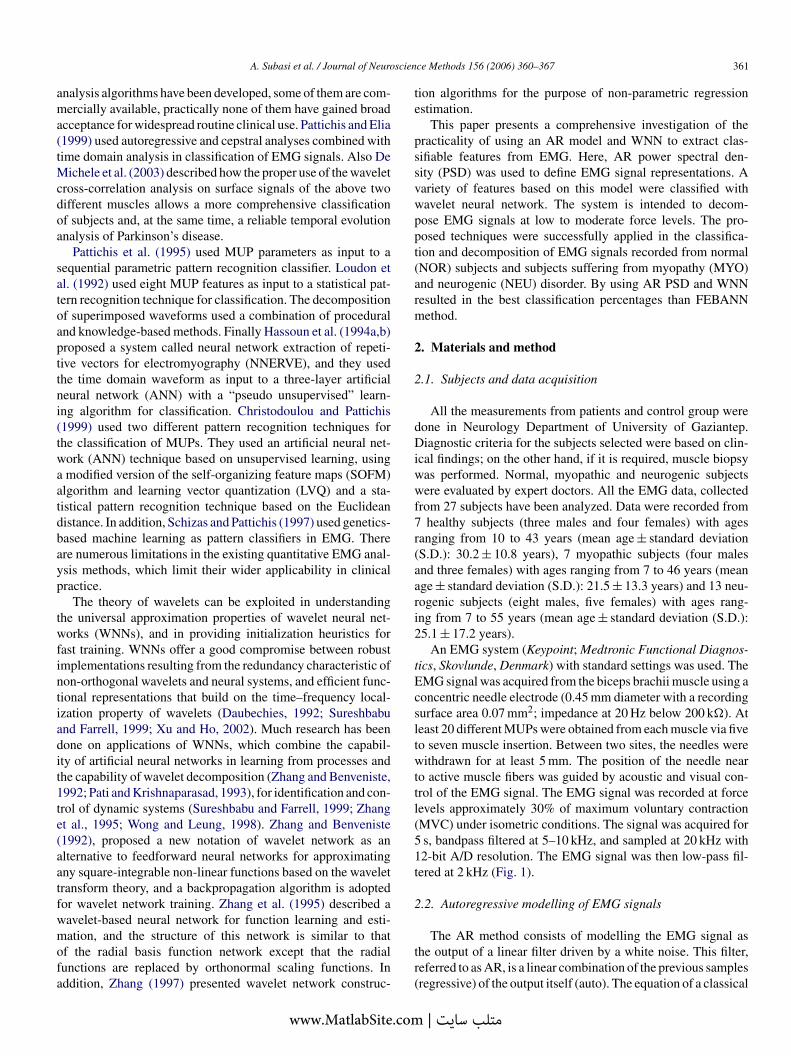
o active muscle fibers was guided by acoustic and visual con-rol of the EMG signal. The EMG signal was recorded at forceevels approximately 30% of maximum voluntary contractionMVC) under isometric conditions. The signal was acquired fors, bandpass filtered at 5–10 kHz, and sampled at 20 kHz with2-bit A/D resolution. The EMG signal was then low-pass fil-ered at 2 kHz (Fig. 1).
.2. Autoregressive modelling of EMG signals
The AR method consists of modelling the EMG signal ashe output of a linear filter driven by a white noise. This filter,eferred to as AR, is a linear combination of the previous samplesregressive) of the output itself (auto). The equation of a classical
متلب سایت |

362 A. Subasi et al. / Journal of Neuroscience Methods 156 (2006) 360–367
A
x
wemAnstpsifciGpoPAmwdetstyav
m(
mbta
P
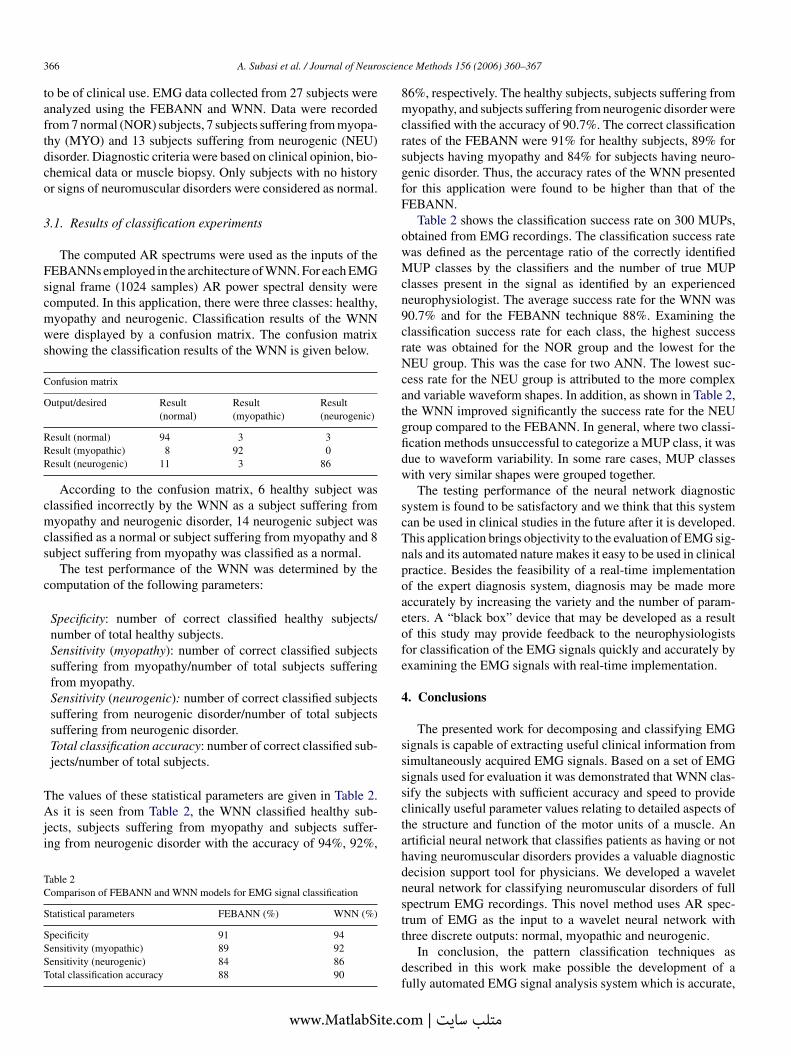
wEpAaAR Burg spectrum of myopatic EMG signal and Fig. 4 showsan AR Burg spectrum of neurogenic EMG signal.
Fig. 1. Normal, myopathic and neurogenic EMG signals.
R complex process, in a non-stationary context, is given by:
(n) = −p∑i=1
aix(n− i) + e(n) (1)
here ai(n) are AR complex parameters, p the AR model order,(n) is a white complex noise and n is the sample time. Theain steps involved in the spectrum estimation procedure usingR modelling are as follows: (a) optimal model order determi-ation; (b) AR parameters estimation; (c) estimating the powerpectral density using the above parameters. Determination ofhe optimal AR model order is an important part of the wholerocedure since too low a model order tends to smooth the actualpectrum and too high order tends to introduce spurious peaksn the power spectrum. One of the commonly used methodsor determining model order is called the Akaike informationriterion (AIC) (Akaike, 1974). It is based on minimizing annformation theoretic criterion (Proakis and Manolakis, 1996;uler and Ubeyli, 2003; Subasi et al., 2006). One of the mostopular methods for estimating the AR parameters of a sequencef N data points is using Burg’s algorithm (Tseng et al., 1995;roakis and Manolakis, 1996; Pardey et al., 1996). In this, theR parameters are estimated using a constrained least squaresinimization procedure. This is a statistically accurate modelhen the amplitudes of the signal have a zero mean Gaussianistribution. However, it can be used to a good approximationven when the signals have a different distribution. It assumeshat the data sequence is stationary i.e. the first and second ordertatistics of the sequence x(n) do not change with time. The spec-
rum estimation method based on autoregressive (AR) modellingields better resolution without the problem of spectral ‘leak-ge’ (Muthuswamy and Thakor, 1998; Guler et al., 2001). Aery good tutorial on the theoretical foundations of the differentwww.MatlabSite.c
Fig. 2. AR Burg spectrum of normal EMG signal.
ethods of spectrum estimation can be found in Kay and Marple1981).
The estimation problem of these parameters covers the for-ation and resolution of the set of equations, which can easily
e calculated. AR spectral estimation of data’s estimation fromhe order p was given with the following equation (Isaksson etl., 1981).
(f ) = σp2t∣∣1 + ∑pi=1api e−j2πfit∣∣2 (2)
here ap0 = 1. Thus, for estimation of spectral power density ofMG signal only existence of p number api parameters, and σ2
p
arameters, which are the variances of white noise, are sufficientR coefficients, which identify the amplitude rates. Fig. 2 shows
n AR Burg spectrum of normal EMG signal, Fig. 3 shows an
Fig. 3. AR Burg spectrum of myopathic EMG signal.
om | متلب سایت

A. Subasi et al. / Journal of Neuroscien
2
uknmofwcAapit1
dSupTwoOeEt
2
wdtoi
atscdiwfceNs
ifTspossarr
t
ψ
wrg
Ω
Acf
c
wpa
dus
Ψjk
Fig. 4. AR Burg spectrum of neurogenic EMG signal.
.3. Classification using artificial neural networks
Artificial neural networks (ANNs) are formed of cells sim-lating the low-level functions of biological neurons. In ANN,nowledge about the problem is distributed in neurons and con-ections weights of links between neurons. The neural networkust be trained to adjust the connection weights and biases in
rder to produce the desired mapping. At the training stage, theeature vectors are applied as input to the network and the net-ork adjusts its variable parameters, the weights and biases, to
apture the relationship between the input patterns and outputs.NNs are particularly useful for complex pattern recognition
nd classification tasks. The capability of learning from exam-les, the ability to reproduce arbitrary non-linear functions ofnput, and the highly parallel and regular structure of ANN makehem especially suitable for pattern classification tasks (Fausett,994; Haykin, 1994; Basheer and Hajmeer, 2000).
ANNs are widely used in the biomedical field for modelling,ata analysis and diagnostic classification (Alkan et al., 2005;ubasi, 2005; Subasi and Ercelebi, 2005). The most frequentlysed training algorithm in classification problems is the back-ropagation (BP) algorithm, which is used in this work also.here are many different types and architectures of neural net-orks varying fundamentally in the way they learn; the detailsf which are well documented in the literature (Dreiseitl andhno-Machado, 2002). In this paper, two neural networks rel-
vant to the application being considered, i.e., classification ofMG data will be employed for designing classifiers; namely
he FEBANN and WNN.
.3.1. Wavelet neural networksWavelet neural networks (WNN) is a new network based on
avelet transform (Pati and Krishnaparasad, 1993), in which
iscrete wavelet function is used as the node activation func-ion. Because the wavelet space is used as characteristic spacef pattern recognition, the characteristic extraction of signals realized by weighted sum of inner product of wavelet basewti
www.MatlabSite.com
ce Methods 156 (2006) 360–367 363
nd signal vector. Furthermore, because it combines the func-ion of time–frequency localization by wavelet transform andelf-studying by neural network, the network possesses doughtyapacity of approximate and robust. In this paper, a WNN wasesigned with mono-hidden-layer forward neural network withts node activation function based on dyadic discrete Morletavelet basic function (Subasi et al., 2005). The Morlet trans-
orm was able to unambiguously locate three classes. Signifi-antly, we were able to limit the set of interrogated scales toxclude those that correspond to structural features of the EMG.ote that the pattern of background noise in the Morlet was
imilar across all EMG signals.Wavelet transforms have emerged as a means of represent-
ng a function in a manner that readily reveals properties of theunction in localized regions of the joint time–frequency space.he applications of WNN are usually limited to problems ofmall input dimension. The main reason is that they are com-osed of regularly dilated and translated wavelets. The numberf wavelets in the WNNs drastically increases with the dimen-ion (Zhang, 1997). Some work has been done on reducing theize of the WNN by removing the redundant candidates (Wongnd Leung, 1998; Xu and Ho, 2002). Galvao et al. (2004) workedecently on the use of wavelet neural networks as a non-linearegression structure using high dimensional data.
A wavelet ψj(x) is derived from its mother wavelet ψ(z) byhe relation
j(x) = ψ
(x− mj
dj
)= ψ(zj) (3)
here the translation factor mj and the dilation factor dj areeal numbers in and *, respectively. The family of functionsenerated by ψ can be described
c =
1√djψ
(x− mj
dj
), mj ∈ and dj ∈ ∗
(4)
family Ωc is said to be a frame of L2() if there exists twoonstants c > 0 and c < +∞ such that for any square integrableunction f, the following inequalities hold:
||f ||2 ≤∑j
ψj ∈Ωc
|〈ψj, f 〉|2 ≤ C||f ||2 (5)
here ||f|| denotes the norm of function f and 〈f, g〉 the innerroduct of functions f and g. Families of wavelet frames of L2()re universal approximators.
For the modelling of multivariable processes, multi-imensional wavelets must be defined. In the present work, wese multidimensional wavelets constructed as the product of Ni
calar wavelets (Ni being the number of variables)
j(x) =Ni∏ψ(zjk) with zjk = x− mjk
d, (6)
k=1
here mj and dj are the translation and dilation vectors, respec-ively. Families of multidimensional wavelets generated accord-ng to this scheme have been shown to be frames of L2(Ni )
متلب سایت |

3 science Methods 156 (2006) 360–367
(fo
y
Ipan
l
J
wtwito
o
Ω
wtb
Twgafuatb
2
prjpsafithm
nd
ψ
WotniaTpS
2
eoana(
t2ft
ctTcIn order to make the neural network training more efficient, the
64 A. Subasi et al. / Journal of Neuro
Oussar et al., 1998). Wavelet networks were presented in theramework of static modelling architecture, where the networkutput y is computed as
= y(x) =Nw∑j=1
cjΨj(x) +Nj∑k=0
bkxk. (7)
t can be viewed as a network with an input vector of Ni com-onents, a layer of Nw weighted multidimensional wavelets andlinear output neuron. The coefficients of the linear part of theetworks would be called direct connections.
Wavelet network training consists in minimizing the usualeast-squares cost function
(θ) = 1
2
N∑n=1
(ynp − yn)2, (8)
here vector θ includes all network parameters to be estimated:ranslations, dilations, weights of the connections betweenavelets and output and weights of the direct connections; N
s the number of elements of the training set, ynp is the output ofhe process for example n and yn is the corresponding networkutput.
In the framework of the discrete wavelet transform, a familyf wavelets can be defined as
d = αm/2ψ(αmx− nβ), (m, n) ∈Z2, (9)
here α and β are constants that fully determine, together withhe mother wavelet ψ, the family Ωd. Actually, relation (9) cane considered as a special case of relation (4), where
mj = nα−mβdj = α−m , (10)
hese relations show that, unlike the continuous approach,avelet parameters cannot be varied continuously; therefore,radient-based techniques cannot be used to adjust them. Gener-lly, training wavelet networks stemming from the discrete trans-orm (Zhang and Benveniste, 1992; Zhang, 1997) is performedsing the Gram–Schmidt selection method. This approach usu-lly generates large networks, which are less parsimonious thanhose trained by gradient-based techniques. This may be a draw-ack for many applications (Oussar et al., 1998).
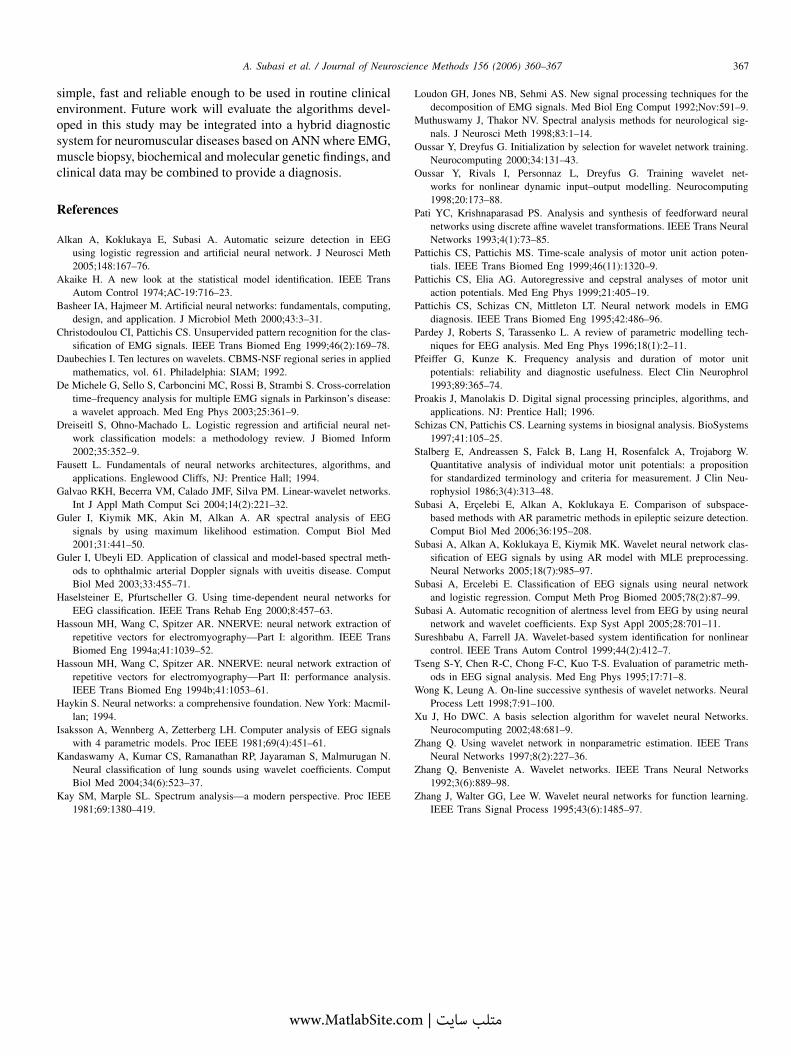
.3.2. Wavelet neural network classifierWavelets offer many attractive features for the analysis of
hysical signals, including universal approximation properties,obustness against coefficient errors (Daubechies, 1992), andoint input-space/frequency localization. Since EMG signalsossess a combination of slow variations over long periods, withharp, transient variations over short periods, WNNs seem to bemore natural choice than other mainstream neural networks
or EMG analysis. A multidimensional wavelet Ψ (zjk) can be
nduced from a scalar wavelet Ψ (z) via an affine vector–matrixransformation of the input x (Zhang and Benveniste, 1992). Weave introduced a variation to this idea for obtaining multidi-ensional wavelets that are radially symmetric with respect toirho
www.MatlabSite.c
Fig. 5. A wavelet neural network model.
-dimensional translation vectors k, by dilating the Euclideanistance between input and translation vectors:
(zjk) =√jnψ(j||x− k||), j ≤ 0 (11)
e are interested in the non-linearities introduced by the WNNnly to the extent that they can improve a function approxima-ion. Therefore, the WNN is equipped with a linear discrimi-ant portion that can quickly account for a linear trend in thenput/output data. The wavelet nodes are specifically trained topproximate only the “wave-like” components in the function.he resulting WNN classifier is shown in Fig. 5. For a detailedresentation of this method see Oussar and Dreyfus (2000) andubasi et al. (2005).
.3.3. Selection of network parametersFor solving the pattern classification problem, we used ANN
mploying back-propagation training algorithm. The advantagesf this type of neural network are effective training algorithmnd better understanding of the system behaviour. Selection ofetwork input parameters and performance of neural networkre important to distinguish between normal (NOR), myopathicMYO) and neurogenic (NEU) subjects.
When using a neural network, decisions must be taken on howo divide data into a training set and a test set. In this study, 18 of7 subjects were used for training and the rest of them were usedor testing. In order to obtain a better network generalization fiveraining subjects were used as cross-validation set.
The classification scheme of 1-of-C coding has been used forlassifying the signal into one of the output categories. For eachype of EMG signals, a corresponding output class is associated.he feature vector set, x represents the ANN inputs, and theorresponding class, once coded, constitutes the ANN outputs.
nput feature vectors were normalized so that they fall in theange [0,1.0]. Since the number of output classes is 3, the ANNas three outputs, which produce a code for each class. Theutputs are represented by basis vectors:
om | متلب سایت

science Methods 156 (2006) 360–367 365
c0pdavs
2
Hiwtotortcftt
2
wtastmso2sn
2
baoefwmt
nn
Table 1Class distribution of the samples in the training and test data sets
Class Training set Test set Total
Normal 300 100 400Myopathic 300 100 400N
T
Tontthi(odbtmiosvwTovtfu
lbrtmowtoh
3
Mtnba
A. Subasi et al. / Journal of Neuro
[0.9 0.1 0.1] = normal (NOR);[0.1 0.9 0.1] = myopathy (MYO);[0.1 0.1 0.9] = neurogenic (NEU).
Each dummy variable is given the value 0.1 except for the oneorresponding to the correct category, which is given the value.9. Using target values of 0.1 and 0.9 instead of the commonractice of 0 and 1 prevents the outputs of the network from beingirectly interpretable as posterior probabilities (Kandaswamy etl., 2004). The output vector associated to the modified inputector xk, k = 1, 2,. . ., K is noted yk, with K the number of EMGignals (Subasi, 2005).
.3.4. Cross validationCross validation (CV) (Basheer and Hajmeer, 2000;
aselsteiner and Pfurtscheller, 2000) is often used for compar-ng two or more learning ANN models to estimate which modelill perform the best for the problem at hand. With n-fold CV,
he available data is partitioned into n disjoint subsets, the unionf which is equal to the original set. Each learning model israined on n − 1 of the available subsets, and then tested on thene subset, which was not used during training. This process isepeated n times, each time using a different test set chosen fromhe n available partitions of the training data, until all possiblehoices for the test set have been exhausted. The n test set scoresor each learning model are then averaged, and the model withhe highest average test set score is chosen as the one most likelyo perform well on unseen data (Sureshbabu and Farrell, 1999).
.3.5. Measuring errorGiven a random set of initial weights, the outputs of the net-
ork will be very different from the desired classifications. Ashe network is trained, the weights of the system are continu-lly adjusted to reduce the difference between the output of theystem and the desired response. The difference is referred to ashe error and can be measured in several ways. The most com-
on measurement is SSE and MSE. SSE is the average of thequares of the difference between each output and the desiredutput (Fausett, 1994; Haykin, 1994; Basheer and Hajmeer,000; Haselsteiner and Pfurtscheller, 2000). In this study, meanquared error (MSE) was used for measuring performance of theeural network.
.4. Development of ANN model
The purpose of the modelling phase in this application was touild up classifiers that are able to identify any input combinations belonging to either one of the three classes: normal, myopathicr neurogenic. For developing the neural network classifiers, 600xamples were randomly taken from the 900 examples and usedor training the neural networks. The remaining 300 examplesere kept aside and used for testing the validity of the developedodels. The class distribution of the samples in the training and
esting data set is summarized in Table 1.The FEBANN was designed with AR spectrum of EMG sig-
al in the input layer; and the output layer consisted of threeodes representing normal, myopathic or neurogenic disorder.
Maaf
www.MatlabSite.com
eurogenic 300 100 400
otal 900 300 1200
he beginning architecture of the network was examined usingne and two hidden layers with a variable number of hiddenodes in each. It was found that one hidden layer is adequate forhe problem at hand. Hence, the required network will containhree layers of nodes. The training procedure started with oneidden node in the hidden layer, followed by training on the train-ng data (600 data sets), and then by testing on the validation data300 data sets) to examine the network’s prediction performancen cases never used in its development. Then, the same proce-ure was run repetitively each time the network was expandedy adding one more node to the hidden layer, until the best archi-ecture and set of connection weights were obtained. Using theodified error–backpropagation algorithm for training, a train-
ng rate of 0.001 and momentum coefficient of 0.95 was foundptimum for training the network with various topologies. Theelection of the optimal network was based on monitoring theariation of error and some accuracy parameters as the networkas expanded in the hidden layer size and for each training cycle.he mean of squares of error representing the mean of squaref deviations of ANN solution (output) from the true (target)alues for both the training and test sets was used for selectinghe optimal network. A computer program that we have writtenor the training algorithm based on backpropagation of error wassed to develop the FEBANNs.
According to the theory, the number of nodes in the hiddenayer of the network is equal to that of wavelet base. If the num-er is too small, WNN may not reflect the complex functionelationship between input data and output value. On the con-rary, a large number may create such a complex network that
ight lead to a very large output error caused by over-fittingf the training sample. It was noticed that the best performanceas obtained for the training set, validation test set, and separate
est set with those models whose hidden layer had 50 neuronsr more. Thus the optimum number of neurons required in theidden layer is 50.
. Results and discussion
The decomposition of real EMG signals into their constituentUPs and their classification into groups of similar shapes is a
ypical supervised learning pattern classification problem. Theumber of MUP classes composing the EMG signal, the num-er of MUPs per class, and the shape of the MUP waveformsre unknown. The problem gets even more complex because of
UP waveform inconsistency, jitter of single fiber potentialsnd MUP superpositions. Any computerized method for EMGnalysis should necessitate no operator involvement; should beast, robust and reliable; and achieve high success rate in order
متلب سایت |
3 scien
taftdco
3
Fscmws
C
O
RRR
cmcs
c
TAji
TC
S
SSST
8mcrsgfF
owMcn9crNcatgfidw
scTnpoaeofe
4
sss
66 A. Subasi et al. / Journal of Neuro
o be of clinical use. EMG data collected from 27 subjects werenalyzed using the FEBANN and WNN. Data were recordedrom 7 normal (NOR) subjects, 7 subjects suffering from myopa-hy (MYO) and 13 subjects suffering from neurogenic (NEU)isorder. Diagnostic criteria were based on clinical opinion, bio-hemical data or muscle biopsy. Only subjects with no historyr signs of neuromuscular disorders were considered as normal.
.1. Results of classification experiments
The computed AR spectrums were used as the inputs of theEBANNs employed in the architecture of WNN. For each EMGignal frame (1024 samples) AR power spectral density wereomputed. In this application, there were three classes: healthy,yopathy and neurogenic. Classification results of the WNNere displayed by a confusion matrix. The confusion matrix
howing the classification results of the WNN is given below.
onfusion matrix
utput/desired Result(normal)
Result(myopathic)
Result(neurogenic)
esult (normal) 94 3 3esult (myopathic) 8 92 0esult (neurogenic) 11 3 86
According to the confusion matrix, 6 healthy subject waslassified incorrectly by the WNN as a subject suffering fromyopathy and neurogenic disorder, 14 neurogenic subject was
lassified as a normal or subject suffering from myopathy and 8ubject suffering from myopathy was classified as a normal.
The test performance of the WNN was determined by theomputation of the following parameters:
Specificity: number of correct classified healthy subjects/number of total healthy subjects.Sensitivity (myopathy): number of correct classified subjectssuffering from myopathy/number of total subjects sufferingfrom myopathy.Sensitivity (neurogenic): number of correct classified subjectssuffering from neurogenic disorder/number of total subjectssuffering from neurogenic disorder.Total classification accuracy: number of correct classified sub-jects/number of total subjects.
he values of these statistical parameters are given in Table 2.s it is seen from Table 2, the WNN classified healthy sub-
ects, subjects suffering from myopathy and subjects suffer-ng from neurogenic disorder with the accuracy of 94%, 92%,
able 2omparison of FEBANN and WNN models for EMG signal classification
tatistical parameters FEBANN (%) WNN (%)
pecificity 91 94ensitivity (myopathic) 89 92ensitivity (neurogenic) 84 86otal classification accuracy 88 90
sctahdnstt
df
www.MatlabSite.c
ce Methods 156 (2006) 360–367
6%, respectively. The healthy subjects, subjects suffering fromyopathy, and subjects suffering from neurogenic disorder were
lassified with the accuracy of 90.7%. The correct classificationates of the FEBANN were 91% for healthy subjects, 89% forubjects having myopathy and 84% for subjects having neuro-enic disorder. Thus, the accuracy rates of the WNN presentedor this application were found to be higher than that of theEBANN.
Table 2 shows the classification success rate on 300 MUPs,btained from EMG recordings. The classification success rateas defined as the percentage ratio of the correctly identifiedUP classes by the classifiers and the number of true MUP
lasses present in the signal as identified by an experiencedeurophysiologist. The average success rate for the WNN was0.7% and for the FEBANN technique 88%. Examining thelassification success rate for each class, the highest successate was obtained for the NOR group and the lowest for theEU group. This was the case for two ANN. The lowest suc-
ess rate for the NEU group is attributed to the more complexnd variable waveform shapes. In addition, as shown in Table 2,he WNN improved significantly the success rate for the NEUroup compared to the FEBANN. In general, where two classi-cation methods unsuccessful to categorize a MUP class, it wasue to waveform variability. In some rare cases, MUP classesith very similar shapes were grouped together.The testing performance of the neural network diagnostic
ystem is found to be satisfactory and we think that this systeman be used in clinical studies in the future after it is developed.his application brings objectivity to the evaluation of EMG sig-als and its automated nature makes it easy to be used in clinicalractice. Besides the feasibility of a real-time implementationf the expert diagnosis system, diagnosis may be made moreccurately by increasing the variety and the number of param-ters. A “black box” device that may be developed as a resultf this study may provide feedback to the neurophysiologistsor classification of the EMG signals quickly and accurately byxamining the EMG signals with real-time implementation.
. Conclusions
The presented work for decomposing and classifying EMGignals is capable of extracting useful clinical information fromimultaneously acquired EMG signals. Based on a set of EMGignals used for evaluation it was demonstrated that WNN clas-ify the subjects with sufficient accuracy and speed to providelinically useful parameter values relating to detailed aspects ofhe structure and function of the motor units of a muscle. Anrtificial neural network that classifies patients as having or notaving neuromuscular disorders provides a valuable diagnosticecision support tool for physicians. We developed a waveleteural network for classifying neuromuscular disorders of fullpectrum EMG recordings. This novel method uses AR spec-rum of EMG as the input to a wavelet neural network with
hree discrete outputs: normal, myopathic and neurogenic.In conclusion, the pattern classification techniques asescribed in this work make possible the development of aully automated EMG signal analysis system which is accurate,
om | متلب سایت
oscien
seosmc
R
A
A
B
C
D
D
D
F
G
G
G
H
H
H
H
I
K
K
L
M
O
O
P
P
P
P
P
P
P
S
S
S
S
S
S
S
T
W
X
Z
A. Subasi et al. / Journal of Neur
imple, fast and reliable enough to be used in routine clinicalnvironment. Future work will evaluate the algorithms devel-ped in this study may be integrated into a hybrid diagnosticystem for neuromuscular diseases based on ANN where EMG,uscle biopsy, biochemical and molecular genetic findings, and
linical data may be combined to provide a diagnosis.
eferences
lkan A, Koklukaya E, Subasi A. Automatic seizure detection in EEGusing logistic regression and artificial neural network. J Neurosci Meth2005;148:167–76.
kaike H. A new look at the statistical model identification. IEEE TransAutom Control 1974;AC-19:716–23.
asheer IA, Hajmeer M. Artificial neural networks: fundamentals, computing,design, and application. J Microbiol Meth 2000;43:3–31.
hristodoulou CI, Pattichis CS. Unsupervided pattern recognition for the clas-sification of EMG signals. IEEE Trans Biomed Eng 1999;46(2):169–78.
aubechies I. Ten lectures on wavelets. CBMS-NSF regional series in appliedmathematics, vol. 61. Philadelphia: SIAM; 1992.
e Michele G, Sello S, Carboncini MC, Rossi B, Strambi S. Cross-correlationtime–frequency analysis for multiple EMG signals in Parkinson’s disease:a wavelet approach. Med Eng Phys 2003;25:361–9.
reiseitl S, Ohno-Machado L. Logistic regression and artificial neural net-work classification models: a methodology review. J Biomed Inform2002;35:352–9.
ausett L. Fundamentals of neural networks architectures, algorithms, andapplications. Englewood Cliffs, NJ: Prentice Hall; 1994.
alvao RKH, Becerra VM, Calado JMF, Silva PM. Linear-wavelet networks.Int J Appl Math Comput Sci 2004;14(2):221–32.
uler I, Kiymik MK, Akin M, Alkan A. AR spectral analysis of EEGsignals by using maximum likelihood estimation. Comput Biol Med2001;31:441–50.
uler I, Ubeyli ED. Application of classical and model-based spectral meth-ods to ophthalmic arterial Doppler signals with uveitis disease. ComputBiol Med 2003;33:455–71.
aselsteiner E, Pfurtscheller G. Using time-dependent neural networks forEEG classification. IEEE Trans Rehab Eng 2000;8:457–63.
assoun MH, Wang C, Spitzer AR. NNERVE: neural network extraction ofrepetitive vectors for electromyography—Part I: algorithm. IEEE TransBiomed Eng 1994a;41:1039–52.
assoun MH, Wang C, Spitzer AR. NNERVE: neural network extraction ofrepetitive vectors for electromyography—Part II: performance analysis.IEEE Trans Biomed Eng 1994b;41:1053–61.
aykin S. Neural networks: a comprehensive foundation. New York: Macmil-lan; 1994.
saksson A, Wennberg A, Zetterberg LH. Computer analysis of EEG signalswith 4 parametric models. Proc IEEE 1981;69(4):451–61.
andaswamy A, Kumar CS, Ramanathan RP, Jayaraman S, Malmurugan N.Neural classification of lung sounds using wavelet coefficients. ComputBiol Med 2004;34(6):523–37.
ay SM, Marple SL. Spectrum analysis—a modern perspective. Proc IEEE1981;69:1380–419.
Z
Z
www.MatlabSite.com
ce Methods 156 (2006) 360–367 367
oudon GH, Jones NB, Sehmi AS. New signal processing techniques for thedecomposition of EMG signals. Med Biol Eng Comput 1992;Nov:591–9.
uthuswamy J, Thakor NV. Spectral analysis methods for neurological sig-nals. J Neurosci Meth 1998;83:1–14.
ussar Y, Dreyfus G. Initialization by selection for wavelet network training.Neurocomputing 2000;34:131–43.
ussar Y, Rivals I, Personnaz L, Dreyfus G. Training wavelet net-works for nonlinear dynamic input–output modelling. Neurocomputing1998;20:173–88.
ati YC, Krishnaparasad PS. Analysis and synthesis of feedforward neuralnetworks using discrete affine wavelet transformations. IEEE Trans NeuralNetworks 1993;4(1):73–85.
attichis CS, Pattichis MS. Time-scale analysis of motor unit action poten-tials. IEEE Trans Biomed Eng 1999;46(11):1320–9.
attichis CS, Elia AG. Autoregressive and cepstral analyses of motor unitaction potentials. Med Eng Phys 1999;21:405–19.
attichis CS, Schizas CN, Mittleton LT. Neural network models in EMGdiagnosis. IEEE Trans Biomed Eng 1995;42:486–96.
ardey J, Roberts S, Tarassenko L. A review of parametric modelling tech-niques for EEG analysis. Med Eng Phys 1996;18(1):2–11.
feiffer G, Kunze K. Frequency analysis and duration of motor unitpotentials: reliability and diagnostic usefulness. Elect Clin Neurophrol1993;89:365–74.
roakis J, Manolakis D. Digital signal processing principles, algorithms, andapplications. NJ: Prentice Hall; 1996.
chizas CN, Pattichis CS. Learning systems in biosignal analysis. BioSystems1997;41:105–25.
talberg E, Andreassen S, Falck B, Lang H, Rosenfalck A, Trojaborg W.Quantitative analysis of individual motor unit potentials: a propositionfor standardized terminology and criteria for measurement. J Clin Neu-rophysiol 1986;3(4):313–48.
ubasi A, Ercelebi E, Alkan A, Koklukaya E. Comparison of subspace-based methods with AR parametric methods in epileptic seizure detection.Comput Biol Med 2006;36:195–208.
ubasi A, Alkan A, Koklukaya E, Kiymik MK. Wavelet neural network clas-sification of EEG signals by using AR model with MLE preprocessing.Neural Networks 2005;18(7):985–97.
ubasi A, Ercelebi E. Classification of EEG signals using neural networkand logistic regression. Comput Meth Prog Biomed 2005;78(2):87–99.
ubasi A. Automatic recognition of alertness level from EEG by using neuralnetwork and wavelet coefficients. Exp Syst Appl 2005;28:701–11.
ureshbabu A, Farrell JA. Wavelet-based system identification for nonlinearcontrol. IEEE Trans Autom Control 1999;44(2):412–7.
seng S-Y, Chen R-C, Chong F-C, Kuo T-S. Evaluation of parametric meth-ods in EEG signal analysis. Med Eng Phys 1995;17:71–8.
ong K, Leung A. On-line successive synthesis of wavelet networks. NeuralProcess Lett 1998;7:91–100.
u J, Ho DWC. A basis selection algorithm for wavelet neural Networks.Neurocomputing 2002;48:681–9.
hang Q. Using wavelet network in nonparametric estimation. IEEE Trans
Neural Networks 1997;8(2):227–36.hang Q, Benveniste A. Wavelet networks. IEEE Trans Neural Networks1992;3(6):889–98.
hang J, Walter GG, Lee W. Wavelet neural networks for function learning.IEEE Trans Signal Process 1995;43(6):1485–97.
متلب سایت |

شبکه های عصبیمعرفی چند منبع در زمینه
جلد محاسباتی، هوش) عصبی های شبکه مبانی :عنوان
(اول
منهاج باقر محمد دکتر :مولف
امیرکبیر صنعتی دانشگاه :انتشارات
لینک :دسترسی لینک
عصبی های شبکه مبانی :عنوان
فاست لوران :مولف
باقری سعید و مفاخری کبری ویسی، هادی :مترجمین
شکری
نص :انتشارات
لینک :دسترسی لینک
عصبی های شبکه طراحی :عنوان
بیل مارک و دیموث. بی هاوارد هاگان،. تی مارتین :مولفین
کیا مصطفی سید :مترجم
سبز رایانه کیان :انتشارات
لینک :دسترسی لینک
عصبی های شبکه با آشنایی :عنوان
جکسون.تی و بیل.آر :مولفین
البرزی محمود :مترجم
شریف صنعتی دانشگاه :انتشارات
لینک :دسترسی لینک
مصنوعی عصبی های شبکه :عنوان
شالکوف رابرت :مولف
زارع طناز و استوار امید جورابیان، محمود: مترجمین
اهواز چمران شهید دانشگاه :انتشارات
لینک :دسترسی لینک
به زبان فارسیکتاب های به زبان انگلیسیکتاب های
Neural Networks and Learning Machines :عنوان
یادگیر های ماشین و عصبی های شبکه :عنوان ترجمه
: Simon S. Haykin مولف
۲۰۰۹ :چاپ سال
Prentice Hall : انتشارات
لینک :دسترسی لینک
Neural Networks and Statistical Learning :عنوان
آماری یادگیری و عصبی های شبکه :عنوان ترجمه
: Ke-Lin Du, M. N. S. Swamy مولفین
۲۰۱۳ :چاپ سال
: Springer Science & Business Media انتشارات
لینک :دسترسی لینک
Machine Learning: A Probabilisticعنوان:
Perspective
یادگیری ماشین از دیدگاه احتماالتی ترجمه عنوان:
: Kevin P. Murphy مولف
۲۰۱۲ سال چاپ:
: MIT Pressانتشارات
لینک: لینک دسترسی
Machine Learning: The Art and Science of:عنوان
Algorithms that Make Sense of Data داده که هایی الگوریتم هنر و علم: ماشین یادگیری :عنوان ترجمه
کنند می ملموس را ها
: Peter Flach مولف
۲۰۱۲ :چاپ سال
: Cambridge University Press انتشارات
لینک :دسترسی لینک
: Pattern Recognition and Machine Learning عنوان
ماشین یادگیری و الگو بازشناسی :عنوان ترجمه
: Christopher M. Bishopمولف
۲۰۰۶ :چاپ سال
: Springer انتشارات
لینک :دسترسی لینک

منابع آموزشی آنالین
متلب در مصنوعی عصبی های شبکه های فرادرس مجموعه :عنوان
هریس کالمی سیدمصطفی دکتر :مدرس
ساعت ۲۲ :زمان مدت
فارسی :زبان
فرادرس :دهنده ارائه
لینک :دسترسی لینک
مصنوعی عصبی های شبکه کاربردی های فرادرس مجموعه :عنوان
گرگری آتشپز اسماعیل دکتر :مدرس
ساعت ۸ :زمان مدت
فارسی :زبان
فرادرس :دهنده ارائه
لینک :دسترسی لینک
Machine Learning ن: عنوا
ماشین یادگیری :عنوان ترجمه
Andrew Ng س:مدر
ساعت ۲۱ :زمان مدت
انگلیسی :زبان
Coursera دهنده: ارائه
لینک :دسترسی لینک
Neural Networks for Machine Learning ن:عنوا
شبکه های عصبی برای یادگیری ماشین ترجمه عنوان:
Geoffrey Hinton س: مدر
ساعت ۲۲ مدت زمان:
انگلیسی زبان:
:Courseraارائه دهنده
لینک : لینک دسترسی
Intro to Machine Learning ن:عنوا
مقدمه ای بر یادگیری ماشین ترجمه عنوان:
Sebastian Thrun س:مدر
ساعت ۳۰ مدت زمان:
انگلیسی زبان:
Udacity ه:ارائه دهند
لینک: لینک دسترسی