classical and nir measurements of the quality and ... · les résultats obtenus avec la technique...
TRANSCRIPT

BASE Biotechnol. Agron. Soc. Environ.201216(3),294-306
ClassicalandNIRmeasurementsofthequalityandnutritionalparametersofapples:amethodologicalstudyofintra-fruitvariabilityAudreyPissard(1),VincentBaeten(2),Jean-MichelRomnée(3),PascalDupont(1),AnneMouteau(2),MarcLateur(1)(1)WalloonAgriculturalResearchCenter(CRA-W).LifeSciencesDepartment.BreedingandBiodiversityUnit.RuedeLiroux,4.B-5030Gembloux(Belgium).E-mail:[email protected](2)WalloonAgriculturalResearchCenter(CRA-W).ValorisationofAgriculturalProductsDepartment.FoodandFeedQualityUnit.ChausséedeNamur,24.B-5030Gembloux(Belgium).(3)WalloonAgriculturalResearchCenter(CRA-W).ValorisationofAgriculturalProductsDepartment.AgriculturalProductTechnologyUnit.ChausséedeNamur,24.B-5030Gembloux(Belgium).
ReceivedonJuly11,2011;acceptedonJanuary12,2012.
Forthepastfewyears,researchhasfocusedontheapplicationofNearInfraredSpectroscopy(NIR)techniquestoanalyzethequalityofapplevarieties.Asallfruitqualityandnutritionalparametersareaffectedbymanyfactors,tostandardizethesamplingmethodsprior toanalysis isveryimportant.Inthisstudy, theintra-fruitvariabilityofapplevarietiesintermsofqualityparameters (sugar, total polyphenol andvitaminCcontent)was examined.The adequacyof theprotocolsusuallyappliedtoanalyzeapplequality(referenceanalysesofarepresentativesampleoftheappleandNIRmeasurementscollectedatfourpoints45°fromeachotherintheequatorialregionoftheapple)wastheninvestigated.Thereferencevaluesforthequalityparametersshowedimportantintra-fruitvariabilityforallqualityparametersanalyzed.Theresultsalsoshowedthattherewaslittledifferencebetweenthemeanvalueatthefourpointsandthemeanvalueoftheentireapple.Thissuggestedthatameanvalueobtainedfromarepresentativesampleofanappleisenoughtoassessthevariabilitywithinthefruitandtoestimate,withprecision,thecontentofthequalityparameters.TheresultsofNIRspectroscopyshowedthatmeasurementatthefourtargetpointsissuitableforpredictingqualityparametersprecisely.Thestudyconcludedthatstandardizedreferenceanalysesshouldbedoneonarepresentativefruitsampleofanappleandspectralmeasurementsmadeatfourpoints45°fromeachotherintheequatorialregionoftheapple.Keywords.Fruits,apples,varieties,ascorbicacid,polyphenols,sugar,vitamincontent,quality,qualitycontrols.
Analyse de la qualité et des paramètres nutritionnels des pommes par les méthodes NIR et classiques : étude méthodologique de la variabilité intra-fruit.Danslepassé, lesrecherchesontportésur l’applicationdela techniquedeSpectroscopieProcheInfrarouge(NIR)pourl’analysedelaqualitédespommes.Étantdonnéquelesparamètresdequalitéetnutritionnelssontinfluencéspardenombreuxfacteurs,ilesttrèsimportantdestandardiserlesméthodesd’échantillonnageavantderéaliserlesanalyses.Danscetteétude,lavariabilitéintra-fruitdesvariétésdepommesentermesdeparamètresdequalité(contenuensucre,polyphénolstotauxetvitamineC)aétéétudiée.L’adéquationdesprotocolesgénéralementutiliséspouranalyserlaqualitédesfruits(mesuresderéférenceréaliséessurunéchantillonmoyendufruitetmesuresNIRréaliséesenquatrepointssituésàl’équateurdufruit)aensuiteétéétudiée.Lesmesuresderéférenceontmontréuneimportantevariabilitéintra-fruitpourtouslesparamètresdequalitéétudiés.Lesrésultatsontaussimontrélafaibledifférenceentrelamoyennedesvaleursauxquatrepointsdel’équateuretlavaleurmoyennedelapommeentière.Cecisuggèrequelavaleurmoyenneobtenueàpartird’unéchantillonreprésentatifdufruitestsuffisantepourestimerlavariabilitéauseindufruitetpourestimeravecprécisionlesparamètresdequalité.LesrésultatsobtenusaveclatechniqueNIRmontrequelamesureauxquatrepointsdel’équateurestadéquatepourprédireprécisémentlesparamètresdequalité.Enconclusion,lesanalysesderéférencedevraientêtreréaliséessurunéchantillonreprésentatifdufruitetlesmesuresspectralesréaliséesenquatrepointsàl’équateurdufruit.Mots-clés.Fruits,pomme,variété,acideascorbique,polyphénol,sucre,teneurenvitamines,qualité,contrôledequalité.
ClassicalandNIRmeasurementsofthequalityofapples 295
1. INTRODUCTION
Fruitqualityhastraditionallybeenevaluatedbyvisualinspection of the external appearance and by usingdestructive methods to measure the internal qualityparameters. Due to the destructive nature of themethods used, only a certain number of batches canbeanalyzed,eventhoughfruitandvegetablebatchesareknowntobehighlyvariable(Floresetal.,2008).Inthepastdecade,researchhasfocusedondevelopingnon-destructive measurement techniques to analyzethe quality attributes of agricultural products. NearInfraredSpectroscopy(NIR)isbasedonthereflectionandselectiveabsorptionofNIRradiation,dependingon the structure and chemical composition of theproduct.Theresultingspectraldataareanalyzedusingmultivariateregressiontechniquesinordertoestablisharelationshipwiththequalitycharacteristicsofinterest(measured by reference method or by standardizedobservation). This is done by developing predictionmodels.NIRspectroscopyoffersdecisiveadvantagesovertraditionalmethods,themainonesbeingthatitisrapid(afewsecondspersample)andnon-destructive,which is very important for controlling and sortingagriculturalproducts.Itisalsoverysimple,direct(nopreparation of sample) and chemical-free (limited tothereagentsrequiredforreferenceanalyses).Finally,it allows several product parameters to be studiedsimultaneously(Lammertynetal.,1998).
NIR spectroscopy has been applied widely todeterminetheinternalqualityofnumerousagriculturalandfoodproducts,includingfruit,particularlyapples.Ithasbeenusedtopredictfirmness(Mehinagicet al.,2003; Lu, 2004; Zude et al., 2006), sugar content(Luet al.,2000;Parket al.,2003;Peirset al.,2003;Sanchezetal.,2003;Liuetal.,2006;Zudeetal.,2006;Liuetal.,2007;Angraetal.,2009;Pazetal.,2009),watercontent(Qingetal.,2008),acidity(Lammertynet al., 1998; Liu et al., 2005; Liu et al., 2006) andpost-harvestquality(Bobelynetal.,2010).Ithasalsobeenusedtodiscriminatevarieties(Ciottietal.,1998;Heetal.,2007)andtodetectsuchdefectsasbitterpit(Nicolaï et al., 2006), bruises on apples (Guillerminet al.,2005)andinternalbrowning(Clarketal.,2003).
Inapples,amajorindicationofinternalqualityissugarcontent,asthiswillaffectconsumeracceptanceand therefore influence the product’s market value(Table 1). Polyphenols and vitaminC are alsoimportantcriteriaforevaluatingthenutritionalqualityof apples. They are antioxidants and have manybiological activities in the human body. The healthbenefits of apple phytochemicals have been widelystudied(Boyeretal.,2004),butthechemicalanalysisofthesenutritionalcharacteristicsinvolvesdestructive,laborious, costly and time-consuming methods.NIR spectroscopy could therefore be an interesting
alternativeforanalyzingthesenutritionalparameters.Unlike the analysis of sugar content, firmness andacidity(seeNicolaïetal.,2007andCampsetal.,2008forreview),therearenoreportsontheuseofNIRformeasuring the polyphenol and vitaminC content inapplesinparticularorfruitingeneral.
WithNIR analyses, to obtain a robust predictionmodel, the calibration dataset should be sufficientlyrich in variation and should contain samples fromdiversevarieties,orchardsandseasons.Theinfluenceofbiologicalvariability(variety,orchard,andseason)hasbeendemonstrated(Peirsetal.,2003).Thedatasetshould therefore represent the existing variability inthespecies,butshouldalsotakeaccountoftheexistingvariability within the fruit itself. This is especiallyrelevantwhenfreshandheterogeneousproductssuchas fruits are analyzed.The anisotropicdifferencesofNIRspectraandqualityparameterscouldbeobservedinapples,astheyhavebeendemonstratedforpeaches(Fuet al.,2008). In thiscase, it is essential toknowmoreaboutthedistributionofconstituentsinthefruitandtodeterminewhereandhowmanypointsneedtobemeasuredwithNIR,aswellastoassessthesampleportion to be analyzed using reference methods, inorder to have a representative figure of the productanalyzed. In the literature, NIR usually involves
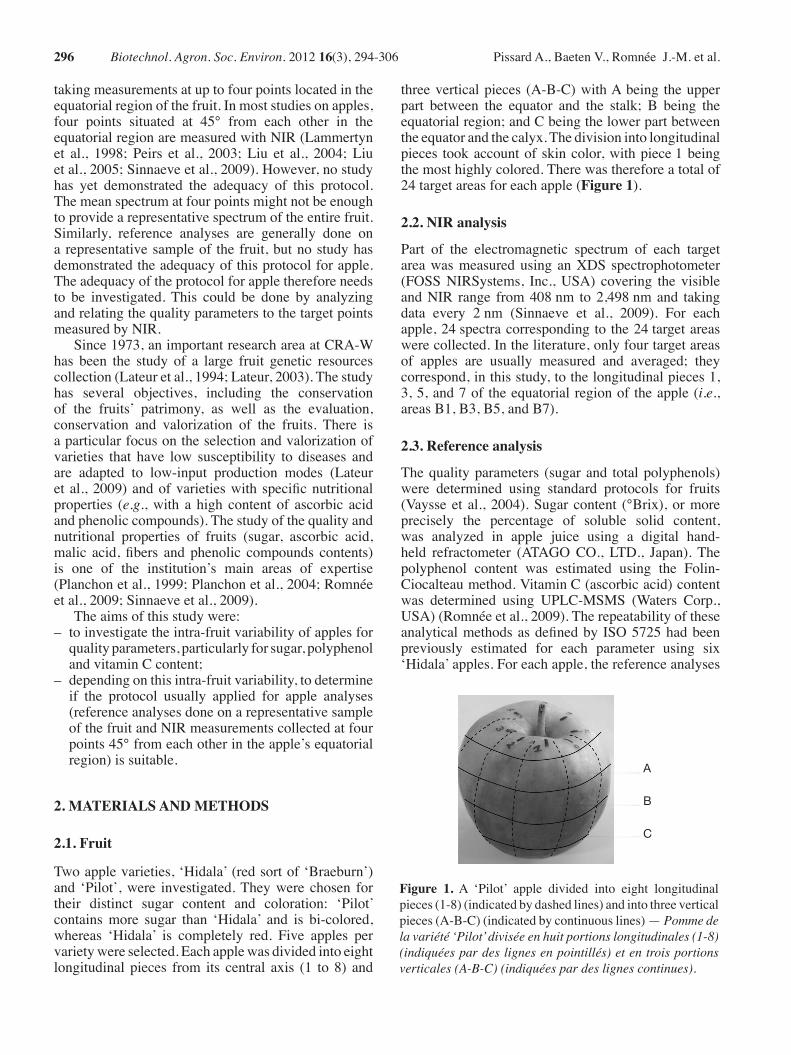
Table 1. Mean nutritional composition of apples (per100g edible portion) (Westwood, 1993).Quantities canchange considerably, depending on cultivar, season,maturitystage,modeofproduction,etc.—Composition nutritionnelle moyenne des pommes (par portion de 100 g) (Westwood, 1993). Les quantités peuvent changer de façon importante selon le cultivar, la saison, la maturité, le mode de production, etc.Components (per100g) ContentWater(%) 84.8Carbohydrates(g) 14.1Protein(g) 0.2Fat(g) 0.6VitaminsVitaminC(ascorbicacid)(mg) 7VitaminA(i.u.) 90VitaminB1(thiamine)(mg) 0.03VitaminB2(riboflavin)(mg) 0.02MineralsPhosphorus(mg) 10Calcium(mg) 7Sodium(mg) 1Iron(mg) 0,3Potassium(mg) 110
296 Biotechnol. Agron. Soc. Environ. 201216(3),294-306 PissardA.,BaetenV.,RomnéeJ.-M.etal.
takingmeasurementsatuptofourpointslocatedintheequatorialregionofthefruit.Inmoststudiesonapples,four points situated at 45° from each other in theequatorialregionaremeasuredwithNIR(Lammertynet al., 1998; Peirs et al., 2003; Liu et al., 2004; Liuet al.,2005;Sinnaeveetal.,2009).However,nostudyhas yet demonstrated the adequacy of this protocol.Themeanspectrumatfourpointsmightnotbeenoughtoprovidearepresentativespectrumoftheentirefruit.Similarly, reference analyses are generally done onarepresentativesampleof thefruit,butnostudyhasdemonstratedtheadequacyofthisprotocolforapple.Theadequacyoftheprotocolforapplethereforeneedsto be investigated. This could be done by analyzingandrelatingthequalityparameterstothetargetpointsmeasuredbyNIR.
Since1973,animportantresearchareaatCRA-Whas been the study of a large fruit genetic resourcescollection(Lateuretal.,1994;Lateur,2003).Thestudyhas several objectives, including the conservationof the fruits’ patrimony, as well as the evaluation,conservation and valorization of the fruits. There isaparticularfocusontheselectionandvalorizationofvarieties that have low susceptibility to diseases andare adapted to low-input production modes (Lateuretal.,2009)andofvarietieswith specificnutritionalproperties (e.g.,with a high content of ascorbic acidandphenoliccompounds).Thestudyofthequalityandnutritional properties of fruits (sugar, ascorbic acid,malic acid, fibers and phenolic compounds contents)is one of the institution’s main areas of expertise(Planchonetal.,1999;Planchonetal.,2004;Romnéeetal.,2009;Sinnaeveetal.,2009).
Theaimsofthisstudywere:– toinvestigatetheintra-fruitvariabilityofapplesfor qualityparameters,particularlyforsugar,polyphenol andvitaminCcontent;– dependingonthisintra-fruitvariability,todetermine if the protocol usually applied for apple analyses (referenceanalysesdoneonarepresentativesample ofthefruitandNIRmeasurementscollectedatfour points45°fromeachotherintheapple’sequatorial region)issuitable.
2. MATERIALS AND METHODS
2.1. Fruit
Twoapplevarieties,‘Hidala’(redsortof‘Braeburn’)and ‘Pilot’,were investigated.Theywere chosen fortheir distinct sugar content and coloration: ‘Pilot’containsmore sugar than ‘Hidala’ and is bi-colored,whereas ‘Hidala’ is completely red. Five apples pervarietywereselected.Eachapplewasdividedintoeightlongitudinal pieces from its central axis (1 to 8) and
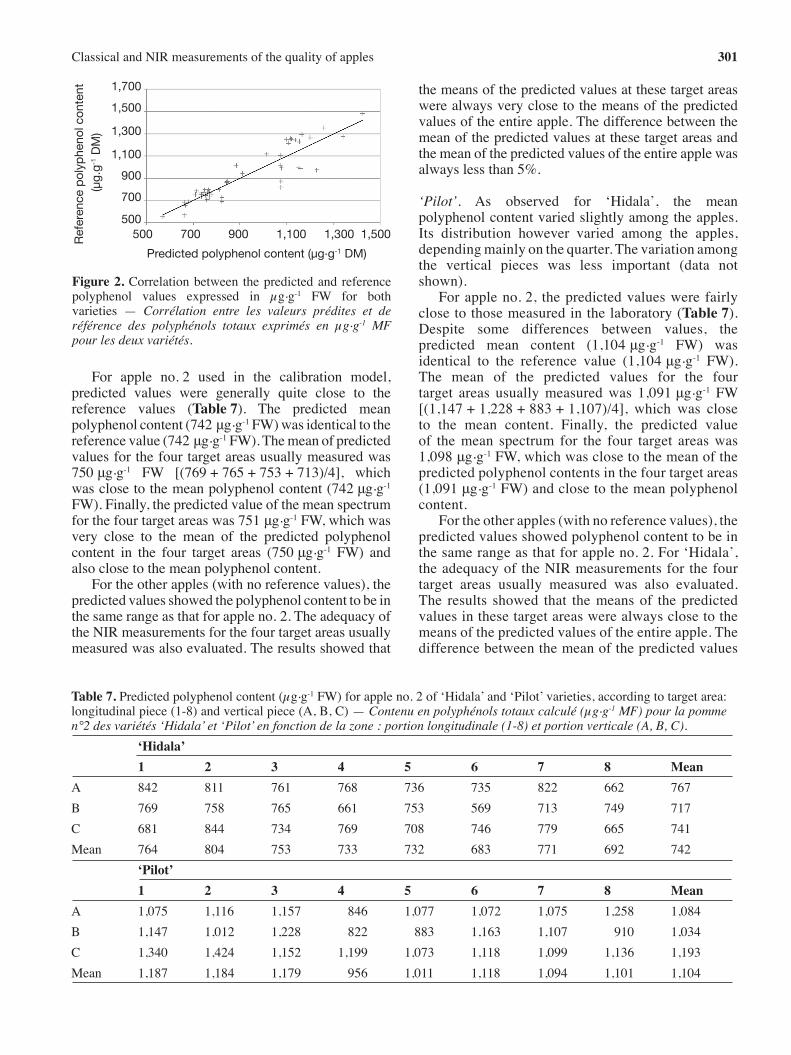
threeverticalpieces (A-B-C)withAbeing theupperpart between the equator and the stalk; B being theequatorialregion;andCbeingthelowerpartbetweentheequatorandthecalyx.Thedivisionintolongitudinalpieces tookaccountofskincolor,withpiece1beingthemosthighlycolored.Therewasthereforeatotalof24targetareasforeachapple(Figure 1).
2.2. NIR analysis
Part of the electromagnetic spectrum of each targetareawasmeasuredusinganXDSspectrophotometer(FOSSNIRSystems, Inc.,USA) covering the visibleandNIR range from408nm to2,498nmand takingdata every 2nm (Sinnaeve et al., 2009). For eachapple,24spectracorrespondingtothe24targetareaswerecollected.Intheliterature,onlyfourtargetareasof apples are usually measured and averaged; theycorrespond,inthisstudy,tothelongitudinalpieces1,3,5,and7of theequatorialregionof theapple(i.e.,areasB1,B3,B5,andB7).
2.3. Reference analysis
Thequalityparameters (sugarand totalpolyphenols)were determined using standard protocols for fruits(Vaysseet al., 2004).Sugarcontent (°Brix),ormoreprecisely the percentage of soluble solid content,was analyzed in apple juice using a digital hand-held refractometer (ATAGOCO., LTD., Japan). Thepolyphenol content was estimated using the Folin-Ciocalteaumethod.VitaminC(ascorbicacid)contentwas determined using UPLC-MSMS (Waters Corp.,USA)(Romnéeetal.,2009).TherepeatabilityoftheseanalyticalmethodsasdefinedbyISO5725hadbeenpreviously estimated for each parameter using six‘Hidala’apples.Foreachapple,thereferenceanalyses
Figure 1. A ‘Pilot’ apple divided into eight longitudinalpieces(1-8)(indicatedbydashedlines)andintothreeverticalpieces(A-B-C)(indicatedbycontinuouslines)—Pomme de la variété ‘Pilot’ divisée en huit portions longitudinales (1-8) (indiquées par des lignes en pointillés) et en trois portions verticales (A-B-C) (indiquées par des lignes continues).
A
B
C

ClassicalandNIRmeasurementsofthequalityofapples 297
were repeated four times. The repeatability standarddeviationwasestimatedusingtheformula:
Sr=√S²r
whereS²r=(S²i)/k,withS²i=varianceoftheithessay(apple)andk=numberofessays.
Thereferenceanalyseswereperformedinthesame24target areas (about1cm³)as thosemeasuredwithNIR;theportionoffleshilluminatedbyNIRwastakenandanalyzed.Eachqualityparameterwasmeasuredononlyoneapplepervariety.AftertheNIRmeasurement,appleno.1wasanalyzedforthesugarcontent,appleno.2 for the polyphenol content and apple no.3 forthevitaminCcontent.AllthereferenceanalyseswereperformedimmediatelyaftertheNIRmeasurements.
2.4. Data analysis
Foreachqualityparameter,thereferencevalueswereanalyzed using ANOVA (Minitab15 Inc., USA) inorder to highlight the differentiation according to“longitudinalpiece”or“verticalpiece”.Thereferencevalueswerethenusedtocalibratespectroscopicmodelsusing Winisi software (Infrasoft International LLC,USA).MultipleLinearRegression(MLR)andPartialLeast Squares (PLS) regression techniques usingdifferentspectralranges(408-2,498nm,950-1,774nmand1,600-2,390nm)hadbeenpreviouslyapplied. InMLR, the forward stepwise selectionofwavelengthshas been used in order to avoid over-fitting as therearemanymore wavelengths than samples. For eachqualityparameter,thedifferentmodelswerecomparedon the basis of the calibration characteristics. TheMLR regression method gave the most accuratemodels(lowerSECandhigherRSQandRPD)andwasthereforeusedinthepresentstudy.
For each quality parameter, a spectroscopicmodelwascalculatedforeachvarietyseparately.Theperformancesofthemodelswereestimatedaccordingto the following statistics: Standard Deviation (SD),Standard Error of Calibration (SEC), StandardError of Cross-Validation (SECV), coefficient ofdetermination of calibration (RSQ) and the ratio ofpredictiontodeviation(RPD=SD/SECV).TheSECVwas calculated independently by leaving out onelongitudinal/verticalpiece.Precisely,eachlongitudinal(orvertical)piecewasleavedoutandtheSECVwascalculated using a calibration set of n=21 (or 16)andatestsetofn=3(or8).Finally,theSECVvaluesobtained after having leaved each longitudinal (orvertical)piecewereaveragedtoprovideameanSECVreportedinthetables.Onlyresultsfortheleavingoutoneverticalpiecearepresentedinthepaper.
The calibrationmodelswere then used to predictthe quality parameters of the five apples used in the
study (including the one used for the calibrationstep).
Fortheapplesusedforthecalibrationmodels,thefirststepwastoanalyzethereferencevalues.Inordertostudytheinfluenceofthesamplingonthecalibration,themeanofthevaluesforthefourtargetareasusuallyanalyzed (longitudinal pieces 1, 3, 5, and 7 of theequatorial region of the apple, hereafter referred tosimply as “the four target areas usually measured”)wascomparedwiththemeanvalueoftheentireapple.TheNIRmeasurementswerethenanalyzed.InordertoevaluatetheadequacyofthefourNIRmeasurementsfor the target areas usually analyzed, the predictedvaluesatthesetargetareaswereaveragedandthemeanwas compared with the mean content of the entireapple (reference value). In addition, the four spectrawere averaged and the predicted value of the meanspectrumwascomparedwiththemeanofthepredictedvaluesoftheentireappleandwiththemeancontentoftheentireapple.
Fortheappleswithnoreferencevalues,thequalityparameters were predicted using the calibrationmodels. In order to evaluate the adequacy of theNIR measurements for the four target areas usuallymeasured, the predicted values at these target areaswereaveragedand themeanwascomparedwith themeanofthepredictedvaluesoftheentireapple.
3. RESULTS AND DISCUSSION
3.1. Sugar content
Reference analyses. Thesugarcontentofappleno.1variedfrom10.6to13.4°Brixfor‘Hidala’andfrom14to15.8°Brixfor‘Pilot’,dependingonthetargetarea(Table 2).Withtherepeatabilitystandarddeviationofthemethodbeing0.10,thesugarcontentdatarevealedintra-fruitvariability.
Forbothvarieties,thehighestvalueswereobservedfor longitudinalpieces1and8,whichwerethemostcolored regions of the apples. However, ‘Hidala’showed greater variability and a greater range ofsugar content than ‘Pilot’.Variance analysis showedvery highly significant differentiation between thelongitudinal pieces of ‘Hidala’ (p-value<0.001),but only significant differentiation for ‘Pilot’(p-value=0.037).Fromaverticalpointofview,sugarcontentdidnotvarymuchandwassimilarforallthevertical pieces. No differentiation was revealed byANOVA (p-value=0.22 and 0.89 for ‘Hidala’ and‘Pilot’,respectively).
For ‘Hidala’, the mean sugar content was11.8°Brix. If only the four target areas usuallymeasured were considered, the mean sugar contentwas 12.02°Brix [(13.4 + 11.7 + 11.1 + 11.9)/4].

298 Biotechnol. Agron. Soc. Environ. 201216(3),294-306 PissardA.,BaetenV.,RomnéeJ.-M.etal.
Therewaslessthana2%difference(Δ=0.22°Brix)between the mean sugar content of the entire appleand themean sugar content of the four target areasat the equatorial region. For ‘Pilot’, themean sugarcontentwas14.9°Brix.Themeansugarcontentinthefour target areas usually measured was 14.65°Brix[(14.5+15.7+14+14.4)/4],whichwasveryclosetothemeansugarcontentof theentireapple (24targetareas)(Δ=2%).
For both varieties, therefore, the mean sugarcontentinthefourtargetareasusuallymeasuredwasvery close to the mean sugar content of the entireapple,whichdemonstrates thatanalyzingfourpointsis enough to assess the sugar variability within thefruitsandtoestimate,withprecision,thesugarcontentoftheapples.
Calibration and prediction of sugar content.Variousregressionmethodsandwavelengthrangesweretestedtocalibratethedataofbothvarieties.Thebestresults(lowestSECandhighestRSQandRPD)wereobtainedusing MLR on the spectral range of 408-2,498nm.The calibration models were realized separately for
both the varieties (n=24) (Table 3). Sugar contentpredictionsforallfiveapplesweremadeusingthesecalibrationmodels.
‘Hidala’. Thepredictedvaluesforthefiveapples(datanotshown)showedthattherewasbothintra-fruitandinter-fruitvariability.Inadditiontothevariationofthepredictedmean sugar content among the apples, thesugarcontentvariedwithinapples,dependingonthetarget area (longitudinal piece and vertical piece) oftheapple.Thissugardistributionwasnotconstantandvariedgreatlyamongapples(datanotshown).
Forappleno.1usedinthecalibrationmodel, thepredicted values were very close to thosemeasuredin the laboratory (reference values) (Table 4). Thepredictedmeansugarcontentwasidenticaltothemeansugarcontentmeasuredinthelaboratory(11.8°Brix).Inaddition,themeanofthepredictedsugarcontentinthefourtargetareasusuallymeasuredwas11.8°Brix[(13.2+11.6+10.7+11.7)/4], which was identicalto themean sugar content (referencevalue).Finally,thepredictedvalueofthemeanspectrumforthefourtargetareaswas11.7°Brix,whichwasveryclose to
Table 2. Sugarcontent(°Brix)forappleno.1of‘Hidala’and‘Pilot’varieties,accordingtotargetarea:longitudinalpiece(1-8)andverticalpiece(A,B,C)—Contenu en sucre (°Brix) pour la pomme n°1 des variétés ‘Hidala’ et ‘Pilot’ en fonction de la zone : portion longitudinale (1-8) et portion verticale (A, B, C).
‘Hidala’1 2 3 4 5 6 7 8 Mean
A 13.4 13.0 12.2 11.1 11.0 11.0 12.2 12.8 12.1B 13.4 12.8 11.7 11.1 11.1 11.2 11.9 12.4 12.0C 13.1 12.1 10.6 10.8 11.4 10.9 11.4 11.0 11.4Mean 13.3 12.6 11.5 11.0 11.2 11.0 11.8 12.1 11.8
‘Pilot’1 2 3 4 5 6 7 8 Mean
A 15.0 14.9 15.6 14.6 14.2 14.5 15.2 15.2 14.9B 14.5 14.0 15.7 14.7 14.0 15.1 14.4 15.8 14.8C 15.6 15.5 14.9 14.1 14.4 15.0 14.4 15.5 14.9Mean 15.0 14.8 15.4 14.5 14.2 14.9 14.7 15.5 14.9
Table 3. Calibrationresultsforthesugarcontent(°Brix)obtainedusingMLRonthespectralrangeof408-2,498nmforthe‘Hidala’and‘Pilot’varieties—Résultats du modèle de calibration pour le contenu en sucre (°Brix) obtenu avec MLR sur la gamme spectrale allant de 408 à 2 498 nm pour les variétés ‘Hidala’ et ‘Pilot’.
n Mean SD SEC RSQ SECV RPD Nb terms‘Hidala’ 24 11.80 0.89 0.25 0.92 0.35 0.71 3‘Pilot’ 24 14.90 0.56 0.32 0.67 1.02 0.55 3SD:StandardDeviation—écart-type;SEC:StandardErrorofCalibration—erreur standard de calibration;RSQ:coefficientofdeterminationofcalibration—coefficient de détermination de la calibration;SECV:StandardErrorofCross-Validation—erreur standard de validation croisée;RPD=SD/SECV:theratioofpredictiontodeviation—rapport performance/déviation.

ClassicalandNIRmeasurementsofthequalityofapples 299
the mean of the predicted sugar content in the fourtargetareasandtothemeansugarcontent.
These results proved the robustness of thecalibrationmodelandsuggestedthatthemeasurementsinthefourtargetareasusuallymeasuredwereenoughtopredict,withprecision, themean sugarcontent inapples.
For the other apples (with no reference values),thepredictedvaluesshowedsugarcontenttobeinthesamerangeasthatofappleno.1.TheadequacyoftheNIR measurements for the four target areas usuallymeasuredwasalsoevaluated.Theresultsshowedthatthemeansofthepredictedvaluesinthesetargetareaswerealwaysveryclosetothemeansofthepredictedvaluesoftheentireapple.Thedifferencebetweenthemeanofthepredictedvaluesinthesetargetareasandthemeanofthepredictedvaluesoftheentireapplewasalwaysequaltoorlessthan1%.
‘Pilot’. The same observations can be made for thepredicted values of the ‘Pilot’ apples. There wasboth intra-and inter-fruitvariability, aswellasgreatvariabilityinsugardistributionamongtheapples(datanotshown).
For apple no.1 used in the calibrationmodel, asobservedfor‘Hidala’,thepredictedvalueswereveryclose to the reference ones (Table 4). The predictedmean sugar content (14.9°Brix) was identical tothe mean sugar content measured in the laboratory(14.9°Brix).Themeanofthepredictedsugarcontentfor the four target areas usually measured was14.8°Brix [(14.3+15.5+14.4+14.9)/4], whichwasveryclosetothemeansugarcontent.Finally,asobservedfor‘Hidala’,thepredictedvalueofthemeanspectrumofthefourtargetareaswas14.7°Brix,which
wasveryclosetothemeanofthepredictedsugarcontentinthefourtargetareasandtothemeansugarcontent.
For theotherapples (withno referencevalues), thepredictedvaluesshowedsugarcontenttobeinthesamerange as that of appleno.1.The adequacyof theNIRmeasurementsforthefourtargetareasusuallymeasuredwasalsoevaluated.Theresultsshowedthatthemeansofthepredictedvalues for these target areaswerealwaysvery close to themeans of the predicted values of theentire apple. The difference between the mean of thepredictedvaluesforthesetargetareasandthemeanofthepredictedvaluesoftheentireapplewasalwaysequaltoorlessthan1%.
The results did not highlight a particular sugardistribution pattern in the ‘Hidala’ or ‘Pilot’ apples.However, they revealed thatusingNIR tomeasure thefourtargetareasintheequatorialregionofthefruitwasenoughtopredict,withprecision,themeansugarcontentofapples.
3.2. Polyphenol content
Reference analyses. Thepolyphenolcontentofappleno.2variedfrom554to876μg.g-1FWfor‘Hidala’andfrom688to1,484μg.g-1FWfor‘Pilot’,dependingonthetargetareaoftheapple(Table 5).ThesevaluesaccordwiththefindingsofVrohvseketal.(2004)andVanzanietal.(2005),who found an average concentration of 75.4mg.100g-1FW and 2.6mmol.kg-1 FW, respectively, in ‘Braeburn’apples. ‘Pilot’ apples showed greater variability in thepolyphenolcontentthan‘Braeburn’.Withtherepeatabilitystandard deviation of the method being 74.5, the datarevealed intra-fruit variability in terms of polyphenolcontent.
Table 4.Predictedsugarcontent(°Brix)forappleno.1of‘Hidala’and‘Pilot’varieties,accordingtotargetarea:longitudinalpiece(1-8)andverticalpiece(A,B,C)—Contenu en sucre calculé (°Brix) pour la pomme n°1 des variétés ‘Hidala’ et ‘Pilot’ en fonction de la zone : portion longitudinale (1-8) et portion verticale (A, B, C).
‘Hidala’1 2 3 4 5 6 7 8 Mean
A 13.6 12.7 12.2 11.5 11.1 11.3 12.5 12.5 12.2B 13.2 12.8 11.6 11.1 10.7 10.9 11.7 12.3 11.7C 12.9 12.3 10.9 10.7 11.2 10.9 11.2 11.7 11.5Mean 13.2 12.6 11.6 11.1 11.0 11.0 11.8 12.2 11.8 ‘Pilot’
1 2 3 4 5 6 7 8 MeanA 15.5 14.9 15.1 15.0 14.2 14.6 14.8 14.7 14.9B 14.3 14.2 15.5 14.6 14.4 14.9 14.9 15.5 14.8C 15.8 15.3 14.7 14.2 14.5 14.8 14.7 15.5 14.9Mean 15.2 14.8 15.1 14.6 14.4 14.8 14.8 15.3 14.9

300 Biotechnol. Agron. Soc. Environ. 201216(3),294-306 PissardA.,BaetenV.,RomnéeJ.-M.etal.
Forbothvarietiesthedatashowedthattherewasnoparticulardistributionofpolyphenolcontentamongthelongitudinalpieces.Nodifferentiationforthisparameterwashighlighted(p-value=0.77and0.51for‘Hidala’and‘Pilot’,respectively).Withregardtotheverticalpieces,for‘Hidala’thepolyphenolcontentwashighlyvariableandtherewasnoparticulardistribution.Therewasnodifferentiationamongverticalpieces (p-value=0.96).For‘Pilot’,ahigherpolyphenolcontentwasobservedfor vertical pieceC than for vertical piecesA and B.Thevarianceanalysisshowedsignificantdifferentiationamongverticalpieces(p-value=0.012).
For ‘Hidala’, the mean polyphenol content was742µg.g-1 FW. If only the four target areas usuallymeasured were considered, the mean content was764µg.g-1 FW [(731+797+744+785)/4]. Thedifferenceintheresultsobtainedusingthetwoprotocolswas only 3% (Δ=22) between themean polyphenolcontent of the entire apple and the mean content inthefourtargetareasusuallymeasured.For‘Pilot’,themean polyphenol content was 1,104µg.g-1 FW. Themeancontentinthefourtargetareasusuallymeasuredwas 1,050µg.g-1 FW [(997+974+1,013+1,217)/4],which revealed a 5% difference (Δ=54) from theresultsobtainedfortheentirefruit.
Forbothvarieties,therefore,themeanpolyphenolcontentinthefourtargetareasusuallymeasuredwasvery close to the mean content of the entire apple,which again demonstrates that analyzing the fourpointsisenoughtoassesspolyphenolvariabilitywithinfruitsand toestimate,withprecision, thepolyphenolcontent.
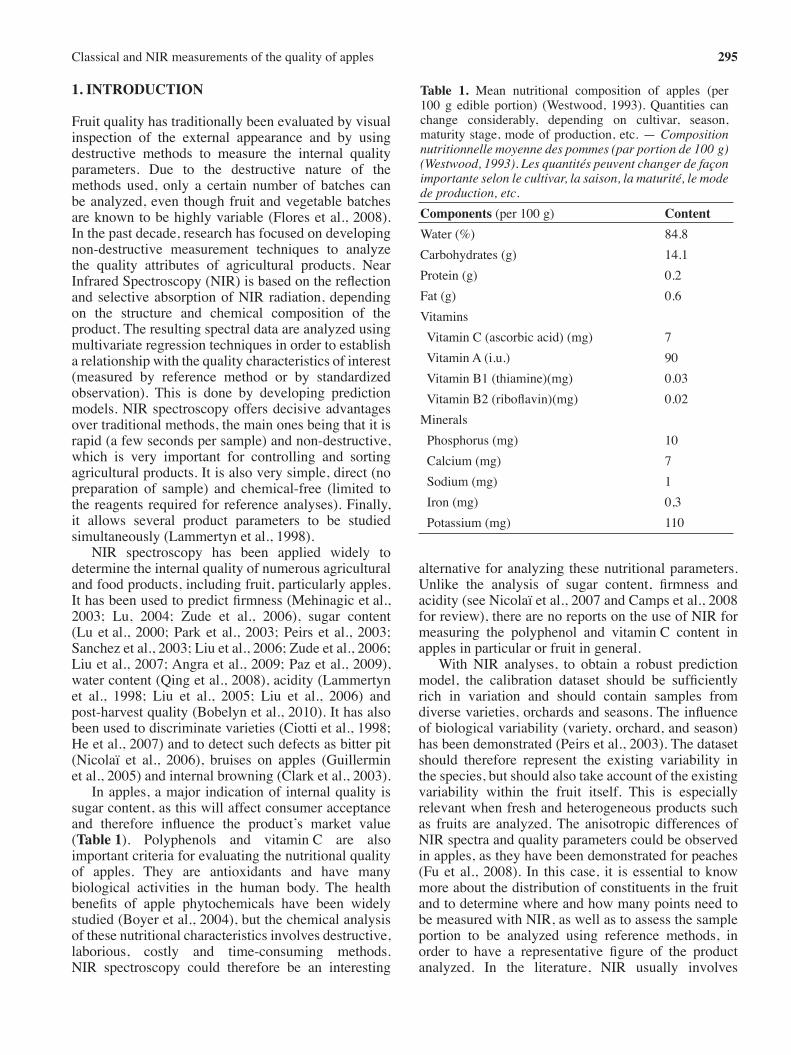
Calibration and prediction of polyphenol content. Various regression methods and wavelength rangesweretestedandcompared.Thebestresults(lowestSECandhighestRSQandRPD)wereobtainedusingMLRon the full spectrum of theXDS spectrophotometer.Thecalibrationmodelsareshownintable 6.Figure 2shows the correlation between the predicted andreference polyphenol values for both varieties.Polyphenolcontentpredictionsforallfiveapplesweremadeusingthesecalibrationmodels.
‘Hidala’. As in the case of sugar content, therewasbothintra-fruitandinter-fruitvariabilityinpolyphenolcontent.Themeancontentvaried slightlyamong theapples.However,thedistributionofpolyphenolswithinapplesvariedamong the fruits,dependingmainlyonthequarter(datanotshown).
Table 5. Polyphenolcontent(µg.g-1FW)forappleno.2of‘Hidala’and‘Pilot’varieties,accordingtotargetarea:longitudinalpiece(1-8)andverticalpiece(A,B,C)—Contenu en polyphénols totaux (µg.g-1 MF) pour la pomme n°2 des variétés ‘Hidala’ et ‘Pilot’ en fonction de la zone : portion longitudinale (1-8) et portion verticale (A, B, C).
‘Hidala’1 2 3 4 5 6 7 8 Mean
A 864 795 770 769 766 756 727 684 766B 731 706 797 568 744 554 785 798 710C 686 876 732 771 752 771 749 656 749Mean 760 793 766 703 754 694 754 713 742
‘Pilot’1 2 3 4 5 6 7 8 Mean
A 819 1,258 988 869 992 1,012 873 1,353 1,021B 997 1,117 974 688 1,013 1,293 1,217 942 1,030C 1,276 1,484 1,228 1,264 1,104 1,249 1,247 1,244 1,262Mean 1,031 1,286 1,063 940 1,036 1,185 1,112 1,180 1,104
Table 6.Calibration results for the polyphenol content (µg.g-1 FW)obtainedusingMLRon the spectral rangeof 408-2,498nmforthe‘Hidala’and‘Pilot’varieties—Résultats du modèle de calibration pour le contenu en polyphénols totaux (µg.g-1 MF) obtenu avec MLR sur la gamme spectrale allant de 408 à 2 498 nm pour les variétés ‘Hidala’ et ‘Pilot’.
n Mean SD SEC RSQ SECV RPD Nb terms‘Hidala’ 24 742.00 74.78 43.47 0.66 197.25 0.38 3‘Pilot’ 24 1,104.00 194.58 142.64 0.46 238.79 0.81 3abbreviations—abréviations:seetable 3—voirtableau 3.
ClassicalandNIRmeasurementsofthequalityofapples 301
For apple no.2 used in the calibration model,predicted values were generally quite close to thereference values (Table 7). The predicted meanpolyphenolcontent(742μg.g-1FW)wasidenticaltothereferencevalue(742μg.g-1FW).Themeanofpredictedvaluesforthefourtargetareasusuallymeasuredwas750μg.g-1 FW [(769+765+753+713)/4], whichwasclosetothemeanpolyphenolcontent(742μg.g-1FW).Finally,thepredictedvalueofthemeanspectrumforthefourtargetareaswas751μg.g-1FW,whichwasvery close to the mean of the predicted polyphenolcontent in the four target areas (750μg.g-1 FW) andalsoclosetothemeanpolyphenolcontent.
Fortheotherapples(withnoreferencevalues),thepredictedvaluesshowedthepolyphenolcontenttobeinthesamerangeasthatforappleno.2.TheadequacyoftheNIRmeasurementsforthefourtargetareasusuallymeasuredwasalsoevaluated.Theresultsshowedthat
themeansofthepredictedvaluesatthesetargetareaswerealwaysveryclosetothemeansofthepredictedvaluesoftheentireapple.Thedifferencebetweenthemeanofthepredictedvaluesatthesetargetareasandthemeanofthepredictedvaluesoftheentireapplewasalwayslessthan5%.
‘Pilot’. As observed for ‘Hidala’, the meanpolyphenolcontentvariedslightlyamongtheapples.Its distribution however varied among the apples,dependingmainlyonthequarter.Thevariationamongthe vertical pieces was less important (data notshown).
Forappleno.2, thepredictedvalueswerefairlyclosetothosemeasuredinthelaboratory(Table 7).Despite some differences between values, thepredicted mean content (1,104μg.g-1 FW) wasidentical to the reference value (1,104μg.g-1 FW).The mean of the predicted values for the fourtarget areas usuallymeasuredwas 1,091μg.g-1 FW[(1,147+1,228+883+1,107)/4], which was closeto the mean content. Finally, the predicted valueof themean spectrum for the four target areaswas1,098μg.g-1FW,whichwasclosetothemeanofthepredictedpolyphenolcontentsinthefourtargetareas(1,091μg.g-1FW)andclosetothemeanpolyphenolcontent.
Fortheotherapples(withnoreferencevalues),thepredictedvaluesshowedpolyphenolcontenttobeinthesamerangeasthatforappleno.2.For‘Hidala’,theadequacyoftheNIRmeasurementsforthefourtarget areas usually measured was also evaluated.The results showed that themeansof thepredictedvaluesinthesetargetareaswerealwaysclosetothemeansofthepredictedvaluesoftheentireapple.Thedifferencebetweenthemeanofthepredictedvalues
Predicted polyphenol content (µg.g-1 DM)
Ref
eren
ce p
olyp
heno
l con
tent
(µg.
g-1 D
M)
1,700
1,500
1,300
1,100
900
700
500500 700 900 1,100 1,300 1,500
Figure 2.Correlationbetween thepredictedandreferencepolyphenol values expressed in µg.g-1 FW for bothvarieties — Corrélation entre les valeurs prédites et de référence des polyphénols totaux exprimés en µg.g-1 MF pour les deux variétés.
Table 7.Predictedpolyphenolcontent(µg.g-1FW)forappleno.2of‘Hidala’and‘Pilot’varieties,accordingtotargetarea:longitudinalpiece(1-8)andverticalpiece(A,B,C)—Contenu en polyphénols totaux calculé (µg.g-1 MF) pour la pomme n°2 des variétés ‘Hidala’ et ‘Pilot’ en fonction de la zone : portion longitudinale (1-8) et portion verticale (A, B, C).
‘Hidala’1 2 3 4 5 6 7 8 Mean
A 842 811 761 768 736 735 822 662 767B 769 758 765 661 753 569 713 749 717C 681 844 734 769 708 746 779 665 741Mean 764 804 753 733 732 683 771 692 742
‘Pilot’1 2 3 4 5 6 7 8 Mean
A 1,075 1,116 1,157 846 1,077 1,072 1,075 1,258 1,084B 1,147 1,012 1,228 822 883 1,163 1,107 910 1,034C 1,340 1,424 1,152 1,199 1,073 1,118 1,099 1,136 1,193Mean 1,187 1,184 1,179 956 1,011 1,118 1,094 1,101 1,104

302 Biotechnol. Agron. Soc. Environ. 201216(3),294-306 PissardA.,BaetenV.,RomnéeJ.-M.etal.
in these target areas and themean of the predictedvaluesoftheentireapplewasalwayslessthan5%.
As concluded for the sugar analysis, the resultsfor both the ‘Hidala’ and ‘Pilot’ varieties showedthatusingNIRtomeasurethefourtargetareasintheequatorialregionofthefruitwasenoughtopredict,withprecision,themeantotalpolyphenolcontentofapples.
3.3. Vitamin C
Reference analyses. The vitaminC content ofapple no.3 varied from 12.6 to 27.3mg.100g-1FW for ‘Hidala’ and from 12.9 to 28.1mg.100g-1FW for ‘Pilot’, depending on the target area of theapple (Table 8). These values accord with previousvitaminC analyses carried out in our laboratory andareclosetothosereportedbyVrohvseketal.(2004),whofoundanaverageconcentrationof8.1mg.100g-1FW in ‘Braeburn’. The data showed that there waseven higher intra-fruit variability than observed forsugar and totalpolyphenol content.The repeatabilitystandarddeviationofthemethodwas0.9.
Forbothvarieties,thehighestvalueswereobservedforlongitudinalpieces1and2.Bothvarietiesshoweda great variation in vitaminC content according tolongitudinalpieces.‘Hidala’showedagreaterrangeofvitaminCcontentandgreatervariabilitythan‘Pilot’.Variance analysis showed a very highly significantdifferentiationamonglongitudinalpiecesfor‘Hidala’(p-value<0.001)andahighlysignificantdifferentiationfor ‘Pilot’ (p-value=0.002).Fromaverticalpointofview,forbothvarietiesthevitaminCcontentdidnotvarymuch.Nodifferentiationaccordingtothevertical
pieceswasrevealedusingANOVA(p-value=0.38and0.12for‘Hidala’and‘Pilot’,respectively).
For ‘Hidala’, the mean vitaminC content was20.5mg.100g-1FW.Ifonlythefourtargetareasusuallymeasured were considered, the mean content was18.9mg.100g-1 FW [(27.3+19.9+12.6+15.8)/4].For vitaminC, the difference between the meanvitaminC content of the entire apple and the meancontentofthefourtargetareasintheequatorialregionoftheapplewashigherthanthatobservedfortheotherparameters, and reached 8% (Δ=1.6). For ‘Pilot’,the mean content was 21mg.100g-1 FW. The meancontentforthefourtargetareasusuallymeasuredwas18.1mg.100g-1 FW [(25.4+16.4+12.9+17.8)/4],whichisclosetothemeanpolyphenolcontentoftheentire apple (Δ=2.9) and represents a difference of14%.Forbothvarieties,therefore,themeanvitaminCcontentinthefourtargetareascouldbeconsideredasrepresentativeofthemeancontentfortheentireapple.
Calibration and prediction of vitamin C content.As for sugar and polyphenol content, the calibrationmodelsforvitaminCwererealizedusingMLRonthefullspectrumoftheXDSspectrophotometer(Table 9).Figure 3showsthecorrelationbetweenthepredictedand reference vitaminC values for both varieties.VitaminCcontentpredictionsforallfiveapplesweremadeusingthesecalibrationmodels.
‘Hidala’. As observed for sugar and polyphenolcontent, both intra-fruit and inter-fruit variabilitywere observed. Predicted mean vitaminC contentvaried slightly among the apples.ThedistributionofvitaminCwithinapplesvariedslightlyamong fruits,accordingtoboththelongitudinalandverticalpieces(datanotshown).
Table 8. VitaminC content (mg.100g-1 FW) for apple no. 3 of ‘Hidala’ and ‘Pilot’ varieties, according to target area:longitudinalpiece(1-8)andverticalpiece(A,B,C)—Contenu en vitamine C (mg.100 g-1 MF) pour la pomme n°3 des variétés ‘Hidala’ et ‘Pilot’ en fonction de la zone : portion longitudinale (1-8) et portion verticale (A, B, C).
‘Hidala’1 2 3 4 5 6 7 8 Mean
A 26.6 29.0 22.8 23.5 13.5 20.3 21.2 19.2 22.0B 27.3 24.8 19.9 14.6 12.6 13.4 15.8 19.7 18.5C 26.7 24.4 24.3 19.8 13.8 13.5 22.8 21.6 20.9Mean 26.9 26.1 22.4 19.3 13.3 15.7 19.9 20.1 20.5
‘Pilot’1 2 3 4 5 6 7 8 Mean
A 24.3 28.1 25.0 19.2 16.6 20.3 21.0 26.3 22.6B 25.4 23.4 16.4 14.3 12.9 18.3 17.8 19.0 18.4C 25.7 26.0 22.4 17.8 15.9 18.8 21.2 27.5 21.9Mean 25.1 25.9 21.2 17.1 15.1 19.1 20.0 24.3 21.0

ClassicalandNIRmeasurementsofthequalityofapples 303
For apple no.3 used in the calibration model,the predicted values showed some differences fromthe reference values (Table 10).The predictedmeanvitaminCcontent(21.2mg.100g-1FW)howeverwasclose to the reference value (20.5mg.100g-1 FW).
Themean of the predicted values for the four targetareas usually measured was 22.2mg.100g-1 FW[(22.5+18.9+19.5+27.9)/4],whichwasquitecloseto themeanvitaminCcontent.Finally, thepredictedvalue of themean spectrum for the four target areaswas 20.4,whichwas quite close to themean of thepredictedvitaminCcontentinthefourtargetareasandveryclosetothemeanvitaminCcontent.
For the other apples (with no reference values),thepredictedvalues showedvitaminC content to bein the same range as that for apple no.3.Again, theresultsshowedthatthemeansofthepredictedvaluesforthefourtargetareasusuallymeasuredwerealwaysclose to the means of the predicted values of theentireapple.Thedifferencesbetweenthemeanofthepredictedvaluesinthesetargetareasandthemeanofthe predicted values of the entire apple ranged from0.7to5%.
‘Pilot’.Asobservedfor‘Hidala’, thepredictedmeanvitaminC content varied slightly among fruits. Thedistributionvariedamongapples.Thehighestvaluesweregenerallyobservedforlongitudinalpieces1and8,which are themost colored regions of the apples,andforverticalpiecesAandB(datanotshown).
Table 10.PredictedvitaminCcontent(mg.100g-1FW)forappleno.3of‘Hidala’and‘Pilot’,accordingtotargetarea:longitudinalpiece(1-8)andverticalpiece(A,B,C)—Contenu en vitamine C (mg.100 g-1 MF) pour la pomme n°3 des variétés ‘Hidala’ et ‘Pilot’ en fonction de la zone : portion longitudinale (1-8) et portion verticale (A, B, C).
‘Hidala’1 2 3 4 5 6 7 8 Mean
A 24.1 17.1 19.0 16.5 13.1 23.0 25.5 24.3 20.3B 22.5 18.4 18.9 16.4 19.5 22.3 27.9 26.6 21.6C 30.9 24.8 18.9 15.7 11.0 19.9 27.9 25.4 21.8Mean 25.8 20.1 19.0 16.2 14.5 21.7 27.1 25.5 21.2
‘Pilot’1 2 3 4 5 6 7 8 Mean
A 26.9 24.0 23.9 22.2 22.5 23.2 27.3 28.9 24.9B 24.8 20.2 22.3 21.4 20.2 23.4 28.4 25.5 23.3C 23.6 18.5 22.1 18.9 19.7 22.7 26.9 27.0 22.5Mean 25.1 20.9 22.7 20.8 20.8 23.1 27.5 27.1 23.9
Table 9. Calibration results for the vitamin C content (mg.100 g-1 FW) obtained usingMLR on the spectral range of408-2,498nmforthevarieties‘Hidala’and‘Pilot’—Résultats du modèle de calibration pour le contenu en vitamine C (mg.100 g-1 MF) obtenu avec MLR sur la gamme spectrale allant de 408 à 2 498 nm pour les variétés ‘Hidala’ et ‘Pilot’.
n Mean SD SEC RSQ SECV RPD Nb terms‘Hidala’ 24 20.50 5.02 2.70 0.71 4.53 1.11 3‘Pilot’ 24 21.00 4.37 1.90 0.81 2.79 1.57 3Abbreviations—abréviations:seetable 3—voirtableau 3.
Predicted vitamin C content (µg.100 g-1 DM)
Ref
eren
ce v
itam
in C
con
tent
(100
µg.
g-1 D
M)
5 10 15 20 25 30 35
35
30
25
20
15
10
5
Figure 3.Correlationbetween thepredictedandreferencevitamin C values expressed in mg.100 g-1 FW for bothvarieties — Corrélation entre les valeurs prédites et de référence de la vitamine C exprimée en mg.100 g-1 MF pour les deux variétés.
304 Biotechnol. Agron. Soc. Environ. 201216(3),294-306 PissardA.,BaetenV.,RomnéeJ.-M.etal.
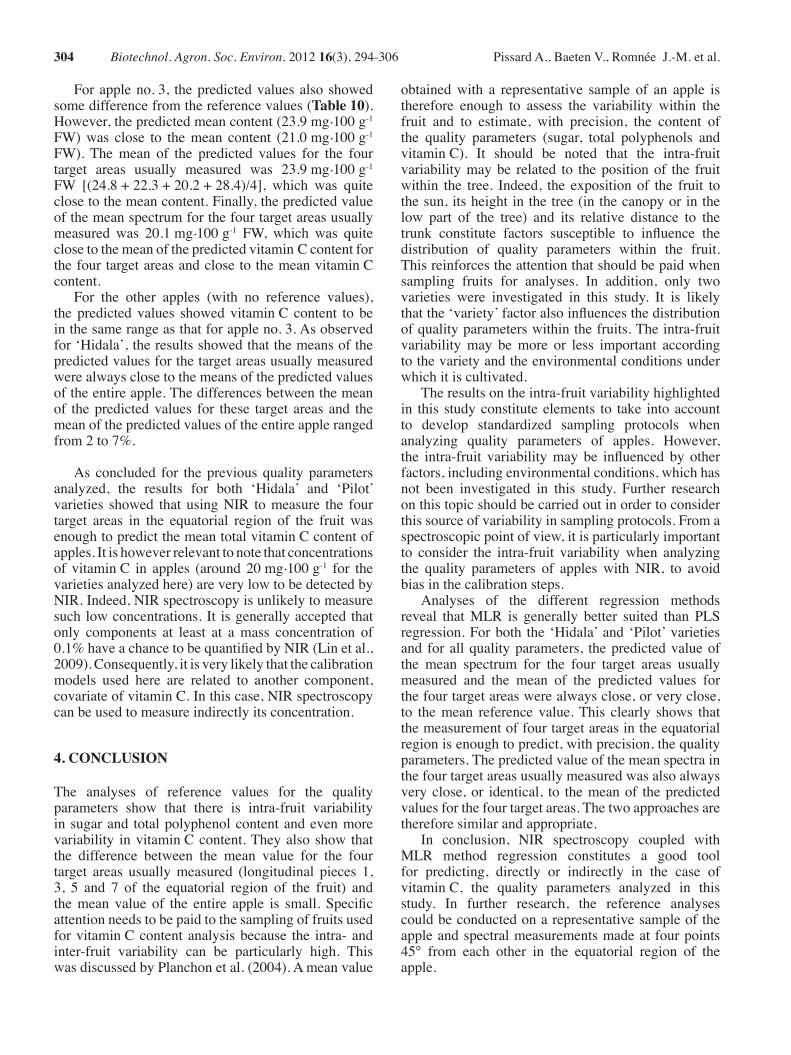
Forappleno.3, thepredictedvaluesalsoshowedsomedifferencefromthereferencevalues(Table 10).However,thepredictedmeancontent(23.9mg.100g-1FW)was close to themean content (21.0mg.100g-1FW).Themean of the predicted values for the fourtarget areas usually measured was 23.9mg.100g-1FW [(24.8+22.3+20.2+28.4)/4], which was quiteclosetothemeancontent.Finally,thepredictedvalueofthemeanspectrumforthefourtargetareasusuallymeasured was 20.1mg.100g-1 FW, which was quiteclosetothemeanofthepredictedvitaminCcontentforthefourtargetareasandclosetothemeanvitaminCcontent.
For the other apples (with no reference values),thepredictedvalues showedvitaminC content to beinthesamerangeasthatforappleno.3.Asobservedfor‘Hidala’,theresultsshowedthatthemeansofthepredictedvaluesforthetargetareasusuallymeasuredwerealwaysclosetothemeansofthepredictedvaluesoftheentireapple.Thedifferencesbetweenthemeanof thepredictedvalues for these target areasand themeanofthepredictedvaluesoftheentireapplerangedfrom2to7%.
As concluded for thepreviousqualityparametersanalyzed, the results for both ‘Hidala’ and ‘Pilot’varieties showed that usingNIR tomeasure the fourtarget areas in the equatorial region of the fruit wasenoughtopredictthemeantotalvitaminCcontentofapples.Itishoweverrelevanttonotethatconcentrationsof vitaminC in apples (around 20mg.100g-1 for thevarietiesanalyzedhere)areverylowtobedetectedbyNIR.Indeed,NIRspectroscopyisunlikelytomeasuresuchlowconcentrations.It isgenerallyacceptedthatonly components at least at amass concentration of0.1%haveachancetobequantifiedbyNIR(Linetal.,2009).Consequently,itisverylikelythatthecalibrationmodels used here are related to another component,covariateofvitaminC.Inthiscase,NIRspectroscopycanbeusedtomeasureindirectlyitsconcentration.
4. CONCLUSION
The analyses of reference values for the qualityparameters show that there is intra-fruit variabilityinsugarand totalpolyphenolcontentandevenmorevariability invitaminCcontent.Theyalsoshow thatthe difference between the mean value for the fourtarget areas usuallymeasured (longitudinal pieces 1,3, 5 and 7 of the equatorial region of the fruit) andthemean value of the entire apple is small. SpecificattentionneedstobepaidtothesamplingoffruitsusedforvitaminCcontentanalysisbecause the intra-andinter-fruit variability can be particularly high. ThiswasdiscussedbyPlanchonetal.(2004).Ameanvalue
obtainedwith a representative sample of an apple istherefore enough to assess the variability within thefruit and to estimate, with precision, the content ofthe quality parameters (sugar, total polyphenols andvitaminC). It should be noted that the intra-fruitvariabilitymaybe related to thepositionof the fruitwithin the tree. Indeed, the expositionof the fruit tothesun,itsheightinthetree(inthecanopyorinthelow part of the tree) and its relative distance to thetrunk constitute factors susceptible to influence thedistribution of quality parameters within the fruit.Thisreinforcestheattentionthatshouldbepaidwhensampling fruits for analyses. In addition, only twovarieties were investigated in this study. It is likelythatthe‘variety’factoralsoinfluencesthedistributionofqualityparameterswithinthefruits.Theintra-fruitvariabilitymay bemore or less important accordingtothevarietyandtheenvironmentalconditionsunderwhichitiscultivated.
Theresultsontheintra-fruitvariabilityhighlightedin this studyconstituteelements to take intoaccountto develop standardized sampling protocols whenanalyzing quality parameters of apples. However,the intra-fruit variabilitymay be influenced by otherfactors,includingenvironmentalconditions,whichhasnot been investigated in this study. Further researchonthistopicshouldbecarriedoutinordertoconsiderthissourceofvariabilityinsamplingprotocols.Fromaspectroscopicpointofview,itisparticularlyimportantto consider the intra-fruit variabilitywhen analyzingthe quality parameters of apples with NIR, to avoidbiasinthecalibrationsteps.
Analyses of the different regression methodsreveal thatMLR is generally better suited than PLSregression.Forboth the ‘Hidala’and ‘Pilot’varietiesand forallqualityparameters, thepredictedvalueofthe mean spectrum for the four target areas usuallymeasured and the mean of the predicted values forthefourtargetareaswerealwaysclose,orveryclose,to themean reference value.This clearly shows thatthemeasurementoffourtargetareasintheequatorialregionisenoughtopredict,withprecision,thequalityparameters.Thepredictedvalueofthemeanspectrainthefourtargetareasusuallymeasuredwasalsoalwaysveryclose,or identical, to themeanof thepredictedvaluesforthefourtargetareas.Thetwoapproachesarethereforesimilarandappropriate.
In conclusion, NIR spectroscopy coupled withMLR method regression constitutes a good toolfor predicting, directly or indirectly in the case ofvitaminC, the quality parameters analyzed in thisstudy. In further research, the reference analysescouldbeconductedonarepresentativesampleoftheappleandspectralmeasurementsmadeatfourpoints45° from each other in the equatorial region of theapple.

ClassicalandNIRmeasurementsofthequalityofapples 305
Acknowledgements
ThisworkwassupportedbytheMoermanfundswithintheframework of the POMINNO project entitled “Recherche de méthodes rapides de sélection de variétés innovantes de pommes de qualités différenciées et adaptées à une agriculture durable”.
Bibliography
AngraS.K.,DimriA.K.&KapurP.,2009.Non-destructiveevaluation of apples of different origin using NearInfrared filter based reflectance spectroscopy. Instrum. Sci. Technol.,37(2),241-253.
BobelynE.etal.,2010.PostharvestqualityofapplepredictedbyNIR-spectroscopy:studyofthebiologicalvariabilityon spectra and model performance. Postharvest Biol. Technol.,55(3),133-143.
BoyerJ.&LiuR.H.,2004.Applephytochemicalsandtheirhealthbenefits.Nutr. J.,3,5-30.
CampsC., SiegristJ.-P. & ChristenD., 2008. Qualité desfruits:mesurenondestructiveparspectroscopieprocheinfrarougeportable.Rev. Suisse Vitic. Arboric. Hortic.,40(3),151-157.
CiottiM. et al., 1998. Non-destructive determination ofsolublesolidsinapplefruitbyNearInfraredSpectroscopy(NIRS).Postharvest Biol. Technol.,14(1),21-27.
ClarkC.J.,McGloneV.A.& JordanR.B., 2003.Detectionofbrownheartin‘Braeburn’applebytransmissionNIRspectroscopy.Postharvest Biol. Technol.,28(1),87-96.
FloresK. et al., 2008. Prediction of total soluble solidcontentinintactandcutmelonsandwatermelonsusingnearinfraredspectroscopy.J. Near Infrared Spectrosc.,16,91-98.
FuX., YingY., ZhouY. & XuH., 2008. Application ofNIR spectroscopy for firmness evaluation of peaches.J. Zhejiang Univ. Sci.,9(7),552-557.
GuillerminP.&CampsC., 2005.Detection of bruises onapples byNear Infrared Reflectance Spectroscopy. In:MencarelliF. &TonuttiP., eds. Proceedings of the 5thInternationalPostharvestSymposium,6-11 June2004,Verona,Italy.Acta Hortic.,682.
HeY.,LiX.&ShaoY.,2007.FastdiscriminationofapplevarietiesusingVis/NIRspectroscopy.Int. J. Food Prop.,10(1),9-18.
LammertynJ.etal.,1998.Non-destructivemeasurementofacidity,solublesolids,andfirmnessofJonagoldapplesusing NIR spectroscopy. Trans. ASAE, 41(4), 1089-1094.
LateurM., 2003. The integration of different sectors is akey factor for theconservation, theevaluationand theutilization of our Belgian fruit tree biodiversity. Bull. Inst. R. Sci. Nat.Belg. Biol.,73,85-95.
LateurM.&PopulerC.,1994.Screeningfruittreegeneticresources in Belgium for disease resistance and otherdesirablecharacters.Euphytica,77,147-153.
LateurM.,PissardA.,DonisT.&JamarL.,2009.Créationet expérimentation de variétés de pommes adaptéesà l’Agriculture Biologique. In : Actes des Journées Techniques Nationales Fruits et Légumes Biologiques, 8-9 December 2009, Paris, France.Paris:ITAB-GRAB,39-47.
LinH. & YingY., 2009. Theory and application of nearinfrared spectroscopy in assessment of fruit quality: areview.Sens. Instrum. Food Qual. Saf.,3,130-141.
LiuY.D.&YingY.B.,2004.MeasurementofsugarcontentinFujiapplesbyFT-NIRspectroscopy.J. Zhejiang Univ. Sci.,5(6),651-655.
LiuY.D., YingY.B. & FuX.P., 2005. Prediction of validacidity in intact apples with Fourrier transform NearInfrared Spectroscopy. J. Zhejiang Univ. Sci.B, 6(3),158-164.
LiuY.D.,YingY.B.&JiangH.Y.,2006.Rapiddeterminationof maturity in apple using outlier detection andcalibration model optimization. Trans. ASABE, 49(1),91-95.
LiuY.D.,YingY.B.,FuX.P.&LuH.S.,2007.ExperimentsonpredictionsugarcontentinapplesbyFT-NIRtechnique.J. Food Eng.,80(3),986-989.
LuR.F.,2004.Multispectralimagingforpredictingfirmnessand soluble solids content of apple fruit. Postharvest Biol. Technol.,31(2),147-157.
LuR.,GuyerD.E.&BeaudryR.M.,2000.DeterminationoffirmnessandsugarcontentofapplesusingNear-InfraredDiffuseReflectance.J. Texture Stud.,31,615-630.
MehinagicE. et al., 2003. Relationship between sensoryanalysis,penetrometryandvisible–NIRspectroscopyof apples belonging to different cultivars.Food Qual. Preference,14,473-484.
NicolaïB. et al., 2006. Non-destructive measurement ofbitterpitinapplefruitusingNIRhyperspectralimaging.Postharvest Biol. Technol.,40(1),1-6.
NicolaïB.etal.,2007.Non-destructivemeasurementoffruitandvegetablequalitybymeansofNIRspectroscopy:areview.Postharvest Biol. Technol.,46(2),99-118.
ParkB. et al., 2003. Near-Infrared diffuse reflectance forquantitative and qualitative measurement of solublesolidsandfirmnessofDeliciousandGalaapples.Trans. ASAE,46(6),1721-1731.
PazP. et al., 2009. Evaluating NIR instruments forquantitative and qualitative assessment of intact applequality.J. Sci. Food Agric.,89,781-790.
PeirsA.etal.,2003.EffectofbiologicalvariabilityontherobustnessofNIRmodelsforsolublesolidscontentofapples.Postharvest Biol. Technol.,28(2),269-280.
PlanchonV.&LateurM.,1999.Theuseofappleandpeargeneticresourcesforselectingpartiallydisease-resistantcultivarssuitableforjuiceprocessing.In:MichalczukL.&PlocharskiW., eds.Fruit and vegetables juices and drinks - Today and in the XXI Century.Rytro,Poland:Ministry of Agriculture and Rural Development ofPoland,237-242.
306 Biotechnol. Agron. Soc. Environ. 201216(3),294-306 PissardA.,BaetenV.,RomnéeJ.-M.etal.
PlanchonV., LateurM., DupontP. & LognayG., 2004.AscorbicacidlevelofBelgianapplegeneticresources.Sci. Hortic.,100,51-61.
QingZ., JiB.& ZudeM., 2008.Wavelength election forpredicting physicochemical properties of apple fruitbasedonNear-InfraredSpectroscopy.J. Food Qual.,30,511-526.
RomnéeJ.-M. et al., 2009. Ascorbic acid detection and quantification in apples: application of a UPLC-MSMS method, http://www.aoaceurope.com/2009/ROMNEE2.pdf,(10.06.2011).
SanchezN.H., LurolS., RogerJ.M. & Bellon-MaurelW.,2003.RobustnessofmodelsbasedonNIRspectra forsugar content prediction in apples. J. Near Infrared Spectrosc.,11,97-107.
SinnaeveG. et al., 2009.Use of NIR spectroscopy for the determination of internal quality of entire apples,http://orbi.ulg.ac.be/handle/2268/25464,(10.06.2011).
VanzaniP. et al., 2005. Major phytochemicals in applecultivars: contribution to peroxyl radical trappingefficiency.J. Agric. Food Chem.,53,3377-3382.
VaysseP. & LandryP., 2004. Pomme-poire de la récolte au conditionnement. Outils pratiques. Paris: CentreTechnique Interprofessionnel des Fruits et Légumes(Ctifl).
VrohvsekU., RigoA., TononD. & MattiviF., 2004.Quantitationofpolyphenolsindifferentapplevarieties.J. Agric. Food Chem.,52(21),6532-6538.
WestwoodM.N., 1993. Temperate-zone pomology. Physiology and culture. 3rd ed. Portland, OR, USA:TimberPress,Inc.
ZudeM.etal.,2006.Non-destructivetestsonthepredictionofapplefruitfleshfirmnessandsolublesolidscontentontreeandshelflife.J. Food Eng.,77(2),254-260.
(38ref.)