class :………………………………………………………… secret success … ·...
TRANSCRIPT

NAME :…………………………………………………………
CLASS :…………………………………………………………
TEACHER’S NAME :…………………………………………………………
THE REAL SECRET OF SUCCESS IS ENTHUSIASM A w e s o m e p h y s i c s i s a r o u n d y o u

Awesome physics @mrsm TERENDAK 2019 #believe in your dream 2
PART 1 A. Identify the physical quantity through the instrument given. Write down the answers in the spaces provided.
NO. INSTRUMENT PHYSICAL QUANTITY SI UNIT SYMBOL 1. Ammeter current Ampere A 2. Voltmeter
3. Thermometer
4. Meter rule
5. Measuring cylinder
6. Bourdon Gauge
7. Micrometer screw gauge
8. Vernier calipers
9. Stopwatch
10. Compression balance
B. Identify the sensitivity of the instrument. 1.
Sensitivity : …………………………..
Reading : …………………………..
Thermometer
FOCUS & SCIENCE SKILL: - Measurement - Identify variables - Tabulate data

Awesome physics @mrsm TERENDAK 2019 #believe in your dream 3
2.
Sensitivity : …………………………..
Reading : …………………………..
Milliammeter
3.
Sensitivity : …………………………..
Reading : …………………………..
Voltmeter

Awesome physics @mrsm TERENDAK 2019 #believe in your dream 4
4.
Sensitivity : …………………………..
Reading : …………………………..
Protractor
5.
Sensitivity : …………………………..
Reading : …………………………..
Stopwatch

Awesome physics @mrsm TERENDAK 2019 #believe in your dream 5
C. Measure the physical quantity through the instrument given and tabulate data. Identify the variable for this experiment. QUESTION 1 A student carries out an experiment to investigate the relationship between time, t and temperature, θ of a copper block.
Diagram 1 shows the reading of the initial temperature, θ before the heater is switched on.
θo : …………………………..
Diagram 1
Diagram 2, 3,4,5 and 6 show the temperature, θi when the heater is switched on for 1 minute. Record the reading of θi and calculate the temperature change.
Time, t = 1 minute
θo : …………………………..
∆θ = θi - θo
∆θ = ………………………….
Diagram 2
Time, t = 2 minutes
θo : …………………………..
∆θ = θi - θo
∆θ = ………………………….
Diagram 3

Awesome physics @mrsm TERENDAK 2019 #believe in your dream 6
Time, t = 3 minutes
θo : …………………………..
∆θ = θi - θo
∆θ = ………………………….
Diagram 4
Time, t = 4 minutes
θo : …………………………..
∆θ = θi - θo
∆θ = ………………………….
Diagram 5
Time, t = 5 minutes
θo : …………………………..
∆θ = θi - θo
∆θ = ………………………….
Diagram 6
Based on aim of the experiment, identify : The manipulated variable : ……………………………………………………………………………………….. The responding variable : ……………………………………………………………………………………….. The constant variable: …………………………………………………………………………………………….
[3 marks]

Awesome physics @mrsm TERENDAK 2019 #believe in your dream 7
Tabulate your results for all values of t, θi and ∆θ in the space below.
[3 marks]
Awesome physics @mrsm TERENDAK 2019 #believe in your dream 8
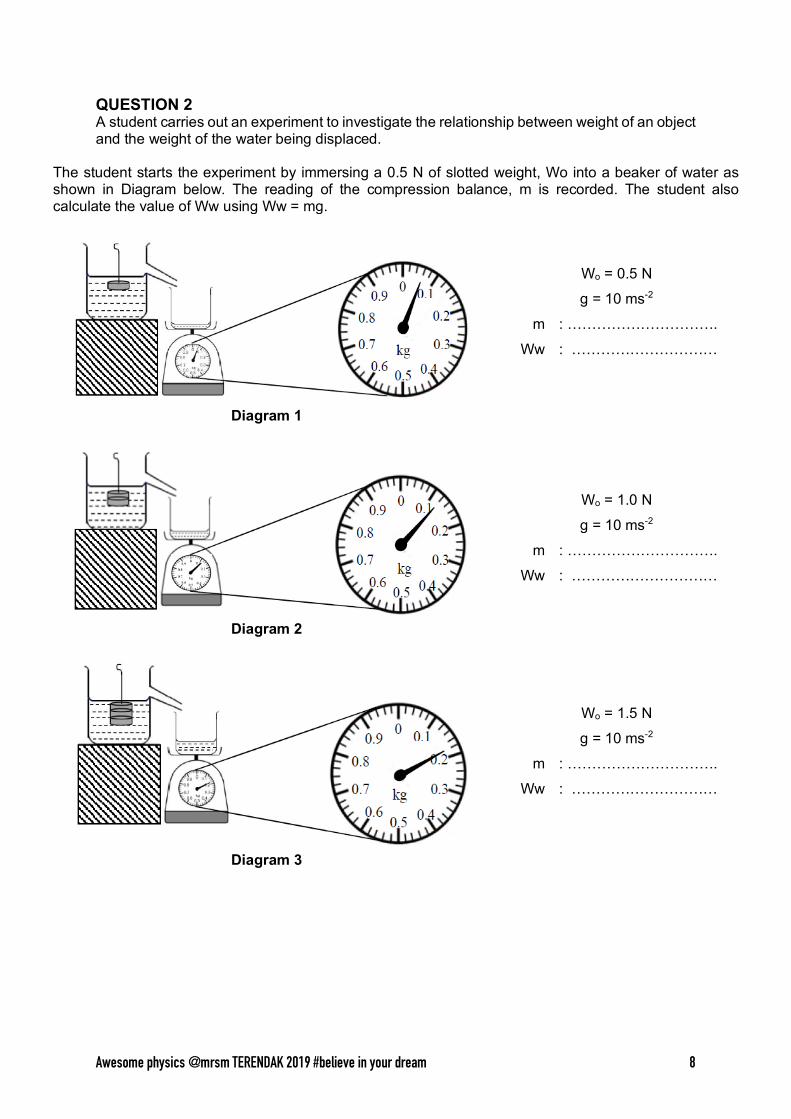
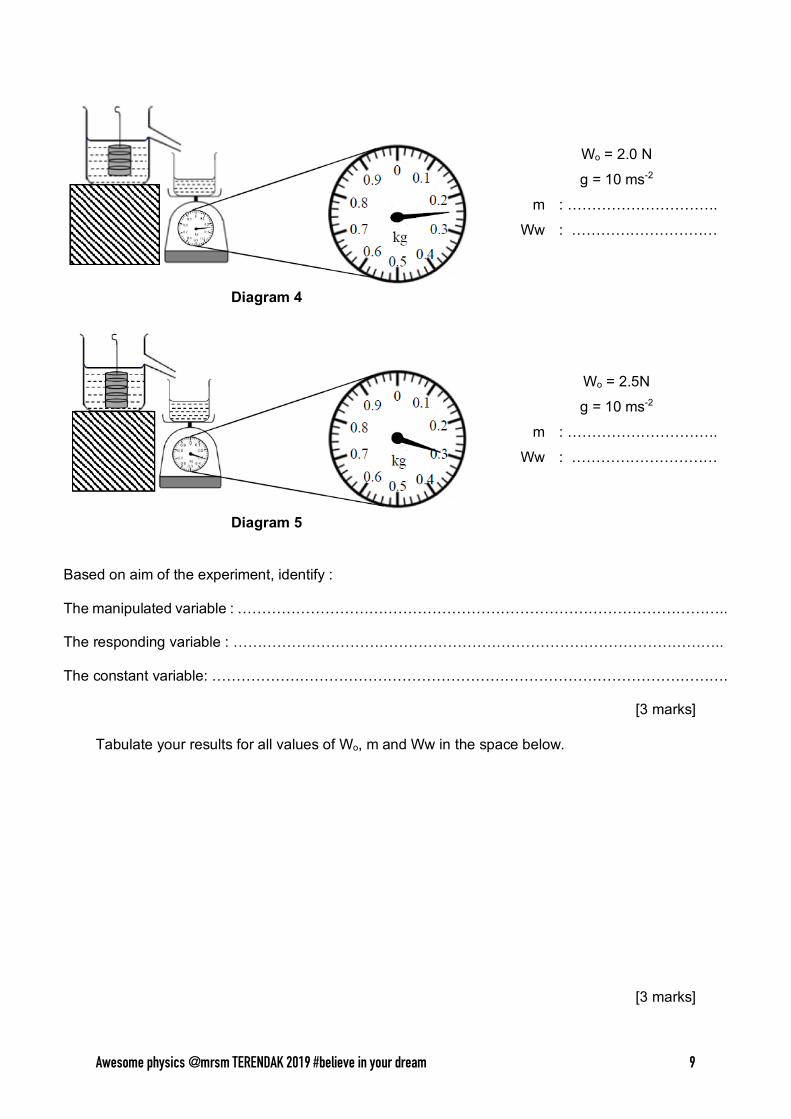
QUESTION 2 A student carries out an experiment to investigate the relationship between weight of an object and the weight of the water being displaced.
The student starts the experiment by immersing a 0.5 N of slotted weight, Wo into a beaker of water as shown in Diagram below. The reading of the compression balance, m is recorded. The student also calculate the value of Ww using Ww = mg.
Diagram 1
Wo = 0.5 N
g = 10 ms-2
m : ………………………….
Ww : …………………………
Diagram 2
Wo = 1.0 N
g = 10 ms-2
m : ………………………….
Ww : …………………………
Diagram 3
Wo = 1.5 N
g = 10 ms-2
m : ………………………….
Ww : …………………………
Awesome physics @mrsm TERENDAK 2019 #believe in your dream 9
Diagram 4
Wo = 2.0 N
g = 10 ms-2
m : ………………………….
Ww : …………………………
Diagram 5
Wo = 2.5N
g = 10 ms-2
m : ………………………….
Ww : …………………………
Based on aim of the experiment, identify : The manipulated variable : ……………………………………………………………………………………….. The responding variable : ……………………………………………………………………………………….. The constant variable: …………………………………………………………………………………………….
[3 marks]
Tabulate your results for all values of Wo, m and Ww in the space below.
[3 marks]

Awesome physics @mrsm TERENDAK 2019 #believe in your dream 10
PART 2
1. Based on the Table 1.
Force, F (N) Acceleration, a (cms-2) 1.0 6.0 2.0 15.0 3.0 19.0 4.0 25.0 5.0 32.0
Table 1
a. On the graph, plot a graph of a against F. [ 5 marks] b. Based on the graph, state the relationship between a and F.
…..…………………………………………………………………………………………….
[1 mark ]
2. Based on the Table 2.
Force , W (N) Extension, x (cm) 30 27.5 40 37.5 50 46.0 60 55.5 70 74.5
Table 2
a. On the graph, plot a graph of x against W. [ 5 marks] b. Based on the graph, state the relationship between x and W.
…..…………………………………………………………………………………………….
[1 mark ]
FOCUS & SCIENCE SKILL: - Plotting Graph and make a
relationship from the graph

Awesome physics @mrsm TERENDAK 2019 #believe in your dream 11
3. Based on the Table 3.
Temperature θ / °C Length, x (cm) 0 2.0
20 3.7 40 5.2 60 6.7 80 8.3 100 10.0
Table 3
a. On the graph, plot a graph of θ against x. [ 5 marks] b. Based on the graph, state the relationship between θ and x.
…..…………………………………………………………………………………………….
[1 mark ]
4. Based on the Table 4.
L (cm) I (A) (A-1)
100.0 0.75 1.33 90.0 0.85 1.18 80.0 0.95 1.05 70.0 1.10 0.91 60.0 1.30 0.77 50.0 1.55 0.65 40.0 1.90 0.53
Table 4
a. On the graph, plot a graph of against L. [ 5 marks]
b. Based on the graph, state the relationship between and L.
…..…………………………………………………………………………………………….
[1 mark ]
“When you have fun, it changes all the pressure into pleasure”
1I
1I
1I

Awesome physics @mrsm TERENDAK 2019 #believe in your dream 12
PART 3
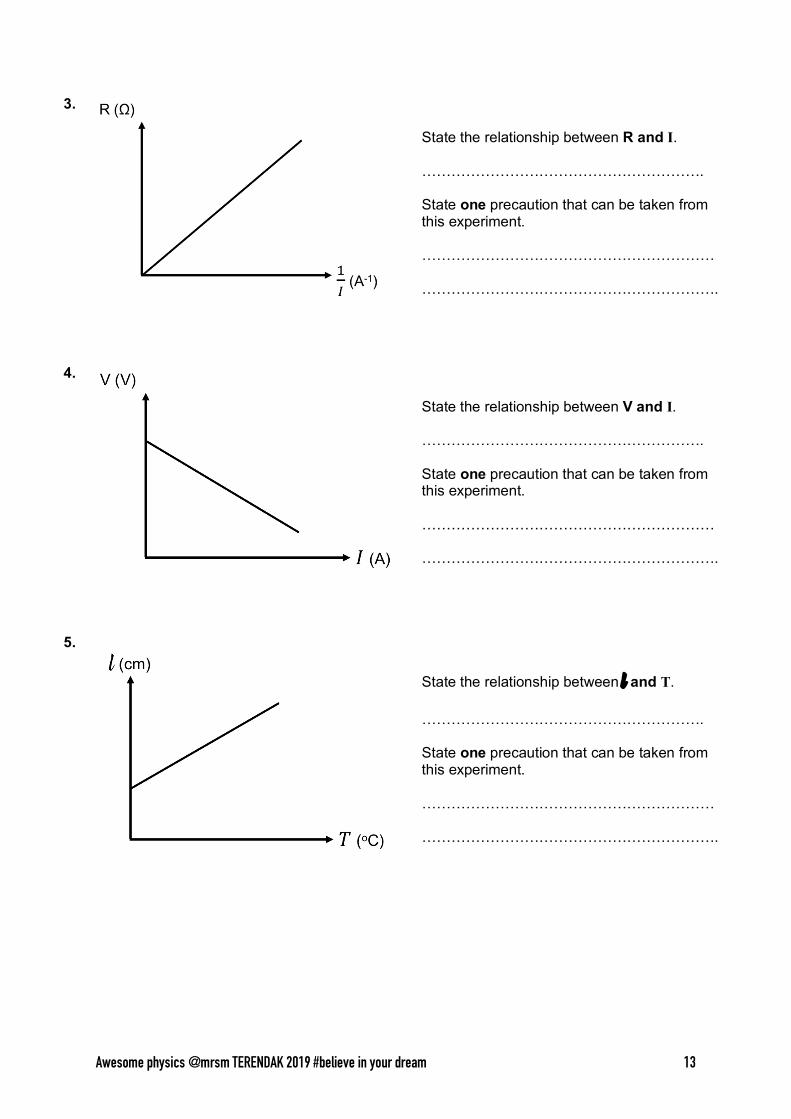
A. From the graph given, make a relationship between the variable and state the precaution that can be made for that experiment.
1.
State the relationship between x and y. …………………………………………………. State one precaution that can be taken from this experiment. …………………………………………………… …………………………………………………….
2.
a = distance between two slit x = distance between two consecutive bright fringes
State the relationship between x and a. …………………………………………………. State one precaution that can be taken from this experiment. …………………………………………………… …………………………………………………….
FOCUS & SCIENCE SKILL: - Make relationship and safety
precaution from the graph. - Draw a triangle for gradient,
calculate the gradient and relate the gradient with the formula given.
Awesome physics @mrsm TERENDAK 2019 #believe in your dream 13
3.
State the relationship between R and I. …………………………………………………. State one precaution that can be taken from this experiment. …………………………………………………… …………………………………………………….
4.
State the relationship between V and I. …………………………………………………. State one precaution that can be taken from this experiment. …………………………………………………… …………………………………………………….
5.
State the relationship between l and T. …………………………………………………. State one precaution that can be taken from this experiment. …………………………………………………… …………………………………………………….

Awesome physics @mrsm TERENDAK 2019 #believe in your dream 14
B. Draw a triangle for gradient, calculate the gradient and relate the gradient with the formula given. QUESTION 1 A piece of wood is submerged in sea water. A student carries out an experiment to investigate the relationship between pressure due to the sea water , P exerted on the wood and depth of water, h. The results of the experiment are shown in the graph of P against h in Diagram 1.1.
Diagram 1.1

Awesome physics @mrsm TERENDAK 2019 #believe in your dream 15
(a) Based on the graph in Diagram 1.1 (i) Calculate the gradient, k, of the graph.
Show on the graph how you calculate k. k = ……………………………………………………………
[3 marks]
(b) The density of sea water, d used can be determined using the formula
𝑑 =𝑘𝑔
where , k is the gradient of graph and g is gravitational acceleration with value, g = 10.0 ms-2. Calculate the value of d.
d = …………………………………………………… [3 marks]

Awesome physics @mrsm TERENDAK 2019 #believe in your dream 16
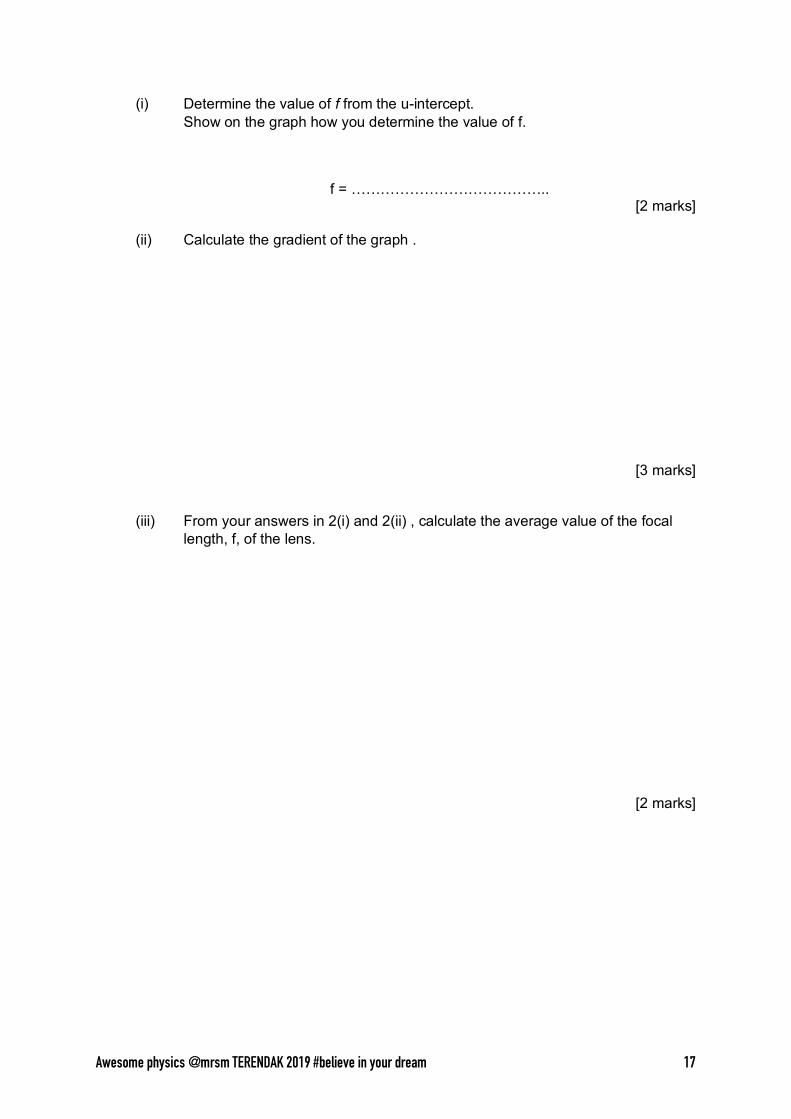
QUESTION 2 A student carries out an experiment to investigate the relationship between the object distance, u and linear magnification, M of the image formed by a convex lens.
The results of this experiment are shown in a graph of u against %&
in Diagram 2.2. The results are used to determine the focal length of the convex lens.
Diagram 2.2
Awesome physics @mrsm TERENDAK 2019 #believe in your dream 17
(i) Determine the value of f from the u-intercept. Show on the graph how you determine the value of f.
f = ………………………………….. [2 marks]
(ii) Calculate the gradient of the graph .
[3 marks]
(iii) From your answers in 2(i) and 2(ii) , calculate the average value of the focal length, f, of the lens.
[2 marks]

Awesome physics @mrsm TERENDAK 2019 #believe in your dream 18
PRECAUTION STEPS FOR
INVESTIGATIVE EXPERIMENTS
NO. TYPE OF
EXPERIMENT INVOLVING
PRECAUTIONS THAT CAN BE TAKEN
1 Light a. Do the experiment in a dark room to get clear and sharp image
b. Lens, screen and object must be in line and of same level c. Make sure our eyes perpendicular to the reading of
meter rule to avoid parallax error
2 Spring a. Make sure the spring is not loaded beyond the elastic limit (spring return to original length when load is taken off)
b. Make sure our eyes perpendicular to the reading of meter rule to avoid parallax error
3 Electric / Electronic a. Make sure all the connections are correctly and tightly b. Switch off the circuit after taking the reading to avoid over
heating of the wires (resistance increase) c. Make sure our eyes perpendicular to the reading of
ammeter / voltmeter to avoid parallax error
4 Heat a. Stirred the liquid constantly, so the temperature rises evenly
b. Aluminium block must be wrapped with insulating material to prevent heat lost
c. Thermometer bulb should be smeared with oil to give better thermal contact with the block
d. Make sure our eyes perpendicular to the reading of thermometer to avoid parallax error
5 Measuring
instrument such as ammeter, voltmeter, meter rule etc.
Make sure our eyes perpendicular to the reading of ......................... (instrument) to avoid parallax error

Awesome physics @mrsm TERENDAK 2019 #believe in your dream 19
SECTION B
PLANNING EXPERIMENT INFERENCE RV depends on MV
HYPHOTESIS MV increase, RV increase
OR MV increase, RV decrease
AIM To investigate the relationship between ……….MV……….. and ……….RV…………….
VARIABLES MV : RV : FV :
LIST OF APPARATUS
ARRANGEMENT OF APPARATUS
PROCEDURE
TABULATE DATA
MV RV
ANALYSING DATA
RV
MV

Awesome physics @mrsm TERENDAK 2019 #believe in your dream 20
OPERATIONAL DEFINITION INERTIA: Time taken for one complete oscillation // Period
PRESSURE IN LIQUID: Different height in manometer
VOLUME OF GAS: Length of mercury or sulfuric acid // Length of trapped air
STRENGTH OF ELECTROMAGNET: Number of pins attracted
SPEED OF ROTATION: Height of magnet bar released BRIGHTER: Current flow
Awesome physics @mrsm TERENDAK 2019 #believe in your dream 21
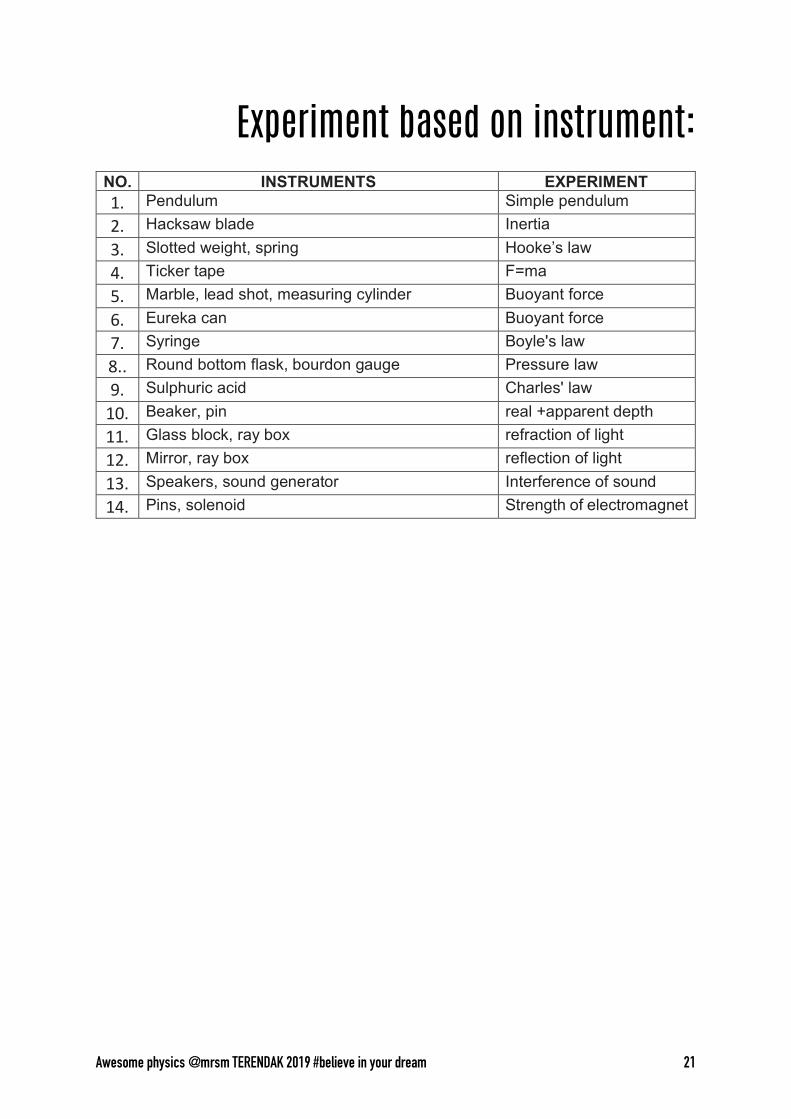
Experiment based on instrument: NO. INSTRUMENTS EXPERIMENT 1. Pendulum Simple pendulum 2. Hacksaw blade Inertia 3. Slotted weight, spring Hooke’s law 4. Ticker tape F=ma 5. Marble, lead shot, measuring cylinder Buoyant force 6. Eureka can Buoyant force 7. Syringe Boyle's law 8.. Round bottom flask, bourdon gauge Pressure law 9. Sulphuric acid Charles' law
10. Beaker, pin real +apparent depth 11. Glass block, ray box refraction of light 12. Mirror, ray box reflection of light 13. Speakers, sound generator Interference of sound 14. Pins, solenoid Strength of electromagnet

Awesome physics @mrsm TERENDAK 2019 #believe in your dream 22
PART 4
A. Simulation diagram, make an inference, aims, hypothesis and identify the variables. EXAMPLE 1 Diagram 1.1 shows a diver is diving in swimming pool. Diagram 1.2 shows the same diver is diving in sea water. He dives at the same depth, but he feels his ear sick when he diving in the sea water.
Diagram 1.1 Diagram 1.2
(a) INFERENCE Pressure in liquid depands on density (b) HYPOTHESIS Density increase, pressure in liquid (different height in manometer) increase (c) AIM To investigate the relationship between pressure in liquid (different height in
manometer) and density (d) VARIABLES MV
RV CV
: density : different height in manometer : depth
CLUE CAUSE (MV)
EFFECT (RV) EXPERIMENT
1. Swimming pool & sea water 2. Different density (ear sick) 3. Pressure increase 4. Same depth
Density Pressure
(different height in manometer)
PRESSURE IN LIQUID
FOCUS & SCIENCE SKILL: - Simulation diagram, make an inference, aims, hypothesis and identify the variables. - Diagram of arrangement of apparatus (construct the procedure, tabulate data and analyze graph).

Awesome physics @mrsm TERENDAK 2019 #believe in your dream 23
TASK 1
Diagram 1 shows two similar coffee maker A and B, containing different amount of coffee on similar hot plates stove. The coffee makers are heated by turning on the power supply of the hot plate. After few minutes, it was observed that the coffee in coffee maker B is hotter than the coffee in coffee maker A.
Diagram 1
Based on the situation described above,
(a) INFERENCE :
(b) HYPOTHESIS :
(c) AIM :
(d) VARIABLES MV RV CV
: : :
CLUE CAUSE (MV)
EFFECT (RV) EXPERIMENT

Awesome physics @mrsm TERENDAK 2019 #believe in your dream 24
TASK 2
Diagram 2 shows two opaque cups, A and B, containing different amount of water.A similar coin is placed at the bottom of each cup. When the coin is observed from the same position, the image of the coin in cup A cannot be seen, but the image of the coin in cup B can be seen.
Diagram 2
Based on the situation described above,
(a) INFERENCE :
(b) HYPOTHESIS :
(c) AIM :
(d) VARIABLES MV RV CV
: : :
CLUE CAUSE (MV)
EFFECT (RV) EXPERIMENT

Awesome physics @mrsm TERENDAK 2019 #believe in your dream 25
B. Diagram of arrangement of apparatus (construct the procedure, tabulate data and analyze graph). EXAMPLE 2
Experiment : Hooke’s Law
From the diagram above, state the procedure of the experiment which is the method of controlling the manipulated variable , method of measuring the responding variable and repeat the experiment.
PRO
CED
UR
E
MV
At least 2 statement
• Method how to control MV in this experiment • Initial value must be stated • Measuring instrument need to be stated
1. Measured the initial length of the spring, lo by using meter rule. 2. Slotted weight of 20 g is hung from the spring as shown on the diagram above.
The length of the spring, l is recorded.
RV
At least 2 statement
• Describe on how to measure RV • Measuring instrument need to be stated • State the formula if necessary
3. The extension of the spring, x is calculated by using the formula, x = l - lo
Repeat State at least 4 other value with correct units for MV
4. The experiment is repeated by using slotted weight 40 g, 60 g, 80 g and 100 g.

Awesome physics @mrsm TERENDAK 2019 #believe in your dream 26
Th
e w
ay to
tabu
late
the
data
. DATA TABULATION: REFER TO THE FOLLOWING TABLE
Mass , m/g Extension, x /cm 20 40 60 80
100
The
way
to a
naly
ze th
e da
ta.
DATA ANALYSIS : REFER GRAPH

Awesome physics @mrsm TERENDAK 2019 #believe in your dream 27
TASK 1
Experiment : Lens
From the diagram above, state the procedure of the experiment which is the method of controlling the manipulated variable, method of measuring the responding variable and repeat the experiment.
PRO
CED
UR
E MV
RV
Repeat
The
way
to ta
bula
te
the
data
.
The
way
to a
naly
ze
the
data
.

Awesome physics @mrsm TERENDAK 2019 #believe in your dream 28
TASK 2
Experiment : Pressure Law
From the diagram above, state the procedure of the experiment which is the method of controlling the manipulated variable, method of measuring the responding variable and repeat the experiment.
PRO
CED
UR
E MV
RV
Repeat
The
way
to ta
bula
te
the
data
.
The
way
to a
naly
ze
the
data
.

Awesome physics @mrsm TERENDAK 2019 #believe in your dream 29
TASK 3
Experiment : Ohm’s Law
From the diagram above, state the procedure of the experiment which is the method of controlling the manipulated variable, method of measuring the responding variable and repeat the experiment.
PRO
CED
UR
E MV
RV
Repeat
The
way
to ta
bula
te
the
data
.
The
way
to a
naly
ze
the
data
.
Dream big… Aim high… Never give up