class project report, may 2003 me/ce 449 sustainable air quality causality of us sulfur production...
Post on 20-Dec-2015
213 views
TRANSCRIPT

Class Project Report, May 2003 ME/CE 449 Sustainable Air Quality
Causality of US Sulfur Production and Emission Trends
By
James Agan, Kate Miller, Cat Reid, Jason Reynolds
Instructor
Rudolf B. Husar
Washington University, St. Louis, MO

Instructions
• Alan: 3, 6, 10, 11, 12
• Kate: 17- 23
• Cat: 4, 5, 14, 15, 16
• Jason: 7, 8, 9, 13, 24
• For each slide, add a very concise but informative description; 2-3 bullets
• It should contain key facts or observations
• Enter these under the slide in the ‘speakers note’
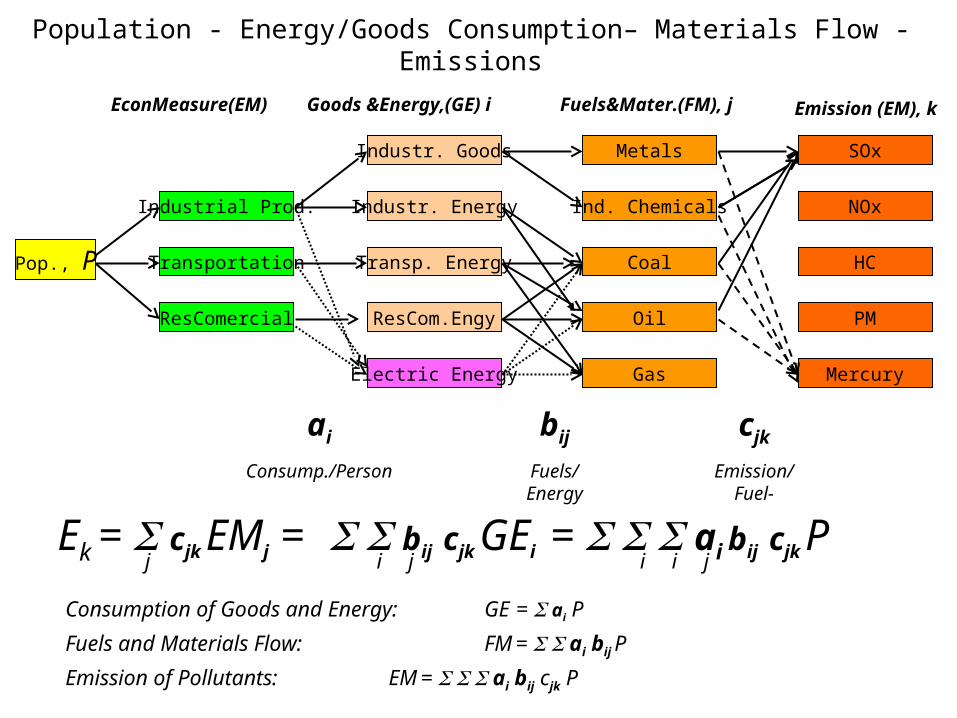
Population - Energy/Goods Consumption– Materials Flow - Emissions
Ek = cjk EMj = bij cjk GEi = ai bij cjk P
Industr. Energy
Transp. Energy
ResCom.Engy
Coal
Oil
GasElectric Energy
SOx
NOx
HC
PM
Goods &Energy,(GE) i Fuels&Mater.(FM), j Emission (EM), k
Ind. Chemicals
Industr. Goods
Pop., P
Metals
Mercury
ai
Consump./Person
bij
Fuels/Energy
cjk
Emission/Fuel-
j ji i i j
Consumption of Goods and Energy: GE = ai P
Fuels and Materials Flow: FM = ai bij P
Emission of Pollutants: EM = ai bij cjk P
Industrial Prod.
Transportation
ResComercial
EconMeasure(EM)

US Population Trends
0
100
200
300
400
500
600
1900 1950 2000 2050
Mill
ions
-3.00%
-2.00%
-1.00%
0.00%
1.00%
2.00%
3.00%
4.00%
1900 1950 2000 2050
Births Deaths Migration

Regional Population Projections
Regional Population Projections
0
10000
20000
30000
40000
50000
60000
70000
80000
90000
1995 2000 2005 2010 2015 2020 2025
Year
Popu
lation
(tho
usan
ds)
R1 - Pacific Coast R2 - Mountain States R3 - Southwest
R4 - Great Plains R5 - Great Lakes R6 - South
R7 - Northeast R8 - Noncontinental US
Cat, place here a regional trend relative to 1995 to see regional growth rates
Use this map to show regions

National Income by Industry Group/Person
0
2000
4000
6000
8000
10000
12000
1900 1950 2000 2050 2100
Inco
me,
$ (
1996
)
Res/com
Industrial
Transportation 0.00
0.20
0.40
0.60
0.80
1.00
1900 1950 2000 2050 2100
0
0.5
1
1.5
2
2.5
1900 1950 2000 2050 2100
Fraction of Total Income
Trend by Ind. Group
1970 = 1

Coal Production and S Content

Sulfur Transfer by Fuels and Minerals: Theory

Coal Sulfur Flow in 1980 and 1998

US Coal Production by Region
• Coal production in the US occurred over five major producing regions.• The coal production over the eastern US has remained roughly constant throughout the century.• The sharp increase since the 1980s is due to the addition of western coal.

Trend of Average Coal S Content

Flue Gas Desulfurisation (FGD) of El. Util. Coal
0
50
100
150
200
250
300
350
1900 1950 2000 2050
Ca
pa
city
, G
iga
Wa
tts
0.00
0.10
0.20
0.30
0.40
0.50
0.60
0.70
0.80
0.90
1.00
Fra
cti
on
FGD Capacity Coal El. Util.Capacity FGD Fraction


Sulfur Flow Diagram (Tentative)
Mineral Mining Production Consumption
AirLandWater
S Stocks Exp/Imp Raw
Fuel Mining Refining Combustion
Minerals Flow for GoodsMetals, Frasch, Pyrites
Fuels Flow for EnergyCoal, Oil, Gas
Exp/Imp Proc
Ex/Im Raw Ex/Im Processed
Exp/Imp AirEx/Im Water
S as Pollution S as Goods

US Industrial Sulfur: Supply and Demand Trend
US S Budget
S StocksExp/Imp
0
2
4
6
8
10
12
14
1900 1950 2000 2050
ExportsImports
0
2
4
6
8
10
12
14
1900 1950 2000 2050
US SupplyConsumption
-2
0
2
4
6
8
10
12
1900 1950 2000 2050
Sulfur Stock
Stock Change
0
2
4
6
8
10
12
14
1900 1950 2000 2050
S RecoveredS Mined
US S Supply US S Demand
Source http://minerals.usgs.gov/minerals/pubs/of01-006/sulfur.xls

Total S Mobilized and Recovered
0
2
4
6
8
10
12
14
1900 1950 2000 2050
Mill
ion
Ton
s/yr
CoalSMob OilSMob NGasSMobil
0
2
4
6
8
10
12
14
1900 1950 2000 2050
Mill
ion
To
ns/
yr
PetroleumSRec NatGasSRec MetalSRec
0
2
4
6
8
10
12
14
1900 1950 2000 2050
Mill
ion
To
ns/
yr
Pyrites S Mined Frash S Mined MetalsSMob
0
5
10
15
20
25
30
35
40
1900 1950 2000 2050
S RecoveredTotMobilized
Mobilized in Fuels
Mobilized in Minerals
Recovered from Fuels &
Min.
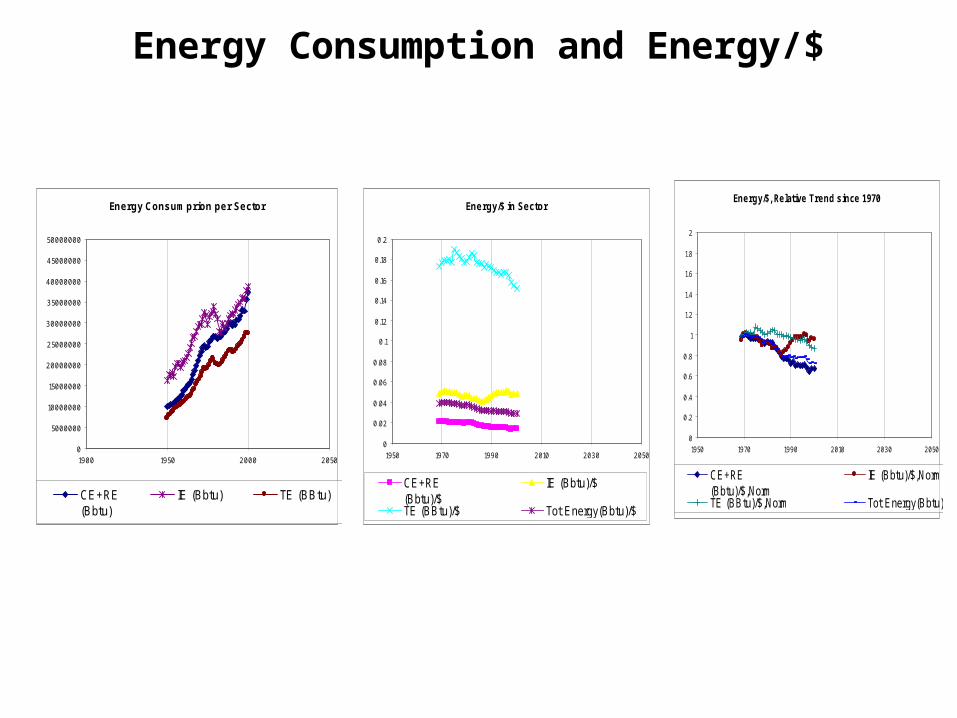
Energy Consumption and Energy/$
Energy Consum prion per Sector
0
5000000
10000000
15000000
20000000
25000000
30000000
35000000
40000000
45000000
50000000
1900 1950 2000 2050
CE+RE(Bbtu)
IE (Bbtu) TE (BBtu)
Energy/$ in Sector
0
0.02
0.04
0.06
0.08
0.1
0.12
0.14
0.16
0.18
0.2
1950 1970 1990 2010 2030 2050
CE+RE(Bbtu)/$
IE (Bbtu)/$
TE (BBtu)/$ Tot Energy(Bbtu)/$
Energy/$, Relative Trend s ince 1970
0
0.2
0.4
0.6
0.8
1
1.2
1.4
1.6
1.8
2
1950 1970 1990 2010 2030 2050
CE+RE(Bbtu)/$,Norm
IE (Bbtu)/$,Norm
TE (BBtu)/$,Norm Tot Energy(Bbtu)/$,Norm

SOx Emission Factor (Sox/Energy)
SOx per sector
0
2000
4000
6000
8000
10000
12000
14000
16000
18000
20000
1900 1920 1940 1960 1980 2000 2020 2040
CommResTotal IndRCTR TE Total
SOx/Enegy in Sector
0
0.1
0.2
0.3
0.4
0.5
0.6
0.7
0.8
0.9
1
1950 1970 1990 2010 2030 2050
CommRes SOx/ComRes EnergyInd SOx/Ind EnergyTransp Sox/ TranspEnegySox/Energy, All Sectors
SOx/Enegy in Sector, Relative Trend Since 1970
0
0.2
0.4
0.6
0.8
1
1.2
1.4
1.6
1.8
2
1950 1970 1990 2010 2030 2050
CommRes SOx/ComRes EnergyInd SOx/Ind EnergyTransp Sox/ TranspEnegySox/Energy, All Sectors

SOx Emission Trend By Industry Group and by
Fuel/Material
0
5000
10000
15000
20000
25000
30000
35000
1900 1920 1940 1960 1980 2000 2020 2040
ElUtil Ind RecComm Transport Metals Total
0.00
0.10
0.20
0.30
0.40
0.50
0.60
0.70
0.80
0.90
1.00
1900 1920 1940 1960 1980 2000 2020 2040
ElUtil Ind RecComm Transport Metals

Electric Utility & Metals Smelting
FUEL COM B. ELEC. UTIL.
0
2000
4000
6000
8000
10000
12000
14000
16000
18000
20000
1930 1940 1950 1960 1970 1980 1990 2000 2010
SO
2, 1
00 T
on
s/yr
El. Util CoalTot OilTot GasTot OtherTot
0
1000
2000
3000
4000
5000
6000
1930 1940 1950 1960 1970 1980 1990 2000 2010
Metal copper lead Ferrous Metals Processing

Industrial FUEL COM B. INDUSTRIAL
0
1000
2000
3000
4000
5000
6000
7000
8000
9000
10000
0 10 20 30 40 50 60 70
SO
2, 1
000
Tons
/ye
Industrial CoalTot OilTot GasTot OtherTot
CHEMICAL & ALLIED PRODUCT MFG
0
100
200
300
400
500
600
700
800
900
1000
1930 1940 1950 1960 1970 1980 1990 2000 2010
SO
2, 1
000
To
ns/
yr
Chemical sulfur compounds
Other Chemical Mfg Agricultural Chemical Mfg
PETROLEUM & RELATED INDUSTRIES
0
100
200
300
400
500
600
700
800
900
1000
1930 1940 1950 1960 1970 1980 1990 2000 2010
SO
2, 1
000
Tons
/yr
Petroleum Petroleum Ref ineries & Related Industries other pretroleum
0
100
200
300
400
500
600
700
800
900
1000
1930 1940 1950 1960 1970 1980 1990 2000 2010
OtherInd Wood, Pulp & Paper cement mfg other
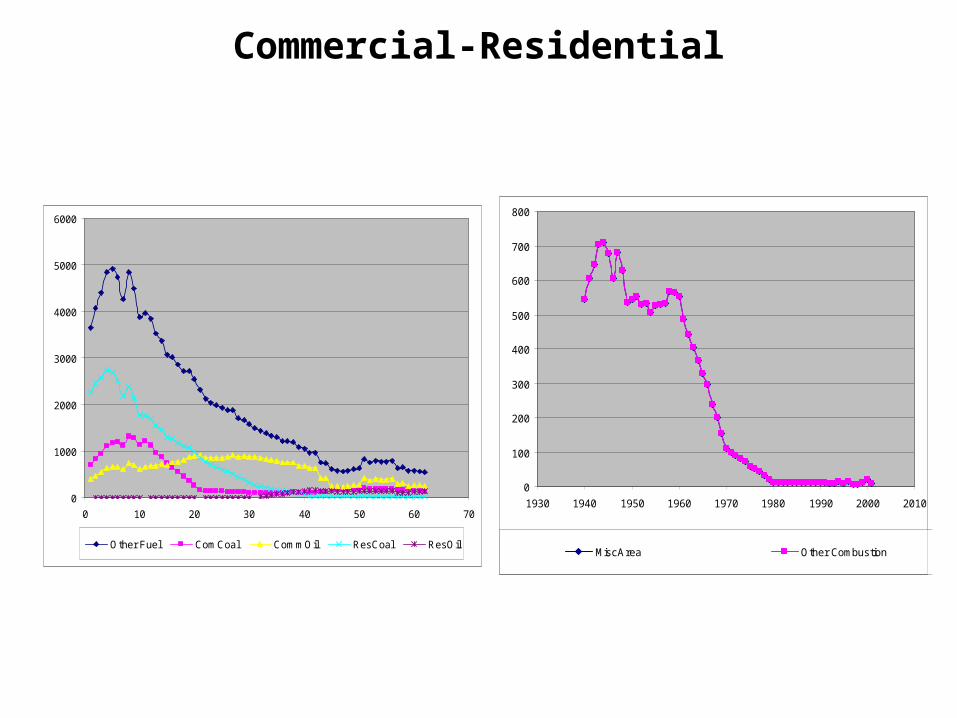
Commercial-Residential
0
1000
2000
3000
4000
5000
6000
0 10 20 30 40 50 60 70
Other Fuel ComCoal CommOil ResCoal ResOil
0
100
200
300
400
500
600
700
800
1930 1940 1950 1960 1970 1980 1990 2000 2010
MiscArea Other Combustion

Transportation
0
100
200
300
400
500
600
700
800
900
1000
1930 1940 1950 1960 1970 1980 1990 2000 2010
On Road Light-Duty Gas Vehicles & MotorcyclesLight-Duty Gas Trucks Heavy-Duty Gas VehiclesDiesels
0
500
1000
1500
2000
2500
3000
3500
4000
4500
5000
1930 1940 1950 1960 1970 1980 1990 2000 2010
NonRoad Marine Vessels Railroads Non-Road Diesel

SOX Emission Factors for Industry Groups