class-ifying london: questions of social division and...
TRANSCRIPT

Class-ifying London: Questioning Social Division and Space Claims in the Post-Industrial
Metropolis1
Mark Davidson* and Elvin Wyly**
* Graduate School of Geography, Clark University
** Department of Geography, University of British Columbia
Abstract: Richard Florida’s Rise of the Creative Class ends with a clarion call for a post-
industrial, post-class sensibility: “The task of building a truly creative society is not a game of
1 We are grateful for the valuable research assistance provided by members of the UBC Geography 450 Urban
Research studio, especially [insert credits here].
1

solitaire. This game, we play as a team.” Florida’s sentiment has been echoed across a broad and
interdisplinary literature in social theory and public policy, producing a new conventional
wisdom: that class antagonisms are redundant in today’s climate of competitive professionalism
and a dominant creative mainstream. Questions of social justice are thus deflected by
reassurances that there is no “I” in team, and that “we” must always be defined by corporate
membership rather than class-based solidarities. The post-industrial city becomes a post-political
city nurtured by efficient, market-oriented governance leavened with a generous dose of
multicultural liberalism. In this paper, we analyze how this Floridian fascination has spread into
debates on contemporary urban social structure and neighbourhood change. In particular, we
focus on recent arguments that London has become a thoroughly middle-class, postindustrial
metropolis. We evaluate the empirical claims and interpretive generalizations of this literature
by using the classical tools of urban factorial ecology to analyze small-area data from the UK
Census. Our analysis documents a durable, fine-grained geography of social class division in
London, which has been changed but not erased by ongoing processes of industrial and
occupational restructuring: the central tensions of class in the city persist. Without critical
empirical and theoretical analysis of the contours of post-industrial class division, the worsening
inequalities of cities like London will be de-politicized. We suggest that class-conscious
scholars should only head to Florida for Spring Break or retirement.
Introduction
2

Post--industrialism, it seems, heralds a post-materialist, post-social-theory world without
class antagonisms. Cities -- the dense concentrations of inequality and terminal class conflict
that inspired Marx and Engels -- are now typically approached via theories and policies that
carefully avoid any explicit reference to class politics. Richard Florida provides the most vivid
example. Cities throughout the world urban system have sought Florida’s advice on how to
begin or sustain economic revitalization, but all of the refined, market-tested PowerPoint
performances conceal an essential paradox: attracting the creative class is about avoiding all
serious thought about the fundamental meanings and inequalities of ... class. Florida (and others
such as Charles Landry, 2008) preach and (re)create a rhetorical hegemony where class is
stripped of antagonism, so that discussions of opportunity and wealth can proceed until
eventually there is no need to even mention the word ... class. The utopian kernel in this
discursive web is the prospect of an inclusive and creative city where, given the right dose of
technocratic efficiency (Zizek, 2006), the city trenches of class divisions (Katznelson, 1981) can
finally be backfilled. The fact that this narrative continually emanates from the likes of Florida
and Landry is not surprising. What is, however, is the increasing tendency for urban scholarship
to reflect a similar politics.
Florida’s brand of post-industrial neoliberal utopianism is today widespread; both in
academic and policy circles. Take, for example, the UK Labour government’s social inclusion
agenda. Here, poverty and inequality are reduced to the problem of inclusion; a technocratic
concern where any notions of structural inequality – and associated demands for redistribution –
have been all but erased (Powell, 2000; also see Fincher and Iveson, 2008). The same rhetorical
recasting of social relations is evident elsewhere. In Europe, the concepts of poverty and social
exclusion have become synonymous: “the terms poverty and social exclusion refer to when
3

people are prevented from participating fully in economic, social and civil life and/or when their
access to income and other resources (personal, family, social and cultural) is so inadequate as to
exclude them from enjoying a standard of living and quality of life that is regarded as acceptable
by the society in which they live.” (EU Council; cited in Ferrera et al. 2002, p.228). This re-
imagination of socio-economic relations has therefore effectively recast social class as
completely absent of antagonisms. For the post-industrial city, economic growth – by any means
necessary – has become the unproblematic axiom of urban policy (Harvey, 1989). Moreover,
poverty and inequality are viewed not as (potential) consequences of economic growth, but
rather inhibitors to this very mission (see Cochrane, 2003, p.227).
In this paper we wish to disrupt this uncritical framing of post-industrial urban social
geography. Our intervention makes two main points. First, we draw upon debate in sociology
and political philosophy to probe the claim that post-industrialism has heralded a transformation
in urban class relations. Specifically, we question the assumption that long-term changes in the
occupational structures of cities in the Global North mean that urban class relations have
transcended the antagonisms of the industrial age. Although the traditional industrial working
class has declined in cities such as London, UK, the antagonistic social relations that were the
concern of their representative organisations (e.g. trade unions, the [old] Labour Party) have not.
As such, we should not mistake the changing appearance of class structure with the
disappearance of class antagonism. This mistake, we argue, has been at the centre of recent
commentaries of urban social change and gentrification (Butler et al. 2008; Hamnett, 2003; see
Watt, 2008). Our second, and related, point uses the methods of classical factorial ecology to
describe the contemporary class structure of London, a city recently used to support the idea of
the middle class city (Butler et al. 2008). We find a social structure significantly changed from
4

that of London in the 1960s, but one that still contains a significant working class presence. And
although this presence cannot itself prove the actual experience of antagonisms, it does
demonstrate that the reading of declining antagonisms via an increasingly middle class social
structure is fundamentally flawed.
Narrating the Post-Industrial City
In a broad historical context, claims that the (post-industrial) city is becoming absent of
class antagonism are, frankly, astonishing. Writing in the 1970s, Lefebvre (1991; 2003) posited
that the city had become both the site and vehicle of class antagonism par excellence; late
capitalist society had incorporated the city completely into its metabolism. However, what
Lefebvre saw as a growing association (indeed, a complete symbiosis) between city and a
capitalism defined by antagonism, some now see as diminishing. In short, for some the transition
to post-industrialism appears to have made the notion of urban class antagonisms redundant.
Strikingly, this has occurred at the same time as neoliberalism has transformed metropolitan
politics (Peck and Tickell, 2002) and widened social inequality (Harvey, 2005). This, at the same
time as study after study has shone light on exploited garment workers, office cleaners and
undocumented labourers in archetypal post-industrial cities (e.g. Evans and Smith, 2006; Aguiar
and Herod, 2006; Wills, 2008).
The parallel emergence of a benign discourse of class and neoliberal policies that have
accentuated socio-economic differences would therefore appear contradictory. Indeed, they are.
However, in many cities there have been social and economic changes that have accompanied
post-industrialisation and, consequently, transformed the form and appearance of class relations.
Put simply, the post-industrial city has a distinct occupational and economic profile to the
5

industrial city which, in turn, has generated a new and emerging set of social relations (see
Sassen, 2001). What we are therefore now witnessing in terms of recent scholarship on cities
such as London (Butler et al., 2008) and New York (e.g. Freeman, 2006) is a questionable
narration of the maturation of this transition (see Watt, 2008).
There is no doubt that the post-industrial shift has transformed urban society. Indeed,
many of Daniel Bell’s (1976) thesis regarding a service sector orientated economy, the rise of
technocratic elites and a knowledge-based (i.e. science) industrial structure have, in varying
degrees, played out (see Esping-Andersen, 1993). The associated decline in ‘traditional’ working
class industrial (and related residential) landscapes has been extensively documented since Bell’s
seminal comments (Beauregard, 1994; Buck et al. 2002). And, as E.P. Thompson (1964)
described, [post-industrial] economic change has necessitated social and cultural change. The
most notable of these changes within the urban studies literature has been the rise of the ‘new
middle class’; the archetypal ‘young professionals’; Richard Florida’s designated agents of
economic growth.
This social group has been variously examined from the perspectives such as the
‘gentrifiers’ (Ley, 1996), ‘yuppies’ (Roseberry, 1996) and ‘knowledge workers’ (Blackler,
1995). Over a decade ago, David Ley (1996) argued that despite the growing attention paid to
this symbolic class, it should not be treated outside of its social relations: “The new middle class
is the privileged cohort in the post-industrial city, but it does not exist in isolation. In the dual
labour market of a service economy, gentrifiers fall principally in the upper tier. The lower tier of
less skilled service workers comprises a work-force with far fewer opportunities, including shop
assistants, waitresses, taxi drivers and bellboys, many of them working near the level of the
minimum wage” (p. 11). The political and economic ascendance of the ‘new middle class’ within
6

the post-industrial city was therefore, for Ley (1996), intricately complicated by the relational
inequalities within this new class.
Increasingly however, there has been a shift away from a discourse of class relations,
towards an unrelational and un-antagonistic narration. For example, in a recent article Butler,
Hamnett and Ramsden (2008) presented the results of a study that examined social change in
London between 1981 and 2001. It attempted to characterise the social and geographical impact
of the city’s post-industrial transition. In it they claimed “there is a continued process of class
upgrading occurring within Greater London” (67), that the “‘middle mass’ which was previously
constituted by the Fordist skilled working class and now comprises lower professionals and other
non manual workers” (72). And that “[W]hilst the old manual working class groups may have
declined, they have not left a vacuum but have been replaced by these new groups of middle- and
lower-middle class non-manual working households” (84). What Butler et al. here claim is that
the class composition of London has become increasingly middle class and, as a consequence,
‘old’ class relations between a ‘traditional’ working class and non-working class ‘others’ are in
decline, if not entirely defunct (see Watt, 2008).
Butler et al.’s (2008) characterisation of London therefore follows Hamnett’s (1994;
2003) professionalization thesis. Hamnett (2003) describes the post-industrial socio-economic
character of London as based upon “significant and consistent growth in the proportion of
professional and managerial groups and a significant and consistent decline in the size and
proportion of skilled, semi-skilled and unskilled manual workers” (p. 2406). As a result, Hamnett
has little concern that post-industrial social change has driven gentrification-related
displacement: “the transformation which has taken place in the occupational class structure of
London has been associated with the gradual replacement of one class by another, rather than
7

large scale direct displacement” (p. 2424). This characterisation of a city-wide significant decline
in working class population has underlined Butler’s (2007, p. 162) call for gentrification “to
decouple itself from its original association with the deindustrialisation of metropolitan centres
such as London and from its associations with working-class displacement.” Here, the practices
of the city’s new middle class are given un-relational treatment: “With the decline of social class
as providing an overall explanation of cultural, social, and spatial behaviour, [this] notion of
gentrification as a form of ‘elective belonging’2 has considerable potential for uniting
geographical and sociological approaches to agency and structure.” (p.162). These debates about
urban socio-spatial relations demonstrate a subtle yet powerful dynamic of performativity: a)
perceptions of decline in working-class presence are woven into theoretical interpretations of
long-term urban change, b) gentrification, a process fundamentally produced through
antagonistic relations in the competing space claims of working- and middle-class populations, is
redefined so as to place the focus on gentrifiers’ choices and subjectivities, and c) the institutions
of public policy are reassured that promoting ‘revitalisation’ or ‘regeneration’ need not
exacerbate the old antagonistic class relations of a disappearing industrial age.
a+b+c=displacement from theory, eviction from the city. Theories of the “middle class city”
become performative instruments of public policy (Slater, 2006; Watt, 2008; Dorling, 2011).
Through the next sections of the paper we challenge this characterisation of the post-
industrial city as un-relational middle class domain. We question the understandings of class
relations embedded within both the measurements and characterisations that support it. In
2 Savage et al. (2004) define elective belonging as: “senses of spatial attachment, social position, and forms of
connectivity to other places. Belonging is not to a fixed community, with the implication of closed boundaries, but is
more fluid, seeing places as sites for performing identities” (p. 29).
8

addition, we attempt to excavate London’s class geography, drawing upon contemporary
political philosophy to reinsert a concern for class antagonism and presenting a classical factor
analysis of the city’s geographies of social class to illuminate the durable -- albeit constantly
reconfigured -- working class presence. To be sure, the pairing of radical political philosophy
with neo-positivist factorial ecology is an unlikely combination; but this fusion is critical -- in all
senses of the word -- for an understanding of the changing relations of work, wealth, and
inequality in the preeminent global city (see also Bunge and Bordessa, 1975, pp. 327-350).
Furthermore, we use our reading of London’s class structure to highlight how recent
characterisation of class composition and concomitant relations has engaged in a certain politics.
Post-Industrial London: Middle Class Domain?
“The contemporary multi-ethnic London working class does not have as pronounced a
class identity as its post-war Fordist equivalent [...]. However it is present, not just as the
demonic, phantasmic ‘other’ in urban middle-class imaginations, but also in reality in the
workplaces, schools and housing estates of the metropolis.” (Watt, 2008, p. 209)
The claim that London’s working class population has simply been replaced by an expanding
middle class is based upon the declining presence of traditionally working class occupations in
London (i.e. Fordist manufacturing; see Hamnett, 2003). The post-industrial occupational profile
is seen to be “onion shaped” (Pahl, 1988). Butler, Hamnett and Ramsden (2008) use 1981, 1991
and 2001 UK census data to support this assertion, finding that the middle of London’s socio-
economic structure “which was previously constituted by the Fordist skilled working class […]
now comprises lower professionals and other nonmanual workers” (p. 72). Contrary to Sassen’s
9

(2001) claim that post-industrial cities such as London are witnessing social polarisation, they
adopt Hamnett’s (1994) argument of professionalization.
The dominant narrative presented by Butler et al. (2008) is of London’s recent social
trajectory as thus: “the old manual working class groups may have declined, they have not left a
vacuum but have been replaced by these new groups of middle- and lower-middle class, non-
manual working households” (84). As Watt (2008) has argued, the main problem with this
reading of socio-economic change is that it associates a decline of traditional working class
occupations with a decline in the working classes per se. As such, working class social relations
are reduced to particular occupations and, indeed, class consciousness. Wacquant (2008) argues
such narratives represent a wider process of the “literal and figurative effacing of the proletariat
in the city…” (p.199). An examination of the methods and measures used to track social class
change in studies such as Butler et al.’s (2008) shows how this effacement has become deeply
embedded within much of the literature.
In their study of social class change in London between 1981 and 2001, Butler et al.
(2008) identify that the most significant ‘middle class’ growth has occurred in two of the census-
defined Socio-Economic Groups (SEGs): 5.1 (Ancillary workers and artists) and 5.2 (Foremen
and supervisors, non-manual). The SEG classification had been used prior to the 2001 census –
being replaced by the Socio-Economic Classification (SEC) – and therefore Butler et al.
translated 2001 data back into the SEG classification. Opposed to viewing the transition of
London into a generically ‘middle class’ city, Butler et al. (2008) therefore claim that higher
SEGs (1-4) should be distinguished from SEG 5.1 and 5.2:
“The rapid growth of SEG 5, both in London and in England and Wales as a whole, is
sociologically very important and suggests that the changes in the structure of jobs have
10

created an expanded new group of lower-level middle-class workers with significant
implications for the overall occupational class structure. In London, this group’s share
has also more than doubled, rising faster than in all other areas.” (ibid. p.77)
In terms of interpreting London’s post-industrial class transition, it therefore means SEG 5.1/2
requires some specific attention. This group is numerically the largest, accounting for around
28% of the SEG 1-5 population in 2001, compared to the next largest, SEG 1, at 11% (ibid.
p.76). Furthermore it is important to emphasize that “only a third of the proportionate growth
[1981-2001] took place in the traditional upper middle classes (SEGs 1–4) which grew from 16
per cent to 21 per cent (5 ppc) compared with the lower middle classes (SEGs 5.1 and 5.2) which
grew from 10 per cent to 22 per cent (12 ppc)” (ibid. p. 75). The case for London’s increasing
professionalization (Hamnett, 1994) and resulting replacement of working class populations
therefore significantly rests upon the SEG 5.1/2 group.
Table 1. Operational Categories of the NS-SEC linked to Socio-Economic Groups.
(Source: Rose, Pevalin O’Reilly, 2005).
Socio-economic groupNS-SEC
operational categories
1Employers and managers in central and local
government, industry, commerce, etc. - large establishments
11

1.1 Employers in industry, commerce, etc. - large establishments 1
1.2 Managers in central and local government, industry, commerce, etc. - large establishments 2
2 Employers and managers in industry, commerce, etc. - small establishments
2.1 Employers in industry, commerce, etc. - small establishments 8.1
2.2 Managers in industry, commerce, etc. - small establishments 5
3 Professional workers - self-employed 3.34 Professional workers – employees 3.15 Intermediate non-manual workers
5.1 Ancillary workers and artists 3.2, 3.4, 4.1, 4.3, 7.3
5.2 Foremen and supervisors non-manual 6
6 Junior non-manual workers 4.2, 7.1, 7.2, 12.1, 12.6
7 Personal service workers 12.7, 13.18 Foremen and supervisors – manual 10
9 Skilled manual workers 7.4, 11.1, 12.3, 13.3
10 Semi-skilled manual workers 11.2, 12.2, 12.4, 13.2
11 Unskilled manual workers 13.4
12 Own account workers (other than professional) 4.4, 9.1
13 Farmers - employers and managers 8.214 Farmers - own account 9.215 Agricultural workers 12.5, 13.516 Members of armed forces -
17 Inadequately described and not stated occupations 16
An examination of the occupations grouped in the SEG 5.1 and 5.2 categories (Table 2)
highlights the inherent compromises in using broad occupational categories to draw inferences
about the multidimensional phenomenon of class relations. Savage et al. (1992) remind us of the
ambiguous tension that defines middle-class identity:
12

“The definition of ‘middle class’ is vague but evocative. The term goes back to the early
nineteenth century, where it developed as a negative term (Briggs, 1960). By calling
yourself middle class you distinguished yourself from those above you – the aristocracy –
and those below you – the working class. But this does not indicate that different people
within the middle classes actually have anything in common other than that they are not
upper or lower class.” (p. xi)
Savage et al. (1992) go onto define social classes as “…first and foremost stable social
collectivities. They are groups of people with shared levels of income and remuneration,
lifestyles, cultures, political orientations and so forth” (p. 5). In terms of class structure, we find
this understanding a useful entry point.
An examination of the occupations grouped in SEG 5.1/2 (Table 2) make it clear that
imposing a ‘middle class’ label upon this collection of occupations is problematic. Take SEG
5.2. While accounting for approximately 16% of the SEG 5 population nationally (Rose et al.
2005), occupations captured in this group include counter clerks and cashiers, sales assistants,
telephone operators and security guards; clearly, whether these occupations constitute the “lower
middle classes” is highly debatable. Yet, even when we consider the numerically more
significant SEG 5.1 group, questions remain. They include: occupational safety officers, clerks,
assistant nurses, dental nurses, company secretaries and librarians. Whether these are middle
class workers, or indeed whether they have any form of collective association with other
occupations (e.g. air traffic controllers or Civil Service executive officers), must be questioned.
13

Table 2. Occupations (Standard Occupational Classification) Classified in the SEG 5.1.
and 5.2 Groups. (Source: Rose and O’Reilly, 1998, p. 56-91).
5.1
Actors, entertainers, stage managers, producers & directors; Advertising & public relations managers; Air traffic planners & controllers; Architectural & town planning technicians; Artists, commercial artists, graphic designers; Assistant nurses, nursing auxiliaries; Authors, writers, journalists; Building & civil engineering technicians; Building inspectors; Buyers & purchasing officers (not retail); Buyers (retail trade); Chiropodists; Civil Service executive officers; Clothing designers; Company secretaries; Customs & excise officers, immigration officers; Dental nurses; Dispensing opticians; Electrical/electronic technicians; Engineering technicians; Estimators, valuers; Industrial designers; Information officers; Laboratory technicians; Legal service & related occupations; Managers in building & contracting; Marine, insurance & other surveyors; Marketing & sales managers; Medical radiographers; Medical technicians, dental auxiliaries; Midwives; Musicians; Nurses; Occupational hygienists & safety officers (health & safety); Officials of trade associations, trade unions; Organisation & methods & work study officers; Other associate professional & technical occupations; Other health associate professionals; Other scientific technicians; Other statutory & similar inspectors; Other teaching professionals; Physiotherapists; Property & estate managers; Quantity surveyors; Taxation experts; Vocational & industrial trainers
5.2
Accounts & wages clerks, book-keepers, other financial clerks; Clerks; Computer operators, data processing operators; Counter clerks & cashiers; Debt, rent & other cash collectors; Draughtspersons; Filing, computer & other records clerks; Fire service officers (leading fire officer & below); Library assistants/clerks; Local government clerical officers & assistants; Other secretaries, personal assistants, typists; Other security & protective service occupations; Petrol pump forecourt attendants; Photographers, camera, sound and video equipment operators; Police officers (sergeant & below); Prison service officers (below principal officer); Production, works & maintenance managers; Radio & telegraph operators; Retail cash desk & check-out operators; Roundsmen/women & van salespersons; Sales assistants; Security guards & related occupations; Stores, despatch & production control clerks; Telephone operators; Telephone salespersons; Tracers, drawing office assistants; Traffic wardens; Typists & word processor operators
We therefore see Butler et al.’s (2008) characterisation of London’s ‘social upgrading’
primarily through the SEG 5.1 and 5.2 occupations as problematic. More than any other of the
Goldthorpe-inspired SEG categories, these demonstrate the eternal difficulties in locating class
positions in a complex post-industrial city. The application and interpretation of the UK’s social
class categories must proceed more critically. This is particularly required in terms of dealing
with the distinct questions of class structure and class relations. Here, we argue that a reading of
14

class relations from classification schemes such as the SEG and SEC UK census categories is
inherently problematic.
Questioning Classifications of Class
For the 2001 UK census, the Office of National Statistics introduced a new social class
schema, Socio-Economic Classifications (SEC), to replace the previous version; Socio-
Economic Groups (SEG; this replaced the previous ‘Social Class’ [SC]schema). Developed at
the University of Essex (Rose and O’Reilly, 1998), the requirement for the new SEC scheme was
based upon the claim that “both SC and SEG lacked a clear conceptual rationale” (Rose et al.,
2005, p.11). The conceptual framework for the SEC “follows a well-defined sociological
position that employment relations and conditions are central to delineating the structure of
socioeconomic positions in modern societies” (ibid, p.14). It draws particularly on the works of
John Goldthorpe (1992; 2007) – as previously classifications also did – and therefore adopted a
neo-Weberian position: “The primary distinctions made in Goldthorpe’s approach are those
between: (1) employers, who buy the labour of others and assume some degree of authority and
control over them; (2) self employed (or ‘own-account ’) workers who neither buy labour nor
sell their own to an employer; and (3) employees, who sell their labour to employers and so place
themselves under the authority of their employer.” (ibid. p.14).
Goldthorpe’s class schema has been highly influential, described by Bergman and Joye
(2001) as having “paradigmatic dominance”, since its first incarnation (see Rose and O’Reilly,
1998). Focused upon industrial society’s employment relations, Goldthorpe divides occupational
categories according to labour market resources. His schema therefore necessarily privileges the
middle classes where the labour market demands and (usually) rewards major investments in
15

human capital. However, Goldthorpe’s emphasis on structure, as opposed to relations, has
generated continued difficulties in using the census to gauge politico-economic relations,
particularly in the absence of a traditional, industrial working class. “Class analysis… explores
the interconnections between positions defined by employment relations in labour markets and
production units in different sectors of national economies; the processes through which
individuals and families are distributed and redistributed among these positions over time; and
the consequences thereof for their life-chances and for the social identities that they adopt and
the social values and interests that they pursue” (Goldthorpe and Marshall, 1992, p.382). Erik
Olin Wright (1985) once used the metaphor of rooms in a hotel to describe this approach to
classification and class: individuals may move in and out of various rooms, but the rooms are
not fundamentally defined by the relations between the individuals occupying them.
Of course, Goldthorpe and Marshall (1992) wish to distinguish their neo-Weberian
approach, particularly with reference to Marxian approaches. They do so along four lines: their
rejection of historical materialism, class exploitation, class-based collective action and
reductionist theories of political action. For Goldthorpe, the question of class is therefore a
largely empirical one. In answering Runciman’s (1990) question of how many classes there are
in contemporary society, he responded: “As many as it proves empirically useful to distinguish
for the analytical purposes in hand” (Erikson & Goldthorpe, 1992, p.46; cited in Bergman and
Joye, 2001). The fundamental problem of Goldthorpe’s approach is that, despite denials about its
importance and the implicit hierarchy embedded within the occupational structure, the question
of social class cannot avoid relations (also see Evans and Mills, 2000). While it is possible to
construct and deploy detailed occupational classifications while avoiding difficult relational
questions, it is not the best idea (see Wright, 1985, 2005, for critical commentary).
16

While not necessarily problematic to emphasise class structure, the stripping away of
questions of class relations remains so. Our intention is therefore not to proffer a particular mode
of class analysis. Indeed, we follow Erik Olin Wright’s (2005) view that “[O]ne can be a
Weberian for the study of class mobility, a Bourdieuian for the study of the class determinants of
lifestyle, and a Marxian for the critique of capitalism” (p.192). Rather, the point is to continue a
concern with class relations, given the incontrovertible evidence of widening inequalities and
regressive politics of (public) austerity in recent years (Dorling, 2011; Slater, 2011).
Our point here is at once methodological and epistemological. Zizek (2006) reminds us
that “the bracketing itself produces the object” (p.56; emphasis in original). Abstraction is
necessary in order for the subject (e.g. the researcher) to approach the object (e.g. the question of
social class). Zizek’s spin on this is that the (passive) subject is then constructed by the (active)
object. However, for our purposes here, it is enough to note the point that bracketing is necessary
and, as such, the whole of the object (i.e. each aspect of social class) can never be captured from
any single vantage point. This, of course, is the dilemma of Zizek’s (2006) parallax gap. With
this in mind, we can identify how the framing of social class within the urban literature is indeed
casting the object of inquiry; and stripping it of its antagonistic dimensions. Zizek (2006)
reminds us of the consequences of this: “This bracketing is not only epistemological, it concerns
what Marx called “real abstraction”; the abstraction from power and economic relations is
inscribed into the very actuality of the democratic process” (p.56).
This notion of bracketing obviously has different implications in different contexts. In the
context of class identity and relations, Zizek (1999) notes its particular political relevance: He
has argued that the ways in which the middle classes have both presented themselves and been
17

presented, that is outside of the very class relations that define them (also see Savage et al. 1992),
is a tantamount to a defining political act. Drawing upon Laclau, he claims:
“the ‘middle class’ is, in its very ‘real’ existence, the embodied lie, the denial of
antagonism – in psychoanalytic terms, the ‘middle class’ is a fetish, the impossible
intersection of Left and Right which, by expelling both poles of the antagonism into the
position of ‘antisocial’ extremes which corrode the health social body (multinational
corporations and intruding immigrants), presents itself as the neutral common ground of
Society. In other words, the ‘middle class’ is the very form of the disavowal of the fact
that ‘Society doesn’t exist (Laclau) – in it, Society does exist.”(Zizek, 1999, p.187)
What Zizek locates, utilising Laclau’s (1996) understanding of hegemony, is how “the only class
which, in its ‘subjective’ self-perception, explicitly conceives of and presents itself as a class is
the notorious ‘middle class’ which is precisely the ‘non-class’” (1999, p.186). Here, Zizek
locates the antagonistic dimension of social class by shifting perspective (i.e. parallax shift) from
capital; in this, a consideration of capital’s necessary relations of production are transposed into
the social field. Importantly, this means that capital is not simply mapped onto class relations
(i.e. a classical Marxian framework) but rather existing social structures are imbued with
antagonisms through the economy; is this not why Ranciere (1991a; 1991b) continues to use the
term “worker” as opposed to labour? The symbolic prospect of a ‘middle class city’ or ‘middle
class society’ is therefore the operation of hegemony for Zizek; the exclusion of class in its
antagonistic form through the insertion of middle class identity (particular) as representing
Society (universal).3
3 Importantly, this very mode of imaginary projection of a middle class society has been an integral element of the
New Labour project, supported by the prominent sociologist Anthony Giddens (1999)
18

What Zizek’s critique demonstrates is the difference between identifying class structure
(socio-economic stratifications) and an accounting of the antagonistic social relations. It signals
to the fact that whilst occupational structures may have changed dramatically, there is little
evidence to suggest that these can be read as a decline of (urban) social antagonisms (Ranciere,
1991b). Where Butler et al. (2008) describe existing areas of working class settlement that “still
linger on” (p. 84) and where Hamnett’s (1994) professionalization thesis is used to argue that
working class populations are being “replaced”, opposed to being displaced (via gentrification),
we must therefore be aware to two issues. The first is empirical, in that we must question the
extent to which the UK’s social class classification scheme captures changing class composition,
particularly with reference to ‘lower middle class’ occupations (i.e. SEG 5.1/2). The second is
epistemological and relates to the question of class analysis more broadly. Here, we must be
aware that to discuss class without a consideration of its antagonistic relations is to strip away a
pivotal, if not defining, aspect.
In the next sections, we use these two considerations to develop an alternative analysis of
London’s changing social -- and class -- geographies. We draw on both ecological data
(aggregate measures for geographical areas) and microdata (information on individuals and
households) to map a fine-grained landscape of urbanized social relations. Multivariate methods
help us to highlight these inherently relational patterns -- avoiding the problematic sole reliance
on a single classification system as a proxy for the multidimensional fields of class in the
postindustrial metropolis. While London’s landscape may no longer be so clearly divided along
the industrially-rooted class relations that were so vivid and easily recognized in the mid
twentieth century, this does not mean that class inequality has been erased. Old working-class
19

spaces remain across the metropolis, and it is also possible to identify the space and places of the
new working-class relations reproduced through postindustrial transformations.
Historical Class Geographies
London’s social geography has been extensively documented (Hebbert, 1998). From
merchant city to imperial heart, the city’s latest phase is described by Buck et al. (2002) as: “an
undisputed and highly successful global city, yet one that seems to exhibit poverty and affluence
side by side” (p. 2). In their extensive study, Buck et al. (2002) characterise London as “highly
entrepreneurial and highly competitive” (p. 355); a city that “has become a multi-ethnic and
multi-cultural city of an American kind, but without many of the concomitant problems of
American cities” (p.355). Clearly, such descriptions align with Sassen’s (2001) polarisation
thesis. She argues: “My central point in the polarization argument is not that inequality is new,
that the middle class has disappeared and that it is all due to globalization. The point is rather
that specific consequences of globalization have the effect not of contributing to the expansion of
a middle class, as we saw in Fordism, but that the pressure is towards increasingly valuing top
level professional workers mostly in the corporate sector” (p. 361-2). In contrast to London’s
being characterised as ‘becoming increasingly middle class’ (Butler et al. 2008), others have
seen recent economic change driving deeper the city’s existing inequalities.
Such understandings of London’s social geography are not new. Writing on a study of
social change in London Congdon (1989) argued that “Small area monitoring of social indicators
is important in view of evidence that deprivation may be spatially concentrated, with pockets of
deprivation in otherwise prosperous areas” (p.489). He concluded that the changes experienced
in London’s social geography during the 1980s were largely influenced by three factors:
20

“improved supply of municipal housing, gentrification and increased ethnic minority
populations” (p. 489). This is mirrored by Buck et al.’s (2002) commenting on how the UK
Government’s index of multiple deprivation in 2000 showed that “some key patterns recur across
the domains with depressing regularity” (p. 46). They argue: “Deprived people are far more
likely to be found in Inner London than in Outer London” (p. 47). Contrast this to Butler et al.’s
(2008) recent claim that there has been: “a ‘filling in’ or ‘evening out’ of middle-class
composition across inner London over time. This is consistent with the idea of widespread mass
gentrification or replacement of the working classes as the occupational structure of London has
shifted upwards.” (p. 79).
Two important disagreements can be identified as emerging from recent accounts of
London’s post-industrial social change. First, there is disagreement over how to summarize the
socio-economic character of London; a binary has developed between the narratives of
‘polarisation’ (Sassen, 2001) versus ‘professionalisation’ (Hamnett, 1994). Here, divergent
views of London’s (and global cities more generally) social trajectory has fed two different
characterisations of London: one concerned with growing socio-economic homogeneity (Butler
et al. 2008) and another identifying widening inequalities (Buck et al. 2002). At the
neighbourhood scale, these characterisations have translated into divergent understandings of
gentrification. Hamnett (2003) has employed his professionalization thesis to argue gentrification
has generated ‘replacement’ not ‘displacement’; the city has, as a whole, gradually transitioned
into a more middle class space. Others (Slater, 2006; Davidson, 2008; Watt, 2008) have
challenged this interpretation, documenting the dynamics of direct and indirect displacement and
attacking the way ‘professionalisation’ downplays ongoing social and political struggles over
space in contemporary London. These controversies highlight a second point of disagreement:
21

competing scalar narratives in accounts of London’s social geography. Some analysts have
maintained a sharply-focused, close-up view of London’s fine-grained social geographies, and
the dramatic, intensified socio-spatial juxtapositions (Buck et al., 2002). Others have chosen a
wide-angle, panoramic view of long-term demographic and class change -- sometimes
dismissing the localized conflicts over displacement as marginal legacies of a disappearing
industrial-era metropolis (Butler, 2007; Butler et al., 2008).
Mapping Contemporary London
We now turn to an exploration of contemporary London. In this distanciated expedition
through secondary data, we are forced to rely on information from the 2001 Census. By the time
you, dear reader, consider our interpretation, these data will seem hopelessly out of date. But
they are still con + temporarius (“belonging to time,”) and as we write, the interval between the
Office of National Statistics (ONS) exercise to create the massive statistical archive and our
present concerns amounts to 0.59 percent of the history of London since the Roman historian
Tacitus referred to London “as having been a place much frequented by merchants.” (Branch,
1978, p. 30). Considerations of political epistemology also merit a defense of turn-of-the-
twentieth-century data. Just as social science research heralding the disappearance of class
politics has been co-opted by a policy infrastructure devoted to erasing working-class
communities, the postindustrial realities of privatisation and privacy concerns in the information
society have been used to destroy the very foundations of positivist inquiry. Britain’s Cabinet
Office minister declares that data more than a year old are useless, and
“instead, it is proposed that administrative data and private data (such as credit
ratings) can be relied upon to gather a quasi-instantaneous picture of the British
22

people and society.” (Shearmur, 2010, p. 1009).
This, of course, is part of the transnational Right’s epiphany that the best way to deflect
political questions about the enduring inequalities of class is to make it harder (for those beyond
the corporate Right) to document either inequality or class (Shearmur, 2010; Dorling, 2011).
The 2001 Census, therefore, provides what might be our last reasonably detailed, public, socio-
spatial archive of a London shaped by (and measured with) the Crystal-Palace-style enframing of
industrial-modernity’s enterprise of methodological positivism (Steinmetz, 2005). In other
words, this retrospective historical database is the most detailed snapshot we have of a complex,
changing metropolis.
Hamnett (2003, p. 2413) observes that “much of inner London in the 1950s and 1960s
was dominated by a large working-class population,” and then proceeds to document the effects
of broad forces of restructuring that have changed this pattern over the subsequent decades. For
an engaging historical benchmark of the post-World War II industrial metropolis, Hamnett
includes a reprint of a cluster analysis based on 1966 census data, performed by analysts in the
Greater London Council (Daly, 1971). Reprinted in a black and white photocopy in Urban
Studies, the map is an enigmatic cartographic intervention: it’s a bit hard to make out the details,
but we get the sense that there was a dramatic saga in the making of the map -- and in the
geographies unfolding across London when the census ‘captured’ certain representations of
urban life. Hamnett makes it clear that sharp divisions emerge from the classification of almost
700 wards across the city-region -- partitioned and categorized in an hierarchical cluster
algorithm applied to 11 variables on occupation, tenure, household structure, and mobility. The
map
23
“shows a sharp contrast between the East End and the West End of London, with
the former characterised by high levels of council housing and working-class
residents, and the latter charaterised by high levels of young, mobile, middle-class
private renters. Surrounding central London, much of inner London was
characterised by working-class private rented housing surrounded by more
middle-class owner-occupied suburbs.” (Hamnett, 2003, p. 2413).
After considering the GLC’s snapshot of London in 1966, Hamnett (2003) undertakes a
careful and comprehensive analysis of separate indicators of change -- occupational shifts, house
price inflation, widening disparities in wages -- to back up the claim that “the importance of
gentrification in dramatically reshaping the social geography of inner London over the past 30-
40 years cannot be overstated.” (p. 2413).
We concur with Hamnett on this assessment. But we fear that the intensity of debate in
the literature (Hamnett, 2003, 2010; Butler et al., 2008; Slater, 2006; Slater, 2010; Marcuse,
2010) has overlooked the familiar maxim: it’s better to be generally correct than precisely
wrong. “Is London a professionalised metropolis or a site of working-class struggle?”
reproduces an either/or binary that ignores the potential of both/and (Barnes, 2009). The danger
is that detailed occupational data documenting professionalisation and middle-class growth are
mistaken for the idea that class inequalities (and thus class conflicts) are receding. The
“multibowl water fountain” (Hamnett, 2003, p. 2416) of house price inflation slips into an
implicit narrative of a metropolis erased of working-class spaces. The empirically correct
distinction between direct displacement and intergenerational replacement provides easy
political cover for precisely those policy interventions that are apparently required to get rid of
24

the poor and working-class spaces that we thought had disappeared (Dorling, 2011; Slater, 2010;
cf. Hamnett, 2010). If London is a middle-class metropolis -- a postindustrial class structure
with a preindustrial spatiality (Hamnett, 2003, p. 2416) then why is it necessary for pro-
gentrification neoliberals to get BBC News Magazine headlines to ask, “Do the poor have a right
to live in expensive areas?” (Kelly, 2010).
Figure 1. The Greater London Mosaic, 1966, as Mapped by the Greater London Council.
(Source: Daly, 1971, as reproduced in Hamnett, 2003, p. 2414).
Slater and Hamnett both have it right: critical perspectives have been evicted from
gentrification, and London is “unequal city.” We are inspired to attempt a map of Barnes’s
(2009) eloquent manifesto for “Not Only ... But Also.” Why not update a few of the methods
25

used in that intricate mosaic of working-class geographies portrayed in the GLC map of 1966
London? We use the classical approaches of the factorial ecology and numerical taxonomy
literatures (Berry, 1968; Berry and Kasarda, 1977; Bunge and Bordessa, 1975; Johnston, 1978;
Murdie, 1969) to respond to Congdon’s (1989) call for analysis of London’s social geographies
at spatial scales that reconcile the most important macro shifts with significant local variations.
Fortunately, the 2001 Census allows us to define ‘the local’ all the way down to 24,210 Output
Areas (OAs) across the Greater London region. We selected a suite of fifty indicators from the
areal summary files, measuring aspects of employment status, housing tenure, education, SEC,
place of birth, household composition, ethnicity, industry of employment, and religious
affiliation. To analyze the conceptually important aspects of interdependency -- the multiple
facets of social class -- while controlling for the messy statistical confusion of multicollinearity,
we use a common factor analysis. This procedure distills the fifty indicators to six generalized
orthogonal dimensions of urban social structure that capture most of the original variance in the
entire dataset (Table 3). These six factors were subsequently used to define the axes of a
multidimensional space for a non-hierarchical, nearest-centroid sorting cluster analysis to
identify4 fifteen distinct neighbourhood types. Cluster diagnostics indicate an overall r-squared
of 0.658; the classification solution successfully distinguishes between 60 and 72 percent of the
variance for each of the six components. In a perfect (methodological) world, the next step
would compare these quantitative diagnostics with the same methods, applied to the same
variables, gathered for precisely the same spatial units as those defined for the 1966 ecology
(Daly, 1971). When we reflect on the kind of political climate that encourages the Beeb go ask,
4 Epistemological purists will recognize our dangerous assertion of positivist non-nonrepresentational
performativity. See the foraminifera chapter of Gould (1999). We defined and created the neighbourhood types
through the choices made in organizing data and selecting variables that implement observation.
26

“Do the poor have the right to live in expensive areas?” it is obvious that we’re not in a perfect
world (cf. Dorling, 2011). So we have to make do with a detailed snapshot of one point in time.
It is crucial to recognize what this approach cannot do. In contrast to some of the
exaggerated claims of forty years ago (Berry, 1968; Berry and Kasarda, 1977), classifications
cannot “reveal” underlying processes or principles of urban socio-spatial organisation. All
classifications are implicit epistemologies: the results are determined, quite literally, by the
multidimensional Euclidian distances separating observations in a space defined by our choice of
what is worth measuring (Gould, 1999). If we look to the results of a taxonomy for answers to
questions about causality, then, we will surely be disappointed. So long as they are constrained
by the conventional categorizations of census data, principal components solutions and cluster
taxonomies are not well suited to the analysis of interrelations among conscious individual actors
or social groups (Savage et al., 1995) and they provide insufficient information to discern the
processes generating observed social structures. Indeed, if we follow Ranciere’s (1999) view
that subjectivisation is necessarily always in play in (class) politics, and that this process is
central to a heterogeneous politics (Laclau and Mouffe, 2001), census and taxonomic categories
of any kind risk a distraction from the kinds of thought required to engage with ‘actually
existing’ socio-political geographies in-the-making. But if we wish to join a conversation about
the implicit, comparatively simple spatial imaginaries that have become popular in certain
streams of urban thought and policy -- the idea that London is now a postindustrial global city
freed of the old divisions of the industrial age, the idea that London is now a professionalised,
middle-class metropolis -- then the tools of classical urban ecology are precisely what we need.
Has the complex, rich topography of Fordist, industrial, working-class London been replaced by
a more generalized pattern of middle-class professionalisation? Are there any working-class
27
areas left?5
Ecologies of Inequality
We organize our results into four main sections. First we explore the factor-analytic
results. Second, we consider the explicitly spatial dimensions of class polarization. Third, we
offer an interpretation of the distinct neighbourhood types across the vast metropolis. Fourth, we
undertake a complementary analysis of household-level microdata to work around some of the
limitations of ecological methods.
Consider first the factor structure (Table 3). The enduring class contrasts of the
metropolis are sharp and vivid. The first factor clearly distinguishes communities along a binary
of contemporary social class: in neighbourhoods with strongly positive scores6 on this composite
variable, we find people with typically working-class educational profiles, working on
occupations designated as routine. Their jobs are disproportionately concentrated in
construction, trade and repair services, and transportation, storage, and communications.
Conversely, neighbourhoods scoring strongly negative on this factor are distinguished by people
with elite qualification levels working for large employers and/or as professionals in finance, real
5 or Left?
6 Recall that what matters in a factor interpretation are the absolute values of loadings relating the original variables
to the extracted, rotated factors. Moreover, the overall “orientation” of the factor -- which side is positive, which
side is negative -- is arbitrary, and determined by the number, type, and empirical properties of the indicators used in
the analysis.
28

Table 3. A Factorial Ecology of London's Contemporary Class Structure.
Varimax Rotated Factor Loadings
Interpretation Professionalisation
Postindustrial family status and
housing classesHousing and labor
market diversitySouth Asian Cosmopolis Black Cosmopolis
Irish/Immigrant Transformation
I II III IV V VI CommunalityVariableFull Time Employed -0.31 -0.23 -0.86 0.07 0.00 -0.14 0.91Part Time Employed 0.52 0.54 -0.08 -0.13 0.01 -0.12 0.59Self Employed -0.63 0.49 -0.13 -0.12 -0.14 0.08 0.69Unemployed 0.19 -0.46 0.46 -0.06 0.42 0.05 0.64Retired 0.33 0.35 0.08 -0.23 -0.57 0.24 0.68Economically Inactive, not Retired 0.20 -0.25 0.81 0.13 0.21 0.00 0.82Industry Construction 0.64 0.29 -0.12 -0.16 -0.10 0.04 0.54Industry Trade,Repair 0.61 0.19 0.18 0.28 0.00 0.05 0.53Industry Hotels,Catering 0.13 -0.32 0.47 0.16 0.15 -0.05 0.39Industry Trans,Stor,Comm 0.59 -0.13 -0.13 0.30 -0.10 0.00 0.48Industry Financial Intermediation -0.47 0.07 -0.19 -0.16 -0.27 -0.26 0.42Industry Real Estate,Rent,Business -0.81 -0.17 -0.08 -0.08 -0.05 0.04 0.71Average Household Size 0.30 0.58 0.26 0.42 0.26 -0.20 0.77Average Rooms/Household -0.04 0.90 -0.13 0.06 -0.05 -0.11 0.84Hsg units with Occ rating -1 or less -0.08 -0.65 0.47 0.14 0.26 0.08 0.75Owned free -0.14 0.77 -0.22 0.08 -0.34 0.01 0.78Owned Mortgaged 0.07 0.55 -0.63 0.21 -0.03 -0.18 0.77Rented from Local Authority 0.36 -0.44 0.51 -0.25 0.12 0.08 0.67Persons born outside the EU -0.08 -0.14 -0.01 0.06 0.07 0.85 0.75Ethnicity White British 0.10 0.29 -0.48 -0.57 -0.48 -0.17 0.89Ethnicity White Irish -0.14 -0.12 -0.04 0.07 0.12 0.83 0.75Ethnicity White Other -0.68 -0.21 0.17 -0.04 0.07 0.12 0.56Ethnicity Indian 0.10 0.14 0.01 0.90 -0.06 0.12 0.86Ethnicity Pakistani 0.10 0.00 0.16 0.63 0.08 -0.08 0.44Ethnicity Bangladeshi 0.00 -0.14 0.56 0.13 -0.06 -0.36 0.49Ethnicity Black Caribbean 0.18 -0.20 0.14 0.00 0.70 0.18 0.62Ethnicity Black African 0.21 -0.34 0.37 -0.07 0.59 0.05 0.65Ethnicity Black Other 0.15 -0.20 0.20 -0.10 0.65 0.14 0.55Religion Christian 0.24 0.19 -0.40 -0.68 -0.13 0.06 0.74Religion Hindu 0.09 0.19 -0.01 0.76 0.01 0.21 0.67Religion Muslim 0.05 -0.18 0.66 0.44 0.15 -0.22 0.73Religion Sikh 0.15 -0.02 -0.03 0.69 -0.14 -0.04 0.51Married-couple households 0.24 0.85 -0.11 0.13 -0.22 -0.16 0.88Single Never Married households -0.36 -0.65 0.16 0.05 0.43 0.12 0.78Divorced and Widowed 0.38 -0.32 0.19 -0.30 -0.48 0.27 0.68No qualifications 0.80 -0.12 0.44 -0.09 -0.11 0.06 0.86Qualification Level 1 0.81 0.16 -0.19 -0.03 0.01 -0.18 0.76Qualification Level 2 0.47 0.48 -0.27 0.01 0.06 -0.15 0.55Qualification Level 4-5 -0.94 -0.15 -0.16 0.04 0.04 0.06 0.94Large Employers -0.75 0.05 -0.31 -0.11 -0.16 -0.06 0.70Higher Professionals -0.86 -0.02 -0.25 0.01 -0.11 -0.02 0.81Lower Professionals -0.68 0.05 -0.58 -0.09 0.00 -0.04 0.81Intermediate 0.45 0.17 -0.58 0.04 0.02 -0.15 0.59Small Employers -0.09 0.63 -0.12 -0.08 -0.12 0.10 0.45Lower Supervisory 0.74 -0.13 -0.15 0.03 0.05 -0.08 0.59Semi Routine 0.79 -0.17 0.17 0.06 0.17 -0.04 0.71Routine 0.72 -0.27 0.20 0.01 0.10 0.01 0.64Never Worked 0.21 -0.29 0.72 0.23 0.25 -0.08 0.77Long Term Unemployed 0.22 -0.34 0.39 -0.12 0.33 0.08 0.45Full Time Students -0.11 -0.03 0.49 0.28 0.31 0.00 0.43
Percent of variance 20.84 13.40 13.26 8.50 6.76 4.50Cumulative share 20.84 34.24 47.50 56.00 62.76 67.26
Note: Boldface indicates loadings with absolute magnitude >= 0.40.
estate, and the broader ensemble of London’s global-city postindustrial obsessions. This is the
first factor that emerges from a data analysis procedure mathematically constrained to identify
29

the component that accounts for the largest share of common variance: if London really is a
middle-class professional metropolis without familiar class divisions, the first factor should be
ambiguous, confusing, and unrecognizable. We should see a chaotic mixture of variables
loading on to this first factor, with no clear pattern. To be sure, there are a lot of numbers here;
but take a few moments, focus on that column under the “I,” and look for the values greater than
than +0.40 or less than -0.40. The pattern makes a lot of sense. The clarity of this first factor as
a cultural capital/occupation/workplace-based class binary is a sophisticated demonstration of the
obvious: London remains a class-divided metropolis.
Let us be clear: we are not suggesting that ‘professionalisation’ is not happening -- at
least in many parts of the workforce and many parts of the city. We are not asserting that all the
old divides of the twentieth century endure without major changes. The transformations
documented by Butler et al. (2008), Hamnett (2003) and others are remarkable indeed. What our
analysis offers is a measurement of the historically-entrenched divisions that persist as sites of
contestation -- and a measurement of how the old duality is changing in relation to other socio-
spatial dimensions of class and society. Note that part-time work and self-employment appear
on opposite sites of the axis for Factor 1, while full-time employment fails to exceed our
(somewhat arbitrary) threshold of boldface “significance.”7 These results have meaningful
implications: the alignment of self-employment with professionalisation and global-city
7 As correlations, loadings do not have the same meaning in inferential terms as other types of coefficient estimates.
Strongly positive or strongly negative loadings therefore help in interpretation and the assessment of practical
significance. Square each loading to obtain the proportion of the original indicator variance captured in the rotated
factor: the 0.94 loading for Qualification levels 4 and 5 on Factor 1, for instance, mean that Factor 1 captures 0.94 x
0.94 = 88.4 percent of the variance of the original measure, across all the 24,210 output areas. Do the same for the
other five factors, sum the result, and you have the communality: the six-factor solution accounts for 94 percent of
the geographical variance in Qualification levels 4 and 5.
30

financialisation fits well into the narrative of neo-liberal privatisation: the most privileged
workers are encouraged to organize themselves as corporations. Conversely, the very weak
loading for full-time employment on Factor 1 (-0.31, translating to a coefficient of determination
of less than ten percent) means that neighbourhoods with high shares of full-time workers have
no guarantee of class privilege. Most everyone, everywhere, is working furiously if they’re able,
except the disabled and the precariat; ‘never worked,’ ‘economically inactive,’ and long-term
unemployment all have loadings of 0.22 or below on Factor 1, accounting for less than 5 percent
of the original indicator variance. Class privilege, however, has a distinctive relationship with
racial and ethnic difference. None of the variables measuring non-White ethnoracial identity
achieves significant loadings on Factor 1, implying that the professionalisation / working-class
dimension cuts across these community differences. White privilege, however, assumes a very
particular form: insignificant loadings for White British (0.10) and White Irish (-0.14), along
with a reasonably strong loading for White Other in the professionalisation direction (-0.68).
These results suggest that we’re detecting the mobile whiteness of Europeans, Americans,
perhaps a few Australians, and others in the transnational capitalist class.8
The second factor is a contemporary reflection of the old Shevky-Bell “family status”
construct. At one end of the axis, strongly negative loadings appear for unemployment, lower-
quality housing, single, never-married persons, and local authority rental flats. At the other
extreme, strongly positive loadings appear for average household size, average rooms per 8 ‘White Other” accounts for 2.28 percent of all respondents across all of England and Wales, compared with 76.7
percent for White British and 1.08 percent for White Irish (CMCCSR, 2007, p. 18). White Other displays
significant positive spatial autocorrelation (Moran’s I=0.55 at first-order Queen contiguity, where 999 randomized
permutations yields a significance level less than 0.001). The pattern highlights not only the expected areas of
Westminster, Kensington, and Chelsea, but also a scattered patchwork to the north, through parts of Camden,
Haringey, and Enfield.
31

household, ownership (both mortgage-free and mortgaged), married-couple households, persons
with Qualification Level 2, and small employers. It seems most reasonable, therefore, to
interpret Factor 2 as a combination of postindustrial family status with contemporary English
housing classes (Rex and Moore, 1967). Surprisingly, full-time employment has only a weak
loading in the ‘non-traditional family’ direction (-0.23), while both part-time work and self-
employment load moderately in the opposite direction (0.54, 0.49). These results suggest an
erosion in the stable employment relations of British Fordism,9 and the generalized rise of a
contingent petit-bourgeoisie where self-employed entrepreneurs bear many of the risks once
assumed by large capitalist firms and/or the state. Ethnographic research (e.g., Struder, 2002)
documents that self-employment is entangled with immigration, ethnic identity, and gender
relations -- and that it sometimes provides opportunities for subaltern upward mobility. Our
results, however, diverge from this interpretation; neighbourhood self-employment rates load
significantly only on Factors 1 and 2, with no substantive loadings for ethnoracial variables.
Self-employment lines up reasonably well with professionalisation, both in the structure of
Factor 1 and in the inspection of the raw correlation coefficients across the 24,140
neighbourhoods.10
The subsequent factors extracted from the data matrix highlight other aspects of labour
market and housing diversity, household circumstances, immigration, and racial-ethnic identity
9 Note, however, that this erosion is by no means complete. Full-time employment (-0.86) loads strongly negatively
on Factor 3, at the opposite end of the continuum from neighborhoods with high proportions of those who have
never worked (+0.72).
10 The strongest correlations for self-employment rates are with Qualification levels 4 or 5, higher and lower
professionals, and both large and small employers; equally strong magnitudes for negative correlations also appear
for lower supervisory, semi-routine, and routine occupations. Self-employment is bound up with
professionalisation, in other words, but it magnifies rather than erases class inequality.
32

(Table 3). We will use these additional dimensions shortly in a neighbourhood taxonomy, but
unfortunately our central purpose does not give us sufficient time to describe each of these axes
in the rich detail they merit; instead the story requires us to confine our focus to Factors 1 and 2.
Recall that the former measures social class: at one end of the continuum, clearly working-class
communities; at the other end, scores signifying professionals and the new middle classes.
Factor 2 captures family status and housing classes: strongly positive scores for neighbourhoods
with lots of married couples and high rates of homeownership, strongly negative scores for areas
dominated by singles, lower-quality housing, and local authority housing. But how do these
separate dimensions of contemporary social class relate to one another in the explicitly local,
explicitly spatial worlds of the metropolis? Recall that the structure presented in Table 3 relies
on the classical methods of factorial ecology as applied to 24,140 neighbourhood units treated as
aspatial observations -- each one a separate row in a large data matrix. The resulting factors are
mathematically constrained to be orthogonal (uncorrelated, un-related) while no inherently
spatial variables are included. What this means is that the empirics we use to approach different
aspects of social class are ripped out of spatial context: once we have perpetrated this
methodological violence, however, we have constructs that are as close as we can get to ‘pure’
socio-political measures. Now we take one more step: test for explicitly spatial relations
between the aspatial class constructs. This gives us a brief, partial glimpse of two different
facets -- a parallax view, if you will -- of the socio-spatial dialectic of class in London (Zizek,
2006; Soja, 1980).11
11 This is just one of many alternative ways that the conventional infrastructure of positivist quantitative methods can
be put into dialogue with nonpositivist/nonquantitative social theory. See Bunge and Bordessa (1975), Heynen and
Barnes (2011), and Bunge (2011).
33

If the working class has disappeared -- or if the local neighbourhoods of the working
classes have been erased -- then searching for spatial effects should yield a pattern of pure
random noise that would be impossible to interpret. We used Anselin’s (1995) methods to create
a bivariate local indicators of spatial association (LISA) map relating our two factors of social
class and family status/housing classes. The approach can best be interpreted as a map of
spatialised correlation coefficients.12 Figure 2 presents the results of the analysis, while Figure 3
includes borough boundaries to facilitate interpretation.
Figure 2. A Parallax View of Social Class in London.
12 To calculate the LISA cluster map, we used a first-order Queen contiguity matrix, with a 999-permutation
randomization routine, to test for statistical significance. Significant patterns are shown where P<0.05. See Anselin
(1995) and Anselin (2004).
34

Figure 3. Reference Map of Boroughs/Local Authorities in the Greater London Region.
Class matters, and so does context. In the areas shaded white on Figure 2, there is no
explicitly spatial correlation between a neighbourhood’s working-class character and the
family/housing-class composition of surrounding neighbourhoods. Yet vast portions of the map
are not shaded white. In red, we see neighbourhoods where the traditional working class is set
within a surrounding context of ‘traditional’ married-couple family structures and
homeownership. These areas highlight the southern half of Croydon, Bromley, and especially
Havering -- which is part of a crescent that is mostly “white, lower middle-class south Essex
rather than East London.” (Baston, 2008). This is the kind of discourse that spatially others East
35

London while carefully avoiding any “working class” label; our use of “working class” to
interpret this map is the cartographer’s engagement with Zizek’s (1999, p. 186) challenge to the
“notorious ‘middle class’ which is precisely the ‘non-class.’”
Solid blue neighbourhoods, by contrast, map out the territories of professionalisation
analyzed by Hamnett (2003) and Butler et al. (2008), surrounded by the ‘nontraditional’ family
and housing circumstances that are now the established tradition for the deeply gendered
workaholic worlds of “capital culture” in London’s financial services constellation (McDowell,
1997). Different types of significant spatial outliers are also important. Light blue areas in
Southwark, Newham, and parts of Greenwich suggest a creeping professionalisation into areas
surrounded by traditional family neighbourhoods. Conversely, areas shaded pink represent
working-class districts surrounded by family and/or housing environments that depart from the
twentieth-century patriarchal mode of social reproduction (Walby, 1986).
This is a complex map. But it is by no means random or chaotic, and it is not universally
professional or middle-class -- even inside those elite competitive inner boroughs. As a broad
generalisation, professionalisation makes sense if we 1) focus solely on those neighbourhoods
shaded solid blue in the inner boroughs, 2) ignore the surviving working-class pockets in these
boroughs (the many patches of pink and red), and 3) ignore those neighbourhoods where
professional and working-class lives and family/housing circumstances are currently in flux, too
dynamic to exhibit any clean pattern of spatial autocorrelation: the methodology identifies the
areas shaded white as “no significant spatial correlation,” but a moment’s quick reflection simply
reminds us that this is precisely the significance. Many of those areas shaded white are the site
of ongoing class and space contestations. These three assumptions should not be adopted
casually or uncritically. The “professionalisation” generalisation also ignores the new middle-
36

and working-classes, as immigration and contingent relations amongst ethnoracial and religious
segregation (Peach, 2006) remake vast sections of Brent, Harrow, Ealing, and Hounslow.
This spatial-correlation LISA approach is valuable, and each of the fifteen unique
bivariate geographical relations amongst Factors 1 through 6 yields a separate, richly detailed
map that cries out for in-depth interpretation and local engagement.13 But is it possible to distill
all these separate maps into a single snapshot? At this point we must return, to consider our third
spatial story: what does the classification of London’s 1966 neighbourhoods (Daly, 1971) look
like if updated for the contemporary, postindustrial city-region?
13 Raw exports of all fifteen of the LISA maps, each created with the same thresholds described for Figure 3, are
available at http://www.geog.ubc.ca/~ewyly/replication/london/
37

Figure 4. A Neighbourhood Ecology of the Greater London Region.
Figure 4 represents the results of our fifteen-cluster solution, along with interpretive labels
assigned to each neighbourhood type. We reiterate the obvious but crucial reminder:
taxonomies cannot interpret themselves. Our labels are inescapably subjective interpretations,
intended to begin conversations, not shut them down. But we begin the conversation like this:
isn’t this a rich, fascinating topography of social relations? The factor-analytic and cluster
procedure all takes place in the abstract mathematical world of geometric hyperspace, with no
reference to ‘place’ other than the fact that the observations are those 24,210 output areas given
to us by the census. And yet, once the results are mapped, the historical and contemporary
38

geographies of social class are laid bare for all to see. The social landscapes of working classes
that are too often portrayed as in “terminal decline” (Butler et al., 2008) have certainly changed
(cf., Buck et al., 2002); but the only way they can be said to have disappeared is if we refuse to
acknowledge how many working-class jobs are being created in the supposedly postindustrial,
post-materialist service industries.
The sharp divide Hamnett (2008) sees in 1966 London (Daly, 1971) is still visible
between the West End and the East End. Professionalisation is symbolized in various shades of
blue. Westminster, along with many parts of Kensington, Chelsea, Camden, and Islington, are
dominated by ‘professional habitus’ neighbourhoods, with a combined total population of almost
600 thousand. These neighbourhoods have the highest shares of people with Qualification
Levels 4 or 5 (58 percent), and workers employed in financial and real estate corporations; most
residents are White, and the proportion (19.1 percent) identifying as “White Other” is the highest
amongst all the fifteen neighbourhood types. Not surprisingly, the “aspiring professional”
neighbourhoods (population 436 thousand) exhibit a similar spatial concentration; most residents
here are university educated, unmarried and not religious, and working in higher professional
occupations; never-married single-person households comprise more than 40 percent of all
homes in these parts of the city.
At the other end of the class continuum, the metropolis is more fragmented as racial and
ethnic transformations remake the working classes. Separate clusters are distinguished for
neighbourhoods marginalized by the (formal, paid) workforce, by the remaining geographies of
the shrinking welfare state, and by changing patterns of ethnoracial and religious segregation
(Peach, 2006). The rhythms of daily life and social reproduction in these communities are
shaped by informal networks of community entrepreneurialism and work that takes place within
39

the household and family domain -- sustained by gender relations and multi-generational living
arrangements not well-suited to the accelerated articulation of modes of production of
transnational capital. There’s a lot of work and evolving class dynamics in these areas, in other
words, that falls outside the purview of official statistics that designate non-monetized labour as
“economically inactive”; there are also some flows of state transfers designated as ‘welfare’ and
‘social assistance’ that must be carefully considered by the huge recurrent bonuses and salaries
permitted to continue flowing into the blue “professional habitus” areas after, inter alia, the
US$182 billion committed by the U.S. government so far to a single firm -- the American
International Group -- thanks to the financial “innovations” of the Wizards of Canary Wharf.
We have labeled the three different green-shaded “marginalized social reproduction”
communities to identify the ethnoracial groups that have their highest proportional
concentrations in these clusters (Bangladeshi, for instance in Tower Hamlets, Pakistanis across
much of Newham; White British in Newham, Hackney, and parts of South Essex). But it is
crucial to remember that no matter what kind of tortured statistical procedure we use, a
taxonomy always yields categories with internal homogeneity.14 The “Marginalised social
reproduction (Pakistani)” neighborhoods, therefore, are where Pakistanis have their highest
representation among all the neighbourhood types (13.4 percent); yet these communities -- with a
combined population of about a quarter-million -- actually have higher shares of those
identifying themselves as Indians (18.1) and White British (29.2). But high shares of people
without formal qualifications cut across all the green-shaded neighbourhood types (38.5, 29.2,
and 34.4 percent in the order they appear on Figure 4), and so do high shares of the
‘economically inactive’ population (42.7, 32.9, and 33.9 percent, respectively). These
14 The only way to avoid such generalized losses, of course, would be to replace the fifteen-color scheme in Figure 4
with a selection of 24,210 separate colors to designate the unique qualities of each neighbourhood.
40

circumstances are significant facets of class relations. Nearly half of the housing units in the
‘Bangladeshi’ and ‘White British’ social reproduction communities are local authority rentals;
this share is much lower (only 11 percent) for the Pakistani areas. Taken together, all the areas
labeled “marginalized social reproduction” include 864 thousand people; four-fifths live in the
pale green areas dominated by White British residents.
We are reluctant to use the middle-class label to identify those with only high school
qualifications, working in intermediate occupations; instead, we suggest that “upper working
class” is a more appropriate label for these communities, which have high shares of married-
couple households identifying themselves as White British and Christian. These areas trace out a
mosaic of communities that encompass more than 1.5 million people in the areas shown in light
and medium pink. All of these working-class neighborhoods are distinguished from those places
that most closely resemble the “traditional” English working class that is presumed to be
disappearing: more than 625,000 people live in neighborhoods where 82 percent identify
themselves as White British, where 37 percent report the lowest levels of qualifications, and
where 47 percent of the workers are employed in Manufacturing, Construction, Trade or Repair,
and Transport, Storage, or Communications.
Clearly, our methods do not allow us to provide a definitive evaluation of an historical
claim on the disappearance of the working class; if categorizations are used to define “working
class” narrowly, then surely the evidence will indeed show something that looks like “terminal
decline.” But the meanings of these categories change over time. There have been dramatic
changes in key aspects of life in the “traditional English working class” sections of our map
shaded bright red. There is no dispute that Fordist-era industries, occupations, and household
arrangements have largely disappeared. But the new firms, jobs, and living arrangements have
41

not replaced a Fordist-era working class with a universally post-industrial middle class. Post-
industrial society is not without its own working-class lives, meanings, and geographies.
Mapping these geographies demonstrates that London’s geography remains remarkably complex
This map warns us against broad, metropolitan-scale generalisations; such generalised
assertions risk ignoring and suppressing important social geographies -- and encourage policy
elites to implement decisions that will further undermine (old and new) working-class
communities. To be sure, the past half-century has eroded some of the details in the
geographical portrait painted so vividly by Wilmott and Young (1973, cited in Butler et al.,
2008, p. 68):
“The Cross, into which working-class people were concentrated, is from east to west
along the Thames Valley, to the north along the Lea Valley and to the south, coinciding
to some extent with the valley of the River Wandle. The pattern of distribution is
explained mainly by the location of docks, industry and communication routes, which
have mostly been located on the low land. The more favoured residential areas,
conversely, are commonly on higher ground. Thus the physical geography of London has
helped to shape its class geography.”
Some of these patterns have not yet been professionalised -- which is another way of
saying that not all of London’s working classes have been erased or disappeared from the
metropolis. The patterns are complex, but seen in parallax offer potential for connection. The
interwoven marginalisations of ethnoracial difference and embattled housing welfare state are
clear in Tower Hamlets, for instance, where Bangladeshis account for 39 percent of the
population and 47 percent of the housing is local authority rentals; but council housing also
42

comprises a large share -- 28 percent -- in those bright red ‘Old English working class’ zones,
where 82.4 percent of the population is White British. Ownership also matters here. But
mortgaged ownership exceeds debt-free ownership (32.8 vs. 19.8 percent), and the ownership
rate in Old English working class districts actually falls short of that in the marginalized social
reproduction (Pakistani) communities. And recall that while these latter areas have the highest
concentration of Pakistani families across all the clusters (13.4 percent), they also have
considerable internal diversity, including a large share of White British (29.2 percent). Scores of
other examples could prove the simple point: no matter how detailed the taxonomy, no matter
how quantitatively ‘pure’ the classification of class, the metropolis stubbornly reasserts its
complexity, conflict, and the relational experiences of social interactions at the neighbourhood
scale. London is not the same kind of working class industrial city of a half-century ago; but
there is still an old working class, and there are new working classes toiling in the neo-Taylorist
retail shops and office keyboard jungles of the postindustrial city.
The internal variations in the clusters (and within each of those output areas) brings us to
our fourth and final spatial story -- an attempt to measure some of the material aspects of housing
class (Rex and Moore, 1967) at the household level. To get beyond the ecological view, we turn
to the Small-Area Microdata (SAM) files to explore the interrelations among homeownership,
household mobility, and various circumstances of social class (Table 4). Logistic regression
model confirm the expected higher rates of moving among renters (an effects-coding odds ratio
of 2.66), and younger household reference persons (ratios of 2.65 and higher for those younger
than 30). Similarly, the familiar age-trajectory into ownership is clear: odds ratios of 0.62 in the
early twenties rising steadily to 1.67 for those in their fifties. Controlling for these and other
43

Table 4. Homeownership, Mobility, and Social Class in the Greater London Region.
HomeownershipHomeownership (Movers only) Mobility
Parameter Odds Parameter Odds Parameter OddsVariable Estimate Ratio Estimate Ratio Estimate Ratio
Intercept -0.809 *** 0.445 -0.720 *** 0.487 -2.784 *** 0.062Age 20-24 -0.480 *** 0.619 -0.576 *** 0.562 1.081 *** 2.948Age 25-29 -0.672 *** 0.511 -0.473 *** 0.623 0.975 *** 2.651Age 30-39 -0.289 *** 0.749 0.002 1.002 0.489 *** 1.631Age 40-49 0.052 *** 1.053 -0.025 0.976 -0.173 *** 0.841Age 50-59 0.512 *** 1.669 0.337 *** 1.400 -0.982 *** 0.375Female family reference person -0.072 *** 0.931 -0.034 0.967 -0.008 0.992Hours worked per week 1-15 -0.027 0.974 -0.139 0.870 -0.183 *** 0.833Hours worked per week 16-30 -0.130 *** 0.878 -0.047 0.955 -0.131 *** 0.877Hours worked per week 31-37 0.038 * 1.038 0.064 1.066 -0.041 0.960Hours worked per week 38-48 0.023 1.023 -0.046 0.955 0.140 *** 1.150Hours worked per week 49+ 0.077 *** 1.080 -0.011 0.989 0.186 *** 1.204Household earners: 1 0.070 *** 1.072 0.015 1.015 0.010 1.010Household earners: 2+ 0.768 *** 2.155 1.019 *** 2.771 -0.184 *** 0.832Lone parent household -0.317 *** 0.728 0.151 *** 1.163 -0.470 *** 0.625Married /cohabiting couple - no children -0.043 *** 0.958 -0.402 *** 0.669 0.719 *** 2.053Move from outside LAD/LGD but in UK 0.089 *** 1.093Move from outside UK -1.108 *** 0.330Move within LAD area 0.203 *** 1.225No usual address one year ago -0.202 *** 0.817Class 1 (Higher managerial and Professional Occupations) 0.777 *** 2.176 0.353 *** 1.424 0.441 *** 1.555Class 2 (Lower managerial and professional occupations) 0.526 *** 1.693 0.286 *** 1.331 0.212 *** 1.236Class 3 (Intermediate occupations) 0.298 *** 1.347 0.126 ** 1.134 0.121 *** 1.129Class 4 (Small employers and Own Account workers) 0.493 *** 1.637 0.652 *** 1.919 -0.076 *** 0.927Class 5 (Lower supervisory and technical occupations) -0.081 *** 0.922 0.053 1.055 -0.158 *** 0.854Class 6 (Semi-routine Occupations) -0.435 *** 0.647 -0.338 *** 0.713 -0.149 *** 0.862Class 7 (Routine Occupations) -0.573 *** 0.564 -0.402 *** 0.669 -0.278 *** 0.757Renters 0.978 *** 2.658
Number of observations 143,773 18,942 143,773 Number of owners 97,300 8,387 Number of movers 18,942 Pseudo-R-squared 0.270 0.162 0.207Percent concordant 76.3 69.8 76.8
*Estimate significant at P<0.05; **0.01; ***0.001.
Data Source: Small Area Microdata, courtesy of CMCCSR (2007).
factors provides a precise measure of the link between occupational class and property
ownership. We do see the anticipated divide between managerial and professional occupations,
versus the working-class routine and semi-routine jobs. Yet some of the results merit caution
before generalizing a new middle-class property ownership utopia across the metropolis. The
ambiguity of SEG 5.2 -- with those cashiers, debt collectors, telemarketers, and traffic wardens --
44

obviously clouds the meaning of the 1.69 odds ratio for SEC Class 2. Similar class ambiguity is
apparent among small employers and own-account workers (Class 4), who have almost exactly
the same ceteris paribus ownership odds ratio (1.64). Additionally, the ownership gap between
Class 2 workers and the traditional working classes is not intensified among recent movers, as
we would expect under conditions of mass professionalised opportunity and mobility. The Class
2 / Class 7 odds ratios are unequal by a factor of 3.00 for all households, versus 1.99 for those
moving within the previous year. Attaining the middle-class status of a Class 2 occupation,
moreover, offers access to ownership that is contingent across the metropolis. Stratifying the
models across the 32 separate boroughs of the region highlights the strong ownership premium
of Class 2 workers able to compete to live in the central zones -- from Islington, Camden,
through the City and Westminster into Kensington & Chelsea, and Hammersmith and Fulham.
All these boroughs post Class 2 odds ratios over 2.0; but so do the more distant commuter zones
of Bromley and Sutton. And in Brent, Ealing, and Newham, the “middle class” meaning of a
Class 2 occupation yields the lowest ownership odds ratios across the entire region (all about
1.4).15 Put simply, even the best occupational taxonomies must be put into a relational dialogue
with other social relations if we are able to talk meaningfully about social class. Hamnett and
Butler (2010) demonstrate the importance of such considerations in their work on the divergence
of ethnic minorities between suburban homeownership and social and private rental housing.
15 Modeled another way, with the entire SAM dataset pooled and interaction terms added, we find negative Class 2
effects in Ealing (0.702) and Brent (0.764), while the strongest positive increments in Kensington/Chelsea (1.421)
and Camden (1.404).
45

Conclusions
“Every component of gentrification, when radically analyzed, leads to the same
conclusion, Hamnett’s facts, I suspect, if critically thought through, no less than
Slater’s.” (Marcuse, 2010).
In this paper we have argued that parts of the contemporary urban literature have stripped class
of its antagonistic dimensions; separating social class from its relations to capital (Zizek, 1999).
We point to Richard Florida’s creative class thesis as an exemplar. In particular, we point to the
fact that he pushes a class agenda, one based upon a utopian universalised upward mobility,
which identifies no necessary socio-economic antagonisms. We also see this mirrored within the
academic literature. Focusing on Butler et al.’s (2008) recent characterisation of London as a
middle class city, we highlight the (persistent) problem – accentuated by post-industrial change –
of reading class relations from class structure schemas. Here, we argue that the Goldthorpe-
inspired, neo-Weberian social class classification of the UK Census is problematic, not least
because it maintains a theoretical basis developed from industrial circumstances. This is most
notable in Butler et al.’s (2008) identification of middle class growth (1981-2001) in the SEG 5.1
and 5.2 groups; a grab-bag of occupations with questionable class identity. More
problematically, however, is the reading of a decline in class antagonisms from an uncritical
usage of the class structure schema.
Through the acceptance of SEG 5.1 and 5.2 populations as firmly middle class and the
paired characterisation of expansion in these groups as London becoming homogeneously
middle class, Butler et al. (2008) bury London’s complex social geography. Using a classical
46

factoral analysis, we produce an alternative reading of London’s social geography. We show the
persistence of ‘working class’ presence throughout London, in the very neighbourhoods and
regions they have been mapped in the 1960s (Daly, 1971) and 1980s (Congdon, 1989). Through
disrupting Hamnett’s (1994) professionalization thesis, this is meant to recast debates over
neighbourhood change, and particularly gentrification, where a macro-narrative of ‘middle-class-
isation’ has meant the issues of displacement and working class existence have been dismissed
via a concomitant “replacement” thesis (Hamnett, 2003; also see Watt [2009] on the class
tensions within social housing).
This stated our factor analysis certainly shows London’s ‘working classes’ to be diverse
and socially and spatially fragmented. There are multiple industrial, ethnic, education and
religious planes of division in the city’s lower socio-economic groups. The city’s middle classes,
as demonstrated by the SEG categories themselves illustrate, are also diverse. What we therefore
highlight here is the persistent problem of dealing with class structure (Wright, 2005). Without
the archetypal industrial working classes from which to posit class positions (note: as we show,
these might be in decline, but they are still present – not ‘lingering’!), divisions are more difficult
to identity (Ranciere, 1999). Furthermore, without this group the mapping of class relations is
made more difficult; being incapable of (problematic) simple transposition.
Yet, we follow Zizek (1999) and argue the absence of this simple reading of structure
onto relations is productive if not cast as a diminishing of class antagonism per se. Zizek draws
upon Freud’s death drive as metaphor and follows Laclau and Mouffe (1989) to view antagonism
as persistent: “There is no solution, no escape from it; the thing to do is not to ‘overcome,’ to
‘abolish’ it, but to come to terms with it, to learn to recognize it in its terrifying dimension and
then, on the basis of this fundamental recognition, to try and articulate a modus vivendi with it”
47

(Zizek, 1989, p.5). Placed onto the neighbourhood scale, does this not provide us with a better
way to approach the question of class and the city? A way to identify the ways in which capital
necessarily generates conflict and antagonistic relations: A way to view the struggles over space
and place that take place in gentrifying neighbourhoods? A way to understand inequitable
geographies of investment? A way to understand how the commodification of housing erodes
community? A way to understand why low-paid immigrants work evenings to clean the offices
of the creative class? Our conclusion must be thus: that the characterisation of the middle class
metropolis, devoid of antagonisms, existing as a space of elective belonging, performs a
fetishistic politics? We must confront the ‘terrifying dimension’!
48
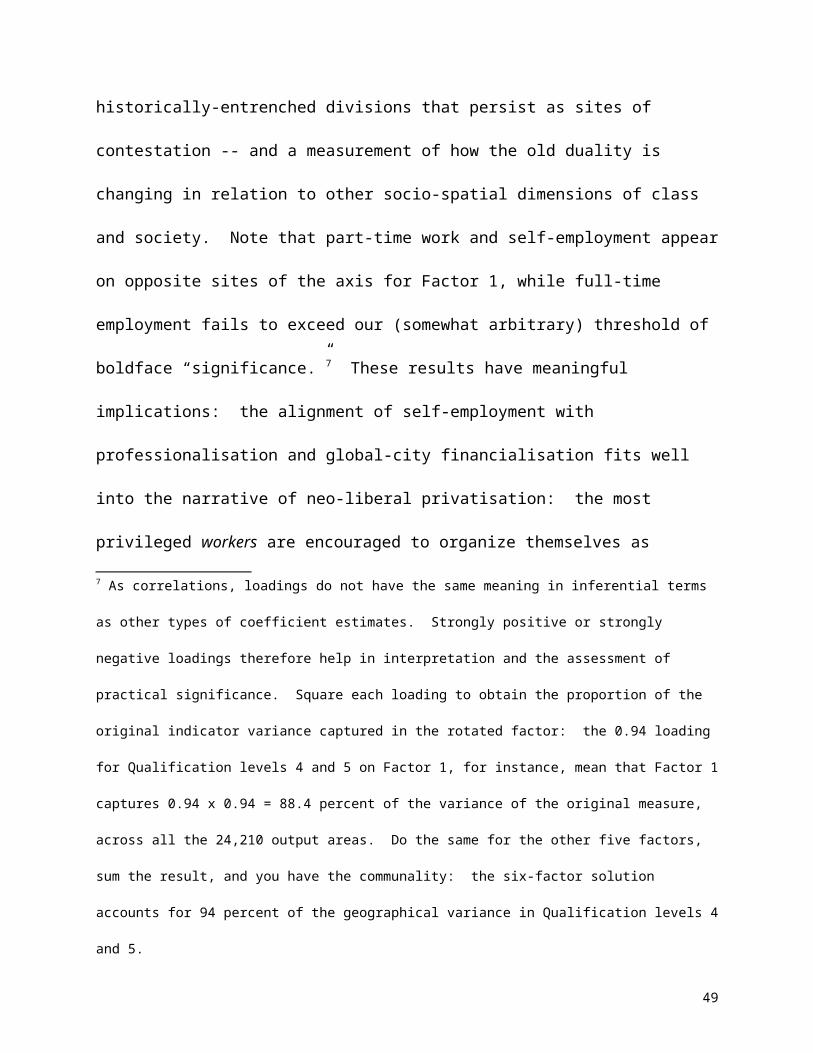
References
Aguiar, L. and Herod, A. (2006) (eds.) The Dirty Work of Neoliberalism: Cleaners in the Global
Economy. Oxford: Blackwell.
Anselin, L. (2004) GeoDa Release Notes, 0.9.5-i. Urbana, IL: Spatial Analysis Laboratory,
University of Illinois.
Anselin, L. (1995) Local indicators of spatial association -- LISA, Geographical Analysis, 27(2),
pp. 93-115.
Barnes, T. (2009) Not only ... but also: Quantitative and critical geography, Professional
Geographer, 61(3), pp. 292-300.
Baston, L. (2008) GLA constituency profile: Havering and Redbridge, The Guardian, 8
February.
Bell, D. (1976) The Coming Of Post-industrial Society: A Venture in Social Forecasting. New
York: Basic Books.
Bergman, M. and Joye, D. (2001) Comparing Social Stratification Schemas: CAMSIS, CSP-CH,
Goldthorpe, ISCO-88, Treiman, and Wright, Cambridge Studies in Social Research
Berry, B. (1968) Interdependency of spatial structure and spatial behavior: A general field theory
formulation, Papers in Regional Science, 21(1), pp. 205-27.
Berry, B. and Kasarda, J. (1977) Contemporary Urban Ecology. New York: Macmillan.
Beauregard, R. (1994) Voices of Decline: The Postwar Fate of US Cities. Oxford: Blackwell.
Blackler, F. (1995) Knowledge, knowledge work and organizations: an overview and
interpretation. Organization Studies, 16 (6), pp. 1021-1046.
Branch, M.C. (1973) An Atlas of Rare City Maps: Comparative Urban Design, 1830-1842.
New York: Princeton Architectural Press.
49

Bourdieu, P. (1987) Distinction: A Social Critique of the Judgement of Taste. Translated by
Richard Nice. Cambridge, MA: Harvard University Press.
Buck, N., Gordon, I., Hall, P., Harloe, M. and Kleinman, M. (2002) Working Capital. London:
Routledge.
Bunge, W. (2011) Fitzgerald: Geography of a Revolution. Athens, GA: University of Georgia
Press.
Bunge, W.W., and Bordessa, R. (1975). The Canadian Alternative: Survival, Expeditions, and
Urban Change. Geographical Monograph No. 2. Toronto: Department of Geography,
York University.
Butler, T. (2007) For gentrification? Environment and Planning A, 39(1), pp. 162-181.
Butler, T., Hamnett, C. and Ramsden, M. (2008) ‘Inward and Upward? Marking out social class
change in London 1981-2001’ Urban Studies, 45(2), pp. 67-88.
Cathie Marsh Centre for Census and Survey Research (CMCCSR) (2007) 2001 Small Area
Microdata Codebook. Manchester: University of Manchester.
Cochrane, A. (2003) The new urban policy: towards empowerment or incorporation? The
practice of urban policy. In: R. Imrie and M. Raco, eds. Urban Renaissance? New
Labour, community and urban policy, pp. 223-234, Bristol: Policy Press.
Congdon, P. (1989) An Analysis of Population and Social Change in London Wards in the
1980s, Transactions of the Institute of British Geographers, 14(4), pp. 478-91.
Daly, M. (1971) Characteristics of 12 clusters of wards in Greater London, Research Report
No.13, Department of Planning and Transportation, Greater London Council
Davidson, M. (2008) Spoiled Mixture: Where does state-led ‘positive’ gentrification end? Urban
Studies, 45(11), pp. 2385-2406.
50
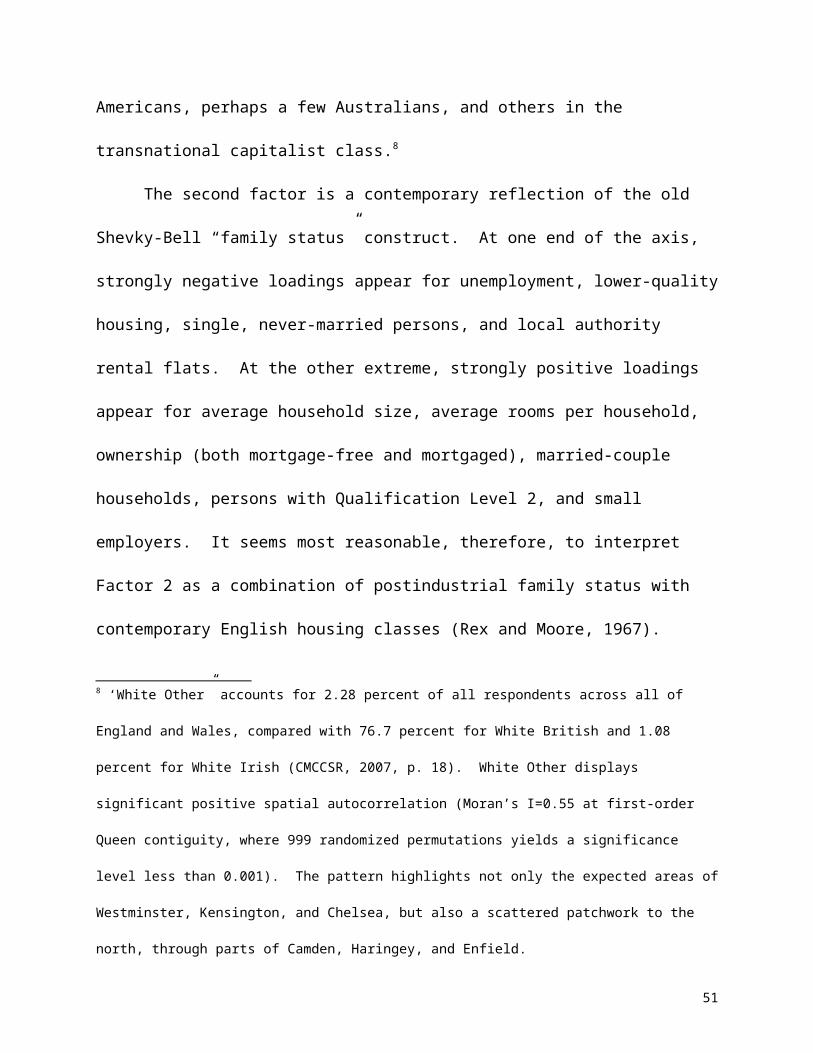
Dorling, D. (2011) Injustice: Why Social Inequality Persists. Bristol: Policy Press.
Erikson, R. & Goldthorpe, J. (1992) The Constant Flux: Class Mobility in Industrial Societies.
Oxford: Clarendon Press.
Esping-Andersen, G. (1993) Changing Classes: Stratification and Mobility in Post-industrial
Societies. London: Sage.
Evans, G. and Mills, C. (2000) In Search of the Wage-Labour/Service Contract: New Evidence
on the Validity of the Goldthorpe Class Schema, British Journal of Sociology, 51(4), pp.
641-661.
Evans, Y. Smith, A. (2006) Surviving at the margins? Deindustrialisation, the creative industries,
and upgrading in London’s garment sector, Environment and Planning A, 38(12), pp.
2253-2269.
Ferrera, M., Matsaganis, M. and Sacchi, S. (2002) Open coordination against poverty: the new
EU social inclusion process, Journal of European Social Policy, 12(3), pp. 227-239.
Fincher, R. and Iveson, K. (2008) Planning And Diversity In The City: Redistribution,
Recognition And Encounter. Basingstoke: Palgrave: Basingstoke.
Florida, R. (2002) The Rise of the Creative Class: And How It's Transforming Work, Leisure,
Community and Everyday Life. New York: Basic Books.
Freeman, L. (2006) There Goes the Hood: Views of Gentrification from the Ground Up.
Philadelphia: Temple University Press.
Giddens, A. (1999) The Third Way: The Renewal of Social Democracy. Cambridge: Polity Press.
Goldthorpe, J. (1992) Social Mobility & Class Structure. Oxford: Oxford University Press.
Goldthorpe, J. (2007) On Sociology Second Edition Volume Two: Illustration and Retrospect.
Stanford, CA: Stanford University Press.
51

Goldthorpe, J. and Marshall, G. (1992) The Promising Future of Class Analysis: A Response to
Recent Critiques, Sociology, 26(3), pp. 381-400.
Gould, P. (1999) Becoming a Geographer. Syracuse: Syracuse University Press.
Hamnett, C., and Butler, T. (2009) The changing ethnic structure of housing tenures in London,
1991-2001, Urban Studies, 47(1), pp. 55-74.
Hamnett, C. (2010) On gentrification: ‘I am critical. you are mainstream’: A response to
Slater, City, 14(1-2), pp. 180-186.
Hamnett, C. (2003) Gentrification and the middle-class remaking of inner London, 1961–2001,
Urban Studies, 40(12), pp. 2401–2426.
Hamnett, C. (1994) Social Polarisation in Global Cities: Theory and Evidence, Urban Studies,
31(3), pp. 401-424.
Harvey, D. (1989) From managerialism to entrepreneurialism: the transformation of urban
governance in late capitalism. Geografiska Annaler, 71(B), pp. 3-17.
Harvey, D. (2005) A Brief History of Neoliberalism. Oxford: Oxford University Press.
Hebbert, M. (1998) London: More by Fortune than Design. New York: John Wiley & Sons.
Heynen, N., and Barnes, T. (2011) Fitzgerald then and now. In Bunge, W., Fitzgerald:
Geography of a Revolution. Athens, GA: University of Georgia Press, pp. 1-7.
Johnston, R.J. (1978) Multivariate Statistical Analysis in Geography. New York and London:
Longman.
Katznelson, I. (1981) City Trenches. New York: Pantheon.
Kelly, J. (2010) Do the poor have the right to live in expensive areas? BBC News Magazine, 4
November.
Laclau, E. (1996) Emancipation(s). London: Verso.
52

Laclau, E. and Mouffe, C. (2001) Hegemony and Socialist Strategy: Towards a Radical
Democratic Politics. London: Verso.
Landry, C. (2008) The Creative City: A Toolkit for Urban Innovators. London: Earthscan.
Lefebvre H 1991[1974] The Production of Space Translated by Nicholson-Smith D. London:
Blackwell.
Lefebvre H 2003[1970] The Urban Revolution Translated by Bononno R. Minneapolis:
University of Minnesota Press.
Ley, D. (1996) The New Middle Class and the Remaking of the Central City. Oxford: Oxford
University Press.
Marcuse, P. (2010) On gentrification: A note from Peter Marcuse, City 14(1-2), pp. 187-188.
McDowell, L. (1997) Capital Culture: Gender at Work in the City. Oxford: Blackwell.
Murdie, R. (1969) Factorial Ecology of Metropolitan Toronto, 1951-1961: An Essay in the.
Social Geography of a City, Research paper (Department of Geography) No. 116,
University of Chicago.
Pahl, R. (1988) Some remarks on informal work, social polarization and the social structure,
International Journal of Urban and Regional Research, 12(2), pp. 247–267.
Peach, C. (2006) Islam, ethnicity, and South Asian religions in the 2001 Census, Transactions of
the Institute of British Geographers, NS 31(3), pp. 353-370.
Peck, J. (2005) Struggling with the Creative Class, International Journal of Urban and Regional
Research, 29(4), pp. 740-770.
Peck, J. and Tickell, A. (2002) Neoliberalizing space. Antipode, 34(3), pp. 380-404.
Powell, M. (2000) New Labour and the third way in the British welfare state: a new and
distinctive approach. Critical Social Policy, 20(1), pp. 39-60.
53
Ranciere, J. (1991a) The Ignorant Schoolmaster. Stanford, CA: Stanford University Press.
Ranciere, J. (1991b) The Nights of Labor: The Workers' Dream in Nineteenth Century France.
Philadelphia: Temple University Press.
Ranciere, J. (1999) Disagreement. Minneapolis: University of Minnesota Press.
Rex, J., and Moore, R. (1967) Race, Community, and Conflict. Oxford: Oxford University
Press.
Rose D. and O'Reilly K. (1998) The ESRC Review of Government Social Classifications.
London: Office for National Statistics.
Rose D., Pevalin, D. and O’Reilly, K. (2005) The NS-SEC: Origins, Development and Use.
Basingstoke: Palgrave.
Roseberry, W. (1996) The Rise of Yuppie Coffees and the Reimagination of Class in the United
States, American Anthropology, 98(4), pp. 762-775.
Runciman, W.G. (1990). How Many Classes are there in Contemporary British Society?
Sociology, 24, pp. 377-396.
Sassen, S. (2001) The global city: New York, London, Tokyo. Princeton, NJ: Princeton University
Press.
Savage, M. Barlow, J., Dickens, P., Dickens, P. and Fielding, T. (1992) Property, Bureaucracy
and Culture: Middle Class Formation in Contemporary Britain. London: Routledge
Savage, M., Bagnall, G. And Longhurst, B. (2004) Globalization and Belonging. London: Sage.
Shearmur, R. (2010) A world without data? The unintended consequences of fashion in
geography, Urban Geography, 31(8), pp. 1009-1017.
Slater, T. (2011) From ‘criminality’ to marginality: Rioting against a broken state, Human
Geography 4(3), pp. 106-115.
54

Slater, T. (2010) On gentrification: Still missing Marcuse: Hamnett’s foggy analysis in London
town, City, 14(1-2), pp. 170-179.
Slater, T. (2006) The eviction of critical perspectives from gentrification research, International
Journal of Urban and Regional Research, 30(4), pp. 737–57.
Smith, N. (2002) New globalism, new urbanism: gentrification as global urban strategy,
Antipode, 34(3), pp. 434-457.
Sorensen, A.B. (2000) Toward a Sounder Basis for Class Analysis, American Journal of
Sociology, 105(6), pp. 1523-58.
Steinmetz, G., ed. (2005) The Politics of Method in the Human Sciences: Positivism and its
Epistemological Others. Durham, NC: Duke University Press.
Thompson, E.P. (1964) The Making of the English Working Class. New York: Pantheon Books.
Wacquant, L. (2008) Relocating Gentrification: The Working Class, Science and the State in
Recent Urban Research, International Journal of Urban and Regional Research, 32(1),
pp. 198-205.
Walby, S. (1986) Patriarchy at Work: Patriarchal and Capitalist Relations in Employment.
London: Polity Press.
Watt, P. (2008) The Only Class in Town? Gentrification and the Middle-Class Colonization of
the City and the Urban Imagination, International Journal of Urban and Regional
Research, 32(1), pp. 206–11.
Watt, P. (2009) Housing Stock Transfers, Regeneration and State-Led Gentrification in London,
Urban Policy and Research, 27(3), 229–242.
55

Willmott, P. and Young, M. (1973) Social class and geography, in D. Donnison and D. Eversley
(eds.) London: Urban Patterns, Problems and Policies, pp. 190-214, London:
Heinemann.
Wills, J. (2008) Making class politics possible: Organizing contract cleaners in London,
International Journal of Urban and Regional Research, 32(2), pp. 305-24.
Wright, E.O. (1985) Classes. London: Verso.
Wright, E.O. (2005) If “class” is the answer, what is the question? In Wright, E.O. (ed)
Approaches to Class Analysis, pp. 180-192, Cambridge: Cambridge University Press.
Zizek, S. (1989) The Sublime Object of Ideology. London: Verso.
Zizek, S. (1999) The Ticklish Subject. London: Verso.
Zizek, S. (2006) The Parallax View. Cambridge, MA: MIT Press.
56