clasp commercial refrigeration equipment: mapping and … · 2018-08-03 · clasp commercial...
TRANSCRIPT
CLASP Commercial refrigeration equipment: mapping and benchmarking by
Waide Strategic Efficiency Ltd, Saint Trofee and Cemafroid
January 2014 Paul Waide Sietze van der Sluis Thomas Michineau
This work, developed with support from the ClimateWorks Foundation, is part of CLASP’s Global Research program and in affiliation with CLASP’s work as SEAD Operating Agent.
© Waide Strategic Efficiency Ltd 2013.
All rights reserved. This document is expressly provided to and solely for the internal use of CLASP. Waide Strategic Efficiency Ltd accepts no liability of whatsoever nature for any use of this document by any other party.
This document has been prepared in good faith on the basis of information available at the date of publication. Waide Strategic Efficiency Ltd does not guarantee or warrant the accuracy, reliability, completeness or currency of the information in this publication nor its usefulness in achieving any purpose. Readers are responsible for assessing the relevance and accuracy of the content of this publication. Waide Strategic Efficiency Ltd will not be liable for any loss, damage, cost or expense incurred or arising by reason of any person using or relying on information in this publication.
CLASP Commercial refrigeration equipment: mapping and benchmarking
i | P a g e
CONTENTS
Executive Summary .......................................................................................................................... 1 1. Introduction and scope ........................................................................................................... 9 2. Reach in coolers .................................................................................................................... 12
2.1 Types of refrigerated display cabinets .............................................................................. 14 2.2 Energy performance test procedures ............................................................................... 16
International standards ......................................................................................................... 18 Australian standards ............................................................................................................. 18 Brazilian standards ................................................................................................................ 18 Chinese standards ................................................................................................................. 18 European standards .............................................................................................................. 18 Indian standards .................................................................................................................... 19 Japanese standards ............................................................................................................... 19 North American standards .................................................................................................... 20 South African standards ........................................................................................................ 21
2.3 Energy efficiency policies .................................................................................................. 21 MEPS ..................................................................................................................................... 21 Labelling ................................................................................................................................ 34 Financial and fiscal incentives and refrigerant orientated policies ....................................... 36
2.4 Energy efficiency of product markets ............................................................................... 38 2.5 Stocks and sales ................................................................................................................ 43 2.6 Benchmarking of product efficiency: comparison across different test procedures ....... 50 2.7 Higher energy efficiency design options and potential efficiency improvement cost‐benefits .......................................................................................................................................... 58 2.8 Life cycle cost energy engineering analysis for reach in coolers ...................................... 63 2.9 Potential for energy savings at the macro scale ............................................................... 79
Modelling and assumptions .................................................................................................. 81 Australia ................................................................................................................................ 83 Brazil ...................................................................................................................................... 83 China ...................................................................................................................................... 84 Europe ................................................................................................................................... 84 India ....................................................................................................................................... 85 Japan ..................................................................................................................................... 85 Mexico ................................................................................................................................... 86 South Africa ........................................................................................................................... 86 USA ........................................................................................................................................ 87
3. Refrigerated vending machines ............................................................................................ 88 3.1 Types of refrigerated vending machine ............................................................................ 88 3.2 Energy performance test procedures ............................................................................... 89
Adjusting energy consumption for differences in test procedures ...................................... 90 3.3 Energy efficiency policies .................................................................................................. 94
Australia ................................................................................................................................ 94 Brazil ...................................................................................................................................... 94 China ...................................................................................................................................... 94 Europe ................................................................................................................................... 94 India ....................................................................................................................................... 95 Japan ..................................................................................................................................... 95 Mexico ................................................................................................................................... 97 South Africa ........................................................................................................................... 97 USA ........................................................................................................................................ 97
CLASP Commercial refrigeration equipment: mapping and benchmarking
ii | P a g e
3.4 Energy efficiency of product markets ............................................................................. 100 3.5 Stocks and sales .............................................................................................................. 100 3.6 Benchmarking of product efficiency: comparing across different test procedures ....... 102 3.7 Life cycle cost energy engineering analysis for refrigerated vending machines ............ 104 3.8 Potential for energy savings at the macro scale ............................................................. 112
Appendix A: Life cycle costs for reach in coolers as a function of energy efficiency ................... 117 A.1 Horizontal Open freezer, remote (RHF4) ........................................................................ 118 A.2 Horizontal Open freezer, integral (IHF4) ........................................................................ 119 A.3 Glass lid ice cream chest freezer, integral (IHF6) ............................................................ 120 A.4 Glass door (vertical) bottle cooler, integral (IVC4) ......................................................... 121 A.5 Vertical Open multi‐deck, cooled, remote (RVC2) .......................................................... 122 A.6 Vertical Open multi‐deck, cooled, integral (IVC2) .......................................................... 123
4. References ........................................................................................................................... 124

CLASP Commercial refrigeration equipment: mapping and benchmarking
iii | P a g e
Glossary
ASHRAE American Society for Heating, Refrigeration and Air Conditioning Engineers
ANSI American National Standards Institute
CEN Commité Européen de Normalisation
Commission European Commission
Commissioning the process of testing, checking or calibrating the function of any building services component, to advance it to a working order
CRE commercial refrigeration equipment
DIN Deutsches Institut für Normung (German Standards Organization)
DOE US Department of Energy
ECM electronically commutated motor
EEA European Economic Area
EU European Union
European standard a standard adopted by a European standardisation organisation
HER heat extraction rate (the COP (coefficient of performance) of CRE)
HT high temperature (see ISO EN 23953)
HVAC heating ventilation and air conditioning
Integral an integral (self‐contained) CRE device that does not have a remote condenser, see also plug‐in and self‐contained
IEA International Energy Agency
IEC International Electrotechnical Commission
ISO International Organization for Standardization
LCC life‐cycle cost
LLCC least life‐cycle cost
LT low temperature (see ISO EN 23953)
MEPS minimum energy performance standard
MS Member State (of the European Union)
MT medium temperature (see ISO EN 23953)
National standard a standard adopted by a national standardisation body
PSC permanent split capacitor
Plug‐in an integral (self‐contained) CRE device that does not have a remote condenser, see also integral and self‐contained
RDC refrigerated display cabinets
Reach‐in‐cooler a broad category of commercial refrigeration equipment that includes: refrigerated display cabinets, beverage coolers, and commercial service cabinets

CLASP Commercial refrigeration equipment: mapping and benchmarking
iv | P a g e
Remote a non‐integral (not self‐contained) CRE device that does have a remote condenser
RSA Republic of South Africa
Self‐contained an integral (self‐contained) CRE device that does not have a remote condenser, see also plug‐in and integral
Standard a technical specification, adopted by a recognised standardisation body, for repeated or continuous application. Compliance is not normally compulsory, unless the standard is referred to in legislation
TDA total display area
TEC total energy consumption
Thermostat a device that responds to temperature in a space, pipe, etc., to switch an item on or off. The control provided is usually less precise than using sensors, controllers and actuators, but thermostats can have advantages in terms of low cost and robustness (e.g. for safety cut‐outs). These are low‐cost devices and generally provide poor control compared with more sophisticated controls
US(A) United States (of America)
Variable speed adjusts the speed of a fan, motor or pump to match its duty to the load or control load or demand. Reducing the speeds of these devices will also reduce energy use
VM vending machine
CLASP Commercial refrigeration equipment: mapping and benchmarking
1 | P a g e
EXECUTIVE SUMMARY
This report presents the findings of the CLASP mapping and benchmarking study on commercial refrigeration equipment (CRE) conducted by Waide Strategic Efficiency, Saint Trofee and Cemafroid. The focus of the study is centred on commercial reach‐in coolers and on refrigerated vending machines. In the case of reach‐in coolers it considers products such as refrigerated display cabinets and beverage coolers but does not address professional refrigerated service cabinets (i.e. the type of products which store but do not display merchandise). The scope of the study is confined to addressing the energy performance of the reach‐in cooler cabinets (be they sold as integrated or remote cabinet types) and does not address the performance of the entire refrigeration system for remote cabinet types installed in situ.
The analyses in the study are conducted for nine target economies: Australia, Brazil, China, Europe, India, Japan, Mexico, South Africa (RSA) and the USA and also concern international test procedures. Specifically, for each of these economies and products the study:
documents and analyses energy performance test procedures
documents energy efficiency policies
clarifies the ranges in energy efficiency of product markets
gathers data on stocks and sales
benchmarks product efficiency by comparing results across different test procedures
assesses higher energy efficiency design options and potential efficiency improvement cost‐benefits
establishes the potential for energy savings at the macro scale
The data gathered are of varying quality and in some instances has had to be inferred from other sources and this constitutes a limitation in the reliability of some of the findings. In general where countries have had no history of introducing energy efficiency policy measures for these products there is less data on energy performance available in the public domain and analyses of efficiency become more speculative.
In general though the work conducted has enabled product performance to be benchmarked from one economy to another and for comparisons of energy performance to be made. Estimates of the total energy consumption of commercial refrigeration equipment have also been derived.
Reach‐in coolers
Reach‐in coolers such as refrigerated display cabinets and beverage coolers constitute the bulk of commercial refrigeration energy use for merchandising of refrigerated products.
Among the target economies energy efficiency policies such as standards and labelling have been introduced in Australia, China, Japan, Mexico and the USA and are currently under development in the European Union. The project team is not aware of any equivalent developments in Brazil, India or South Africa.
All of the target economies have a designated test procedure to measure the energy performance of reach‐in coolers but these can have significant dissimilarities. China, the EU, Brazil, Japan and South Africa use test procedures which are aligned with the international ISO test procedure. Australia uses a test procedure that is largely aligned with an older version of the ISO test procedure, while India, Mexico and the USA all use test procedures that are unique to themselves. Analysis of these test procedures within this study has allowed theoretical conversion formulae to be developed for the US, Mexican and ISO test procedures and thus permits conversions to be made between most of the reach‐in cooler energy performance data sets which were identified in the study. This has allowed a simplified benchmarking to be undertaken and comparisons to be made in the
CLASP Commercial refrigeration equipment: mapping and benchmarking
2 | P a g e
performance by reach‐in cooler type across some of the major markets. The conversion formulae, while partially informed by comparative testing in some instances, are not corroborated by comprehensive corroborative testing and thus their accuracy is unknown. They are thus only suitable for gaining approximate insights into the relative performance of products sold on different markets, which is how they are applied in the study.
Specifically the work done entailed:
identification of all the national test procedures applied in the target economies and their equivalence to other commonly used international or national test procedures
examination of similarity and differences in how the efficiency metrics are derived and applied in the different economies
comparison of the test procedures and identification of potential issues that are likely to affect the comparability of nominal test results
comparison of the differences in the testing procedures and protocols and assessment of the expected impact on rated energy performance associated with variations in: testing conditions, testing methods, efficiency calculation methods, uncertainty of measurements, tolerances, etc.
derivation of quantified conversion formulae to show how the energy consumption of some of the principal refrigerated display cabinet types would be expected to vary as a function of the test procedure used for the main groupings of test procedures (ISO/EU, ANSI, Australia and Mexico). Test procedures used in all other economies are almost all found to be equivalent (or nearly so) to one of the above
development of energy performance benchmarks from application of the conversion formulae From this it is seen that the diverse test procedures can produce very different energy performance test results for the same equipment types. Furthermore, it is also apparent that there can be significant differences in the average energy efficiency of reach‐in cooler markets, even among OECD economies, depending on the specific product type concerned, which indicates there is substantial potential for further energy savings from the broader adoption of design technologies that are already deployed in major markets. In addition the study entailed an investigation of the following aspects:
identification of the main energy efficiency design options for reach‐in coolers and their expected incremental costs and energy savings
gathering data, varying from the comprehensive to the inferred/anecdotal, on refrigerated display cabinet efficiency levels in the target economies (note efficiency data are missing for India due to the absence of any policy requirements but is present to varying degrees for all other economies)
development and application of a reach‐in coolers energy consumption stock model that is used to project energy impacts associated with varying efficiency scenarios
Principal findings The detailed benchmarking exercise conducted in the study used a mix of empirical measurement and analysis of physical principles to derive conversion factors for energy measurements made under the principal test procedures for different reach in cooler types. Table ES1 shows how the rated energy consumption results would be expected to vary on average for various reach in cooler cabinet types tested under the US ASHRAE72‐ANSI/AHRI 1200 test procedure and the European and wider international EN ISO 23953 test procedure
CLASP Commercial refrigeration equipment: mapping and benchmarking
3 | P a g e
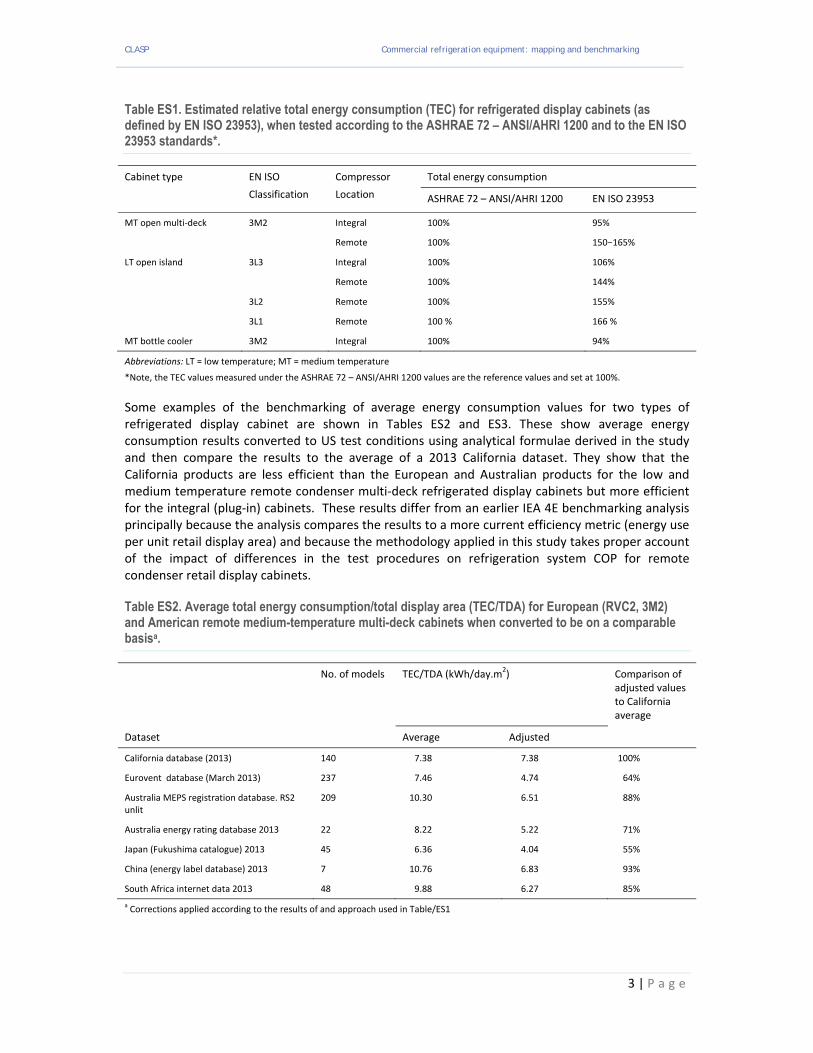
Table ES1. Estimated relative total energy consumption (TEC) for refrigerated display cabinets (as defined by EN ISO 23953), when tested according to the ASHRAE 72 – ANSI/AHRI 1200 and to the EN ISO 23953 standards*.
Cabinet type EN ISO
Classification
Compressor
Location
Total energy consumption
ASHRAE 72 – ANSI/AHRI 1200 EN ISO 23953
MT open multi‐deck 3M2 Integral 100% 95%
Remote 100% 150−165%
LT open island 3L3 Integral 100% 106%
Remote 100% 144%
3L2 Remote 100% 155%
3L1 Remote 100 % 166 %
MT bottle cooler 3M2 Integral 100% 94%
Abbreviations: LT = low temperature; MT = medium temperature
*Note, the TEC values measured under the ASHRAE 72 – ANSI/AHRI 1200 values are the reference values and set at 100%.
Some examples of the benchmarking of average energy consumption values for two types of refrigerated display cabinet are shown in Tables ES2 and ES3. These show average energy consumption results converted to US test conditions using analytical formulae derived in the study and then compare the results to the average of a 2013 California dataset. They show that the California products are less efficient than the European and Australian products for the low and medium temperature remote condenser multi‐deck refrigerated display cabinets but more efficient for the integral (plug‐in) cabinets. These results differ from an earlier IEA 4E benchmarking analysis principally because the analysis compares the results to a more current efficiency metric (energy use per unit retail display area) and because the methodology applied in this study takes proper account of the impact of differences in the test procedures on refrigeration system COP for remote condenser retail display cabinets.
Table ES2. Average total energy consumption/total display area (TEC/TDA) for European (RVC2, 3M2) and American remote medium-temperature multi-deck cabinets when converted to be on a comparable basisa.
No. of models TEC/TDA (kWh/day.m2) Comparison of
adjusted values to California average
Dataset Average Adjusted
California database (2013) 140 7.38 7.38 100%
Eurovent database (March 2013) 237 7.46 4.74 64%
Australia MEPS registration database. RS2 unlit
209 10.30 6.51 88%
Australia energy rating database 2013 22 8.22 5.22 71%
Japan (Fukushima catalogue) 2013 45 6.36 4.04 55%
China (energy label database) 2013 7 10.76 6.83 93%
South Africa internet data 2013 48 9.88 6.27 85%
a Corrections applied according to the results of and approach used in Table/ES1

CLASP Commercial refrigeration equipment: mapping and benchmarking
4 | P a g e
Table ES3. Average total energy consumption/total display area (TEC/TDA) for European and American integral medium-temperature multi-deck cabinets (3M2).
No. of models TEC/TDA (kWh/day.m2) Comparison of adjusted values to California average
Data set Average Adjusted
California database 2013 10 9.03 9.03 100%
Phoenix retail data (UK, 2010) 16 16.89 17.78 197%
Eurovent average TEC/TDA Unknown 15.10 15.90 176%
Australia MEPS register. IVC2 M2 ± 100 15.67 16.49 183%
Australia energy rating 2013 18 15.89 16.73 185%
a Corrections applied according to the results of and approach used in Table/ES1
The analysis of the techno‐economic potential to improve the energy efficiency of reach‐in coolers found that average potential efficiency gains from moving from the current market average efficiency levels (base case) to the efficiency levels that minimise the life cycle costs over the product life time (least life cycle cost) vary between 13% and 40% depending on the type of reach‐in cooler (Table ES4). The average potential efficiency gains from moving from the current market average efficiency levels to the current maximum technically achievable efficiency levels vary between 17% and 54% depending on the type of reach‐in cooler.
Table ES4. Techno economic energy savings potentials for reach-in coolers averaged across the nine target economies.
Reach-in Cooler type (ISO/ASHRAE)1 Average energy savings potential from base case to LLCC
Average energy savings potential from base case to maximum technically achievable efficiency
RVC2 = VOP.RC.M 13% 30%
RVC2 = VCT.RC.M 16% 29%
RHF4 = HZO.RC.L 17% 17%
IVC2 = VOP.SC.M 31% 54%
IHF4 = HZO.SC.L 24% 25%
Ice-cream lid chest freezer = HCT.SC.I 38% 45%
Ice-cream lid chest freezer = VCT.SC.I 40% 42% 1 See Table 2 in the main body of the text for the ISO23953‐2:2005 definitions for refrigerated display cabinet families and see Tables 12 and 13 for the ASHRAE definitions of display cabinet families
The actual savings potentials vary across the economies with Japan having the most efficient reach‐in cooler stock on average, albeit still having potential to save more energy cost‐effectively in some product classes. The total energy consumption of reach‐in coolers in the nine target economies is projected to increase from 83TWh in 2013 to 175TWh by 2035 under a business as usual scenario (Figure ES1). Growth is led by the transition economies of Brazil, China, India, Mexico and RSA but current consumption is still dominated by the OECD economies, which indicates that the commercial cold chain is still comparatively underdeveloped in key transition economies.

CLASP Commercial refrigeration equipment: mapping and benchmarking
5 | P a g e
ES 1. Estimated energy consumption for reach-in coolers in the nine SEAD economies under the Business as Usual scenario.
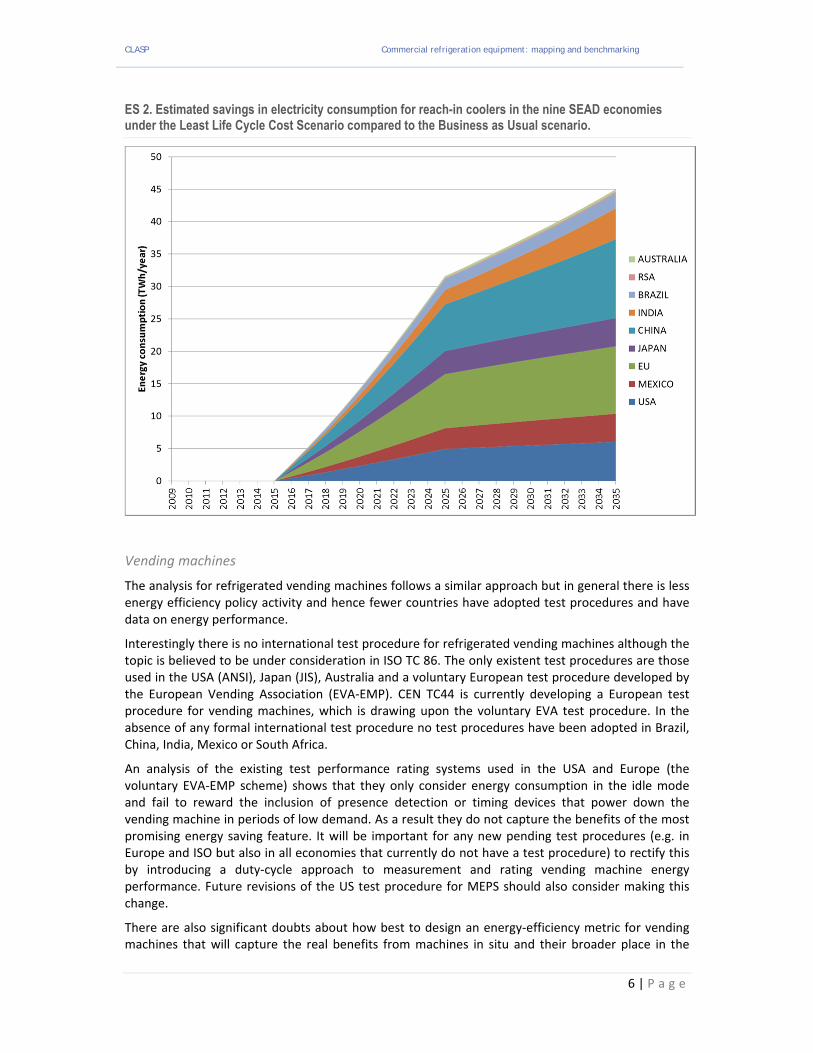
The cost effective energy savings potential (from the end‐user perspective) is estimated to be 45 TWh in 2035 (26% of business as usual consumption) (Figure ES2), while the maximum technical savings potential is projected to be 56 TWh (32%) for the nine economies.
Overall this analysis shows the strong potential to deliver greater savings through more proactive policy measures. The current mix of policies is rather patchy with many economies not having energy labelling or MEPS for any reach‐in cooler types.
Clearly countries that have no standards or labelling policy measures for retail display cabinets such as Brazil, the EU, India and Japan have a strong potential to save energy by introducing such measures, and the EU is in the process of doing so. Countries like China and Mexico which have measures for some equipment types (remote and integral) units respectively would benefit from developing them for all retail display cabinet categories. Interestingly, the markets with standards and labelling in place are not obviously leading the field in retail display cabinet energy efficiency. South Africa, nominally has efficiency requirements in place for some reach‐in cooler types but they do not seem to be up to date nor mandatory. The US DOE rulemaking process precluded consideration of some high efficiency design options such as night covers and doors that are routinely used in some other markets and could be obliged through regulation. The Australian market does not appear to be any more efficient than the European market, which is not yet regulated. This suggests there is more to be done in all economies to increase the energy efficiency of their reach‐in cooler markets.
The analysis of test procedures has also identified that there are some systematic deficiencies and notably a propensity to apply higher ambient test temperatures than would be found on average in situ. This not only arbitrarily increases nominal energy consumption but tends to skew the nominal energy savings benefits towards refrigeration circuit improvements and away from improvements in direct energy consumption such as lighting, etc.
CLASP Commercial refrigeration equipment: mapping and benchmarking
6 | P a g e
ES 2. Estimated savings in electricity consumption for reach-in coolers in the nine SEAD economies under the Least Life Cycle Cost Scenario compared to the Business as Usual scenario.
Vending machines
The analysis for refrigerated vending machines follows a similar approach but in general there is less energy efficiency policy activity and hence fewer countries have adopted test procedures and have data on energy performance.
Interestingly there is no international test procedure for refrigerated vending machines although the topic is believed to be under consideration in ISO TC 86. The only existent test procedures are those used in the USA (ANSI), Japan (JIS), Australia and a voluntary European test procedure developed by the European Vending Association (EVA‐EMP). CEN TC44 is currently developing a European test procedure for vending machines, which is drawing upon the voluntary EVA test procedure. In the absence of any formal international test procedure no test procedures have been adopted in Brazil, China, India, Mexico or South Africa.
An analysis of the existing test performance rating systems used in the USA and Europe (the voluntary EVA‐EMP scheme) shows that they only consider energy consumption in the idle mode and fail to reward the inclusion of presence detection or timing devices that power down the vending machine in periods of low demand. As a result they do not capture the benefits of the most promising energy saving feature. It will be important for any new pending test procedures (e.g. in Europe and ISO but also in all economies that currently do not have a test procedure) to rectify this by introducing a duty‐cycle approach to measurement and rating vending machine energy performance. Future revisions of the US test procedure for MEPS should also consider making this change.
There are also significant doubts about how best to design an energy‐efficiency metric for vending machines that will capture the real benefits from machines in situ and their broader place in the
CLASP Commercial refrigeration equipment: mapping and benchmarking
7 | P a g e
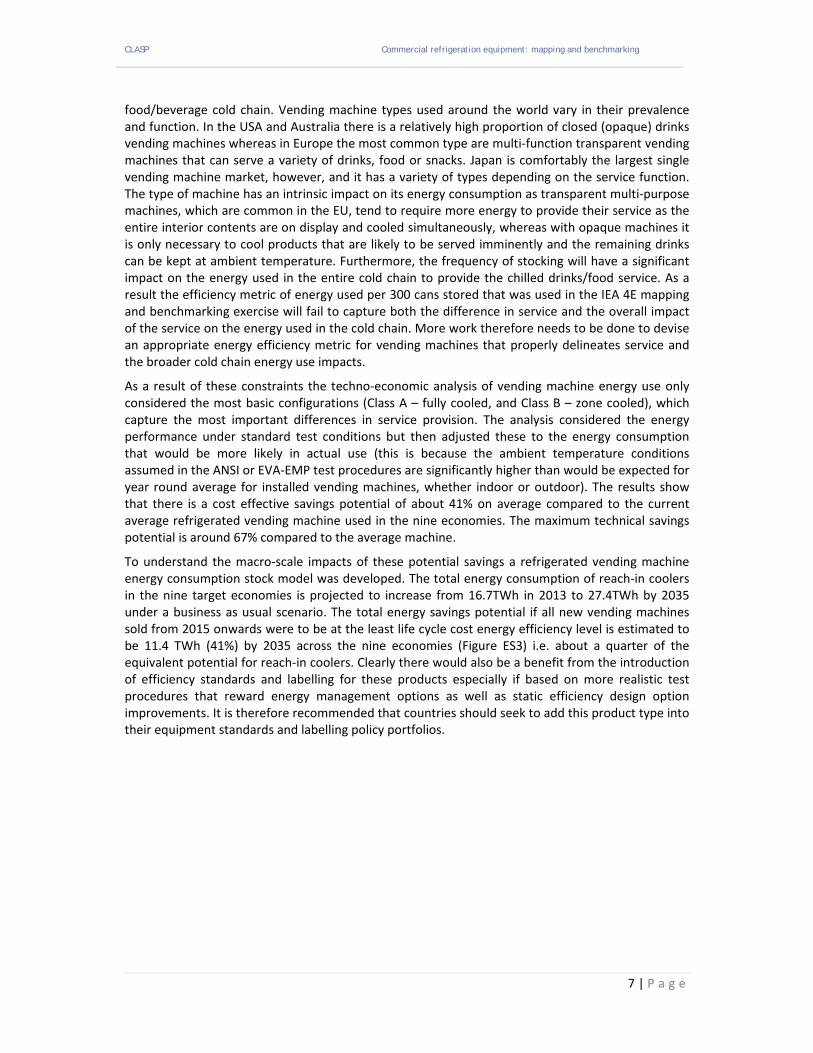
food/beverage cold chain. Vending machine types used around the world vary in their prevalence and function. In the USA and Australia there is a relatively high proportion of closed (opaque) drinks vending machines whereas in Europe the most common type are multi‐function transparent vending machines that can serve a variety of drinks, food or snacks. Japan is comfortably the largest single vending machine market, however, and it has a variety of types depending on the service function. The type of machine has an intrinsic impact on its energy consumption as transparent multi‐purpose machines, which are common in the EU, tend to require more energy to provide their service as the entire interior contents are on display and cooled simultaneously, whereas with opaque machines it is only necessary to cool products that are likely to be served imminently and the remaining drinks can be kept at ambient temperature. Furthermore, the frequency of stocking will have a significant impact on the energy used in the entire cold chain to provide the chilled drinks/food service. As a result the efficiency metric of energy used per 300 cans stored that was used in the IEA 4E mapping and benchmarking exercise will fail to capture both the difference in service and the overall impact of the service on the energy used in the cold chain. More work therefore needs to be done to devise an appropriate energy efficiency metric for vending machines that properly delineates service and the broader cold chain energy use impacts.
As a result of these constraints the techno‐economic analysis of vending machine energy use only considered the most basic configurations (Class A – fully cooled, and Class B – zone cooled), which capture the most important differences in service provision. The analysis considered the energy performance under standard test conditions but then adjusted these to the energy consumption that would be more likely in actual use (this is because the ambient temperature conditions assumed in the ANSI or EVA‐EMP test procedures are significantly higher than would be expected for year round average for installed vending machines, whether indoor or outdoor). The results show that there is a cost effective savings potential of about 41% on average compared to the current average refrigerated vending machine used in the nine economies. The maximum technical savings potential is around 67% compared to the average machine.
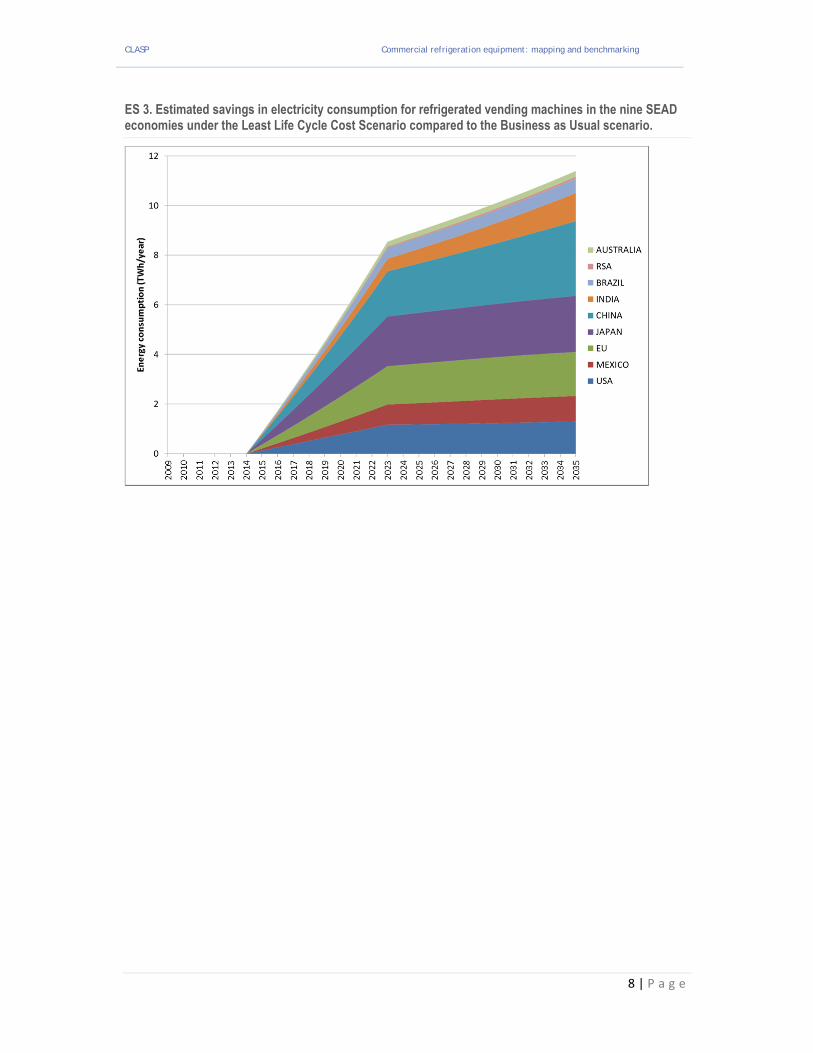
To understand the macro‐scale impacts of these potential savings a refrigerated vending machine energy consumption stock model was developed. The total energy consumption of reach‐in coolers in the nine target economies is projected to increase from 16.7TWh in 2013 to 27.4TWh by 2035 under a business as usual scenario. The total energy savings potential if all new vending machines sold from 2015 onwards were to be at the least life cycle cost energy efficiency level is estimated to be 11.4 TWh (41%) by 2035 across the nine economies (Figure ES3) i.e. about a quarter of the equivalent potential for reach‐in coolers. Clearly there would also be a benefit from the introduction of efficiency standards and labelling for these products especially if based on more realistic test procedures that reward energy management options as well as static efficiency design option improvements. It is therefore recommended that countries should seek to add this product type into their equipment standards and labelling policy portfolios.
CLASP Commercial refrigeration equipment: mapping and benchmarking
8 | P a g e
ES 3. Estimated savings in electricity consumption for refrigerated vending machines in the nine SEAD economies under the Least Life Cycle Cost Scenario compared to the Business as Usual scenario.

CLASP Commercial refrigeration equipment: mapping and benchmarking
9 | P a g e
1. Introduction and scope
This report presents the findings of a mapping and benchmarking study on commercial refrigeration equipment (CRE) conducted for CLASP by Waide Strategic Efficiency, Saint Trofee and Cemafroid.
1.1 Project scope
The project scope is outlined below.
Reach‐in‐cooler mapping and benchmarking
a) Complete information (on the scoping study)
Gather and collate all the missing data1 concerning the existing MEPS and labels applying to reach‐in‐coolers for China, India, Mexico, South Africa and the EU differentiated for each type of reach‐in‐cooler technology.
In order to facilitate the comparability of these efficiency policy settings (benchmarking):
identify the national test procedures applied in the target economies and their equivalence
to other commonly used international or national test procedures
examine similarity and differences in how the efficiency metrics are derived and applied in
the different economies
conduct an initial comparison of the test procedures, and identification of potential issues
that are likely to affect the comparability of nominal test results
compare the differences in the testing procedures and protocols to assess the expected
impact on rated energy performance associated with variations in: testing conditions, testing
methods, calculation methods for efficiencies, uncertainty of measurements, tolerances, etc.
b) Analyse efficiency of stock and sales
for Australia, Brazil, China, EU, India, Japan, South Africa, and the US
including determination of average, maximum and minimum efficiency on market and in
stock in each economy
Gather data on sales by reach‐in‐cooler product group type and by technical characteristics (including efficiency where this is known) for the key target markets of: Australia, Brazil, China, EU, India, Japan, South Africa, and the USA and analyse it to produce time‐series of sales, stocks and efficiency.
c) Analyse cost‐benefit data, policy implications and potential national impacts from efficiency improvements
The data gathered on the efficiency of the commercial refrigeration equipment and the cost of the equipment as a function of efficiency will be analysed to derive cost‐efficiency curves for each of the target markets and CRE technologies. The markets to be addressed include:
Australia
Brazil
China
EU
1 To complement the information that had already been gathered for: Australia, Brazil, Canada, Japan, USA in the previous scoping study
CLASP Commercial refrigeration equipment: mapping and benchmarking
10 | P a g e
India
Japan
South Africa
USA
The reach‐in‐cooler product groups to be addressed include:
The various type of refrigerated display cabinets (RDCs)
And will draw appropriate distinctions for plug‐in and remote condenser types, the various common lay‐out configurations, fresh or frozen food types, etc.
Note, a priori no distinction is made between product groups that provide the same cooling service and utility but have differing efficiencies (e.g. the use of clear doors or air curtains to save energy versus not using these) as these are efficiency design options that can be applied within a broader functional product category; however, the impact of such options is assessed in the technological design assessment used to determine cost‐efficiency curves.
The resulting cost‐efficiency curves will then be complemented by usage, lifespan and tariff data to derive life cycle cost curves as a function of energy efficiency for each market and commercial refrigeration equipment technology type.
This information will subsequently be fed into a national impact assessment model for each commercial refrigeration equipment product group. A dedicated bottom‐up commercial refrigeration equipment stock model to forecast energy, economic and carbon impacts will be developed and adapted for each economy and CRE technology group using inputs gathered earlier on sales, costs‐efficiency curves, tariffs, lifespans and usage profiles. This will be loaded with the input data and applied to analyse a set of commercial refrigeration equipment efficiency scenarios for each economy:
Base case scenario (no new policy)
Least‐life‐cycle cost scenario
The analysis of these scenarios will inform the impact assessment which will consider the implications of attaining any of the given efficiency levels on energy consumption.
Cold vending machines mapping and benchmarking
a) Update the existing IEA‐4E analysis by analysing national sales and stock data in each economy (see b).
b) Widen scope to include China, India, and any other countries relevant to this product category
c) Provide indicative assessment of variations in annual energy demand for machines of same capacity
d) Provide indicative assessment of variations in machine efficiency and annual consumption related to policies
e) Analyse if and how cold food / snack machines differ from other cold vending machines
f) Analyse efficiency of stock and sales for Australia, Brazil, China, EU, India, Japan, South Africa, and the USA, including determination of average, maximum and minimum efficiency on market and in stock in each economy
g) Analyse cost‐benefit data, technical and policy implications, and potential national impacts of efficiency improvements

CLASP Commercial refrigeration equipment: mapping and benchmarking
11 | P a g e
The conduct of this work will follow the same approach as that described in Task c (for Reach‐in‐cooler mapping and benchmarking) but applied to vending machines rather than reach‐in‐coolers.

CLASP Commercial refrigeration equipment: mapping and benchmarking
12 | P a g e
2. Reach‐in coolers
A commercial refrigerated cabinet is a refrigerated appliance intended for the storage and display for merchandising, of chilled and/or frozen products at specified temperatures below the ambient temperature and which are accessible directly through open sides or via one or more doors and/or drawers.
Commercial refrigerated display cabinets may take many forms and combinations as follows:
‘self‐contained (or plug‐in) appliance’ refers to a factory made assembly of refrigerating components designed to compress, liquefy, expand and evaporate a specific refrigerant that are an integral part of the refrigerated equipment and consists of a storage space, one or more refrigerant compressors, refrigerant evaporators, condensers and expansion devices, eventually accompanied with additional heat exchangers, fans, motors and factory supplied accessories
remote (condenser) display cabinets work with a remote refrigerating unit which is not an integral part of the display cabinet
they can be designed for the display of chilled or frozen products
they may be orientated as vertical, semi‐vertical or horizontal equipment;
with or without doors (also referred to as 'open' or 'closed' cabinets);
Regarding temperature, the following considerations are important:
Different temperature requirements are applied depending on the product on sale, where some require the maintenance of a constant temperature and some allow controlled temperature variations. Chilling refers to a working temperature above 0°C whereas freezing/frozen refers to a working temperature below 0°C.
A commercial refrigerator or chiller is a commercial refrigerated cabinet intended to store and maintain products at a temperature above 0°C, with a reference point at +5°C (M1 temperature class).
A commercial freezer is a commercial refrigerated cabinet intended to store and maintain products at a temperature below 0°C, with a reference point at ‐18°C (L1 temperature class)
Table 1. Temperature classifications of refrigerated display cabinets in ISO EN 23953.
Class Highest temperature of warmest M‐package
Lowest temperature of coldest M‐package
Lowest temperature of warmest M‐package
L1 ‐15 ‐ ‐18
L2 ‐12 ‐ ‐18
L3 ‐12 ‐ ‐15
M1 5 ‐1 ‐
M2 7 ‐1 ‐
H1 10 1 ‐
H2 10 ‐1 ‐
S Special classification
The types of refrigerated display cabinet are classified by ISO as shown in Table 2.
CLASP Commercial refrigeration equipment: mapping and benchmarking
13 | P a g e
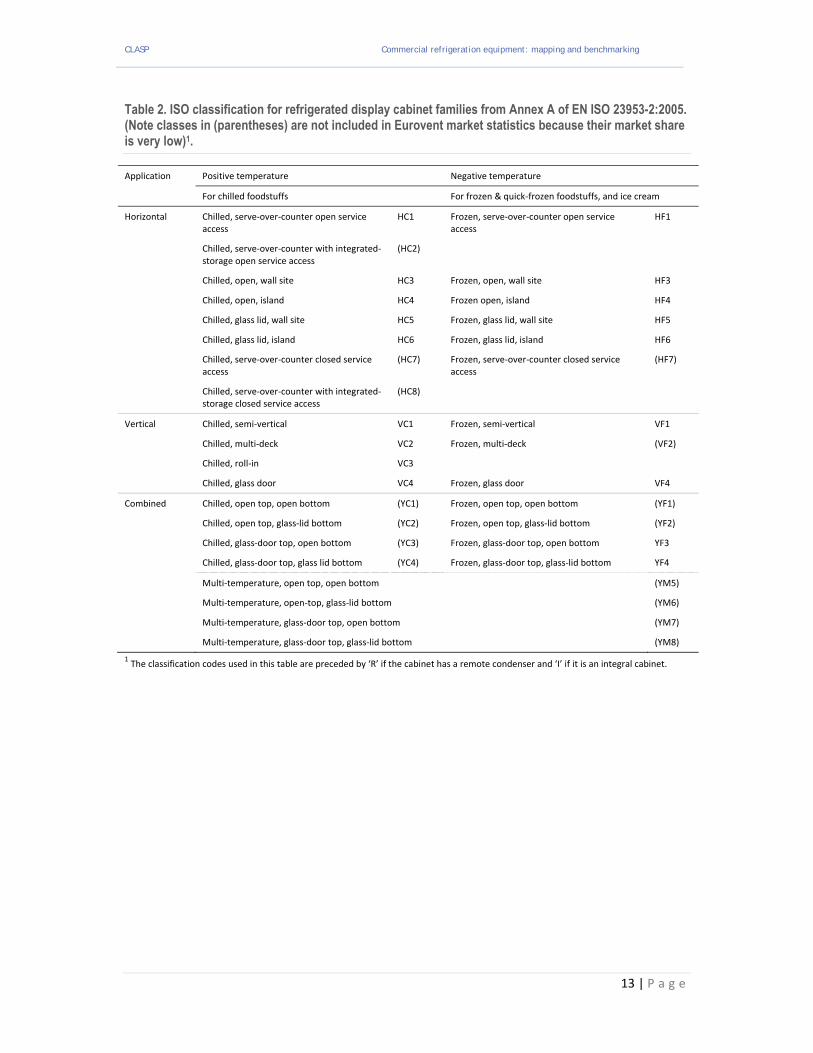
Table 2. ISO classification for refrigerated display cabinet families from Annex A of EN ISO 23953-2:2005. (Note classes in (parentheses) are not included in Eurovent market statistics because their market share is very low)1.
Application Positive temperature Negative temperature
For chilled foodstuffs For frozen & quick‐frozen foodstuffs, and ice cream
Horizontal Chilled, serve‐over‐counter open service access
HC1 Frozen, serve‐over‐counter open service access
HF1
Chilled, serve‐over‐counter with integrated‐storage open service access
(HC2)
Chilled, open, wall site HC3 Frozen, open, wall site HF3
Chilled, open, island HC4 Frozen open, island HF4
Chilled, glass lid, wall site HC5 Frozen, glass lid, wall site HF5
Chilled, glass lid, island HC6 Frozen, glass lid, island HF6
Chilled, serve‐over‐counter closed service access
(HC7) Frozen, serve‐over‐counter closed service access
(HF7)
Chilled, serve‐over‐counter with integrated‐storage closed service access
(HC8)
Vertical Chilled, semi‐vertical VC1 Frozen, semi‐vertical VF1
Chilled, multi‐deck VC2 Frozen, multi‐deck (VF2)
Chilled, roll‐in VC3
Chilled, glass door VC4 Frozen, glass door VF4
Combined Chilled, open top, open bottom (YC1) Frozen, open top, open bottom (YF1)
Chilled, open top, glass‐lid bottom (YC2) Frozen, open top, glass‐lid bottom (YF2)
Chilled, glass‐door top, open bottom (YC3) Frozen, glass‐door top, open bottom YF3
Chilled, glass‐door top, glass lid bottom (YC4) Frozen, glass‐door top, glass‐lid bottom YF4
Multi‐temperature, open top, open bottom (YM5)
Multi‐temperature, open‐top, glass‐lid bottom (YM6)
Multi‐temperature, glass‐door top, open bottom (YM7)
Multi‐temperature, glass‐door top, glass‐lid bottom (YM8)
1 The classification codes used in this table are preceded by ‘R’ if the cabinet has a remote condenser and ‘I’ if it is an integral cabinet.
CLASP Commercial refrigeration equipment: mapping and benchmarking
14 | P a g e
2.1 Types of refrigerated display cabinets
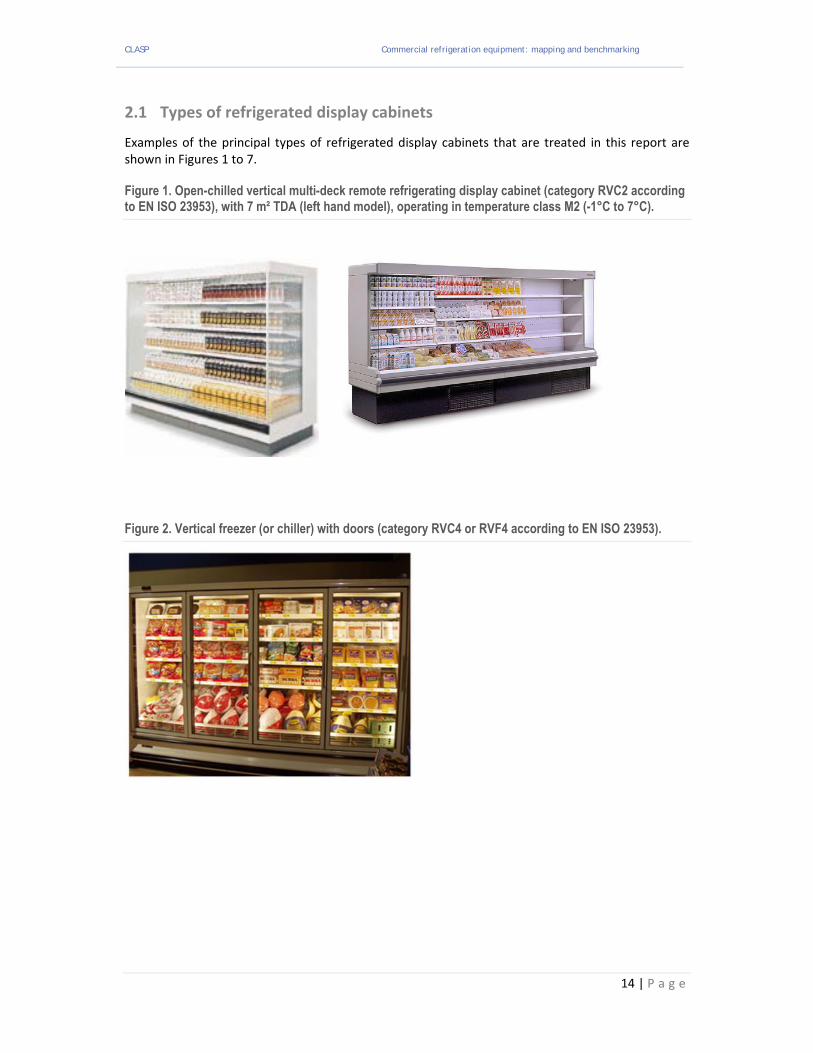
Examples of the principal types of refrigerated display cabinets that are treated in this report are shown in Figures 1 to 7.
Figure 1. Open-chilled vertical multi-deck remote refrigerating display cabinet (category RVC2 according to EN ISO 23953), with 7 m² TDA (left hand model), operating in temperature class M2 (-1°C to 7°C).
Figure 2. Vertical freezer (or chiller) with doors (category RVC4 or RVF4 according to EN ISO 23953).
CLASP Commercial refrigeration equipment: mapping and benchmarking
15 | P a g e
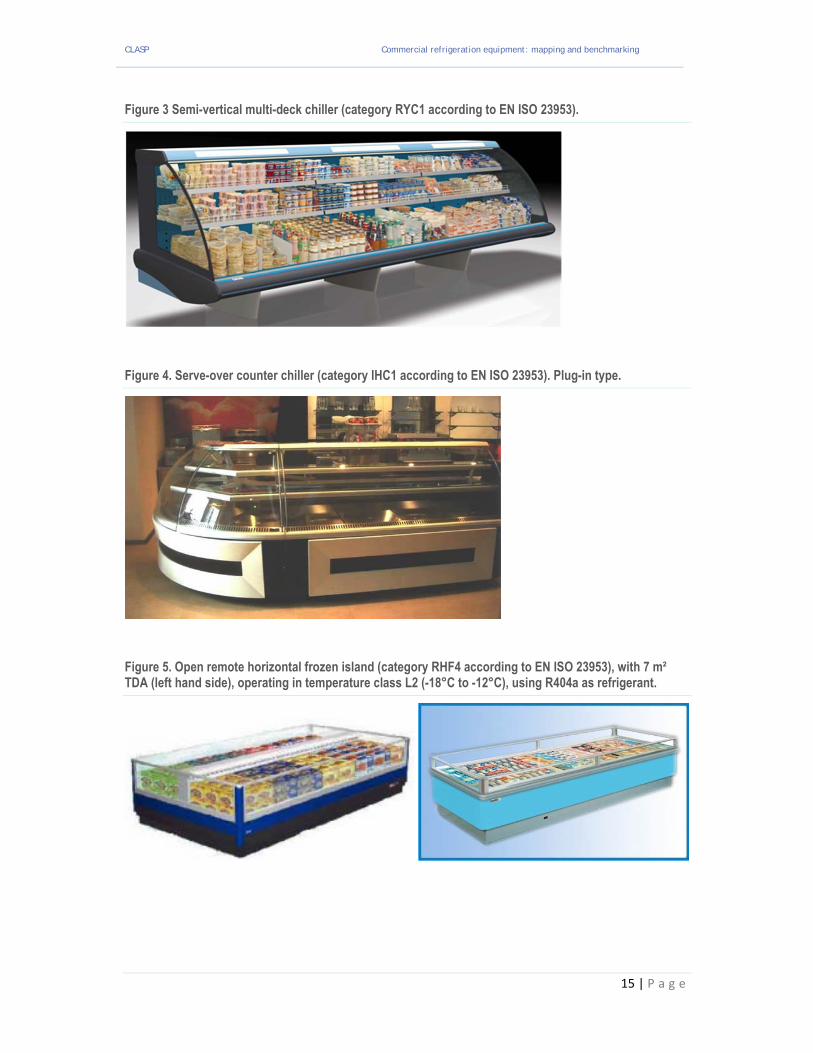
Figure 3 Semi-vertical multi-deck chiller (category RYC1 according to EN ISO 23953).
Figure 4. Serve-over counter chiller (category IHC1 according to EN ISO 23953). Plug-in type.
Figure 5. Open remote horizontal frozen island (category RHF4 according to EN ISO 23953), with 7 m² TDA (left hand side), operating in temperature class L2 (-18°C to -12°C), using R404a as refrigerant.
CLASP Commercial refrigeration equipment: mapping and benchmarking
16 | P a g e
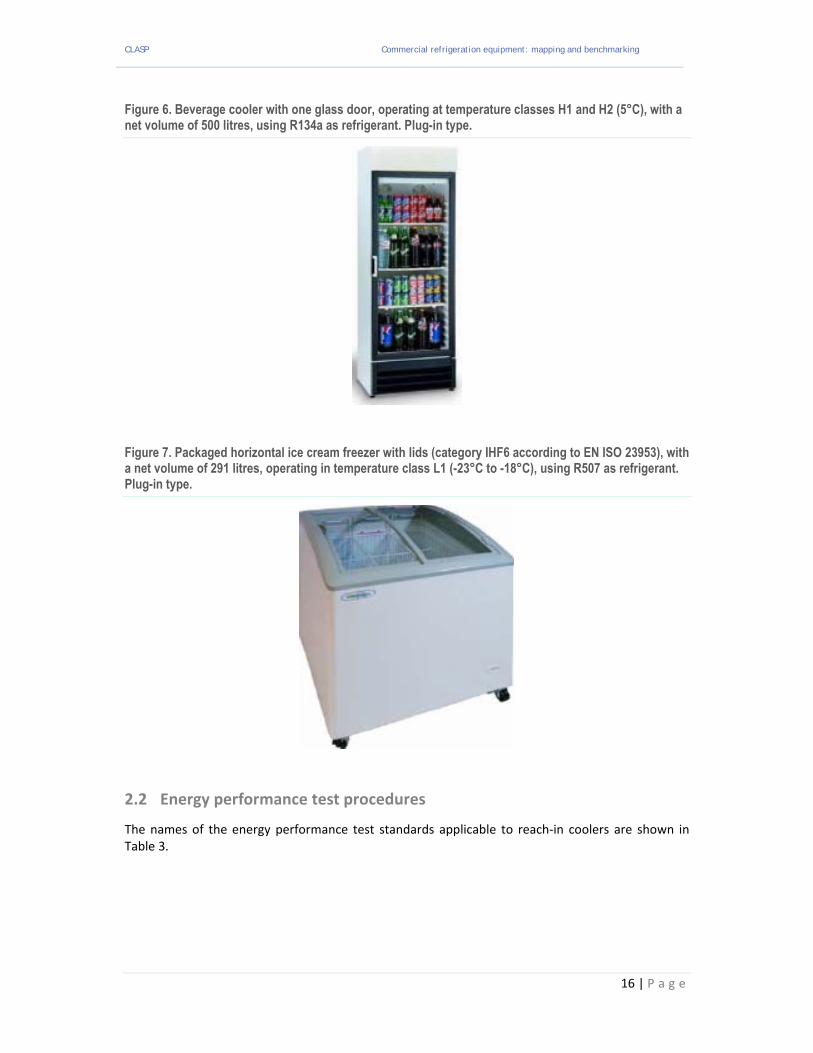
Figure 6. Beverage cooler with one glass door, operating at temperature classes H1 and H2 (5°C), with a net volume of 500 litres, using R134a as refrigerant. Plug-in type.
Figure 7. Packaged horizontal ice cream freezer with lids (category IHF6 according to EN ISO 23953), with a net volume of 291 litres, operating in temperature class L1 (-23°C to -18°C), using R507 as refrigerant. Plug-in type.
2.2 Energy performance test procedures
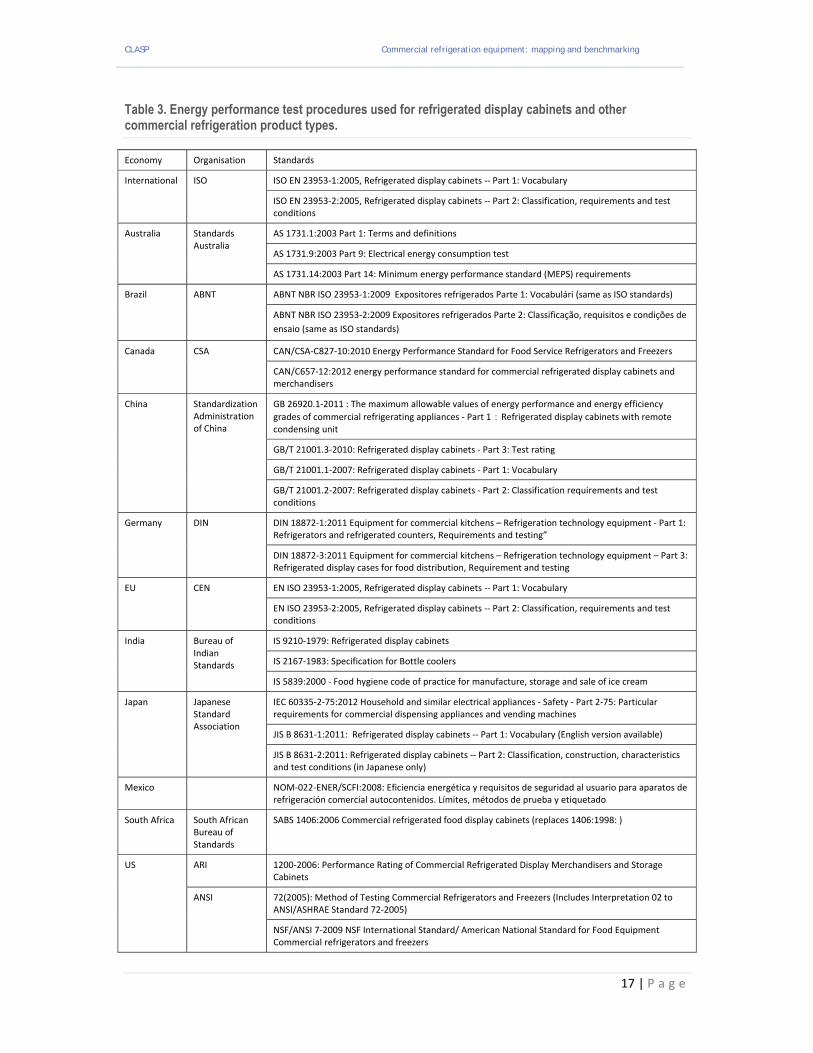
The names of the energy performance test standards applicable to reach‐in coolers are shown in Table 3.
CLASP Commercial refrigeration equipment: mapping and benchmarking
17 | P a g e
Table 3. Energy performance test procedures used for refrigerated display cabinets and other commercial refrigeration product types.
Economy Organisation Standards
International ISO ISO EN 23953‐1:2005, Refrigerated display cabinets ‐‐ Part 1: Vocabulary
ISO EN 23953‐2:2005, Refrigerated display cabinets ‐‐ Part 2: Classification, requirements and test conditions
Australia Standards Australia
AS 1731.1:2003 Part 1: Terms and definitions
AS 1731.9:2003 Part 9: Electrical energy consumption test
AS 1731.14:2003 Part 14: Minimum energy performance standard (MEPS) requirements
Brazil ABNT ABNT NBR ISO 23953‐1:2009 Expositores refrigerados Parte 1: Vocabulári (same as ISO standards)
ABNT NBR ISO 23953‐2:2009 Expositores refrigerados Parte 2: Classificação, requisitos e condições de
ensaio (same as ISO standards)
Canada CSA CAN/CSA‐C827‐10:2010 Energy Performance Standard for Food Service Refrigerators and Freezers
CAN/C657‐12:2012 energy performance standard for commercial refrigerated display cabinets and merchandisers
China Standardization Administration of China
GB 26920.1‐2011 : The maximum allowable values of energy performance and energy efficiency
grades of commercial refrigerating appliances ‐ Part 1:Refrigerated display cabinets with remote condensing unit
GB/T 21001.3‐2010: Refrigerated display cabinets ‐ Part 3: Test rating
GB/T 21001.1‐2007: Refrigerated display cabinets ‐ Part 1: Vocabulary
GB/T 21001.2‐2007: Refrigerated display cabinets ‐ Part 2: Classification requirements and test conditions
Germany DIN DIN 18872‐1:2011 Equipment for commercial kitchens – Refrigeration technology equipment ‐ Part 1: Refrigerators and refrigerated counters, Requirements and testing”
DIN 18872‐3:2011 Equipment for commercial kitchens – Refrigeration technology equipment – Part 3: Refrigerated display cases for food distribution, Requirement and testing
EU CEN EN ISO 23953‐1:2005, Refrigerated display cabinets ‐‐ Part 1: Vocabulary
EN ISO 23953‐2:2005, Refrigerated display cabinets ‐‐ Part 2: Classification, requirements and test conditions
India Bureau of Indian Standards
IS 9210‐1979: Refrigerated display cabinets
IS 2167‐1983: Specification for Bottle coolers
IS 5839:2000 ‐ Food hygiene code of practice for manufacture, storage and sale of ice cream
Japan Japanese Standard Association
IEC 60335‐2‐75:2012 Household and similar electrical appliances ‐ Safety ‐ Part 2‐75: Particular requirements for commercial dispensing appliances and vending machines
JIS B 8631‐1:2011: Refrigerated display cabinets ‐‐ Part 1: Vocabulary (English version available)
JIS B 8631‐2:2011: Refrigerated display cabinets ‐‐ Part 2: Classification, construction, characteristics and test conditions (in Japanese only)
Mexico NOM‐022‐ENER/SCFI:2008: Eficiencia energética y requisitos de seguridad al usuario para aparatos de refrigeración comercial autocontenidos. Límites, métodos de prueba y etiquetado
South Africa South African Bureau of Standards
SABS 1406:2006 Commercial refrigerated food display cabinets (replaces 1406:1998: )
US ARI 1200‐2006: Performance Rating of Commercial Refrigerated Display Merchandisers and Storage Cabinets
ANSI 72(2005): Method of Testing Commercial Refrigerators and Freezers (Includes Interpretation 02 to ANSI/ASHRAE Standard 72‐2005)
NSF/ANSI 7‐2009 NSF International Standard/ American National Standard for Food Equipment Commercial refrigerators and freezers

CLASP Commercial refrigeration equipment: mapping and benchmarking
18 | P a g e
International standards
The predominant international test procedure is ISO EN 23953:2005 that was developed by CEN in Europe and adopted by ISO through the Vienna Agreement mechanism that links the European and International standardisation processes. Among the target economies it is used fully in Brazil, China and Europe. The test procedure used in Japan is almost identical and the test procedure used in Australia is based on the earlier version of the EN ISO standard. In addition the EN ISO standard appears to be used in South Africa in preference to the standard published by the South African Bureau of Standards. The USA and Canada essentially use the ANSI standards (the Canadian standard is equivalent to the ANSI one). Mexico use their own national standard, which is not equivalent to any of the other standards although shares some aspects in common with them.
Australian standards
The Australian standard AS 1731:2003 is a clone of the old (1994) European standard EN 441 except that as opposed to the EN‐ISO 23953:2005, it includes (in the part 14) MEPS and high efficiency levels. There are some small differences in the test method, relating to the type of test packages used and to the internal lighting of the cabinet (when no night covers or automatic lighting switch is employed, the AS 1731 calls for 24 hour lighting as opposed to the EN ISO standard that calls for 12 hour lighting per day). A detailed comparison of AS 1731 with the European and USA standards is given in the “in from the cold” report (Ellis 2009).
Brazilian standards
The Brazilian national standards ABNT NBR ISO 23953‐1:2009 Expositores refrigerados Parte 1: Vocabulári and ABNT NBR ISO 23953‐2:2009 Expositores refrigerados Parte 2: Classificação, requisitos e condições de ensaio are fully identical to the ISO 23953:2005 standard.
Chinese standards
The Chinese voluntary national standards GB/T 21001.1‐2007 and GB/T 21001.2‐2007 are fully identical to the ISO 23953:2005 standard.
European standards
EN ISO 23953:2005 and its 2012 amendments are the standard for measuring total energy consumption (TEC) and total display area (TDA) for refrigerated display cabinets in Europe. It is a matter of time (and retesting of cabinets with glass doors) before the 2012 amendments will be used as well for the UK Enhanced Capital Allowance scheme (see Section 2.3). The European standards committee CEN TC 44 in 2013 developed a new Annex D "Performance and Energy Rating of Commercial Refrigerated Display Cabinets" to the standard with the intention of facilitating the application of the standard to any type of energy assessment which may be defined and based on the requirements of the EU Ecodesign Directive.
EN 441 (1994) is the predecessor to EN ISO 23953: 2005 and consists of elven parts. Prior to EN 441 the ISO 1993 (from 1973/4) was used in Europe. The content of EN 441 – and before that of ISO 1993 ‐ has been mostly incorporated into the new EN ISO 23953. Furthermore, a number of new elements have been introduced, including:
a scheme to divide cabinets into different categories,
the definition of Total Display Area (TDA)
and references to the characteristics of the climate chamber in which cabinets are tested.
Test room dimensions are of importance, as it is a “secret of the trade” that the size of the test chamber influences the results of the measurement. Smaller test chambers tend to produce better temperature and superior cabinet energy performance results, because the cold air spilling from the

CLASP Commercial refrigeration equipment: mapping and benchmarking
19 | P a g e
cabinet is not dispersed as much as in large test rooms. For the last two decades, the test room at TNO (in Apeldoorn, The Netherlands) has served as a reference test room, since all verification tests on RVC2 cabinets for the Eurovent certification scheme were performed here. Many test rooms over Europe were designed to look alike. The test room at TNO will probably be abandoned in 2014 and it is not yet clear which test lab will be used as the reference test room nor how this will affect the comparability of results produced before and after the change in labs.
The 2012 amendments to EN ISO 23953 include some additional precisions on the sensor for measuring the ambient temperature. But more importantly, a possibility was created to use alternative filler packages in the cabinet. The use of such packages is more in line with Australian/NZ and USA practices, and moreover is an answer to the scarcity of supply of the official ISO “tylose” test packages, which has been a problem for many years.
EN ISO 23953 does not apply to commercial refrigeration equipment with non‐transparent doors. Such cabinets are not seen as refrigerated display cabinets, but rather as commercial service cabinets and therefore for such cabinets it is more appropriate to use a volumetric measure of efficiency than one based on the total display area. The testing of commercial service cabinets is covered by the German standard DIN 18872.
Indian standards
The Indian Standard IS 9210‐1979 “Refrigerated display cabinets” is an old standard dating to the 1970s. A copy of this standard was acquired by the project team and analysed and from this it was determined that the standard is not similar to predecessors of EN ISO 23953. It applies only to frozen food cabinets and specifies test room temperatures of 32oC or 43oC. The test packages are made of sawdust soaked in sodium chloride, and wrapped liquid tight (dimensions correspond to those used by ISO test packages, but otherwise they are dissimilar). Locations for M‐packages are designated by the manufacturer, which risks enabling gaming of the results by avoiding the necessity for designating test packs to be placed in all parts of the cabinet and thereby offering the potential to avoid unfavourable "hot spots". Product temperatures are also designated by the manufacturer (i.e. there are no defined product temperature classes). The test must run for eight hours or more, and does not have to include a defrosting period (defrosting is tested separately from temperature and energy tests).
In practice, however, it’s not thought that this standard is widely applied. Rather it is believed by the project team that cabinet technical specifications are usually copied from the originating countries (e.g. European cabinets will have EN ISO specifications) although technical energy performance specifications for Indian cabinets are not publically available.
Japanese standards
The project team acquired and analysed the JIS B 8631‐1:2011: Refrigerated display cabinets standard and have found it to essentially be equivalent to the EN ISO 23953: 2005 standard.
The differences between JIS and EN ISO 23953 are very minor. A comparison is made easy by tables present in the Japanese standards, wherein all differences are listed:
Table of appendix JA for part 1 (pages 15 ‐ 16)
Table of appendix JC for part 2 (pages 93 ‐ 96)
Many of the changes are of the nature of additional explanations in the Japanese standard. The only technical differences are that in Japan, smaller test packages are defined (MS packages of 62.5 grams) and that the rated voltage is different (Japan uses 100 Volt, 50 or 60 Hz).
These differences are only likely to result in very small differences in energy performance test results between the two standards.
CLASP Commercial refrigeration equipment: mapping and benchmarking
20 | P a g e
North American standards
ANSI/ASHRAE 72 ‐2005 is the official standard used in the USA for self‐contained (integral) and remote commercial refrigerators and freezers with no doors or drawers.
The 1998 version of the ANSI/ASHRAE 72 standard did not cover commercial refrigeration equipment with doors but these are addressed in the 2005 version. Cabinets with doors were previously covered by the standard ANSI/ASHRAE 117‐1992, which was subsequently withdrawn after being merged into the 2005 version of the ANSI/ASHRAE 72 standard.
The ANSI/AHRI STANDARD 1200 from 2010 (or the identical standard 1201 for SI units) provides guidance on how to calculate Total Energy Consumption (TEC) and Total Display Area (TDA) figures, as well as the test conditions under which ratings must be specified.
Canada also uses ANSI/ASHRAE 72, and this is specifically referenced in the Canadian Energy Performance Standard for Commercial Refrigerated Display Cabinets and Merchandisers C657‐12.
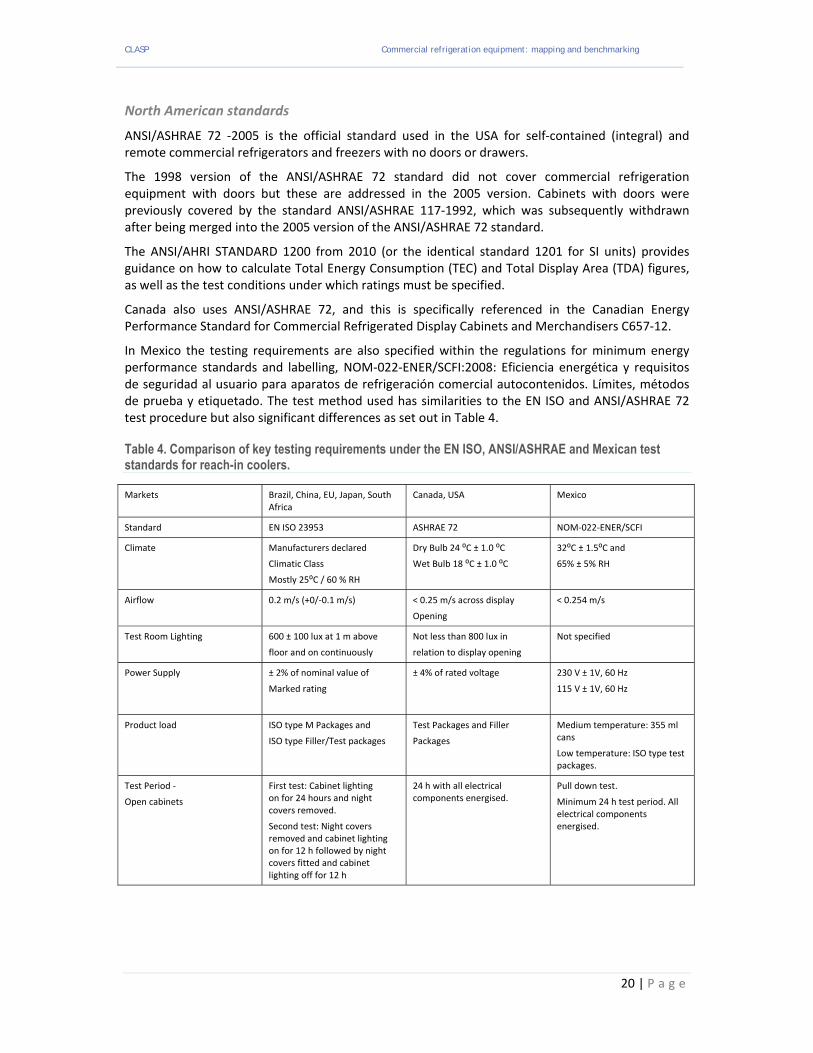
In Mexico the testing requirements are also specified within the regulations for minimum energy performance standards and labelling, NOM‐022‐ENER/SCFI:2008: Eficiencia energética y requisitos de seguridad al usuario para aparatos de refrigeración comercial autocontenidos. Límites, métodos de prueba y etiquetado. The test method used has similarities to the EN ISO and ANSI/ASHRAE 72 test procedure but also significant differences as set out in Table 4.
Table 4. Comparison of key testing requirements under the EN ISO, ANSI/ASHRAE and Mexican test standards for reach-in coolers.
Markets Brazil, China, EU, Japan, South Africa
Canada, USA Mexico
Standard EN ISO 23953 ASHRAE 72 NOM‐022‐ENER/SCFI
Climate Manufacturers declared
Climatic Class
Mostly 25⁰C / 60 % RH
Dry Bulb 24 ⁰C ± 1.0 ⁰C
Wet Bulb 18 ⁰C ± 1.0 ⁰C
32⁰C ± 1.5⁰C and
65% ± 5% RH
Airflow 0.2 m/s (+0/‐0.1 m/s) < 0.25 m/s across display
Opening
< 0.254 m/s
Test Room Lighting 600 ± 100 lux at 1 m above
floor and on continuously
Not less than 800 lux in
relation to display opening
Not specified
Power Supply ± 2% of nominal value of
Marked rating
± 4% of rated voltage 230 V ± 1V, 60 Hz
115 V ± 1V, 60 Hz
Product load ISO type M Packages and
ISO type Filler/Test packages
Test Packages and Filler
Packages
Medium temperature: 355 ml cans
Low temperature: ISO type test packages.
Test Period ‐
Open cabinets
First test: Cabinet lighting on for 24 hours and night covers removed.
Second test: Night covers removed and cabinet lighting on for 12 h followed by night covers fitted and cabinet lighting off for 12 h
24 h with all electrical components energised.
Pull down test.
Minimum 24 h test period. All electrical components energised.
CLASP Commercial refrigeration equipment: mapping and benchmarking
21 | P a g e
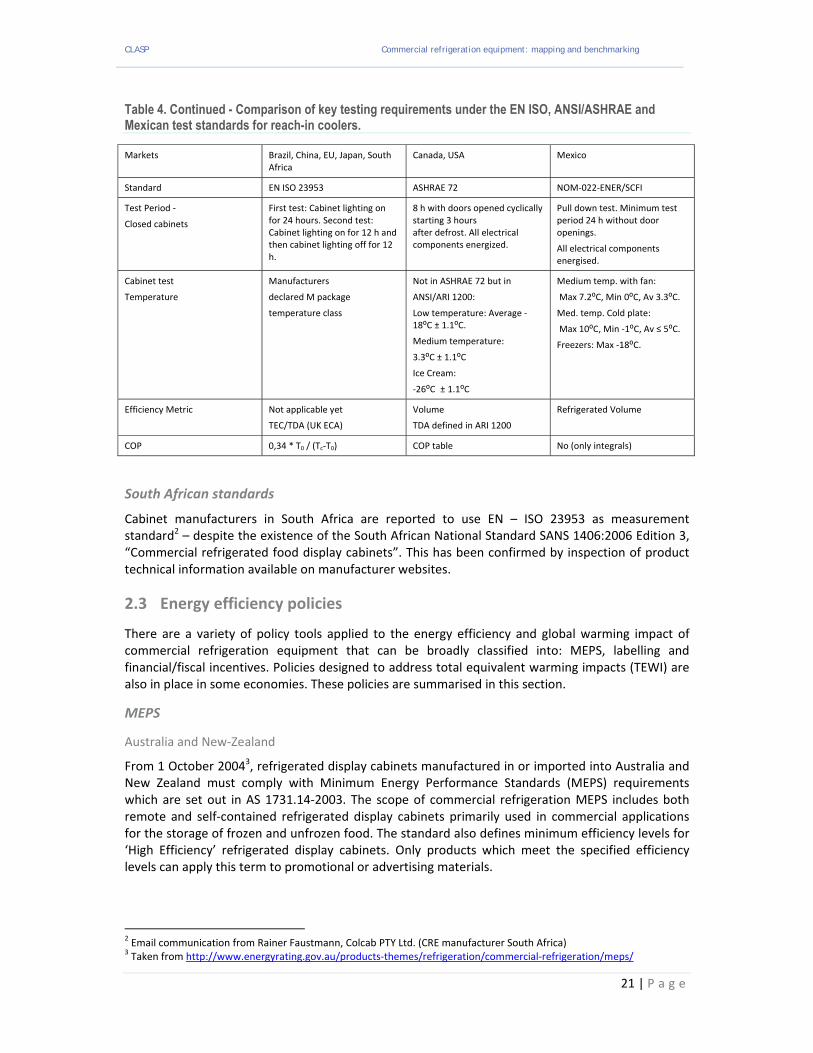
Table 4. Continued - Comparison of key testing requirements under the EN ISO, ANSI/ASHRAE and Mexican test standards for reach-in coolers.
Markets Brazil, China, EU, Japan, South Africa
Canada, USA Mexico
Standard EN ISO 23953 ASHRAE 72 NOM‐022‐ENER/SCFI
Test Period ‐
Closed cabinets
First test: Cabinet lighting on for 24 hours. Second test: Cabinet lighting on for 12 h and then cabinet lighting off for 12 h.
8 h with doors opened cyclically starting 3 hours after defrost. All electrical components energized.
Pull down test. Minimum test period 24 h without door openings.
All electrical components energised.
Cabinet test
Temperature
Manufacturers
declared M package
temperature class
Not in ASHRAE 72 but in
ANSI/ARI 1200:
Low temperature: Average ‐18⁰C ± 1.1⁰C.
Medium temperature:
3.3⁰C ± 1.1⁰C
Ice Cream:
‐26⁰C ± 1.1⁰C
Medium temp. with fan:
Max 7.2⁰C, Min 0⁰C, Av 3.3⁰C.
Med. temp. Cold plate:
Max 10⁰C, Min ‐1⁰C, Av ≤ 5⁰C.
Freezers: Max ‐18⁰C.
Efficiency Metric Not applicable yet
TEC/TDA (UK ECA)
Volume
TDA defined in ARI 1200
Refrigerated Volume
COP 0,34 * T0 / (Tc‐T0) COP table No (only integrals)
South African standards
Cabinet manufacturers in South Africa are reported to use EN – ISO 23953 as measurement standard2 – despite the existence of the South African National Standard SANS 1406:2006 Edition 3, “Commercial refrigerated food display cabinets”. This has been confirmed by inspection of product technical information available on manufacturer websites.
2.3 Energy efficiency policies
There are a variety of policy tools applied to the energy efficiency and global warming impact of commercial refrigeration equipment that can be broadly classified into: MEPS, labelling and financial/fiscal incentives. Policies designed to address total equivalent warming impacts (TEWI) are also in place in some economies. These policies are summarised in this section.
MEPS
Australia and New‐Zealand
From 1 October 20043, refrigerated display cabinets manufactured in or imported into Australia and New Zealand must comply with Minimum Energy Performance Standards (MEPS) requirements which are set out in AS 1731.14‐2003. The scope of commercial refrigeration MEPS includes both remote and self‐contained refrigerated display cabinets primarily used in commercial applications for the storage of frozen and unfrozen food. The standard also defines minimum efficiency levels for ‘High Efficiency’ refrigerated display cabinets. Only products which meet the specified efficiency levels can apply this term to promotional or advertising materials.
2 Email communication from Rainer Faustmann, Colcab PTY Ltd. (CRE manufacturer South Africa)
3 Taken from http://www.energyrating.gov.au/products‐themes/refrigeration/commercial‐refrigeration/meps/
CLASP Commercial refrigeration equipment: mapping and benchmarking
22 | P a g e
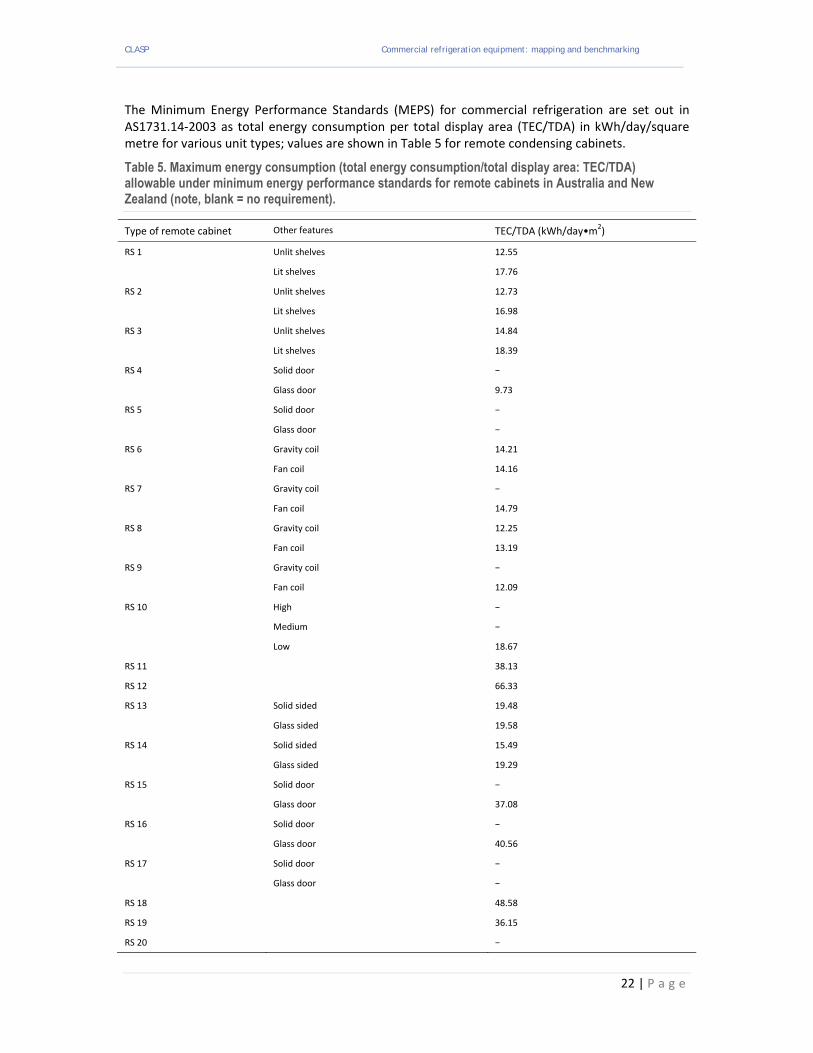
The Minimum Energy Performance Standards (MEPS) for commercial refrigeration are set out in AS1731.14‐2003 as total energy consumption per total display area (TEC/TDA) in kWh/day/square metre for various unit types; values are shown in Table 5 for remote condensing cabinets.
Table 5. Maximum energy consumption (total energy consumption/total display area: TEC/TDA) allowable under minimum energy performance standards for remote cabinets in Australia and New Zealand (note, blank = no requirement).
Type of remote cabinet Other features TEC/TDA (kWh/day•m2)
RS 1 Unlit shelves 12.55
Lit shelves 17.76
RS 2 Unlit shelves 12.73
Lit shelves 16.98
RS 3 Unlit shelves 14.84
Lit shelves 18.39
RS 4 Solid door −
Glass door 9.73
RS 5 Solid door −
Glass door −
RS 6 Gravity coil 14.21
Fan coil 14.16
RS 7 Gravity coil −
Fan coil 14.79
RS 8 Gravity coil 12.25
Fan coil 13.19
RS 9 Gravity coil −
Fan coil 12.09
RS 10 High −
Medium −
Low 18.67
RS 11 38.13
RS 12 66.33
RS 13 Solid sided 19.48
Glass sided 19.58
RS 14 Solid sided 15.49
Glass sided 19.29
RS 15 Solid door −
Glass door 37.08
RS 16 Solid door −
Glass door 40.56
RS 17 Solid door −
Glass door −
RS 18 48.58
RS 19 36.15
RS 20 −
CLASP Commercial refrigeration equipment: mapping and benchmarking
23 | P a g e
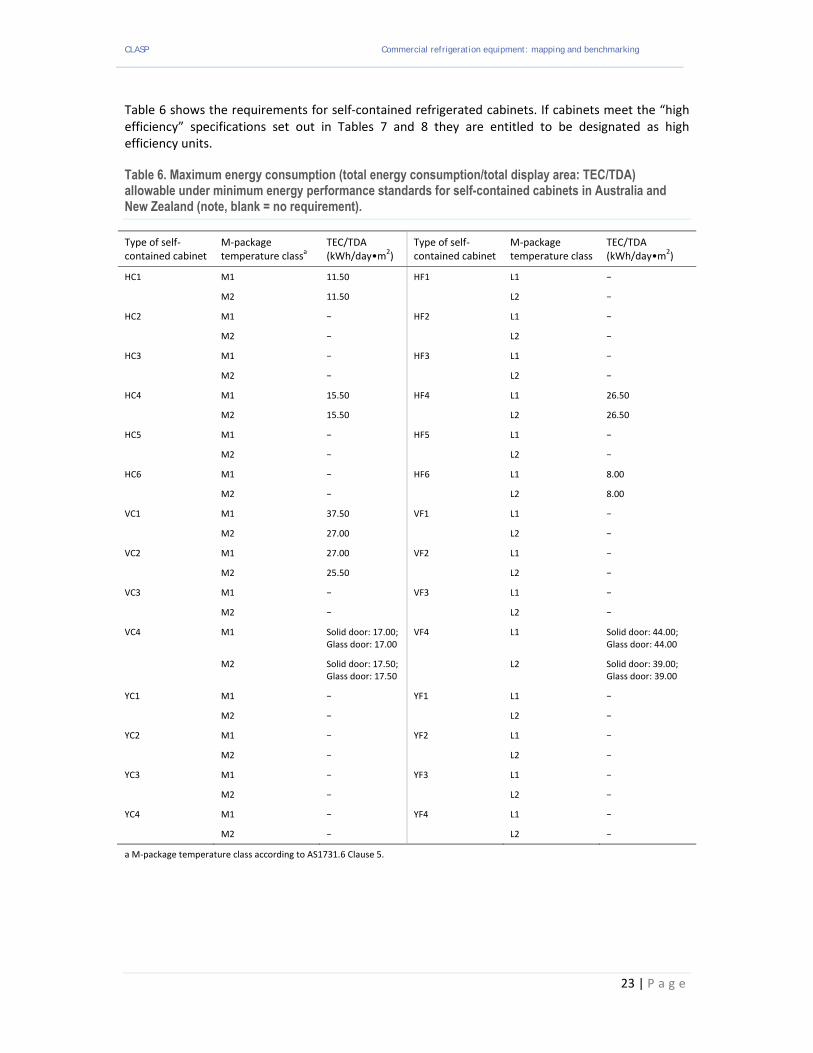
Table 6 shows the requirements for self‐contained refrigerated cabinets. If cabinets meet the “high efficiency” specifications set out in Tables 7 and 8 they are entitled to be designated as high efficiency units.
Table 6. Maximum energy consumption (total energy consumption/total display area: TEC/TDA) allowable under minimum energy performance standards for self-contained cabinets in Australia and New Zealand (note, blank = no requirement).
Type of self‐contained cabinet
M‐package temperature classa
TEC/TDA (kWh/day•m2)
Type of self‐contained cabinet
M‐package temperature class
TEC/TDA (kWh/day•m2)
HC1 M1 11.50 HF1 L1 −
M2 11.50 L2 −
HC2 M1 − HF2 L1 −
M2 − L2 −
HC3 M1 − HF3 L1 −
M2 − L2 −
HC4 M1 15.50 HF4 L1 26.50
M2 15.50 L2 26.50
HC5 M1 − HF5 L1 −
M2 − L2 −
HC6 M1 − HF6 L1 8.00
M2 − L2 8.00
VC1 M1 37.50 VF1 L1 −
M2 27.00 L2 −
VC2 M1 27.00 VF2 L1 −
M2 25.50 L2 −
VC3 M1 − VF3 L1 −
M2 − L2 −
VC4 M1 Solid door: 17.00; Glass door: 17.00
VF4 L1 Solid door: 44.00; Glass door: 44.00
M2 Solid door: 17.50; Glass door: 17.50
L2 Solid door: 39.00; Glass door: 39.00
YC1 M1 − YF1 L1 −
M2 − L2 −
YC2 M1 − YF2 L1 −
M2 − L2 −
YC3 M1 − YF3 L1 −
M2 − L2 −
YC4 M1 − YF4 L1 −
M2 − L2 −
a M‐package temperature class according to AS1731.6 Clause 5.
CLASP Commercial refrigeration equipment: mapping and benchmarking
24 | P a g e
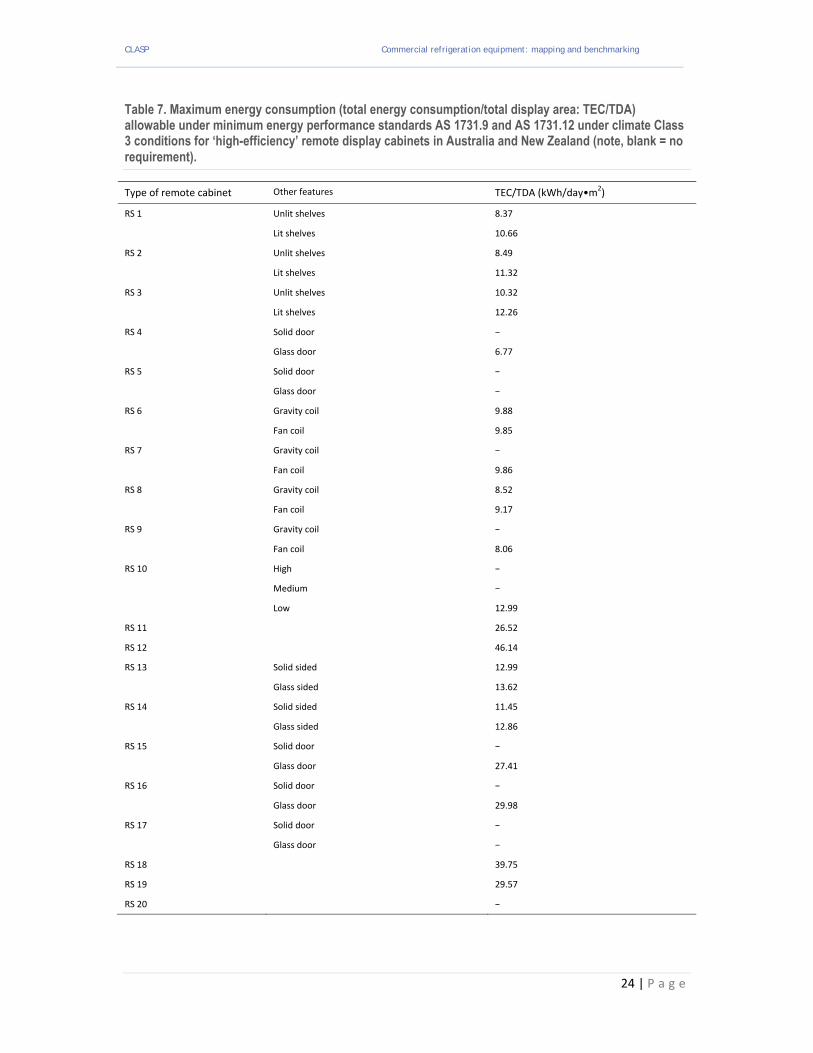
Table 7. Maximum energy consumption (total energy consumption/total display area: TEC/TDA) allowable under minimum energy performance standards AS 1731.9 and AS 1731.12 under climate Class 3 conditions for ‘high-efficiency’ remote display cabinets in Australia and New Zealand (note, blank = no requirement).
Type of remote cabinet Other features TEC/TDA (kWh/day•m2)
RS 1 Unlit shelves 8.37
Lit shelves 10.66
RS 2 Unlit shelves 8.49
Lit shelves 11.32
RS 3 Unlit shelves 10.32
Lit shelves 12.26
RS 4 Solid door −
Glass door 6.77
RS 5 Solid door −
Glass door −
RS 6 Gravity coil 9.88
Fan coil 9.85
RS 7 Gravity coil −
Fan coil 9.86
RS 8 Gravity coil 8.52
Fan coil 9.17
RS 9 Gravity coil −
Fan coil 8.06
RS 10 High −
Medium −
Low 12.99
RS 11 26.52
RS 12 46.14
RS 13 Solid sided 12.99
Glass sided 13.62
RS 14 Solid sided 11.45
Glass sided 12.86
RS 15 Solid door −
Glass door 27.41
RS 16 Solid door −
Glass door 29.98
RS 17 Solid door −
Glass door −
RS 18 39.75
RS 19 29.57
RS 20 −

CLASP Commercial refrigeration equipment: mapping and benchmarking
25 | P a g e
Table 8. Maximum energy consumption (total energy consumption/total display area: TEC/TDA) allowable under minimum energy performance standards AS 1731.9 and AS 1731.12 under climate Class 3 conditions for ‘high-efficiency’ self-contained cabinets in Australia and New Zealand (note, blank = no requirement).
Type of self‐contained cabinet
M‐package temperature classa
TEC/TDA (kWh/day•m2)
Type of self‐contained cabinet
M‐package temperature class
TEC/TDA (kWh/day•m2)
HC1 M1 8.50 HF1 L1 −
M2 8.50 L2 −
HC2 M1 − HF2 L1 −
M2 − L2 −
HC3 M1 − HF3 L1 −
M2 − L2 −
HC4 M1 11.40 HF4 L1 19.50
M2 11.40 L2 19.50
HC5 M1 − HF5 L1 −
M2 − L2 −
HC6 M1 − HF6 L1 5.90
M2 − L2 5.90
VC1 M1 27.60 VF1 L1 −
M2 20.60 L2 −
VC2 M1 19.90 VF2 L1 −
M2 18.80 L2 −
VC3 M1 − VF3 L1 −
M2 − L2 −
VC4 M1 Solid door: 7.30; Glass door: 10.70
VF4 L1 Solid door: 32.40; Glass door: 32.40
M2 Solid door: 7.30; Glass door: 10.70
L2 Solid door: 28.70; Glass door: 28.70
YC1 M1 − YF1 L1 −
M2 − L2 −
YC2 M1 − YF2 L1 −
M2 − L2 −
YC3 M1 − YF3 L1 −
M2 − L2 −
a M‐package temperature class according to AS1731.6 Clause 5.
The test procedures for commercial refrigeration are the specified parts AS 1731. When measured in accordance with AS 1731.9 and AS 1731.12 the energy consumption of a remote or self‐contained refrigerated cabinet shall not exceed a specified value as set out in Table 5 for remote condensing cabinets and Table 6 for self‐contained refrigerated cabinets.
For the purpose of testing compliance, tests shall be conducted under climate Class 3 conditions, with lighting and anti‐sweat heaters running for the duration of the test period, unless controlled by a time‐clock, smart sensor or similar automatic device. Where night‐covers are supplied as a permanent fixture of the cabinet, the test shall be conducted as described in AS 1731.9, Section 4.
CLASP Commercial refrigeration equipment: mapping and benchmarking
26 | P a g e
Reference should be made to the relevant parts of AS 1731 for detailed conditions and test methods.
Brazil
Brazil currently has no MEPS in place for any type of commercial refrigeration equipment.
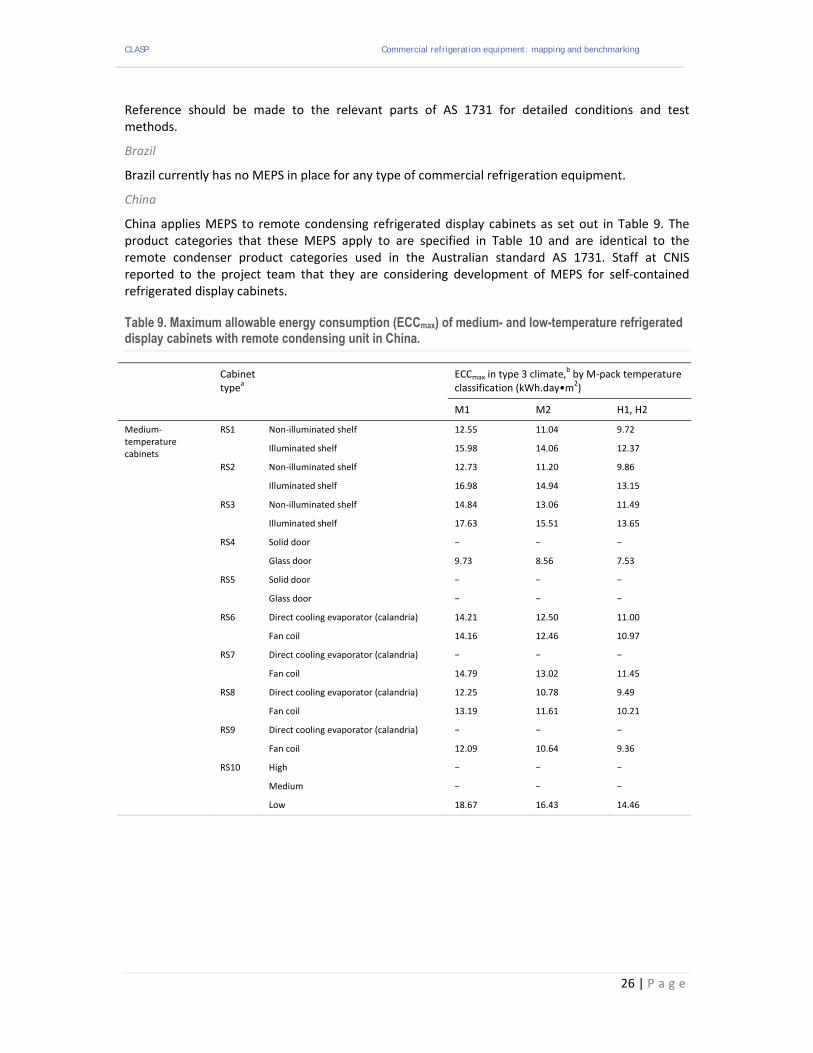
China
China applies MEPS to remote condensing refrigerated display cabinets as set out in Table 9. The product categories that these MEPS apply to are specified in Table 10 and are identical to the remote condenser product categories used in the Australian standard AS 1731. Staff at CNIS reported to the project team that they are considering development of MEPS for self‐contained refrigerated display cabinets.
Table 9. Maximum allowable energy consumption (ECCmax) of medium- and low-temperature refrigerated display cabinets with remote condensing unit in China.
Cabinet typea
ECCmax in type 3 climate,b by M‐pack temperature classification (kWh.day•m2)
M1 M2 H1, H2
Medium‐temperature cabinets
RS1 Non‐illuminated shelf 12.55 11.04 9.72
Illuminated shelf 15.98 14.06 12.37
RS2 Non‐illuminated shelf 12.73 11.20 9.86
Illuminated shelf 16.98 14.94 13.15
RS3 Non‐illuminated shelf 14.84 13.06 11.49
Illuminated shelf 17.63 15.51 13.65
RS4 Solid door − − −
Glass door 9.73 8.56 7.53
RS5 Solid door − − −
Glass door − − −
RS6 Direct cooling evaporator (calandria) 14.21 12.50 11.00
Fan coil 14.16 12.46 10.97
RS7 Direct cooling evaporator (calandria) − − −
Fan coil 14.79 13.02 11.45
RS8 Direct cooling evaporator (calandria) 12.25 10.78 9.49
Fan coil 13.19 11.61 10.21
RS9 Direct cooling evaporator (calandria) − − −
Fan coil 12.09 10.64 9.36
RS10 High − − −
Medium − − −
Low 18.67 16.43 14.46

CLASP Commercial refrigeration equipment: mapping and benchmarking
27 | P a g e
Table 9. continued. Maximum allowable energy consumption (ECCmax) of medium- and low-temperature refrigerated display cabinets with remote condensing unit in China.
Cabinet typea
ECCmax in type 3 climate,b by M‐pack temperature classification (kWh.day•m2)
M1 M2 H1, H2
Low‐temperature cabinets
RS11 38.13 30.50 24.40
RS12 66.33 53.06 42.45
RS13 Solid envelope 19.48 15.58 12.47
Glass envelope 19.58 15.66 12.53
RS14 Solid envelope 17.17 13.74 10.99
Glass envelope 18.49 14.79 11.83
RS15 Solid door − − −
Glass door 37.08 29.66 23.73
RS16 Solid door
Glass door 40.56 32.45 25.96
RS17 Solid door − − −
Glass door − − −
RS18 48.58 38.86 31.09
RS19 36.15 28.92 23.14
RS20
Abbreviations: EECmax = maximum allowable energy efficiency co‐efficient (total energy consumption [kWh/day]/total display area [m2]).
a See Table {A1 & 2} for RS classification codes. b As specified in GB/T21001.2‐2007.

CLASP Commercial refrigeration equipment: mapping and benchmarking
28 | P a g e
Table 10. Types of refrigerated display cabinets with remote condensing units in China.
Cabinet type Model Description Classification
Medium‐temperature cabinets
Open multi‐level upright (high)
RS1 Medium‐temperature‐multi‐level cabinet, air curtain length 1.5–1.9 m; cabinet height 2.2–2.5 m, depth 0.6–1.2 m
Non‐illuminated shelf
Illuminated shelf
Open multi‐level upright (medium)
RS2 Medium‐temperature‐multi‐level cabinet, air curtain length 1.0–1.5 m; cabinet height 1.8–2.19 m, depth 0.6–1.2 m
Non‐illuminated shelf
Illuminated shelf
Open multi‐level upright (low)
RS3 Medium‐temperature‐multi‐level cabinet, air curtain length 0.8–1.2 m; cabinet height 0–1.79 m, depth 0.6–1.2 m
Non‐illuminated shelf
Illuminated shelf
Enclosed self‐service storage
RS4 Multiple shelves, glass door; cabinet height 1.8–2.2 m, depth 0.6–1.2 m
Solid door Glass door
Enclosed self‐service storage: lower counter
RS5 Multiple shelves, glass door; cabinet height 0–1.79 m, depth 0.6–1.2 m
Solid door Glass door
With front single‐layer flat glass
RS6 Medium‐temperature single‐level cabinet with flat glass at the front and sliding door at the back; cabinet height 1.25–1.4 m, depth 0.8–1.2 m; two subtypes according to the arrangement of the coils of its evaporator
Direct‐cooling calandria
Fan coil
With front double‐ or multi‐layer flat glass
RS7 Medium‐temperature double‐ or multi‐level cabinet with flat glass at the front and sliding door at the back; cabinet height 1.25–1.4 m, depth 0.8–1.2 m; two subtypes according to the arrangement of the coils of its evaporator
Direct‐cooling calandria
Fan coil
With front single‐layer curved glass
RS8 Medium‐temperature‐single‐level cabinet with curved glass at the front and sliding door at the back; cabinet height 1.25–1.4 m, depth 0.8–1.2 m; two subtypes according to the arrangement of the coils of its evaporator
Direct‐cooling calandria
Fan coil
With front double‐ or multi‐layer curved glass
RS9 Medium‐temperature‐double‐ or multi‐level cabinet with curved glass at the front and sliding door at the back; cabinet height 1.25–1.4 m, depth 0.8–1.2 m; two subtypes according to the arrangement of the coils of its evaporator
Direct‐cooling calandria
Fan coil
Upright with glass structure visible on four sides
RS10 Cabinet height 2.2–2.5 m (high), 1.8–2.9 m (medium), 0–1.79 m (low)
High Medium Low
Low‐temperature cabinets
Open multi‐level upright (medium)
RS11 Low‐temperature multi‐level cabinet, air curtain length 1.0–1.5 m; cabinet height 1.8–2.19 m, depth 0.6–1.2 m
No classification
Open multi‐level upright (low)
RS12 Low‐temperature multi‐level cabinet, air curtain length 0.6–1.0 m; cabinet height 0–1.79 m, depth 0.6–1.2 m
No classification
Single‐width open RS13 Low‐temperature self‐service open cabinet with horizontal air curtain (length 0.75–0.85 m) at the opening
With solid envelope
With glass envelope
Double‐width open RS14 Low‐temperature self‐service open cabinet with horizontal air curtain (length 2 × (0.75–0.85 m)) at the opening
With solid envelope
With glass envelope
Enclosed self‐service storage (high)
RS15 Low‐temperature, cabinet height 2.2–2.8 m, depth 0.6–1.2 m
Solid door Glass door
Enclosed self‐service storage (medium)
RS16 Low‐temperature, cabinet height 1.8–2.19 m, depth 0.6–1.2 m
Solid door Glass door
Enclosed self‐service storage (low)
RS17 Low‐temperature, cabinet height 0–1.79 m, depth 0.6–1.2 m
Solid door Glass door
Composite with glass door in upper part and open lower part
RS18 Cabinet height 1.8 – 2.2 m, with glass door in the upper part and open lower part
No classification
Enclosed self‐service storage with glass structure visible on four sides (high)
RS19 Low‐temperature, glass door, cabinet height 2.2–2.8 m, depth 1.9–2.1 m
No classification
Enclosed self‐service storage with glass structure visible on four sides (medium)
RS20 Low‐temperature, glass door, cabinet height 1.8–2.19 m, depth 1.9–2.1 m
No classification
CLASP Commercial refrigeration equipment: mapping and benchmarking
29 | P a g e
Europe
The European Union is currently developing Ecodesign requirements for all types of non‐customised commercial refrigeration equipment. Separate studies are being done for merchandising reach‐in coolers and vending machines (Ecodesign Lot 12) and professional refrigeration and freezing equipment (ENTR Lot 1). The Lot 12 study is expected to be completed in early 2014 and new Ecodesign policy measures proposed shortly afterwards. Proposed regulations for professional refrigeration and freezing equipment (including commercial service cabinets) were submitted to inter‐service consultation within the European Commission in June 2013. The preliminary Lot 12 work includes analysis supplied by the project team working on this study.
India
India currently has no MEPS in place for any type of commercial refrigeration equipment.
Japan
Japan currently has no MEPS in place for refrigerated display cabinets but does have “Top Runner” requirements for commercial service cabinets.
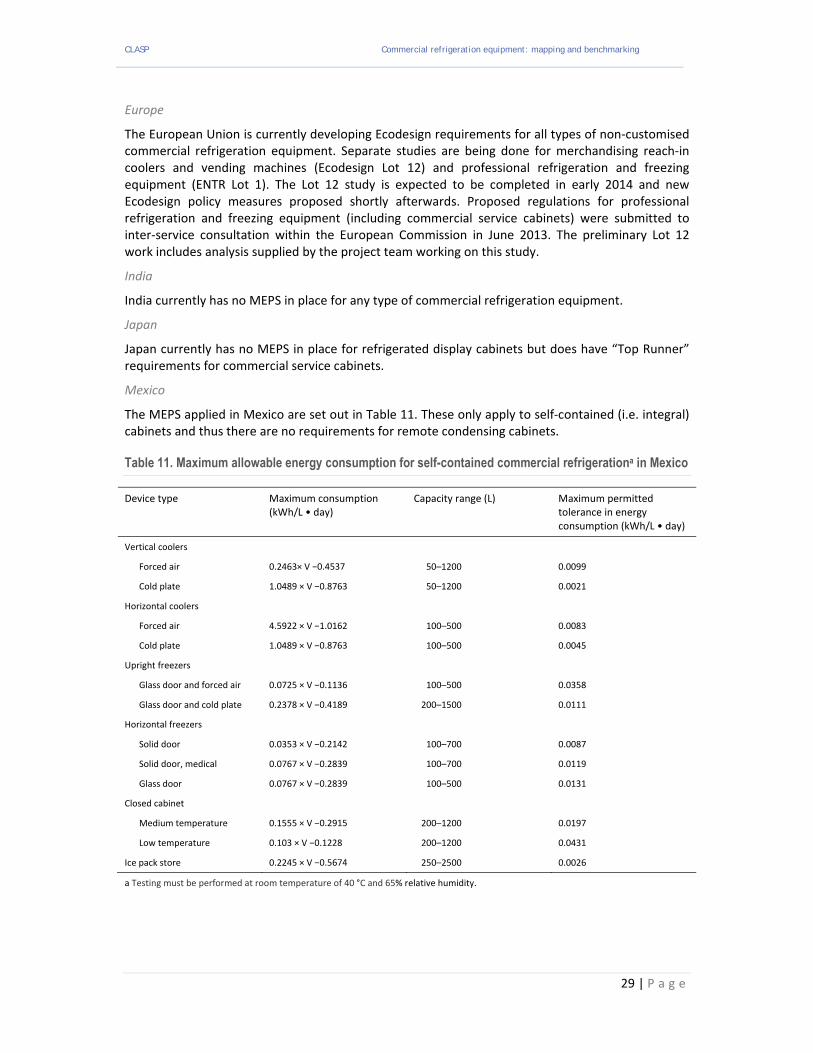
Mexico
The MEPS applied in Mexico are set out in Table 11. These only apply to self‐contained (i.e. integral) cabinets and thus there are no requirements for remote condensing cabinets.
Table 11. Maximum allowable energy consumption for self-contained commercial refrigerationa in Mexico
Device type Maximum consumption (kWh/L • day)
Capacity range (L) Maximum permitted tolerance in energy consumption (kWh/L • day)
Vertical coolers
Forced air 0.2463× V −0.4537 50–1200 0.0099
Cold plate 1.0489 × V −0.8763 50–1200 0.0021
Horizontal coolers
Forced air 4.5922 × V −1.0162 100–500 0.0083
Cold plate 1.0489 × V −0.8763 100–500 0.0045
Upright freezers
Glass door and forced air 0.0725 × V −0.1136 100–500 0.0358
Glass door and cold plate 0.2378 × V −0.4189 200–1500 0.0111
Horizontal freezers
Solid door 0.0353 × V −0.2142 100–700 0.0087
Solid door, medical 0.0767 × V −0.2839 100–700 0.0119
Glass door 0.0767 × V −0.2839 100–500 0.0131
Closed cabinet
Medium temperature 0.1555 × V −0.2915 200–1200 0.0197
Low temperature 0.103 × V −0.1228 200–1200 0.0431
Ice pack store 0.2245 × V −0.5674 250–2500 0.0026
a Testing must be performed at room temperature of 40 °C and 65% relative humidity.

CLASP Commercial refrigeration equipment: mapping and benchmarking
30 | P a g e
USA
In the USA equipment class designations are coded using a combination of (i) a family code, (ii) an operating mode code and (iii) a rating temperature code; the codes are separated by full points.
(i) Family codes: HCS, horizontal solid doors; HCT, horizontal transparent doors; HZO, horizontal open; SOC, service over counter; SVO, semi‐vertical open; VCS, vertical solid doors; VCT, vertical transparent doors; VOP, vertical open.
(ii) Operating mode codes: RC, remote condensing; SC, self‐contained (integral).
(iii) Rating temperature codes: I, ice cream temperature (−15 °F; −26.1 °C); L, low temperature (0 °F; −17.8°C); M, medium temperature (38 °F; 3.3 °C).
Tables 12 and 13 set out the definitions of types of commercial refrigeration equipment configurations applied in US MEPS for commercial refrigeration equipment. It is worth noting that the most popular type of product, bottle coolers (classified as VCT.SC.M) is not included in this list but is covered in a separate regulation.
The scope of the US MEPS regulations for commercial refrigerators and freezers also excludes walk in cabinets.
Table 12. Definitions and configurations for commercial refrigerators and freezers in the USA
Type Description
Doors Other information
Vertical open (VOP) No Air‐curtain angle ≥0 degrees and <10 degrees from the vertical
Semi‐vertical open (SVO) No Air‐curtain angle ≥10 degrees and <80 degrees from the vertical
Horizontal open (HZO) No Air‐curtain angle ≥80 degrees from the vertical
Vertical closed (VC) Hinged or sliding Door angle <45 degrees
Horizontal closed (HC) Hinged or sliding Door angle ≥45 degrees
Source: DOE 2009.
The MEPS applied to commercial refrigeration equipment in the USA are shown in Table 14.

CLASP Commercial refrigeration equipment: mapping and benchmarking
31 | P a g e
Table 13. Commercial refrigeration equipment in the USA, by category
Equipment category Condensing unit configuration
Equipment family Operating temperature (°F
a)
Equipment class designation
Remote condensing commercial refrigerators, freezers and refrigerator‐freezers
Remote Vertical open ≥32 <32
VOP.RC.M VOP.RC.L
Semi‐vertical open ≥32 <32
SVO.RC.M SVO.RC. L
Horizontal open ≥32 <32
HZO.RC.M HZO.RC.L
Vertical closed transparent ≥32 <32
VCT.RC.M VCT.RC.L
Horizontal closed transparent ≥32 <32
HCT.RC.M HCT.RC.L
Vertical closed solid ≥32 <32
VCS.RC.M VCS.RC.L
Horizontal closed solid ≥32 <32
HCS.RC.M HCS.RC.L
Service over counter ≥32 <32
SOC.RC.M SOC.RC.L
Self‐contained commercial refrigerators, freezers and refrigerator‐freezers without doors
Self‐contained Vertical open ≥32 <32
VOP.SC.M VOP.SC.L
Semi‐vertical open ≥32 <32
SVO.SC.M SVO.SC.L
Horizontal open ≥32 <32
HZO.SC.M HZO.SC.L
Commercial ice cream freezersb Remote Vertical open ≤−5 VOP.RC.I
Semi‐vertical open SVO.RC.I
Horizontal open HZO.RC.I
Vertical closed transparent VCT.RC.I
Horizontal closed transparent HZT.RC.I
Vertical closed solid VCS.RC.I
Horizontal closed solid HCS.RC.I
Service over counter SCO.RC.I
Self‐contained Vertical open VOP.SC.I
Semi‐vertical open SVO.SC.I
Horizontal open HZO.SC.I
Vertical closed transparent VCT.SC.I
Horizontal closed transparent HCT.SC.I
Vertical closed solid VCS.SC.I
Horizontal closed solid HCS.SC.I
Service over counter SOC.SC.I
Source: DOE 2009.
a 32 °F = 0 °C.
b ‘Ice cream freezer’ is defined in 10 CFR 431.62 as a commercial freezer designed to operate at or below −5 °F (−21 °C) and for the storing, display or dispensing of ice cream.

CLASP Commercial refrigeration equipment: mapping and benchmarking
32 | P a g e
Table 14. Standard levels for commercial refrigerators and freezers (including display and solid-door cabinets) manufactured in or imported into the USA, applied on or after 1 January 2012
Equipment class Standard level (kWh/day)
Operating mode Rating temperature Family
Remote condensing Medium VOP 0.82 x TDA + 4.07
SVO 0.83 x TDA + 3.18
HZO 0.35 x TDA + 2.88
VCT 0.22 x TDA + 1.95
SOC 0.51 x TDA + 0.11
HCT 0.16 x TDA + 0.13
VCS 0.11 x TDA + 0.26
HCS 0.11 x TDA + 0.26
Low VOP 2.27 x TDA + 6.85
HZO 0.57 x TDA + 6.88
VCT 0.56 x TDA + 2.61
SVO 2.27 x TDA + 6.85
HCT 0.34 x TDA + 0.26
VCS 0.23 x TDA + 0.54
HCS 0.23 x TDA + 0.54
SOC 1.08 x TDA + 0.22
Ice cream VOP 2.89 x TDA + 8.70
SVO 2.89 x TDA + 8.70
HZO 0.72 x TDA + 8.74
VCT 0.66 x TDA + 3.05
HCT 0.40 x TDA + 0.31
VCS 0.27 x TDA + 0.63
HCS 0.27 x TDA + 0.63
SOC 1.26 x TDA + 0.26
Self‐contained Medium VOP 1.74 x TDA + 4.71
SVO 1.73 x TDA + 4.59
HZO 0.77 x TDA + 5.55
Low HZO 1.92 x TDA + 7.08
VOP 4.37 x TDA + 11.82
SVO 4.34 x TDA + 11.51
Ice cream VCT 0.67 x TDA + 3.29
VCS 0.38 x TDA + 0.88
HCT 0.56 x TDA + 0.43
VOP 2.89 x TDA + 8.70
SVO 2.89 x TDA + 8.70
HZO 0.72 x TDA + 8.74
SOC 1.76 x TDA + 0.36
HCS 0.38 x TDA + 0.88
Source: DOE 2009. Abbreviations: TDA = total display area in ft2 according to ARI Standard 1200‐2006, Appendix C).

CLASP Commercial refrigeration equipment: mapping and benchmarking
33 | P a g e
California
California applies MEPS to refrigerated display cabinets which predate those applying in the rest of the USA as shown in Table 15 and which are based on a volumetric measure as opposed to total display area. California MEPS were superseded by USA MEPS beginning January 1, 2012.
The scope of the MEPS regulations, are the same as for the US Federal regulations except the latter include one additional category of appliance (Reach‐in cabinets, pass‐through cabinets, and roll‐in or roll‐through cabinets that are "pulldown" refrigerators – transparent door ‐ 0.126V+ 3.51 maximum daily consumption in kWh/day) which does not feature in the California standard. The Californian regulations also cover bottle coolers (the IVC4 / VCT.SC.M class products) in the same regulation as for other retail display cabinets.
Table 15. Standard levels for commercial refrigerators and freezers (including display and solid-door cabinets) manufactured in or imported into California

CLASP Commercial refrigeration equipment: mapping and benchmarking
34 | P a g e
South‐Africa
SABS 1406:1999: ‘commercial refrigerated food display cabinets’
This standard provides a test methodology and a minimum energy performance standard, based on the gross capacity of the cabinet. The standard specifies requirements for three refrigerated display cabinet types and two climate classes for the storage, or sale, of frozen and fresh foods, and liquids in containers, and intended for operation on a three‐phase 440 V power supply or on a single‐phase power supply not exceeding 250 V phase to neutral.
The energy requirements of this standard cover energy consumption, test conditions and energy consumption test.
Labelling
China and Mexico are the only economies to apply mandatory energy labelling for refrigerated display cabinets. Australia applies a kind of high efficiency designation scheme and the USA operates voluntary energy labelling through Energy Star.
Australia
Australia has no energy labelling requirements in place for refrigerated display cabinets but does permit products to be designated as high efficiency units if they meet the requirements set out in Tables 7 and 8.
Brazil
Brazil currently has no energy labels in place for commercial refrigeration equipment.
China
China operates a mandatory energy label for remote condensing refrigerated display cabinets whose specifications are set out in Table 16.
Table 16. Energy efficiency grades of refrigerated display cabinets with remote condensing units in China
Energy efficiency index (ECC/ECCmax × 100%) Energy efficiency grade
<=55% 1
55% < 65% 2
65% < 80% 3
80% < 90% 4
90% < 100% 5
Abbreviations: EECmax = maximum allowable energy efficiency co‐efficient (total energy consumption [kWh/day]/total display area [m2]).
The energy efficiency grade of a particular refrigerated display cabinet shall be judged according to the results of the ECC test and Table 16. The energy efficiency index EEI is calculated from:
EEI= ECC / ECCmax ×100%
Where:
EEI (energy efficiency index) has no dimension
ECC = the energy consumption coefficient of a refrigerated display cabinet with remote condensing (kWh/24h/m2) (this is equivalent to a TEC/TDA metric)
ECCmax = the maximum allowable value of the energy consumption coefficient of a refrigerated display cabinet with remote condensing unit (kWh/24h/m2).

CLASP Commercial refrigeration equipment: mapping and benchmarking
35 | P a g e
Europe
Europe is developing Ecodesign requirements for refrigerated display cabinet units and it is possible recommendations regarding energy labelling could also be formulated as part of the same policy process.
India
India currently has no energy labels in place for commercial refrigeration equipment.
Japan
Japan currently has no energy labels in place for reach‐in‐coolers.
Mexico
Mexico operates a mandatory energy label for self‐contained refrigerated display cabinets as shown in Figure 8. All eligible products are required to be certified and registered by CONUEE.
Figure 8. The Mexican energy label for self-contained RDC units
South Africa
South Africa currently has no energy labels in place for reach‐in‐coolers.
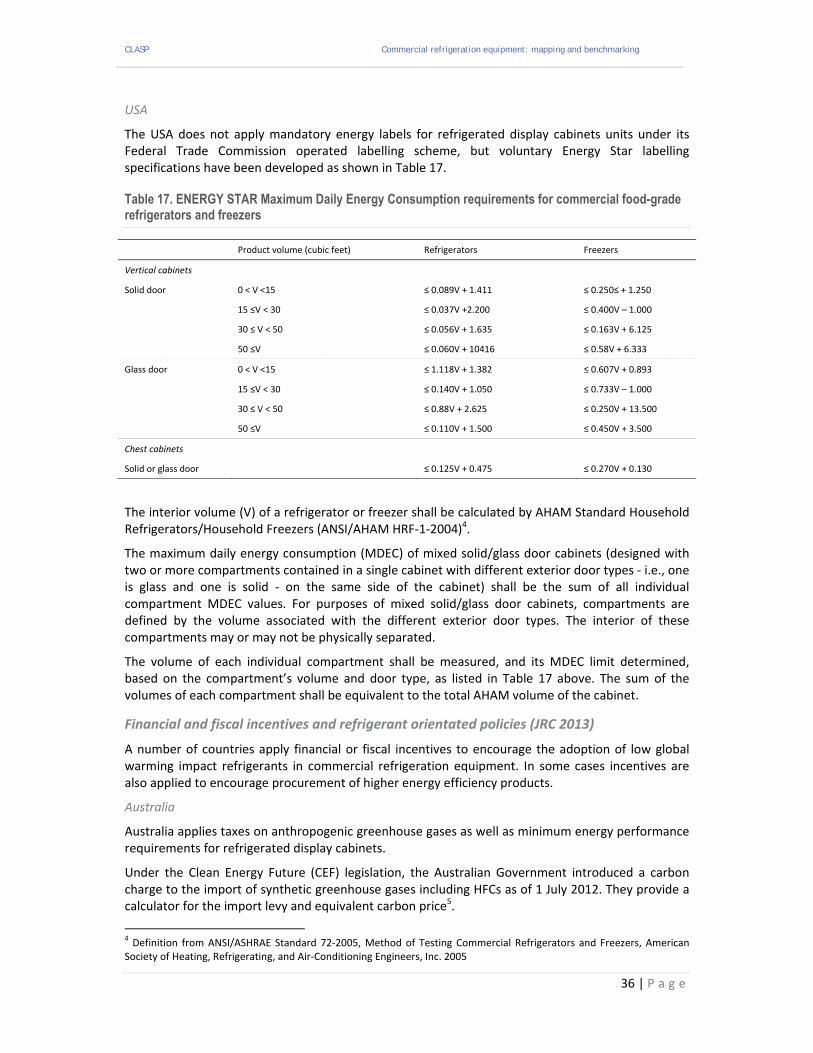
CLASP Commercial refrigeration equipment: mapping and benchmarking
36 | P a g e
USA
The USA does not apply mandatory energy labels for refrigerated display cabinets units under its Federal Trade Commission operated labelling scheme, but voluntary Energy Star labelling specifications have been developed as shown in Table 17.
Table 17. ENERGY STAR Maximum Daily Energy Consumption requirements for commercial food-grade refrigerators and freezers
Product volume (cubic feet) Refrigerators Freezers
Vertical cabinets
Solid door 0 < V <15 ≤ 0.089V + 1.411 ≤ 0.250≤ + 1.250
15 ≤V < 30 ≤ 0.037V +2.200 ≤ 0.400V – 1.000
30 ≤ V < 50 ≤ 0.056V + 1.635 ≤ 0.163V + 6.125
50 ≤V ≤ 0.060V + 10416 ≤ 0.58V + 6.333
Glass door 0 < V <15 ≤ 1.118V + 1.382 ≤ 0.607V + 0.893
15 ≤V < 30 ≤ 0.140V + 1.050 ≤ 0.733V – 1.000
30 ≤ V < 50 ≤ 0.88V + 2.625 ≤ 0.250V + 13.500
50 ≤V ≤ 0.110V + 1.500 ≤ 0.450V + 3.500
Chest cabinets
Solid or glass door ≤ 0.125V + 0.475 ≤ 0.270V + 0.130
The interior volume (V) of a refrigerator or freezer shall be calculated by AHAM Standard Household Refrigerators/Household Freezers (ANSI/AHAM HRF‐1‐2004)4.
The maximum daily energy consumption (MDEC) of mixed solid/glass door cabinets (designed with two or more compartments contained in a single cabinet with different exterior door types ‐ i.e., one is glass and one is solid ‐ on the same side of the cabinet) shall be the sum of all individual compartment MDEC values. For purposes of mixed solid/glass door cabinets, compartments are defined by the volume associated with the different exterior door types. The interior of these compartments may or may not be physically separated.
The volume of each individual compartment shall be measured, and its MDEC limit determined, based on the compartment’s volume and door type, as listed in Table 17 above. The sum of the volumes of each compartment shall be equivalent to the total AHAM volume of the cabinet.
Financial and fiscal incentives and refrigerant orientated policies (JRC 2013)
A number of countries apply financial or fiscal incentives to encourage the adoption of low global warming impact refrigerants in commercial refrigeration equipment. In some cases incentives are also applied to encourage procurement of higher energy efficiency products.
Australia
Australia applies taxes on anthropogenic greenhouse gases as well as minimum energy performance requirements for refrigerated display cabinets.
Under the Clean Energy Future (CEF) legislation, the Australian Government introduced a carbon charge to the import of synthetic greenhouse gases including HFCs as of 1 July 2012. They provide a calculator for the import levy and equivalent carbon price5.
4 Definition from ANSI/ASHRAE Standard 72‐2005, Method of Testing Commercial Refrigerators and Freezers, American Society of Heating, Refrigerating, and Air‐Conditioning Engineers, Inc. 2005
CLASP Commercial refrigeration equipment: mapping and benchmarking
37 | P a g e
Denmark
Denmark has one of the most stringent combinations of HFC taxation and a partial ban. The complete Danish refrigeration industry is subject to a gradual phase out of fluorinated greenhouse gases. New refrigeration systems requiring more than 10 kg of fluorinated refrigerant have been banned since 1 January 20076. This ban has had a huge impact on the systems implemented especially in supermarkets, where practically all new supermarkets are built with trans‐critical CO2 systems. The ban is further complemented with a tax on the import of fluorinated greenhouse gases.
Following a request by Denmark in February 2012, the European Commission has issued a decision allowing the country to maintain more stringent national legislation than the EU F‐gas regulation, authorising a continuation of the national ban on new products containing certain F‐gases.
France
France is introducing more stringent requirements set out in the EU F‐gas regulation, by setting the target at a minimum refrigerant charge of 2 kg instead of 3 kg as specified in the original EU framework document. From 4 July 2009, anyone having installed or intending to install refrigeration systems including cooling fluids needs to have an attestation of capacity.
Recently, the French government indicated that it will examine the possibility of an F‐gas tax in the “Roadmap for the Environmental Transition” published after the Grenelle de l’environnement (Environmental Conference) held on 14‐15 September 2012 in Paris. The document states that “concerning the fight against climate change, the [French] government […] will perform assessment studies on the appropriateness of levying a tax on fluorinated greenhouse gases used as refrigerants […]”.
In January 2012, the association of French retailers (Fédération des Entreprises du Commerce et de la Distribution – FCD) made a commitment to roll out doors on fridges to all store formats – hypermarkets, supermarkets and convenience stores.
Germany The Federal Ministry for the Environment operates an incentive scheme that covers 25% of the net investment costs for new or existing commercial refrigeration plants using natural refrigerants. Funding for existing systems being afterwards more energy‐efficient but still running on conventional refrigerants will be supported by only 15% of the net investment costs. This scheme may not still be operational as it was frozen in 2010.
Norway
Norway operates a tax and refund scheme for HFCs applying to both imports as well as national production, whether in bulk or in products. Even though Norway is not an EU member state, it belongs to the European Economic Area (EEA), meaning that all environmental and internal market legislation of the EU applies to Norway.
Spain
Spain is understood to be operating some kind of tax rebate for companies applicable to environmental spending which may also apply to investment in energy saving and efficiency measures. It is not clear if the draft law from 2009 has passed into a formal law and/or if there was any modification.
5 See http://www.environment.gov.au/atmosphere/ozone/sgg/equivalentcarbonprice/calculator.html
6 Statutory Order no. 552 of 2 July 2002

CLASP Commercial refrigeration equipment: mapping and benchmarking
38 | P a g e
Sweden
Sweden limits the refrigerant charge per refrigerated display cabinet system to some 30 or 40 kg. Tax burdens on HFC, following the example of Norway, are under consideration and final discussion in the Swedish parliament.
Switzerland
Substances stable in air, including HFCs, have been regulated in Switzerland since July 2003 through the Ordinance on Chemical Risk Reduction (ORRChem). This HFC regulation encompasses licensing, reporting, leak checks, servicing and end‐of‐life requirements for equipment containing more than 3kg of such refrigerants. Moreover, the voluntary Minergie‐label operated by the Swiss Federal Office for Energy certifies energy performance of HVAC and refrigeration systems including refrigerated display cabinets. Many retailers require Minergie labelling for refrigerated display cabinets and are especially applying this to investments in efficient CO2 cooled systems.
In October 2012, ORRChem was amended after 9 years of implementation. The previous mandatory authorisation scheme has been replaced by a ban from placing on the market several types of stationary refrigeration and air‐conditioning systems using F‐gas refrigerants. For commercial refrigeration, this means a ban on systems using F‐gas refrigerants for
sub‐zero C cooling with a cooling capacity of more than 30 kW,
above zero C cooling with a cooling capacity of more than 40 kW;
combined systems with a cooling capacity of more than 40 kW for plus cooling and 8 kW for minus cooling.
United Kingdom
The UK operates an enhanced capital allowance scheme (ECA) which provides businesses with enhanced tax relief for investments in equipment, including refrigerated display cabinets that satisfy specified energy‐saving criteria. Qualified products are listed in a database.7
2.4 Energy efficiency of product markets
Data availability
Data on the energy efficiency of products on the various national markets of interest has been gathered for: Australia, China, the EU, Japan, Mexico, South Africa, the UK and the USA. Some indications of product performance are also available for China and Mexico, based on the prescriptions in the existing MEPS and energy labelling regulations. It was not possible to obtain data for Brazil or India because neither country requires the energy performance of reach‐in coolers to be measured and producers are not in the habit of disclosing such performance even if the data has been measured. Thus the energy performance of products on both markets is unknown, but is thought likely to be towards the lower efficiency end of the international market due to the lack of transparency. The reported data for the other markets (Australia, China, EU, Japan, UK, South Africa, USA/California) is drawn from product databases and is particularly extensive for Australia, EU and USA (California). This is unsurprising as these economies have either set, or are in the process of setting, product energy efficiency requirements. An extensive database of integral cabinets was available from Mexico but no data on remote cabinets was available. By contrast the EU database only includes information on remote cabinets, which have been subject to a voluntary energy labelling scheme since 1997. Some industry sourced information on the average performance of integral cabinets was available too, but is thought to be out of date.
7 https://etl.decc.gov.uk/etl/site/etl/browse‐etl/refrigeration.html

CLASP Commercial refrigeration equipment: mapping and benchmarking
39 | P a g e
The reach‐in cooler energy performance data available for Australia, China, Europe, Japan, Mexico and the USA is summarised as follows:
for Australia, data on commercial refrigeration equipment can be found on the Australian energy rating website www.energyrating.gov.au. The Australian “In from the cold” report (Ellis 2009) contains graphical data from the MEPS registrations for Australia up to 2009. From these graphs, average TEC/TDA values per cabinet category can be estimated. The data from the 2012 IEA‐4E mapping document concerning Australian refrigerated display cabinets (IEA 2012d) unfortunately does not make a distinction between open‐type and glass‐covered type ice cream merchandiser cabinets
energy performance data for China is only available for the very small number (about 16) of products that are registered in the national energy labelling database (http://www.energylabel.gov.cn/NewsMore.aspx?para=uncc_bagg). This data only covers remote condenser refrigerated display cabinets and is not likely to be very representative of the market as a whole as the number of products contained is so small; however, the minimum efficiency of remote condenser units is bounded by MEPS and hence some aspects of the market performance can be derived from the regulations in place
for Europe, energy performance data is available from the Eurovent Certification refrigerated display cabinet programme, published at www.eurovent‐certification.com. This database only contains commercial refrigeration equipment with remote condensing units and only concerns products sold under the four brands currently participating in the certification programme. The data from the 2012 IEA‐4E mapping document concerning UK refrigerated display cabinets (IEA2012b) unfortunately does not make a distinction between open‐type and glass‐covered type ice cream merchandiser cabinets
data on the performance of Japanese commercial refrigeration equipment are not generally publically available, however, one major manufacturer (Fukushima) publish an on‐line catalogue which contains TEC and TDA data, as well as other technical specifications for all their products (a total of over 60 products)
in Mexico, the national energy agency, CONUEE, have supplied access to a database of over 100 integral cabinets registered under the Mexican energy labelling scheme. No data on remote units were available.
for the USA, data are available from the California Energy Commission’s appliance efficiency database at www.appliances.energy.ca.gov. The data on commercial refrigeration equipment concerns both “plug‐in” (integral) appliances and commercial refrigeration equipment with remote condensing units, for a total of 6947 cabinets. The data from the 2012 IEA‐4E mapping document concerning USA refrigerated display cabinets (IEA 2012c) unfortunately uses cabinet volume as functional measure instead of TDA (Total Display Area), and is therefore not as useful for international comparisons.
Energy efficiency metrics
Most economies have adopted the TEC over TDA metric as the measure of energy efficiency of open refrigerated display cabinet units and for most types of glass door cabinets (currently all glass door cabinets in the EU and Australia). Economies using this metric include:
Australia
Brazil
China
EU
Japan
South Africa
USA (in the most recent Federal MEPS regulations except for bottle coolers)
CLASP Commercial refrigeration equipment: mapping and benchmarking
40 | P a g e
In the case of India it is not yet clear what metric, if any, is used to define refrigerated display cabinet efficiency. California and Mexico use a TEC over volume metric.
There are many differences in how the TEC/TDA values are derived, as discussed in section 2.6, which affect the degree of direct comparability of values measured under different test procedures. Section 2.6 also discusses comparisons between TEC/TDA and TEC/volume based efficiency metrics.
Example of energy efficiency data
Table 18 shows an illustration of the refrigerated display cabinet energy performance values found for the EU market. The highest efficiency products in the European market (as found in the Eurovent database, which does not cover all products on the market) are shown in Table 18. Also shown are values that Eurovent themselves report are the “average” of the European market, however, these so called average values are known to be based on data that can be over a decade old and these are therefore unreliable indicators of current average efficiency levels. Eurovent defined their market average efficiency values for remote cabinets in 1997 (based on cabinets manufactured and sold in Finland, France, Germany, Italy, Sweden and the United Kingdom) and for integral cabinets in 2001 (based on cabinets manufactured and sold in Finland, France, Germany, Italy and Spain). The values for integral cabinets have been updated since they were first defined in 2001; however, the values for remote units have not been. Taking into account an average energy consumption improvement of 2.5 % per year (see Figure 9), the project team estimates the Eurovent 2013 values should be corrected such that they become 40 % lower for remote cabinets.
Table 19 shows a summary of the average TEC/TDA data found for all economies as reported according to test results made under the national or regional test procedure. Note, all except the Californian and US TSD values are directly comparable as the test procedures used are essentially harmonised with the EN‐ISO test procedure.
Figure 9 shows how the energy efficiency of one of the most common classes of refrigerated display cabinet has evolved in Europe from 2005 to 2012. The efficiency metric reported in the data is TEC over display cabinet length, which is an historical metric and is used in preference to TEC/TDA to enable the full temporal comparison to be made.
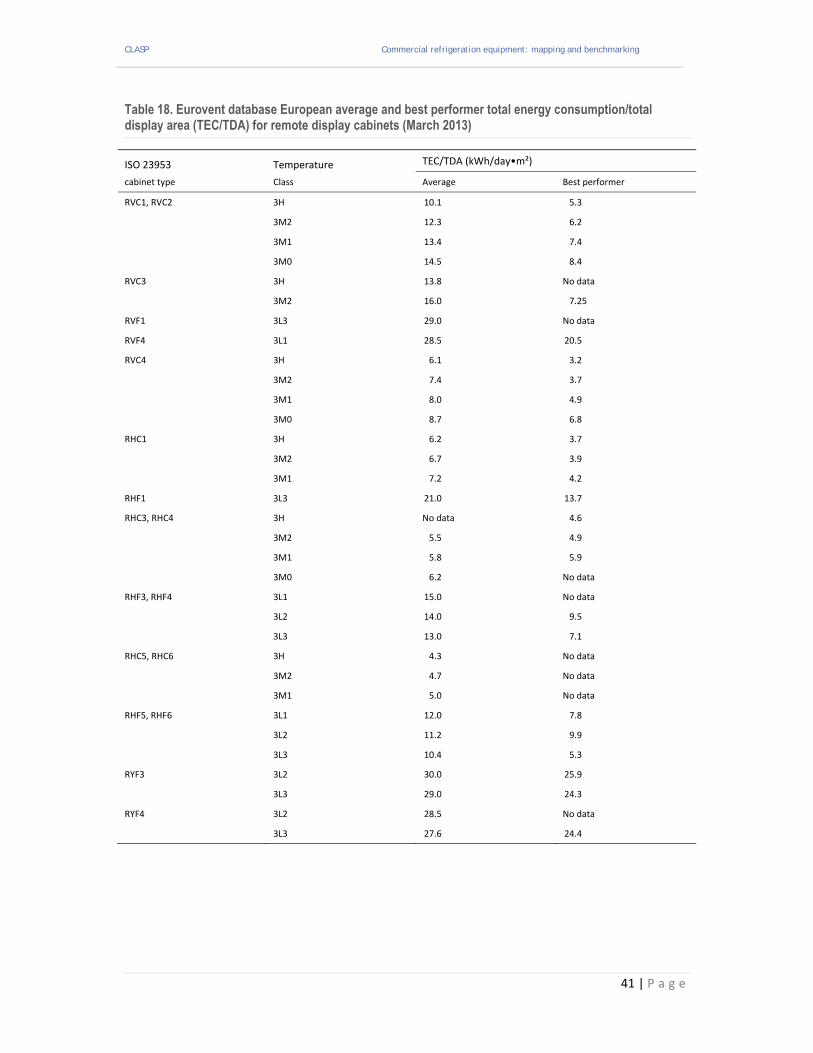
CLASP Commercial refrigeration equipment: mapping and benchmarking
41 | P a g e
Table 18. Eurovent database European average and best performer total energy consumption/total display area (TEC/TDA) for remote display cabinets (March 2013)
ISO 23953 Temperature TEC/TDA (kWh/day•m²)
cabinet type Class Average Best performer
RVC1, RVC2 3H 10.1 5.3
3M2 12.3 6.2
3M1 13.4 7.4
3M0 14.5 8.4
RVC3 3H 13.8 No data
3M2 16.0 7.25
RVF1 3L3 29.0 No data
RVF4 3L1 28.5 20.5
RVC4 3H 6.1 3.2
3M2 7.4 3.7
3M1 8.0 4.9
3M0 8.7 6.8
RHC1 3H 6.2 3.7
3M2 6.7 3.9
3M1 7.2 4.2
RHF1 3L3 21.0 13.7
RHC3, RHC4 3H No data 4.6
3M2 5.5 4.9
3M1 5.8 5.9
3M0 6.2 No data
RHF3, RHF4 3L1 15.0 No data
3L2 14.0 9.5
3L3 13.0 7.1
RHC5, RHC6 3H 4.3 No data
3M2 4.7 No data
3M1 5.0 No data
RHF5, RHF6 3L1 12.0 7.8
3L2 11.2 9.9
3L3 10.4 5.3
RYF3 3L2 30.0 25.9
3L3 29.0 24.3
RYF4 3L2 28.5 No data
3L3 27.6 24.4
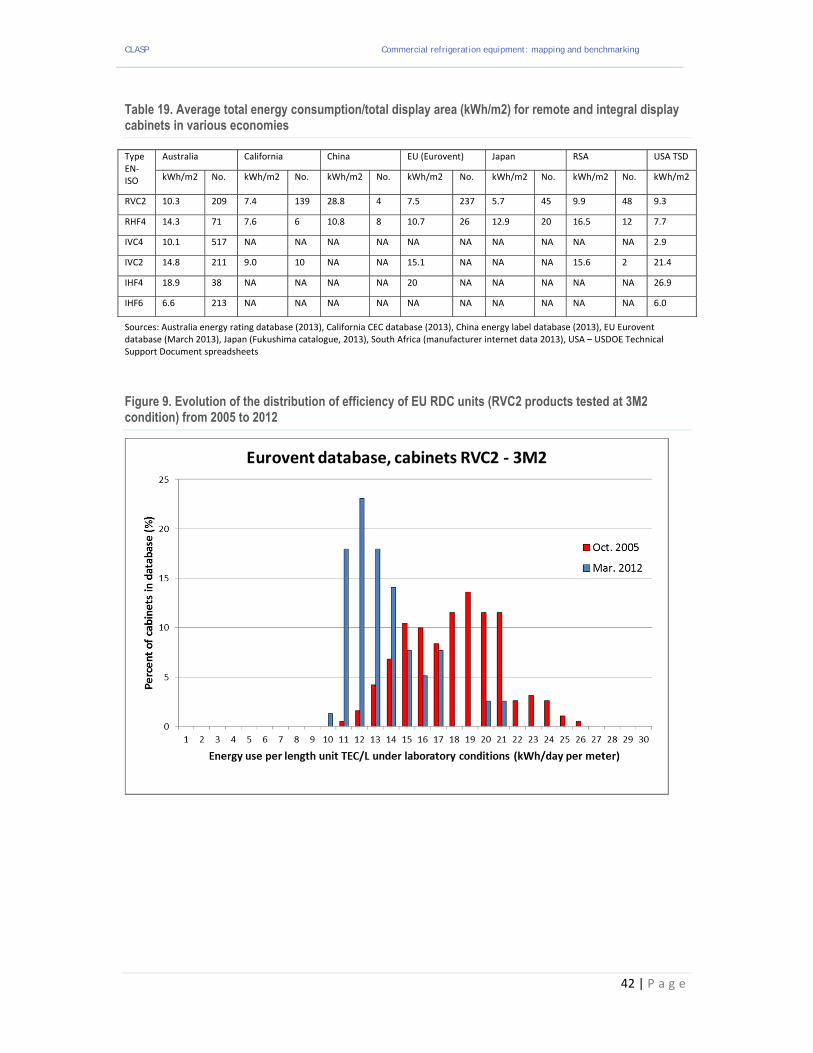
CLASP Commercial refrigeration equipment: mapping and benchmarking
42 | P a g e
Table 19. Average total energy consumption/total display area (kWh/m2) for remote and integral display cabinets in various economies
Type EN‐ISO
Australia California China EU (Eurovent) Japan RSA USA TSD
kWh/m2 No. kWh/m2 No. kWh/m2 No. kWh/m2 No. kWh/m2 No. kWh/m2 No. kWh/m2
RVC2 10.3 209 7.4 139 28.8 4 7.5 237 5.7 45 9.9 48 9.3
RHF4 14.3 71 7.6 6 10.8 8 10.7 26 12.9 20 16.5 12 7.7
IVC4 10.1 517 NA NA NA NA NA NA NA NA NA NA 2.9
IVC2 14.8 211 9.0 10 NA NA 15.1 NA NA NA 15.6 2 21.4
IHF4 18.9 38 NA NA NA NA 20 NA NA NA NA NA 26.9
IHF6 6.6 213 NA NA NA NA NA NA NA NA NA NA 6.0
Sources: Australia energy rating database (2013), California CEC database (2013), China energy label database (2013), EU Eurovent database (March 2013), Japan (Fukushima catalogue, 2013), South Africa (manufacturer internet data 2013), USA – USDOE Technical Support Document spreadsheets
Figure 9. Evolution of the distribution of efficiency of EU RDC units (RVC2 products tested at 3M2 condition) from 2005 to 2012
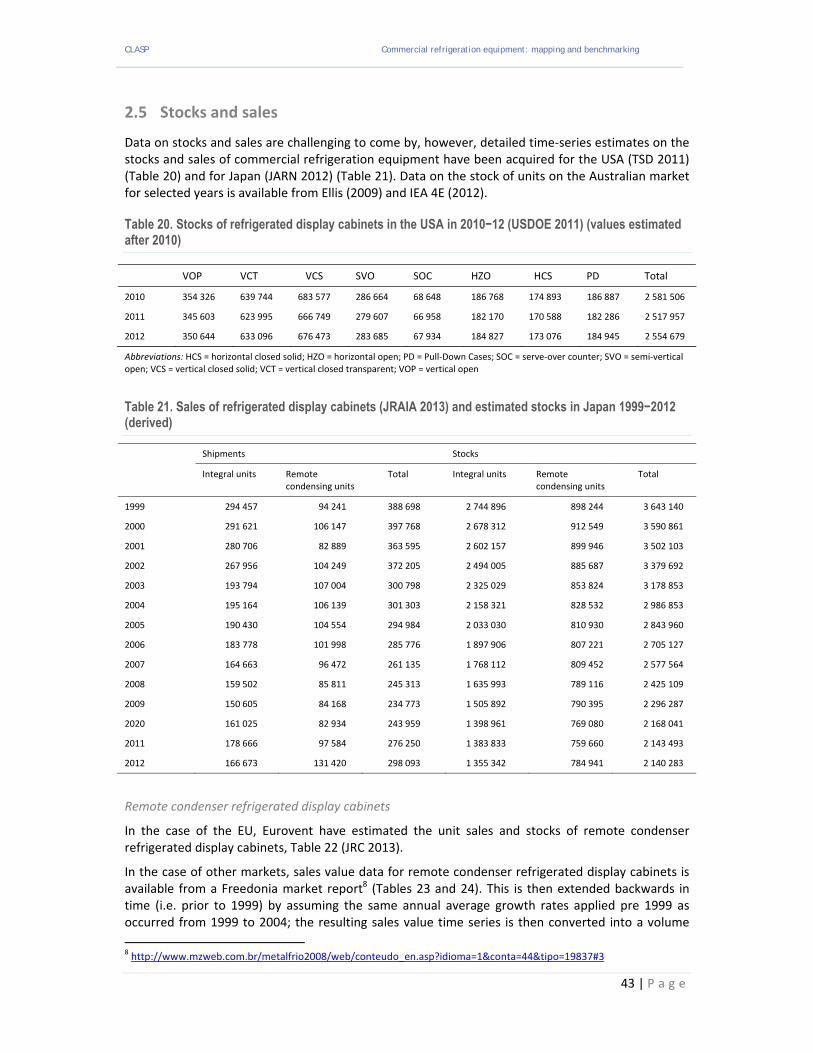
CLASP Commercial refrigeration equipment: mapping and benchmarking
43 | P a g e
2.5 Stocks and sales
Data on stocks and sales are challenging to come by, however, detailed time‐series estimates on the stocks and sales of commercial refrigeration equipment have been acquired for the USA (TSD 2011) (Table 20) and for Japan (JARN 2012) (Table 21). Data on the stock of units on the Australian market for selected years is available from Ellis (2009) and IEA 4E (2012).
Table 20. Stocks of refrigerated display cabinets in the USA in 2010−12 (USDOE 2011) (values estimated after 2010)
VOP VCT VCS SVO SOC HZO HCS PD Total
2010 354 326 639 744 683 577 286 664 68 648 186 768 174 893 186 887 2 581 506
2011 345 603 623 995 666 749 279 607 66 958 182 170 170 588 182 286 2 517 957
2012 350 644 633 096 676 473 283 685 67 934 184 827 173 076 184 945 2 554 679
Abbreviations: HCS = horizontal closed solid; HZO = horizontal open; PD = Pull‐Down Cases; SOC = serve‐over counter; SVO = semi‐vertical open; VCS = vertical closed solid; VCT = vertical closed transparent; VOP = vertical open
Table 21. Sales of refrigerated display cabinets (JRAIA 2013) and estimated stocks in Japan 1999−2012 (derived)
Shipments Stocks
Integral units Remote condensing units
Total Integral units Remote condensing units
Total
1999 294 457 94 241 388 698 2 744 896 898 244 3 643 140
2000 291 621 106 147 397 768 2 678 312 912 549 3 590 861
2001 280 706 82 889 363 595 2 602 157 899 946 3 502 103
2002 267 956 104 249 372 205 2 494 005 885 687 3 379 692
2003 193 794 107 004 300 798 2 325 029 853 824 3 178 853
2004 195 164 106 139 301 303 2 158 321 828 532 2 986 853
2005 190 430 104 554 294 984 2 033 030 810 930 2 843 960
2006 183 778 101 998 285 776 1 897 906 807 221 2 705 127
2007 164 663 96 472 261 135 1 768 112 809 452 2 577 564
2008 159 502 85 811 245 313 1 635 993 789 116 2 425 109
2009 150 605 84 168 234 773 1 505 892 790 395 2 296 287
2020 161 025 82 934 243 959 1 398 961 769 080 2 168 041
2011 178 666 97 584 276 250 1 383 833 759 660 2 143 493
2012 166 673 131 420 298 093 1 355 342 784 941 2 140 283
Remote condenser refrigerated display cabinets
In the case of the EU, Eurovent have estimated the unit sales and stocks of remote condenser refrigerated display cabinets, Table 22 (JRC 2013).
In the case of other markets, sales value data for remote condenser refrigerated display cabinets is available from a Freedonia market report8 (Tables 23 and 24). This is then extended backwards in time (i.e. prior to 1999) by assuming the same annual average growth rates applied pre 1999 as occurred from 1999 to 2004; the resulting sales value time series is then converted into a volume
8 http://www.mzweb.com.br/metalfrio2008/web/conteudo_en.asp?idioma=1&conta=44&tipo=19837#3

CLASP Commercial refrigeration equipment: mapping and benchmarking
44 | P a g e
(i.e. number of units) time series by assuming that the average price and type of refrigerated display cabinet units is the same in each market as in the EU (Table 25). The exception to this is the USA, where the average unit cost is derived from data in the TSD (2011) and applied to derive unit sales estimates. These unit volume sales time series are then converted into an estimate of the stock time series through the application of a simple stock model which assumes the average refrigerated display cabinet product service life is 8 years. This produces the refrigerated display cabinet stock values shown in Table 26.
Table 22. Sales and stocks of remote condenser refrigerated display cabinets in the EU from 2004 to 2010 (JRC 2013)
2004 2005 2006 2007 2008 2009 2010
Average EU‐25 estimations of sales linear extrapolation for 2008‐2010 (Eurovent) 225 884 231 400 239 073 245 255 219 723 224 395 196 488
Estimated EU‐25 stock (Eurovent) 2 032 959 2 082 600 2 151 654 2 207 295 2 266 642 2 325 849 2 385 055
Note: Eurovent is an association of European HVAC and refrigeration equipment manufacturers
Table 23. Sales of remote condenser refrigerated display cabinets worldwide in 1999, 2004 and 2009 by value (Freedonia9)
Sales (US$, millions) Average annual growth rate
1999 2004 2009 1999−2004 2004−2009
USA 700 625 679 −2.2% 1.7%
Canada 65 75 80 2.9% 1.3%
Mexico 200 255 231 5.0% −2.0%
Western Europe 935 1 080 1 150 2.9% 1.3%
Russia 60 80 105 5.9% 5.6%
Other Eastern European countries 100 115 145 2.8% 4.7%
Japan 545 460 420 −3.3% −1.8%
China 45 150 280 27.2% 13.3%
India 40 60 90 8.4% 8.4%
Other Asian countries 350 430 565 4.2% 5.6%
Brazil 90 100 140 2.1% 7.0%
Rest of Latin America 90 102 130 2.5% 5.0%
Turkey 25 30 40 3.7% 5.9%
Rest of Africa/Middle East 115 125 165 1.7% 5.7%
Total 3 360 3 687 4 220 1.9% 2.7%
9 http://www.mzweb.com.br/metalfrio2008/web/conteudo_en.asp?idioma=1&conta=44&tipo=19837#3
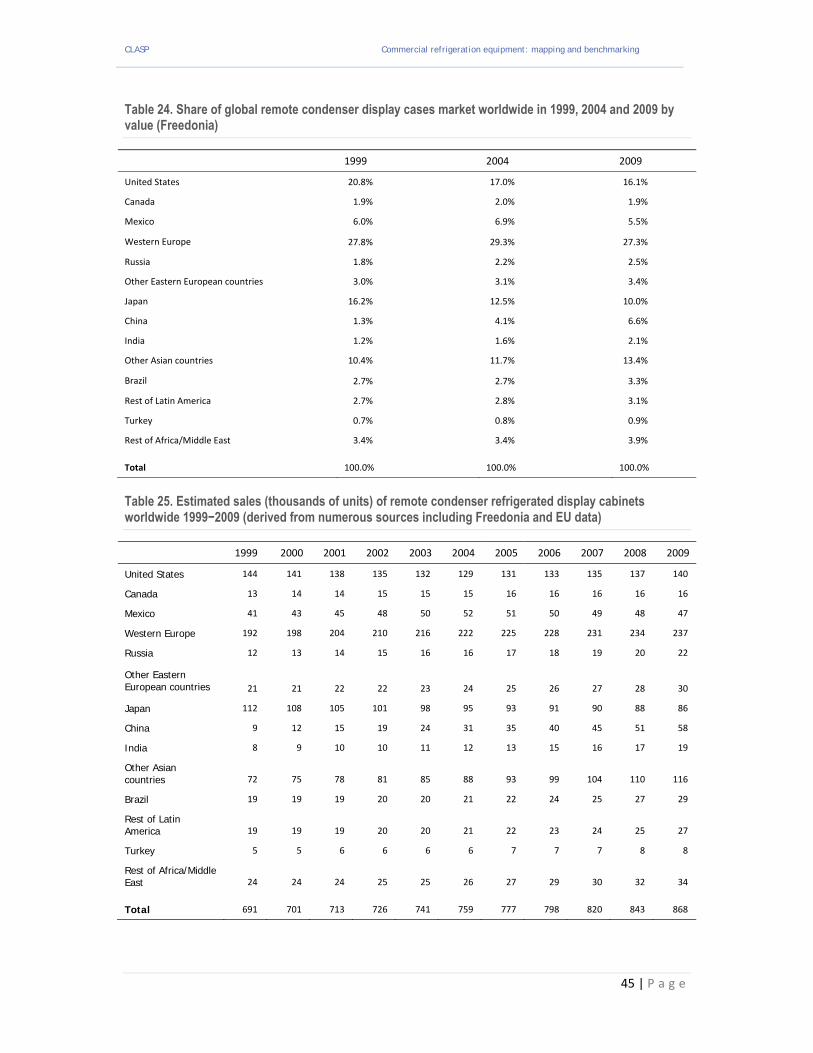
CLASP Commercial refrigeration equipment: mapping and benchmarking
45 | P a g e
Table 24. Share of global remote condenser display cases market worldwide in 1999, 2004 and 2009 by value (Freedonia)
1999 2004 2009
United States 20.8% 17.0% 16.1%
Canada 1.9% 2.0% 1.9%
Mexico 6.0% 6.9% 5.5%
Western Europe 27.8% 29.3% 27.3%
Russia 1.8% 2.2% 2.5%
Other Eastern European countries 3.0% 3.1% 3.4%
Japan 16.2% 12.5% 10.0%
China 1.3% 4.1% 6.6%
India 1.2% 1.6% 2.1%
Other Asian countries 10.4% 11.7% 13.4%
Brazil 2.7% 2.7% 3.3%
Rest of Latin America 2.7% 2.8% 3.1%
Turkey 0.7% 0.8% 0.9%
Rest of Africa/Middle East 3.4% 3.4% 3.9%
Total 100.0% 100.0% 100.0%
Table 25. Estimated sales (thousands of units) of remote condenser refrigerated display cabinets worldwide 1999−2009 (derived from numerous sources including Freedonia and EU data)
1999 2000 2001 2002 2003 2004 2005 2006 2007 2008 2009
United States 144 141 138 135 132 129 131 133 135 137 140
Canada 13 14 14 15 15 15 16 16 16 16 16
Mexico 41 43 45 48 50 52 51 50 49 48 47
Western Europe 192 198 204 210 216 222 225 228 231 234 237
Russia 12 13 14 15 16 16 17 18 19 20 22
Other Eastern European countries 21 21 22 22 23 24 25 26 27 28 30
Japan 112 108 105 101 98 95 93 91 90 88 86
China 9 12 15 19 24 31 35 40 45 51 58
India 8 9 10 10 11 12 13 15 16 17 19
Other Asian countries 72 75 78 81 85 88 93 99 104 110 116
Brazil 19 19 19 20 20 21 22 24 25 27 29
Rest of Latin America 19 19 19 20 20 21 22 23 24 25 27
Turkey 5 5 6 6 6 6 7 7 7 8 8
Rest of Africa/Middle East 24 24 24 25 25 26 27 29 30 32 34
Total 691 701 713 726 741 759 777 798 820 843 868

CLASP Commercial refrigeration equipment: mapping and benchmarking
46 | P a g e
The unit sales estimates derived in Table 25 for remote condenser refrigerated display units can be partially corroborated through comparison of the results with the unit sales values available for the EU (Eurovent), Japan (JRAIA) and the USA (TSD 2011). The results are found to be in good agreement which gives some confidence in the approach. Similarly, the stock estimates in Table 26 can be compared to other estimates for the EU (Eurovent) and the US (TSD 2011) and again seem to be in good agreement. For example, in the case of the EU the results produced by this approach give values that are within 2% of those projected by Eurovent despite being derived from totally different data sources and with a completely different approach.
In addition to this data, comprehensive commercial refrigeration equipment import and export data have been gathered for each of the target economies from the UNCTAD database. From this it is clear the EU and China are the predominant producers and exporters of commercial refrigeration equipment globally.
Table 26. Estimated stock (thousands of units) of remote condenser refrigerated display cabinets worldwide 1999−2009 (derived from numerous sources)
1999 2000 2001 2002 2003 2004 2005 2006 2007 2008 2009
United States 1 214 1 228 1 238 1 242 1 241 1 235 1 229 1 222 1 216 1 209 1 208
Canada 108 111 114 117 121 124 128 131 134 137 139
Mexico 307 323 339 356 373 392 408 421 431 438 442
Western Europe 1 547 1 592 1 639 1 687 1 736 1 787 1 835 1 882 1 925 1 967 2 005
Russia 89 95 100 106 112 119 126 133 141 149 158
Other Eastern European countries 166 171 176 181 186 191 197 203 210 218 227
Japan 970 975 975 971 962 949 933 914 893 869 847
China 38 49 62 79 100 128 158 192 230 271 317
India 55 59 64 70 76 82 89 97 105 114 123
Other Asian countries 553 576 600 625 652 679 709 741 776 814 856
Brazil 153 157 160 163 167 170 175 181 188 196 206
Rest of Latin America 151 155 159 163 167 171 176 182 188 195 203
Turkey 40 42 43 45 46 48 50 52 55 57 60
Rest of Africa/Middle East 199 203 206 210 213 217 221 227 234 243 253
Total 5 591 5 734 5 875 6 014 6 152 6 292 6 434 6 578 6 726 6 878 7 045
There are even less market data available on the share of remote condenser reach‐in coolers by product type. For the purposes of the energy stock modelling reported in section 2.9 the share of product sub‐types assumed in each economy was estimated as follows:
Australia – product shares are assumed to be proportional to the number of products by type in the www.energyrating.gov.au database
EU – assumed to match product sub‐type shares in the Eurovent database
USA – assumed to match product sub‐type shares in the National Impact Analysis (TSD 2011)
Japan – assumed to match the share of product sub‐types in the Fukushima catalogue

CLASP Commercial refrigeration equipment: mapping and benchmarking
47 | P a g e
Brazil, China, India, RSA – assumed to match product sub‐type shares in the EU
Mexico – assumed to match product sub‐type shares in the USA
Some of these assumptions are rather arbitrary but there is a reasonable degree of similarity in the type of products found across all markets and hence using the large product databases as templates for economies where market shares are less well known is a reasonable first approximation. There is also some evidence supporting a link in the product types found in the Brazilian, Chinese, Indian and South African markets with those found in the EU (although the Chinese market also has some product type similarities with the Japanese market) and similarly between the Mexican and US markets.
Integral reach‐in‐coolers
In the case of the EU, Eurovent have estimated the unit sales and stocks of integral refrigerated display cabinets destined for use in supermarkets, Table 27 (JRC 2013).
Table 27. Sales and stocks of integral refrigerated display cabinets destined for supermarkets in the EU from 2004 to 2010 (JRC 2013)
2004 2005 2006 2007 2008 2009 2010
Average EU‐25 estimations of sales linear extrapolation for 2008‐2010 (Eurovent)
144000 154000 165000 176500 189000 202000 216000
Estimated EU‐25 stock (Eurovent) 720000 777000 825000 882500 945000 1010000 1080000
Note: Eurovent are an association of European HVAC and refrigeration equipment manufacturers
Figure 10 shows estimated unit sales shares of integral reach‐in coolers by type in the EU from which it is clear that the values in Table 27 are just 12% of the total shipments by value.
Figure 10. Estimated share of plug-in refrigerated display cabinet sales by product type in the EU Source: BIOS (2007).

CLASP Commercial refrigeration equipment: mapping and benchmarking
48 | P a g e
In the case of other markets, sales value data for integral reach‐in coolers are available from the Freedonia market report10, Table 28. As was done for the remote condenser units, this is then extended backwards in time (i.e. prior to 1999) by assuming the same annual average growth rates applied pre 1999 as occurred from 1999 to 2004; the resulting sales value time series is then converted into a volume (i.e. number of units) time series by assuming that the average price and type of refrigerated display cabinet units is the same in each market as in the EU (Table 29). Again, the USA is treated differently as the average unit cost is derived from data in the TSD (2011) and applied to derive unit sales estimates (note the US and EU average integral reach‐in cooler prices are quite similar). These unit volume sales time series are then converted into an estimate of the stock time series through the application of a simple stock model which assumes the average integral reach‐in cooler service life is 8 years. This produces the integral reach‐in cooler stock values shown in Table 30.
Table 28. Sales of integral reach-in coolers worldwide in 1999, 2004 and 2009 by value (Freedonia11)
Sales (US$, millions) Average annual growth rate
1999 2004 2009 1999−2004 2004−2009
USA 329 352 404 1.4% 2.8%
Canada 31 42 48 6.7% 2.4%
Mexico 184 214 202 3.1% ‐1.1%
Western Europe 501 550 618 1.9% 2.4%
Russia 35 45 55 5.2% 3.9%
Other Eastern European countries 54 59 78 1.8% 5.9%
Japan 320 261 220 ‐4.0% ‐3.4%
China 26 85 147 26.3% 11.5%
India 24 34 47 7.7% 6.7%
Other Asian countries 206 244 296 3.5% 3.9%
Brazil 83 84 123 0.3% 7.9%
Rest of Latin America 83 85 114 0.7% 5.9%
Turkey 15 17 21 3.0% 4.2%
Rest of Africa/Middle East 154 169 193 1.9% 2.7%
Total 2043 2242 2566 1.9% 2.7%
The unit sales estimates derived in Table 29 for integral reach‐in coolers can be partially corroborated through comparison of the results with the unit sales estimates available for the EU (Eurovent), Japan (JRAIA) and the USA (TSD 2011). The results are found to be in good agreement for both Japan and the USA but to produce lower estimated sales than is implied by the Eurovent data for sales to supermarkets converted to whole EU stocks on an assumption that these sales account for 12% of the total. In fact other sources imply the sales volumes projected by the approach set out above are more realistic for the EU so it seems that the 12% to volume sales to supermarkets assumption is more likely to be a 12% by value figure, which would bring the two estimates into line as the average size and price of supermarket destined integral reach‐in coolers is higher than for other market segments.
10 http://www.mzweb.com.br/metalfrio2008/web/conteudo_en.asp?idioma=1&conta=44&tipo=19837#3
11 http://www.mzweb.com.br/metalfrio2008/web/conteudo_en.asp?idioma=1&conta=44&tipo=19837#3
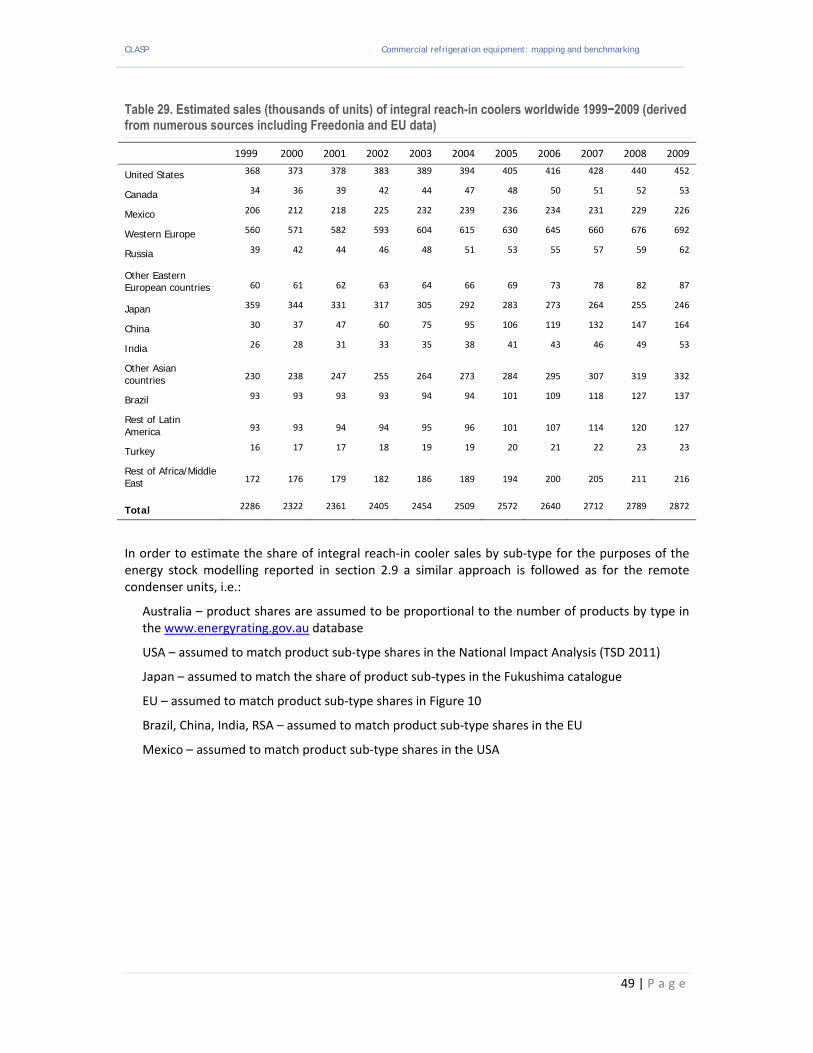
CLASP Commercial refrigeration equipment: mapping and benchmarking
49 | P a g e
Table 29. Estimated sales (thousands of units) of integral reach-in coolers worldwide 1999−2009 (derived from numerous sources including Freedonia and EU data)
1999 2000 2001 2002 2003 2004 2005 2006 2007 2008 2009
United States 368 373 378 383 389 394 405 416 428 440 452
Canada 34 36 39 42 44 47 48 50 51 52 53
Mexico 206 212 218 225 232 239 236 234 231 229 226
Western Europe 560 571 582 593 604 615 630 645 660 676 692
Russia 39 42 44 46 48 51 53 55 57 59 62
Other Eastern European countries 60 61 62 63 64 66 69 73 78 82 87
Japan 359 344 331 317 305 292 283 273 264 255 246
China 30 37 47 60 75 95 106 119 132 147 164
India 26 28 31 33 35 38 41 43 46 49 53
Other Asian countries 230 238 247 255 264 273 284 295 307 319 332
Brazil 93 93 93 93 94 94 101 109 118 127 137
Rest of Latin America 93 93 94 94 95 96 101 107 114 120 127
Turkey 16 17 17 18 19 19 20 21 22 23 23
Rest of Africa/Middle East 172 176 179 182 186 189 194 200 205 211 216
Total 2286 2322 2361 2405 2454 2509 2572 2640 2712 2789 2872
In order to estimate the share of integral reach‐in cooler sales by sub‐type for the purposes of the energy stock modelling reported in section 2.9 a similar approach is followed as for the remote condenser units, i.e.:
Australia – product shares are assumed to be proportional to the number of products by type in the www.energyrating.gov.au database
USA – assumed to match product sub‐type shares in the National Impact Analysis (TSD 2011)
Japan – assumed to match the share of product sub‐types in the Fukushima catalogue
EU – assumed to match product sub‐type shares in Figure 10
Brazil, China, India, RSA – assumed to match product sub‐type shares in the EU
Mexico – assumed to match product sub‐type shares in the USA
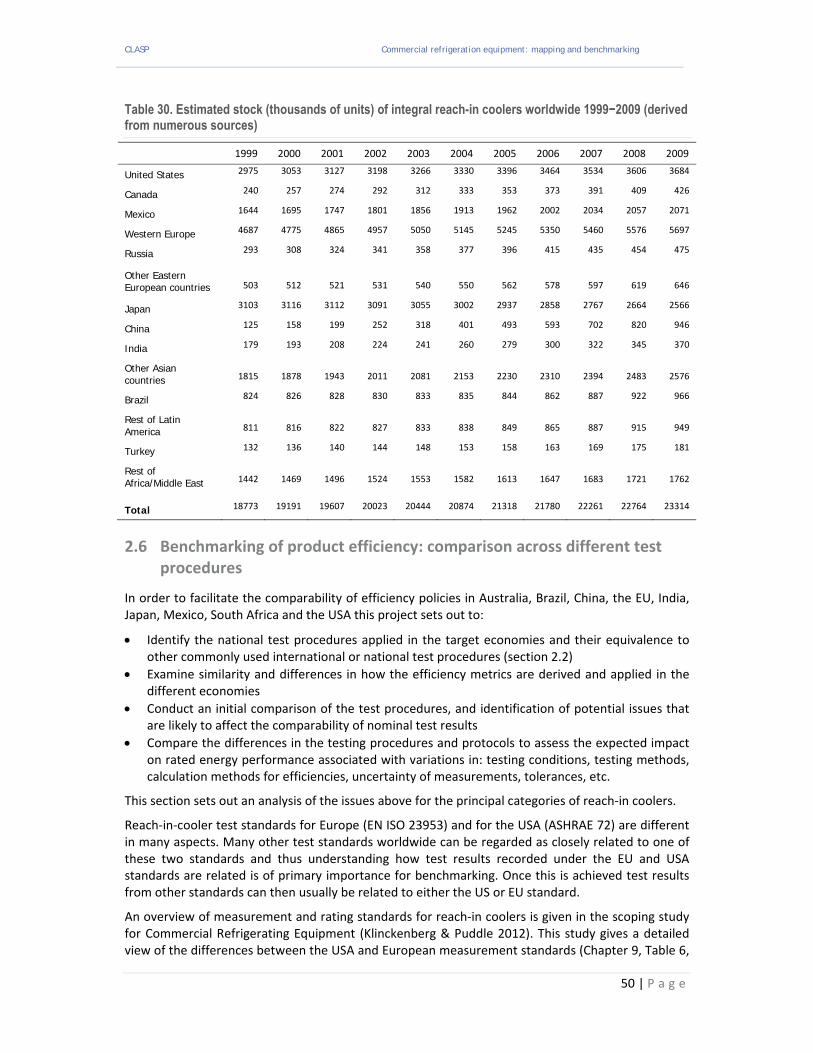
CLASP Commercial refrigeration equipment: mapping and benchmarking
50 | P a g e
Table 30. Estimated stock (thousands of units) of integral reach-in coolers worldwide 1999−2009 (derived from numerous sources)
1999 2000 2001 2002 2003 2004 2005 2006 2007 2008 2009
United States 2975 3053 3127 3198 3266 3330 3396 3464 3534 3606 3684
Canada 240 257 274 292 312 333 353 373 391 409 426
Mexico 1644 1695 1747 1801 1856 1913 1962 2002 2034 2057 2071
Western Europe 4687 4775 4865 4957 5050 5145 5245 5350 5460 5576 5697
Russia 293 308 324 341 358 377 396 415 435 454 475
Other Eastern European countries 503 512 521 531 540 550 562 578 597 619 646
Japan 3103 3116 3112 3091 3055 3002 2937 2858 2767 2664 2566
China 125 158 199 252 318 401 493 593 702 820 946
India 179 193 208 224 241 260 279 300 322 345 370
Other Asian countries 1815 1878 1943 2011 2081 2153 2230 2310 2394 2483 2576
Brazil 824 826 828 830 833 835 844 862 887 922 966
Rest of Latin America 811 816 822 827 833 838 849 865 887 915 949
Turkey 132 136 140 144 148 153 158 163 169 175 181
Rest of Africa/Middle East 1442 1469 1496 1524 1553 1582 1613 1647 1683 1721 1762
Total 18773 19191 19607 20023 20444 20874 21318 21780 22261 22764 23314
2.6 Benchmarking of product efficiency: comparison across different test procedures
In order to facilitate the comparability of efficiency policies in Australia, Brazil, China, the EU, India, Japan, Mexico, South Africa and the USA this project sets out to:
Identify the national test procedures applied in the target economies and their equivalence to other commonly used international or national test procedures (section 2.2)
Examine similarity and differences in how the efficiency metrics are derived and applied in the different economies
Conduct an initial comparison of the test procedures, and identification of potential issues that are likely to affect the comparability of nominal test results
Compare the differences in the testing procedures and protocols to assess the expected impact on rated energy performance associated with variations in: testing conditions, testing methods, calculation methods for efficiencies, uncertainty of measurements, tolerances, etc.
This section sets out an analysis of the issues above for the principal categories of reach‐in coolers.
Reach‐in‐cooler test standards for Europe (EN ISO 23953) and for the USA (ASHRAE 72) are different in many aspects. Many other test standards worldwide can be regarded as closely related to one of these two standards and thus understanding how test results recorded under the EU and USA standards are related is of primary importance for benchmarking. Once this is achieved test results from other standards can then usually be related to either the US or EU standard.
An overview of measurement and rating standards for reach‐in coolers is given in the scoping study for Commercial Refrigerating Equipment (Klinckenberg & Puddle 2012). This study gives a detailed view of the differences between the USA and European measurement standards (Chapter 9, Table 6,
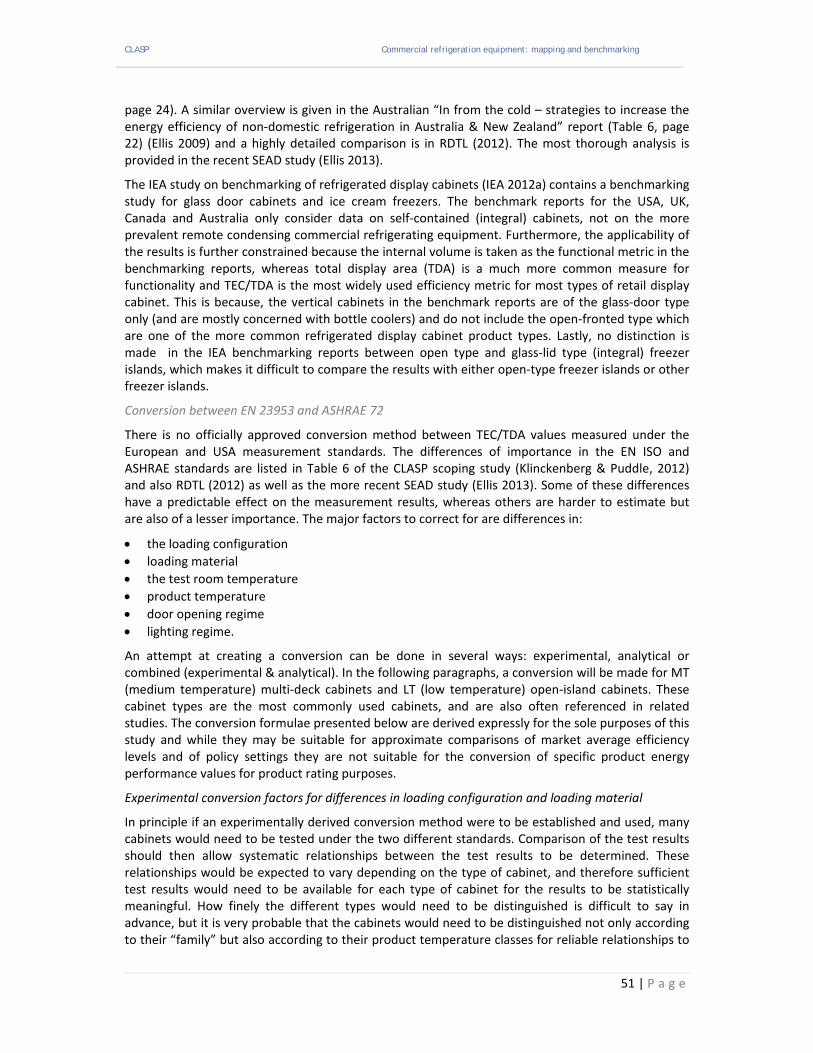
CLASP Commercial refrigeration equipment: mapping and benchmarking
51 | P a g e
page 24). A similar overview is given in the Australian “In from the cold – strategies to increase the energy efficiency of non‐domestic refrigeration in Australia & New Zealand” report (Table 6, page 22) (Ellis 2009) and a highly detailed comparison is in RDTL (2012). The most thorough analysis is provided in the recent SEAD study (Ellis 2013).
The IEA study on benchmarking of refrigerated display cabinets (IEA 2012a) contains a benchmarking study for glass door cabinets and ice cream freezers. The benchmark reports for the USA, UK, Canada and Australia only consider data on self‐contained (integral) cabinets, not on the more prevalent remote condensing commercial refrigerating equipment. Furthermore, the applicability of the results is further constrained because the internal volume is taken as the functional metric in the benchmarking reports, whereas total display area (TDA) is a much more common measure for functionality and TEC/TDA is the most widely used efficiency metric for most types of retail display cabinet. This is because, the vertical cabinets in the benchmark reports are of the glass‐door type only (and are mostly concerned with bottle coolers) and do not include the open‐fronted type which are one of the more common refrigerated display cabinet product types. Lastly, no distinction is made in the IEA benchmarking reports between open type and glass‐lid type (integral) freezer islands, which makes it difficult to compare the results with either open‐type freezer islands or other freezer islands.
Conversion between EN 23953 and ASHRAE 72
There is no officially approved conversion method between TEC/TDA values measured under the European and USA measurement standards. The differences of importance in the EN ISO and ASHRAE standards are listed in Table 6 of the CLASP scoping study (Klinckenberg & Puddle, 2012) and also RDTL (2012) as well as the more recent SEAD study (Ellis 2013). Some of these differences have a predictable effect on the measurement results, whereas others are harder to estimate but are also of a lesser importance. The major factors to correct for are differences in:
the loading configuration
loading material
the test room temperature
product temperature
door opening regime
lighting regime.
An attempt at creating a conversion can be done in several ways: experimental, analytical or combined (experimental & analytical). In the following paragraphs, a conversion will be made for MT (medium temperature) multi‐deck cabinets and LT (low temperature) open‐island cabinets. These cabinet types are the most commonly used cabinets, and are also often referenced in related studies. The conversion formulae presented below are derived expressly for the sole purposes of this study and while they may be suitable for approximate comparisons of market average efficiency levels and of policy settings they are not suitable for the conversion of specific product energy performance values for product rating purposes.
Experimental conversion factors for differences in loading configuration and loading material
In principle if an experimentally derived conversion method were to be established and used, many cabinets would need to be tested under the two different standards. Comparison of the test results should then allow systematic relationships between the test results to be determined. These relationships would be expected to vary depending on the type of cabinet, and therefore sufficient test results would need to be available for each type of cabinet for the results to be statistically meaningful. How finely the different types would need to be distinguished is difficult to say in advance, but it is very probable that the cabinets would need to be distinguished not only according to their “family” but also according to their product temperature classes for reliable relationships to
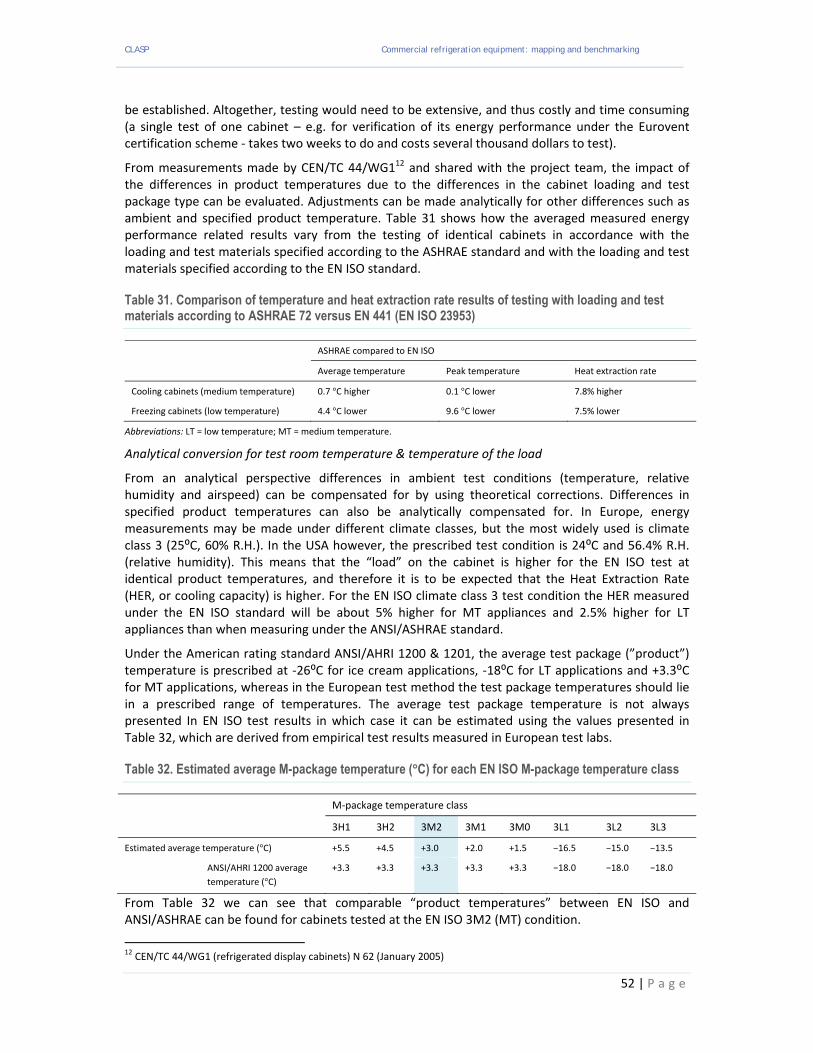
CLASP Commercial refrigeration equipment: mapping and benchmarking
52 | P a g e
be established. Altogether, testing would need to be extensive, and thus costly and time consuming (a single test of one cabinet – e.g. for verification of its energy performance under the Eurovent certification scheme ‐ takes two weeks to do and costs several thousand dollars to test).
From measurements made by CEN/TC 44/WG112 and shared with the project team, the impact of the differences in product temperatures due to the differences in the cabinet loading and test package type can be evaluated. Adjustments can be made analytically for other differences such as ambient and specified product temperature. Table 31 shows how the averaged measured energy performance related results vary from the testing of identical cabinets in accordance with the loading and test materials specified according to the ASHRAE standard and with the loading and test materials specified according to the EN ISO standard.
Table 31. Comparison of temperature and heat extraction rate results of testing with loading and test materials according to ASHRAE 72 versus EN 441 (EN ISO 23953)
ASHRAE compared to EN ISO
Average temperature Peak temperature Heat extraction rate
Cooling cabinets (medium temperature) 0.7 °C higher 0.1 °C lower 7.8% higher
Freezing cabinets (low temperature) 4.4 °C lower 9.6 °C lower 7.5% lower
Abbreviations: LT = low temperature; MT = medium temperature.
Analytical conversion for test room temperature & temperature of the load
From an analytical perspective differences in ambient test conditions (temperature, relative humidity and airspeed) can be compensated for by using theoretical corrections. Differences in specified product temperatures can also be analytically compensated for. In Europe, energy measurements may be made under different climate classes, but the most widely used is climate class 3 (25⁰C, 60% R.H.). In the USA however, the prescribed test condition is 24⁰C and 56.4% R.H. (relative humidity). This means that the “load” on the cabinet is higher for the EN ISO test at identical product temperatures, and therefore it is to be expected that the Heat Extraction Rate (HER, or cooling capacity) is higher. For the EN ISO climate class 3 test condition the HER measured under the EN ISO standard will be about 5% higher for MT appliances and 2.5% higher for LT appliances than when measuring under the ANSI/ASHRAE standard.
Under the American rating standard ANSI/AHRI 1200 & 1201, the average test package (”product”) temperature is prescribed at ‐26⁰C for ice cream applications, ‐18⁰C for LT applications and +3.3⁰C for MT applications, whereas in the European test method the test package temperatures should lie in a prescribed range of temperatures. The average test package temperature is not always presented In EN ISO test results in which case it can be estimated using the values presented in Table 32, which are derived from empirical test results measured in European test labs.
Table 32. Estimated average M-package temperature (°C) for each EN ISO M-package temperature class
M‐package temperature class
3H1 3H2 3M2 3M1 3M0 3L1 3L2 3L3
Estimated average temperature (°C) +5.5 +4.5 +3.0 +2.0 +1.5 −16.5 −15.0 −13.5
ANSI/AHRI 1200 average
temperature (°C) +3.3 +3.3 +3.3 +3.3 +3.3 −18.0 −18.0 −18.0
From Table 32 we can see that comparable “product temperatures” between EN ISO and ANSI/ASHRAE can be found for cabinets tested at the EN ISO 3M2 (MT) condition.
12 CEN/TC 44/WG1 (refrigerated display cabinets) N 62 (January 2005)
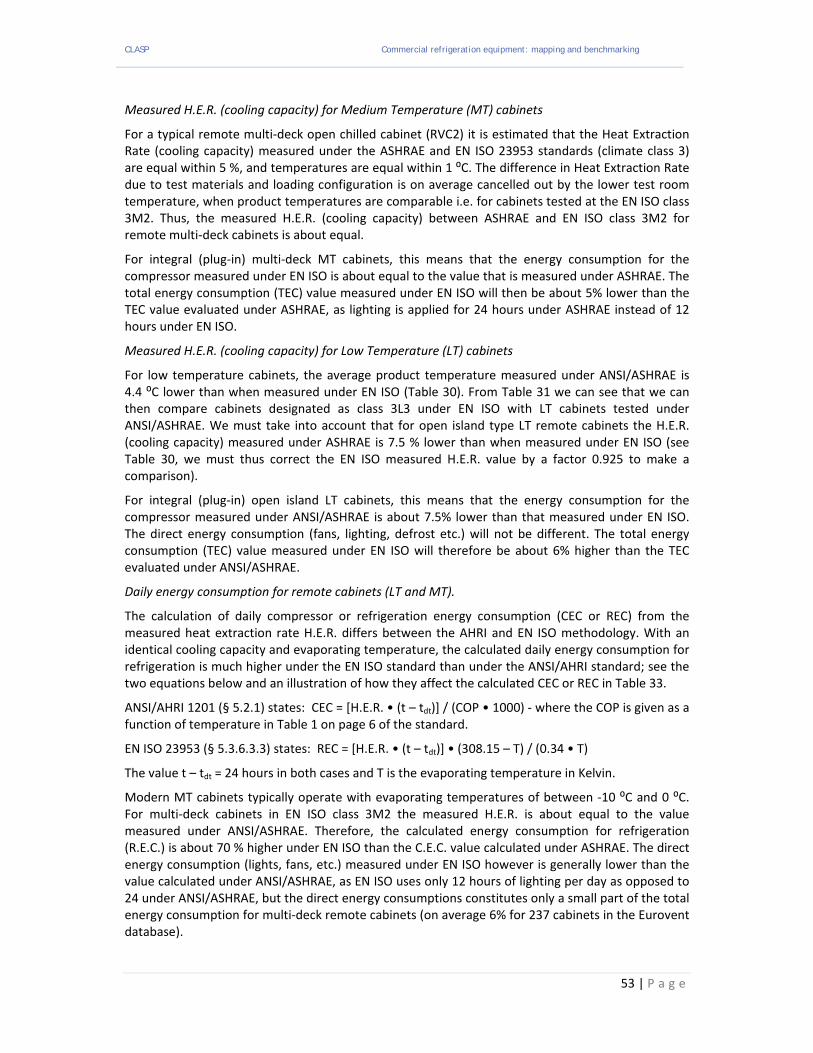
CLASP Commercial refrigeration equipment: mapping and benchmarking
53 | P a g e
Measured H.E.R. (cooling capacity) for Medium Temperature (MT) cabinets
For a typical remote multi‐deck open chilled cabinet (RVC2) it is estimated that the Heat Extraction Rate (cooling capacity) measured under the ASHRAE and EN ISO 23953 standards (climate class 3) are equal within 5 %, and temperatures are equal within 1 ⁰C. The difference in Heat Extraction Rate due to test materials and loading configuration is on average cancelled out by the lower test room temperature, when product temperatures are comparable i.e. for cabinets tested at the EN ISO class 3M2. Thus, the measured H.E.R. (cooling capacity) between ASHRAE and EN ISO class 3M2 for remote multi‐deck cabinets is about equal.
For integral (plug‐in) multi‐deck MT cabinets, this means that the energy consumption for the compressor measured under EN ISO is about equal to the value that is measured under ASHRAE. The total energy consumption (TEC) value measured under EN ISO will then be about 5% lower than the TEC value evaluated under ASHRAE, as lighting is applied for 24 hours under ASHRAE instead of 12 hours under EN ISO.
Measured H.E.R. (cooling capacity) for Low Temperature (LT) cabinets
For low temperature cabinets, the average product temperature measured under ANSI/ASHRAE is 4.4 ⁰C lower than when measured under EN ISO (Table 30). From Table 31 we can see that we can then compare cabinets designated as class 3L3 under EN ISO with LT cabinets tested under ANSI/ASHRAE. We must take into account that for open island type LT remote cabinets the H.E.R. (cooling capacity) measured under ASHRAE is 7.5 % lower than when measured under EN ISO (see Table 30, we must thus correct the EN ISO measured H.E.R. value by a factor 0.925 to make a comparison).
For integral (plug‐in) open island LT cabinets, this means that the energy consumption for the compressor measured under ANSI/ASHRAE is about 7.5% lower than that measured under EN ISO. The direct energy consumption (fans, lighting, defrost etc.) will not be different. The total energy consumption (TEC) value measured under EN ISO will therefore be about 6% higher than the TEC evaluated under ANSI/ASHRAE.
Daily energy consumption for remote cabinets (LT and MT).
The calculation of daily compressor or refrigeration energy consumption (CEC or REC) from the measured heat extraction rate H.E.R. differs between the AHRI and EN ISO methodology. With an identical cooling capacity and evaporating temperature, the calculated daily energy consumption for refrigeration is much higher under the EN ISO standard than under the ANSI/AHRI standard; see the two equations below and an illustration of how they affect the calculated CEC or REC in Table 33.
ANSI/AHRI 1201 (§ 5.2.1) states: CEC = [H.E.R. • (t – tdt)] / (COP • 1000) ‐ where the COP is given as a function of temperature in Table 1 on page 6 of the standard.
EN ISO 23953 (§ 5.3.6.3.3) states: REC = [H.E.R. • (t – tdt)] • (308.15 – T) / (0.34 • T)
The value t – tdt = 24 hours in both cases and T is the evaporating temperature in Kelvin.
Modern MT cabinets typically operate with evaporating temperatures of between ‐10 ⁰C and 0 ⁰C. For multi‐deck cabinets in EN ISO class 3M2 the measured H.E.R. is about equal to the value measured under ANSI/ASHRAE. Therefore, the calculated energy consumption for refrigeration (R.E.C.) is about 70 % higher under EN ISO than the C.E.C. value calculated under ASHRAE. The direct energy consumption (lights, fans, etc.) measured under EN ISO however is generally lower than the value calculated under ANSI/ASHRAE, as EN ISO uses only 12 hours of lighting per day as opposed to 24 under ANSI/ASHRAE, but the direct energy consumptions constitutes only a small part of the total energy consumption for multi‐deck remote cabinets (on average 6% for 237 cabinets in the Eurovent database).

CLASP Commercial refrigeration equipment: mapping and benchmarking
54 | P a g e
Table 33. Estimated REC or CEC values (kWh/day) for identical remote RDC appliances tested at different evaporating temperatures T0 according to ANSI/AHRI 1201 and EN-ISO 23953, at an average cooling capacity or heat extraction rate of 1 kW over 24 hours
CEC (ANSI/AHRI 1201) REC (EN ISO 23953) Difference
T0 = 0°C 5.26 9.04 +72%
T0 = −10°C 7.18 12.07 +68%
T0 = −20°C 9.52 15.34 +61%
T0 = −30°C 12.24 18.87 +54%
Taking the above factors into consideration, the TEC value recorded under EN ISO is 50% ‐ 65% higher than the value under ASHRAE for identical remote multi‐deck cabinets with EN ISO classification 3M2. LT cabinets typically operate at evaporating temperatures of around ‐30 ⁰C. For open‐island remote cabinets in EN ISO class 3L3 the measured H.E.R. is 7.5 % higher than the value measured under ANSI/ASHRAE (Table 30). If the conversion factors in Table 32 are also taken into account the calculated energy consumption for refrigeration (R.E.C.) is about 65 % higher under EN ISO for remote freezer island cabinets classified as 3L3 than the C.E.C. value calculated under ASHRAE.
Although the direct energy consumption (lights, fans, defrost, etc.) constitutes a larger part of the energy consumption (22% on average for 42 remote LT island cabinets in the Eurovent database), the value measured under EN ISO should be about equal to the value calculated under ANSI/ASHRAE. The effect of the 65% higher REC value would therefore result in a 44 % higher TEC value under EN ISO than under the ASHRAE (3L3 classification). When using the average TEC/TDA values defined by Eurovent for 3L3, 3L2 and 3L1 cabinets, we can further deduce that for 3L2 cabinets the EN ISO TEC value would be 55% higher than the ANSI/ASHRAE TEC value and for 3L1 cabinets 66% higher. Thus to summarise the above findings, the TEC value measured under EN ISO will be from 44% (at 3L3) to 66% (at 3L1) higher than the value under ANSI/ASHRAE for identical remote open freezer island cabinets, Table 34. Adjusted (i.e. using the conversion factors in Table 33) comparisons of market average TEC/TDA values are given in Table 35.
Table 34. Estimated relative total energy consumption (TEC) for refrigerated display cabinets (as defined by EN ISO 23953), when tested according to the ASHRAE 72 – ANSI/AHRI 1200 and to the EN ISO 23953 standards*.
Cabinet type EN ISO Compressor Total energy consumption
Classification ASHRAE 72 – ANSI/AHRI 1200 EN ISO 23953
MT open multi‐deck 3M2 Integral 100% 95%
Remote 100% 150−165%
LT open island 3L3 Integral 100% 106%
Remote 100% 144%
3L2 Remote 100% 155%
3L1 Remote 100 % 166 %
Abbreviations: LT = low temperature; MT = medium temperature
*Note, the TEC values measured under the ASHRAE 72 – ANSI/AHRI 1200 values are the reference values and set at 100%.

CLASP Commercial refrigeration equipment: mapping and benchmarking
55 | P a g e
Table 35. Average total energy consumption/total display area (TEC/TDA) for EN ISO (RVC2, 3M2) and American remote medium-temperature multi-deck cabinets when converted to be on a comparable basisa
No. of models TEC/TDA (kWh/day.m2) Comparison of adjusted values to California average
Dataset Average Converted to ASHRAE‐ANSI/AHRI
California database (2013) 140 7.38 7.38 100%
Eurovent database (March 2013) 237 7.46 4.74 64%
Eurovent average TEC/TDA – 40% Unknown 7.38 4.69 63%
Australia MEPS registration database. RS2 unlit
209 10.30 6.51 88%
Australia energy rating database 2013 22 8.22 5.22 71%
South Africa internet data 2013 48 9.88 6.27 85%
a Corrections applied according to the results of and approach used in Table
There is a difference between the American and European/Australian multi‐deck remote cabinets. This is probably due to the fact that for European/Australian cabinets, testing with night blinds is commonplace and leads to a 21% ‐ 25% reduction in TEC13. In the US, open‐front multi‐deck refrigerated display cases are generally not tested with night covers in place and most supermarkets do not use night covers on open cases14.
Integral MT open multi‐deck cabinets
Energy performance results for integral open multi‐deck MT cabinets, including those adjusted for differences in the test procedure, are reported in Table 36. There are only small differences between the European and Australian data sets, but the difference with the US data is remarkable – especially as contrary to the case with the remote cabinets, the American cabinets are far more efficient than the European and Australian cabinets.
Table 36. Average total energy consumption/total display area (TEC/TDA) for EN ISO and American integral medium-temperature multi-deck cabinets (3M2)*.
No. of models TEC/TDA (kWh/day.m2) Comparison of
adjusted values to California average
Data set Average Converted to ASHRAE‐ANSI/AHRI
California database 2013 10 9.03 9.03 100%
Phoenix retail data (UK, 2010) 16 16.89 17.78 197%
Eurovent average TEC/TDA Unknown 15.10 15.90 176%
Australia MEPS register. IVC2 M2 ± 100 15.67 16.49 183%
Australia energy rating 2013 18 15.89 16.73 185%
a Corrections applied according to the results of and approach used in Table
13 Empirical evidence from European test results
14 Email communication from Van Baxter, ORNL, USA
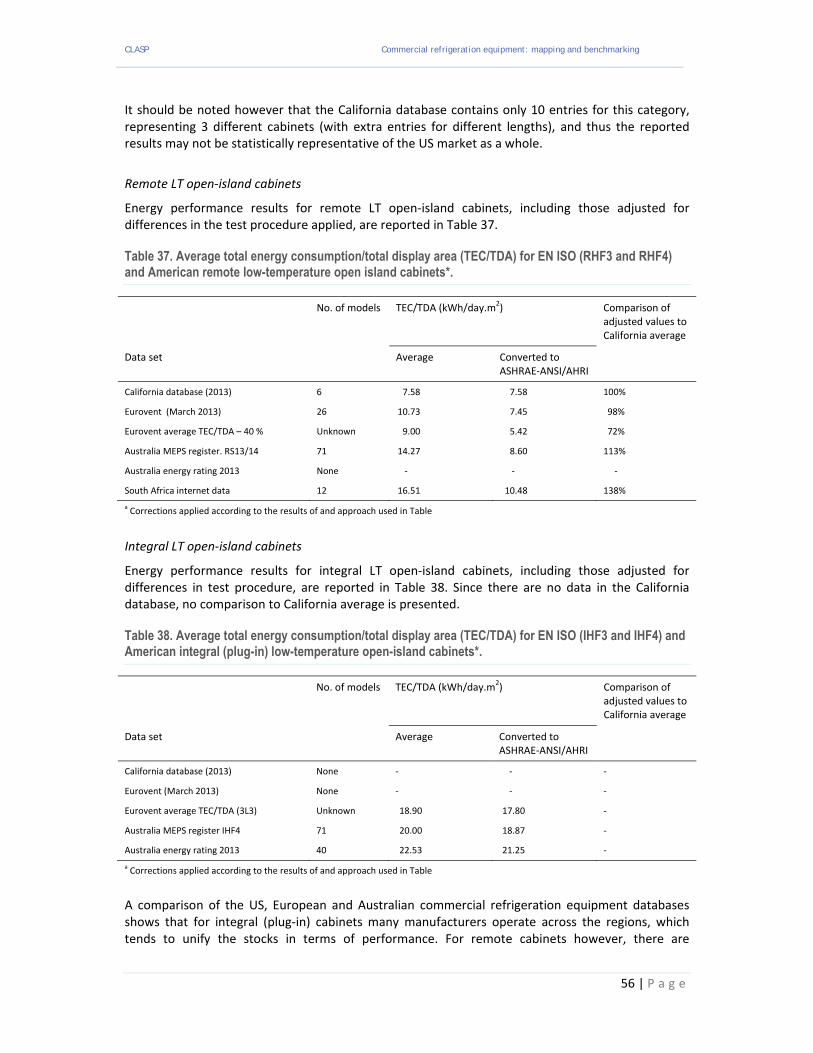
CLASP Commercial refrigeration equipment: mapping and benchmarking
56 | P a g e
It should be noted however that the California database contains only 10 entries for this category, representing 3 different cabinets (with extra entries for different lengths), and thus the reported results may not be statistically representative of the US market as a whole.
Remote LT open‐island cabinets
Energy performance results for remote LT open‐island cabinets, including those adjusted for differences in the test procedure applied, are reported in Table 37.
Table 37. Average total energy consumption/total display area (TEC/TDA) for EN ISO (RHF3 and RHF4) and American remote low-temperature open island cabinets*.
No. of models TEC/TDA (kWh/day.m2) Comparison of adjusted values to California average
Data set Average Converted to ASHRAE‐ANSI/AHRI
California database (2013) 6 7.58 7.58 100%
Eurovent (March 2013) 26 10.73 7.45 98%
Eurovent average TEC/TDA – 40 % Unknown 9.00 5.42 72%
Australia MEPS register. RS13/14 71 14.27 8.60 113%
Australia energy rating 2013 None ‐ ‐ ‐
South Africa internet data 12 16.51 10.48 138%
a Corrections applied according to the results of and approach used in Table
Integral LT open‐island cabinets
Energy performance results for integral LT open‐island cabinets, including those adjusted for differences in test procedure, are reported in Table 38. Since there are no data in the California database, no comparison to California average is presented.
Table 38. Average total energy consumption/total display area (TEC/TDA) for EN ISO (IHF3 and IHF4) and American integral (plug-in) low-temperature open-island cabinets*.
No. of models TEC/TDA (kWh/day.m2) Comparison of adjusted values to California average
Data set Average Converted to ASHRAE‐ANSI/AHRI
California database (2013) None ‐ ‐ ‐
Eurovent (March 2013) None ‐ ‐ ‐
Eurovent average TEC/TDA (3L3) Unknown 18.90 17.80 ‐
Australia MEPS register IHF4 71 20.00 18.87 ‐
Australia energy rating 2013 40 22.53 21.25 ‐
a Corrections applied according to the results of and approach used in Table
A comparison of the US, European and Australian commercial refrigeration equipment databases shows that for integral (plug‐in) cabinets many manufacturers operate across the regions, which tends to unify the stocks in terms of performance. For remote cabinets however, there are

CLASP Commercial refrigeration equipment: mapping and benchmarking
57 | P a g e
manufacturers supplying both the EU and Australian markets, but there is little cross‐over in supply between these regions and the USA. As to regions outside the USA, Europe and Australia, we have to consider that manufacturers in the major economies apply energy efficient parts for the home‐market, but for “export” markets may apply less efficient – cheaper – parts (e.g. Hussmann identifies commercial refrigeration equipment with both export grade and with energy efficient evaporator fans15).
The impact of applying all the above correction factors (as derived in Table 34) on the data presented in Table 19 is shown in Table 39 for the case where all energy consumption values are corrected to be reported under EN‐ISO test conditions. Note, in practice this only requires the USTSD and California data to be adjusted.
Table 39. Average total energy consumption/total display area (kWh/m2) for remote and integral display cabinets in various economies after adjusting all data to be reported under EN-ISO test conditions
Type EN‐ISO
Australia California China EU (Eurovent) Japan RSA USA TSD
kWh/m2 No. kWh/m2 No. kWh/m2 No. kWh/m2 No. kWh/m2 No. kWh/m2 No. kWh/m2
RVC2 10.3 209 11.1 139 28.8 4 7.5 237 5.7 45 9.9 48 14.0
RHF4 14.3 71 12.6 6 10.8 8 10.7 26 12.9 20 16.5 12 12.8
IVC4 10.1 517 NA NA NA NA NA NA NA NA NA NA 2.7
IVC2 14.8 211 8.6 10 NA NA 15.1 NA NA NA 15.6 2 20.4
IHF4 18.9 38 NA NA NA NA 20 NA NA NA NA NA 28.5
IHF6 6.6 213 NA NA NA NA NA NA NA NA NA NA 6.4
Sources: Australia energy rating database (2013), California CEC database (2013) adjusted to EN ISO, China energy label database (2013), EU Eurovent database (March 2013), Japan (Fukushima catalogue, 2013), South Africa (manufacturer internet data 2013), USA – USDOE Technical Support Document spreadsheets adjusted to EN‐ISO.
Conversion between NOM‐022‐ENER/SCFI and ISO EN 23953 or ASHRAE 72
Table 40 shows the results of a similar analytical exercise from comparing results measured under the ISO EN or ANSI/ASHRAE standards with the Mexican NOM‐022‐ENER/SCFI standard. Thus the application of the conversion factors in Table 34 or Table 40 will allow energy performance conversions to be made for all the economies considered in this study as they all use EN ISO, ANSI/ASHRAE or the Mexican test procedure.
Table 40. Energy consumption for cabinet types, estimated under the NOM-022-ENER/SCFI, ASHRAE 72 – ANSI/AHRI 1200 and EN ISO 23953 standards for identical cabinets (without night covers)*.
Cabinet type Classification
(integral only) EN ISO NOM‐022‐ENER/SCFI ASHRAE 72 – ANSI/AHRI 1200
EN ISO 23953
MT forced circulation 3M2 100% 63% 66%
MT cold plate 3H 100% 69% 64%
MT glass door 3M2 100% − −
LT open island 3L1 100% 76% 78%
LT ice cream 3L1 100% 105% 78%
LT glass door 3L1 100% − −
Abbreviations: LT = low temperature; MT = medium temperature.*Values evaluated under NOM‐022‐ENER/SCFI have been designated as reference (100%).
15 Hussmann Data sheet D5X‐E, September 2012.
CLASP Commercial refrigeration equipment: mapping and benchmarking
58 | P a g e
2.7 Higher energy efficiency design options and potential efficiency improvement cost‐benefits
A basic understanding of the physics of refrigerated display cabinets and vending machines is very helpful when trying to identify options for increasing energy efficiency of commercial refrigerating equipment, for reach‐in coolers as well as vending machines.
Reach‐in coolers ‐ background.
The total energy consumption (TEC) for remote reach‐in‐coolers consists of direct energy consumption (DEC) for electrical components such as fans and lighting and the calculated consumption for the production of “cold” used by the cabinet (refrigeration energy consumption, REC), Table 41. Reported energy savings are sometimes expressed in terms of savings in the REC, and sometimes as savings in the TEC, which can lead to confusion.
Table 41. Average contributions to total energy consumption from refrigeration and direct sources (assessed from market data) for open chilled multi-deck cabinets (RVC2) and open freezer islands (RHF4)
Type Refrigeration energy consumption
Direct energy consumption Total energy consumption
RVC2 ± 85% ± 15% 100%
RHF4 ± 60% ± 40% 100%
The demand for coolth (and its associated REC) is driven by the following heat gains into the cabinet:
infiltration of warm air
conduction through the insulation
dissipated heat inside the cabinet (from fans, lights, window heaters and defrosting)
radiation
Table 42, gives an estimate of the importance of these different elements in the total cooling energy required for open chilled multi‐deck cabinets (RVC2) and open freezer islands (RHF4). The elements that are most responsible for cooling energy demand are also those where potential energy saving options will be most effective. Thus it is clear that improving insulation is not a very effective energy saving option in open reach‐in coolers (and subsequently vacuum insulation is not applied in the most efficient cabinets found on the market) whereas it is a viable option for closed cabinets.
Table 42. Heat load distribution for open chilled multi-deck cabinets (RVC2) and open freezer islands (RHF4)*
Type Infiltration Conduction Dissipation Radiation Heat extraction rate
RVC2 ± 78% ± 3% ± 10% ± 9% 100%
RHF4 ± 24% ± 17% ± 16% ± 43% 100%
*(from: Carbon Trust refrigeration roadmap).
The evaporation temperature is another important driver of cooling energy demand and is determined by the size (capacity) of the evaporator (coil). In practical installations, the efficiency of the condensing unit is also important, however this factor is normalised under the measurement and rating standards and so does not affect the relative results they produce.
When considering the impact of design options that produce energy savings in the direct electrical energy consumption (DEC), it should be kept in mind that the impact of these savings on the overall

CLASP Commercial refrigeration equipment: mapping and benchmarking
59 | P a g e
TEC is larger than just the sum of their direct savings. This is because the heat from electrical components is mostly dissipated inside the cabinet and thus additional cooling capacity and energy is needed to extract it. Thus, when the electrical load is reduced, the required cooling capacity (and thus the REC) is also reduced, giving an additional benefit.
Reach‐in coolers – options for increasing energy efficiency.
The most commonly encountered methods in practice of increasing energy efficiency of open reach‐in coolers are glass doors, night covers, high efficiency fans, LED lighting and (in positive temperature cabinets) natural defrost or (in low, i.e. negative, temperature cabinets) defrost ending thermostats.
The EU Lot 12 Ecodesign preparatory study16 presents energy saving options for remote open multi‐deck cabinets and open freezer islands with associated simple payback times (Table 43 and Table 44). It should be noted that the option “liquid suction heat exchanger” is only advantageous with certain refrigerants.
Table 43. EU Ecodesign Lot 12 energy-saving options for remote open multi-deck chiller cabinets (RVC2). Cost estimates relate to a cabinet providing 7.0 m2 total display area1
Abbreviations: ECM = Electronically commutated motor; TEC = total energy consumption. 1 Note, savings and payback times are all compared to a base case model and are not cumulative with successive design options
Table 44. EU Ecodesign Lot 12 energy-saving options for remote open-island freezer cabinets (RHF4). Cost estimates relate to a cabinet providing 7.0 m2 total display area1
16 Preparatory studies for Ecodesign requirements of EUP’s lot 12: commercial refrigerators and freezers
http://www.ecofreezercom.org/

CLASP Commercial refrigeration equipment: mapping and benchmarking
60 | P a g e
Abbreviations: ECM = Electronically commutated motor; TEC = total energy consumption. 1 Note, savings and payback times are all compared to a base case model and are not cumulative with successive design options
Similar options are given in the UK Carbon trust Refrigeration roadmap17, which cover both the cabinets and the condensing units (in the case of remote refrigeration systems), Table 45.
Some of the options mentioned are still in a development phase. Anti‐frost evaporators are one such option – where the term itself does not implicate that no frost forms on the evaporator, but rather that when defrosted, water droplets do not cling to the (hydrophobic) evaporator surface.
Other potential energy savings options have some practical disadvantages. Strip curtains are prone to wear, which decreases visibility, and condensation often occurs on the curtains, which may impair hygiene. Tangential fans produce a small energy saving benefit, but are more difficult to clean than axial fans and thus may lead to unhygienic situations.
The application of glass doors in particular may have an effect on the supermarket operations. Cabinets with glass doors are less easy to refill than open cabinets and also the effort needed in cleaning the cabinets is larger with glass doors than with open cabinets. These costs (to the supermarket operator) are often not considered in the payback time calculations. The belief that glass doors would adversely affect sales, however, has never been proven in practice; whereas the indoor thermal comfort of shoppers increases when glass doors are applied.
17 Carbon Trust Refrigeration Roadmap, UK, March 2010

CLASP Commercial refrigeration equipment: mapping and benchmarking
61 | P a g e
Table 45. Savings options for refrigerated display cabinets reported in the UK Carbon Trust refrigeration roadmap
Option Application RVC2/RHF4 Payback (years)
Air curtain optimisation MT cabinets RVC2 1.1
Anti‐fogging glass LT glass‐door cabinets − 0.4
Anti‐frost evaporators LT cabinets RHF4 2.6
Anti‐sweat heater control LT glass‐door cabinets − 0.6
Air‐flow optimisation back panel MT cabinets RVC2 1.4
Efficient fluorescent lighting All cabinet lights RVC2 1.0
Centrifugal fans All cabinet fans RVC2/RHF4 1.4
Covers Island cabinets RHF4 0.3
Strip curtains MT vertical cabinets RVC2 1.2
Defrost controls LT cabinets RHF4 1.5
Glass doors MT vertical cabinets RVC2 3.7
Dual/triple air curtains MT cabinets RVC2 3.1
DC fans (ECM or PSC) All cabinet fans RVC2/RHF4 0.1
Micro‐channel evaporators MT cabinets RVC2 4.2
LED lighting All cabinet lights RVC2 5.0
Night blinds Vertical cabinets RVC2 1.5
Occupancy sensors for lights All cabinet lights RVC2 2.3
Occupancy sensors doors LT glass‐door cabinets − 0.6
Tangential fans All cabinet fans RVC2/RHF4 4.6
Variable speed drives Integral cabinets − 4.6
Reduce off‐cycle losses Integral cabinets − 0.1
Hydrocarbon refrigerant Integral cabinets − 1.5
Abbreviations: ECM = Electronically commutated motor; LT = low temperature; MT = medium temperature; PSC = Permanent split capacitor.
The USDOE technical support document (TSD)18 on energy efficiency standards for commercial and industrial equipment ‐ provides an engineering analysis in chapter 5 (of the TSD), in which a number of design options to increase the energy efficiency of commercial refrigeration equipment are considered, Table 46.
18 Technical support document energy efficiency standards for commercial and industrial equipment – commercial ice
cream freezers, self‐contained commercial refrigerators, freezers, and refrigerator‐freezers without doors, and remote condensing commercial refrigerators, freezers, and refrigerator‐freezers. Chapter 5: engineering analysis & appendix B. US Department of Energy, August 2008. http://www.regulations.gov/#!documentDetail;D=EERE‐2006‐STD‐0126‐0058
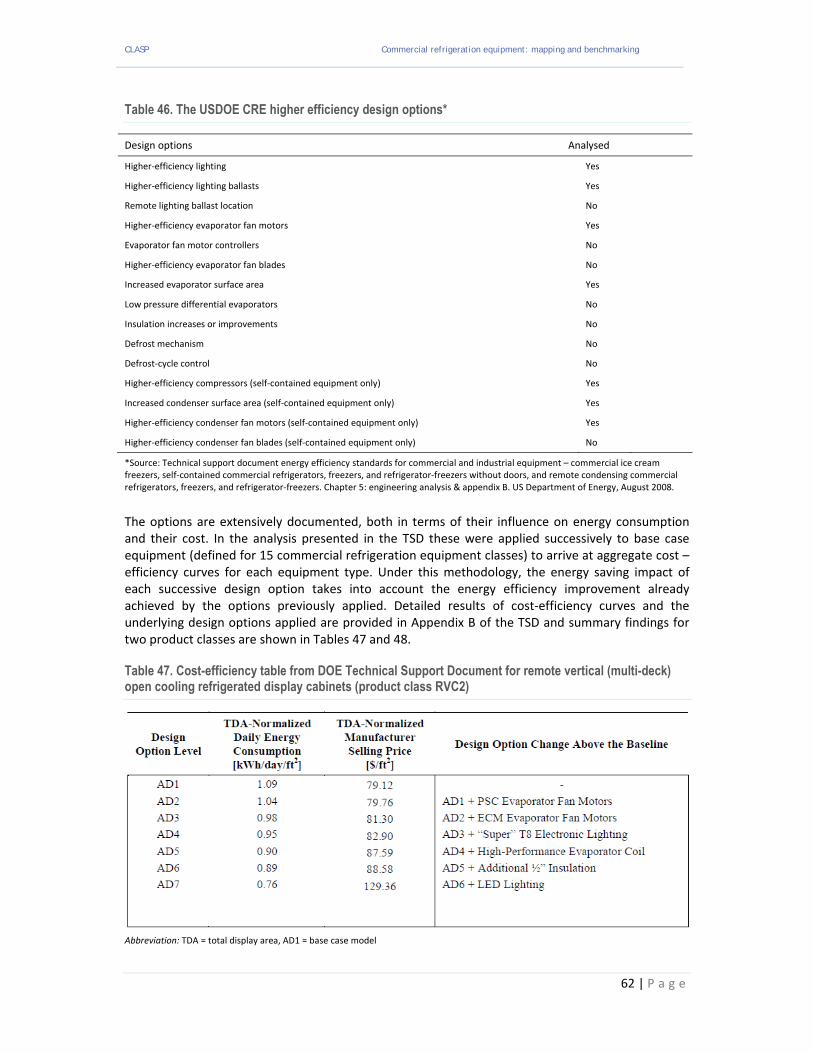
CLASP Commercial refrigeration equipment: mapping and benchmarking
62 | P a g e
Table 46. The USDOE CRE higher efficiency design options*
Design options Analysed
Higher‐efficiency lighting Yes
Higher‐efficiency lighting ballasts Yes
Remote lighting ballast location No
Higher‐efficiency evaporator fan motors Yes
Evaporator fan motor controllers No
Higher‐efficiency evaporator fan blades No
Increased evaporator surface area Yes
Low pressure differential evaporators No
Insulation increases or improvements No
Defrost mechanism No
Defrost‐cycle control No
Higher‐efficiency compressors (self‐contained equipment only) Yes
Increased condenser surface area (self‐contained equipment only) Yes
Higher‐efficiency condenser fan motors (self‐contained equipment only) Yes
Higher‐efficiency condenser fan blades (self‐contained equipment only) No
*Source: Technical support document energy efficiency standards for commercial and industrial equipment – commercial ice cream freezers, self‐contained commercial refrigerators, freezers, and refrigerator‐freezers without doors, and remote condensing commercial refrigerators, freezers, and refrigerator‐freezers. Chapter 5: engineering analysis & appendix B. US Department of Energy, August 2008.
The options are extensively documented, both in terms of their influence on energy consumption and their cost. In the analysis presented in the TSD these were applied successively to base case equipment (defined for 15 commercial refrigeration equipment classes) to arrive at aggregate cost – efficiency curves for each equipment type. Under this methodology, the energy saving impact of each successive design option takes into account the energy efficiency improvement already achieved by the options previously applied. Detailed results of cost‐efficiency curves and the underlying design options applied are provided in Appendix B of the TSD and summary findings for two product classes are shown in Tables 47 and 48.
Table 47. Cost-efficiency table from DOE Technical Support Document for remote vertical (multi-deck) open cooling refrigerated display cabinets (product class RVC2)
Abbreviation: TDA = total display area, AD1 = base case model
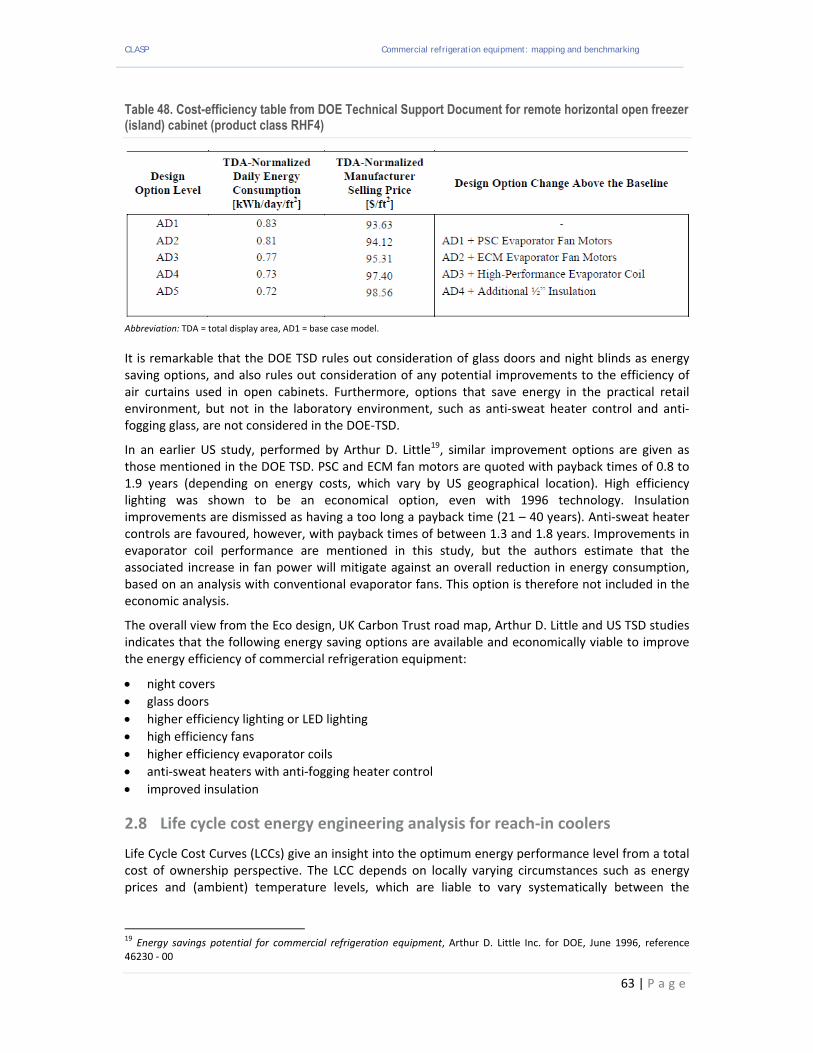
CLASP Commercial refrigeration equipment: mapping and benchmarking
63 | P a g e
Table 48. Cost-efficiency table from DOE Technical Support Document for remote horizontal open freezer (island) cabinet (product class RHF4)
Abbreviation: TDA = total display area, AD1 = base case model.
It is remarkable that the DOE TSD rules out consideration of glass doors and night blinds as energy saving options, and also rules out consideration of any potential improvements to the efficiency of air curtains used in open cabinets. Furthermore, options that save energy in the practical retail environment, but not in the laboratory environment, such as anti‐sweat heater control and anti‐fogging glass, are not considered in the DOE‐TSD.
In an earlier US study, performed by Arthur D. Little19, similar improvement options are given as those mentioned in the DOE TSD. PSC and ECM fan motors are quoted with payback times of 0.8 to 1.9 years (depending on energy costs, which vary by US geographical location). High efficiency lighting was shown to be an economical option, even with 1996 technology. Insulation improvements are dismissed as having a too long a payback time (21 – 40 years). Anti‐sweat heater controls are favoured, however, with payback times of between 1.3 and 1.8 years. Improvements in evaporator coil performance are mentioned in this study, but the authors estimate that the associated increase in fan power will mitigate against an overall reduction in energy consumption, based on an analysis with conventional evaporator fans. This option is therefore not included in the economic analysis.
The overall view from the Eco design, UK Carbon Trust road map, Arthur D. Little and US TSD studies indicates that the following energy saving options are available and economically viable to improve the energy efficiency of commercial refrigeration equipment:
night covers
glass doors
higher efficiency lighting or LED lighting
high efficiency fans
higher efficiency evaporator coils
anti‐sweat heaters with anti‐fogging heater control
improved insulation
2.8 Life cycle cost energy engineering analysis for reach‐in coolers
Life Cycle Cost Curves (LCCs) give an insight into the optimum energy performance level from a total cost of ownership perspective. The LCC depends on locally varying circumstances such as energy prices and (ambient) temperature levels, which are liable to vary systematically between the
19 Energy savings potential for commercial refrigeration equipment, Arthur D. Little Inc. for DOE, June 1996, reference
46230 ‐ 00

CLASP Commercial refrigeration equipment: mapping and benchmarking
64 | P a g e
different economies in this study. These local differences in LCCs may help to explain some of the variation in product energy efficiency observed between the different economies.
An engineering analysis on reach‐in coolers was performed by the US DOE in 2008, and is documented in the DOE technical support document (chapter 5). The spread‐sheets that have been developed by DOE in the framework of that engineering analysis have been made available to the public at http://www.regulations.gov (document EERE‐2006‐STD‐0126‐0080). The techno‐economic analyses in these USDOE spread‐sheets, have been revised (with respect to a number of issues) and rerun for the current analysis. These revised engineering analyses have been done for the six most prevalent reach‐in cooler equipment categories for each economy of interest to the current study.
The first four equipment categories for which these techno‐economic engineering analyses are conducted are the same as those investigated earlier in this study during the comparison of reach‐in cooler energy consumption figures across economies, namely:
VOP‐RC‐M Vertical Open (multi‐deck) medium temperature, remote (EN‐ISO: RVC2)
VOP‐SC‐M Vertical Open (multi‐deck) medium temperature, integral (EN‐ISO: IVC2)
HZO‐RC‐L Horizontal open (island/chest) low temperature, remote (EN‐ISO: RHF4)
HZO‐SC‐L Horizontal open (island/chest) low temperature, integral (EN‐ISO: IHF4)
The other two categories addressed are the same as those considered in the IEA 4E commercial refrigeration equipment benchmarking studies, namely:
HCT‐SC‐I Horizontal ice cream freezer with transparent cover, integral (EN‐ISO: IHF6)
VCT‐SC‐M Vertical glass door medium temperature (bottle cooler), integral (EN‐SO: IVC4)
It should be noted that the integral vertical glass door cabinet (the last category in the list above) is only analysed in its low temperature (ice cream display) configuration in the original USDOE engineering analysis thus the spread‐sheet has been modified in the current analysis to also enable medium temperature products to be studied.
The same material and incremental component costs are assumed in the present study as for the original US DOE analysis, except in the case of LED lighting, where updated (2013) values have been used. This is because while other component/material costs will be little changed from the 2008 levels the LED performance and cost has changed radically. The costs for installation, maintenance and repair used in the present analysis are also copied from the original 2008 values. By contrast, different average energy prices and (ambient) temperature levels are assumed for each economy. In order to be consistent with other recent SEAD studies for air conditioners and refrigerators the electricity tariff values applied are those that were reported for 2009. The only exceptions are for China and India, where we used alternative (more reliable) electricity price data from sources on the internet, Table 49.
Table 49. Electricity price data (2009) used in the revised engineering analysis and for constructing LCC curves.1
Economy
Australia Brazil China EU India Japan Mexico RSA USA
Price (US$/kWh)
0.102 0.180 0.091 0.177 0.056 0.167 0.111 0.066 0.100
1From Cooling the Planet: Opportunities for Deployment of Super‐Efficient Room Air Conditioners http://www.superefficient.org/en/Resources/~/media/Files/SEAD%20Technical%20Analysis%20Reports/SEAD%20Room%20AC%20Analysis/Final%20SEAD%20Room%20AC%20Report.pdf

CLASP Commercial refrigeration equipment: mapping and benchmarking
65 | P a g e
The original DOE engineering analysis was done at the standard condition of 75 ⁰F and 55 % relative humidity and assumed that lighting operated for 24 hours per day. This condition reflects the ASHRAE measurement standard. In addition to doing the revised techno‐economic energy engineering analyses at this condition, two extra conditions are added as follows:
a “European” condition, reflecting the EN‐ISO test standard with ambient test conditions of 25 ⁰C (77 ⁰F) and 60% relative humidity and with 12 hours of lighting per day
a “Store” condition reflecting typical “in store” conditions, with an ambient temperature of 20 ⁰C (68 ⁰F) at 55 % relative humidity and 12 hours of lighting per day
These extra conditions are included to enable results to be compared under EN‐ISO test conditions and under more realistic in situ conditions, Table 50.
Table 50. Conditions used in the revised engineering analysis*.
Condition Ambient Temperature Rel. humidity Case Lighting
DOE (ASHRAE) 75⁰F (23,9 ⁰C) 55 % 24 hr. / 24 hr.
EU (EN-ISO) 77⁰F (25 ⁰C) 60 % 12 hr. / 24 hr.
Store 68⁰F (20 ⁰C) 55 % 12 hr. / 24 hr.
* The DOE condition was used in the original DOE analysis.
The energy saving design options included in the revised engineering analysis are the same as in the original USDOE engineering analysis, except in the case of the multi‐deck cabinets (both remote and integral types). In the case of the multi‐deck cabinets, the energy savings options of night covers and single pane glass doors, which are quite applied in Europe, have both been considered.
Specifically the use of motorised night covers reduces air infiltration during the night time. Based on current knowledge it is assumed that the use of night covers reduces infiltration by some 50 % during this period, leading to an overall energy saving of 20 – 25 %. The costs assumed for motorised night covers are assumed to be €124 per meter (ECN study, the Netherlands, 2012).
Similarly, the use of single pane glass doors reduces air infiltration during both the night time and daytime hours, and their use is assumed to reduce infiltration by 50 %. No additional anti‐sweat heating is necessary when applying these doors to medium temperature (chilled) cabinets. The costs for single pane glass doors are assumed to be € 766 per meter (ECN study, the Netherlands, 2012).
Chest freezers are the first group investigated among the six reach‐in cooler equipment classes for which the revised engineering analyses are performed because they do not contain lighting and hence the influence of ambient temperature and energy prices is illustrated, without the additional impact of different activation times for cabinet lighting. Three categories of chest freezers are investigated:
open horizontal freezer island, remote (RHF4)
open horizontal freezer island, integral (IHF4)
glass lid (ice cream) chest freezer, integral (IHF6)
Open horizontal freezer island, Remote (RHF4)
The Baseline open horizontal freezer island (RHF4) has a TDA of 4.27 m2 and an energy consumption of 38.4 kWh/day at ASHRAE test standard conditions (75 ⁰F, 55 % RH) or 8.99 kWh/m2/day.
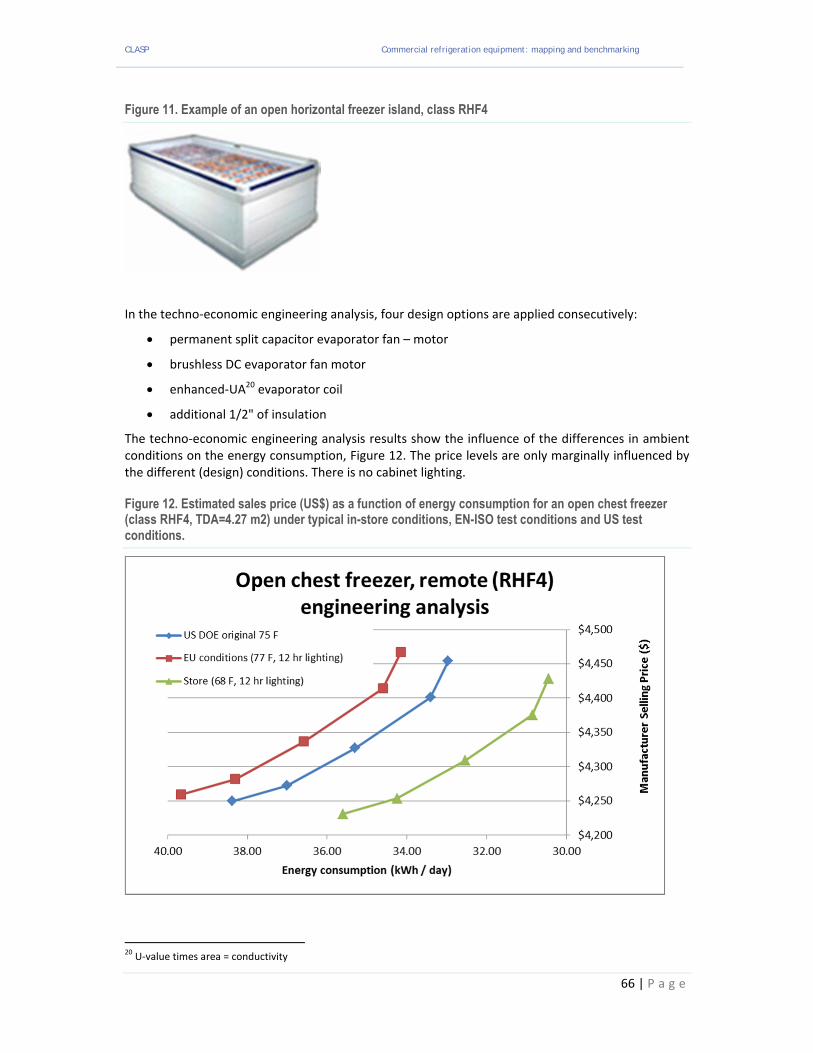
CLASP Commercial refrigeration equipment: mapping and benchmarking
66 | P a g e
Figure 11. Example of an open horizontal freezer island, class RHF4
In the techno‐economic engineering analysis, four design options are applied consecutively:
permanent split capacitor evaporator fan – motor
brushless DC evaporator fan motor
enhanced‐UA20 evaporator coil
additional 1/2" of insulation
The techno‐economic engineering analysis results show the influence of the differences in ambient conditions on the energy consumption, Figure 12. The price levels are only marginally influenced by the different (design) conditions. There is no cabinet lighting.
Figure 12. Estimated sales price (US$) as a function of energy consumption for an open chest freezer (class RHF4, TDA=4.27 m2) under typical in-store conditions, EN-ISO test conditions and US test conditions.
20 U‐value times area = conductivity

CLASP Commercial refrigeration equipment: mapping and benchmarking
67 | P a g e
The condition leading to the highest energy consumption is the International EN‐ISO test standard condition of 25 ⁰C and 60% relative humidity. The “in store” condition of 20 ⁰C (68 ⁰F and 55% relative humidity) leads to the lowest energy consumption (11% lower than at the EN‐ISO condition).
The LCC curves for the different conditions again show the impact on energy consumption of differences in the various ambient conditions, Figure 13. The LCC minimum remains at the same design option level (option 3, enhanced evaporator coil) for all three ambient conditions. At this level the TEC/TDA value is 7.82 kWh/m2/day, under ASHRAE test conditions. This is close to the average of the California database of 7.58 kWh/m2/day (data added in 2012), especially when updated to consider that historically there has been an average efficiency improvement of some 2.5 % per year.
Figure 13. Estimated life cycle costs (US$) as a function of energy consumption for an open chest freezer (class RHF4, TDA=4.27 m2) under typical in-store conditions, EN-ISO test conditions and US test conditions.
Figures 12 and 13 show that an increase in manufacturer selling price of $144 (from $4231 to $4375) would yield annual energy savings of $127 under store conditions, and life cycle savings (discounted at 0% real discount rate over 7 years) of $892.
The LCC curves shown in Figure 13 are determined at the 2009 US average energy price level of 0.10 $/kWh. Information on LCC values at other energy costs, as seen in the various economic regions of interest to this study, is given in Appendix A. From this it is seen that in regions with higher energy prices, the LCC minimum occurs at one design option “up” from the US level, at almost the same TEC/TDA value of 7.71 kWh/m2/day (0.1 kWh/m2/day lower than the US value). Interestingly, this matches with the observed average TEC/TDA value of 7.45 kWh/m2/day in the Eurovent database.
For economies with low energy prices, such as South Africa, the LCC minimum is still at the same level as that for the USA (7.82 kWh/m2/day). Nevertheless the average TEC/TDA value of South African cabinets reported in product data available from the internet is much higher at 10.48 kWh/m2/day, which suggests there is an economically viable energy savings potential.
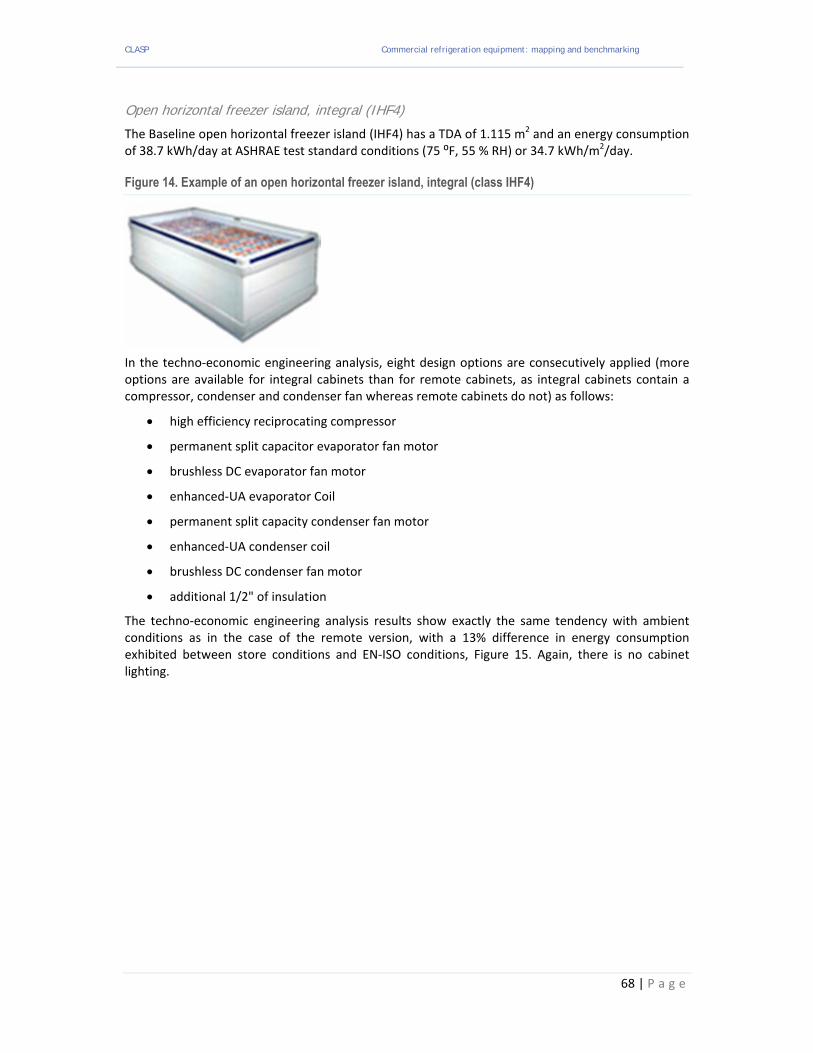
CLASP Commercial refrigeration equipment: mapping and benchmarking
68 | P a g e
Open horizontal freezer island, integral (IHF4)
The Baseline open horizontal freezer island (IHF4) has a TDA of 1.115 m2 and an energy consumption of 38.7 kWh/day at ASHRAE test standard conditions (75 ⁰F, 55 % RH) or 34.7 kWh/m2/day.
Figure 14. Example of an open horizontal freezer island, integral (class IHF4)
In the techno‐economic engineering analysis, eight design options are consecutively applied (more options are available for integral cabinets than for remote cabinets, as integral cabinets contain a compressor, condenser and condenser fan whereas remote cabinets do not) as follows:
high efficiency reciprocating compressor
permanent split capacitor evaporator fan motor
brushless DC evaporator fan motor
enhanced‐UA evaporator Coil
permanent split capacity condenser fan motor
enhanced‐UA condenser coil
brushless DC condenser fan motor
additional 1/2" of insulation
The techno‐economic engineering analysis results show exactly the same tendency with ambient conditions as in the case of the remote version, with a 13% difference in energy consumption exhibited between store conditions and EN‐ISO conditions, Figure 15. Again, there is no cabinet lighting.

CLASP Commercial refrigeration equipment: mapping and benchmarking
69 | P a g e
Figure 15. Estimated sales price (US$) as a function of energy consumption of an open horizontal freezer island (class IHF4, TDA=1.115m2) under typical in-store conditions, EN ISO test conditions and US test conditions.
The LCC curves for the integral open freezer island are shown in Figure 16, where the LCC minimum is again independent of the ambient condition for the same design option (option 6, enhanced evaporator coil in all cases). The corresponding TEC/TDA value is 27.3 kWh/m2/day under ASHRAE test conditions. Unfortunately, no US data are available for this product category.
Figure 16. Estimated life cycle costs (US$) as a function of energy consumption of an open horizontal freezer island (class IHF4. TDA=1.115m2) under typical in-store conditions, EN ISO test conditions and US test conditions.
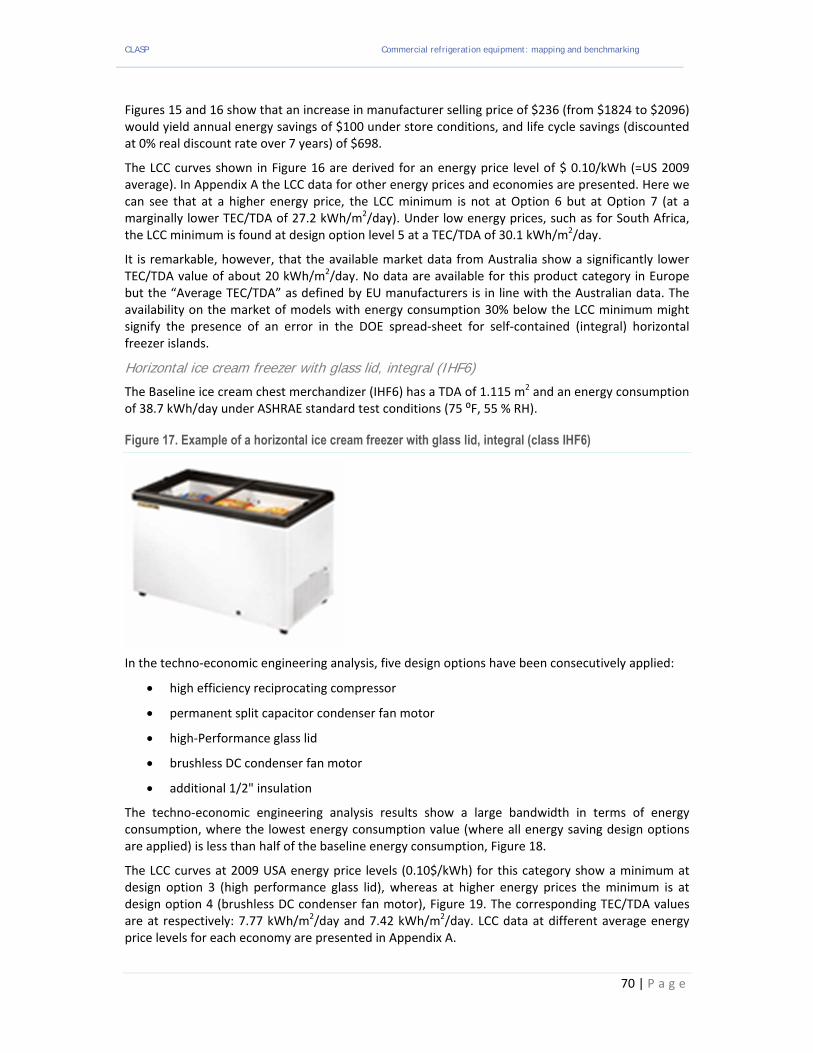
CLASP Commercial refrigeration equipment: mapping and benchmarking
70 | P a g e
Figures 15 and 16 show that an increase in manufacturer selling price of $236 (from $1824 to $2096) would yield annual energy savings of $100 under store conditions, and life cycle savings (discounted at 0% real discount rate over 7 years) of $698.
The LCC curves shown in Figure 16 are derived for an energy price level of $ 0.10/kWh (=US 2009 average). In Appendix A the LCC data for other energy prices and economies are presented. Here we can see that at a higher energy price, the LCC minimum is not at Option 6 but at Option 7 (at a marginally lower TEC/TDA of 27.2 kWh/m2/day). Under low energy prices, such as for South Africa, the LCC minimum is found at design option level 5 at a TEC/TDA of 30.1 kWh/m2/day.
It is remarkable, however, that the available market data from Australia show a significantly lower TEC/TDA value of about 20 kWh/m2/day. No data are available for this product category in Europe but the “Average TEC/TDA” as defined by EU manufacturers is in line with the Australian data. The availability on the market of models with energy consumption 30% below the LCC minimum might signify the presence of an error in the DOE spread‐sheet for self‐contained (integral) horizontal freezer islands.
Horizontal ice cream freezer with glass lid, integral (IHF6)
The Baseline ice cream chest merchandizer (IHF6) has a TDA of 1.115 m2 and an energy consumption of 38.7 kWh/day under ASHRAE standard test conditions (75 ⁰F, 55 % RH).
Figure 17. Example of a horizontal ice cream freezer with glass lid, integral (class IHF6)
In the techno‐economic engineering analysis, five design options have been consecutively applied:
high efficiency reciprocating compressor
permanent split capacitor condenser fan motor
high‐Performance glass lid
brushless DC condenser fan motor
additional 1/2" insulation
The techno‐economic engineering analysis results show a large bandwidth in terms of energy consumption, where the lowest energy consumption value (where all energy saving design options are applied) is less than half of the baseline energy consumption, Figure 18.
The LCC curves at 2009 USA energy price levels (0.10$/kWh) for this category show a minimum at design option 3 (high performance glass lid), whereas at higher energy prices the minimum is at design option 4 (brushless DC condenser fan motor), Figure 19. The corresponding TEC/TDA values are at respectively: 7.77 kWh/m2/day and 7.42 kWh/m2/day. LCC data at different average energy price levels for each economy are presented in Appendix A.

CLASP Commercial refrigeration equipment: mapping and benchmarking
71 | P a g e
Figure 18. Estimated sales price (US$) as a function of energy consumption of a horizontal ice cream freezer with glass lid, integral (class IHF6) under typical in-store conditions, EN ISO and US test conditions.
Figure 19. Estimated life cycle costs (US$) as a function of energy consumption of a horizontal ice cream freezer with glass lid, integral (class IHF6) under typical in-store conditions, EN ISO and US test conditions.

CLASP Commercial refrigeration equipment: mapping and benchmarking
72 | P a g e
Figures 18 and 19 show that an increase in manufacturer selling price of $121 (from $1033 to $1154) would yield annual energy savings of $61 under store conditions, and life cycle savings (discounted at 0% real discount rate over 7 years) of $424.
Energy performance data on glass lid ice cream freezers are available in the IEA 4E benchmarking study on commercial refrigeration equipment. The IEA reports do not use TEC/TDA values as a comparison basis, but energy consumption per unit (storage) volume. The base case gross refrigerated volume is 10.20 ft3, or 289 litres. At the LCC minimum, the energy consumption is 12.8 kWh/m3/day.
An analysis of the US Energy Star data set, reported in the IEA 4E benchmarking study indicates an energy consumption of between 5.18 and 10.0 kWh/m3/day, with an average of 7.24 kWh/m3/day. These values are all considerably below the LCC minimum.
The availability on the market of models with energy consumption far below the LCC minimum might signify an error in the DOE spread‐sheet for integral horizontal freezer islands (just as for open‐top self‐contained freezer islands).
For the California Energy Commission data set, the IEA benchmark study on USA models reports energy consumption values of between 7.17 and 106 kWh/m3/day, with an average volume of 21.59 kWh/m3/day. These values are much higher than in the Energy Star data set, and thus there are grounds to believe that in this case many open freezer islands were present in the IEA 4E data set (category IHF4) as opposed to glass lid ice cream freezers (category IHF6). The IEA 4E reports themselves do not distinguish between open freezer islands and glass lid freezers.
Glass door vertical, cooling (bottle cooler) Integral (IVC4)
The Baseline glass door vertical bottle cooler (IVC4) has a TDA of 2.415 m2 and an energy consumption of 38.12 kWh/day at ASHRAE test standard conditions (75 ⁰F, 55 % RH) or 15.78 kWh/m2/day. The volume is 48 ft3 or 1.36 m3, so energy consumption is 28.0 kWh/m3/day.
Figure 20. Example of a glass door vertical, cooling (bottle cooler) integral unit (class IVC4)
This equipment category was not studied in the original US DOE energy engineering analysis, and therefore a mixture of the “remote” equipment category (which were not studied) and the low temperature self‐contained equipment category (which were studied) are taken as a basis for a new spread‐sheet for this equipment category. In the techno‐economic engineering analysis, ten design options have been consecutively applied:
high efficiency reciprocating compressor
permanent split capacitor evaporator fan motor
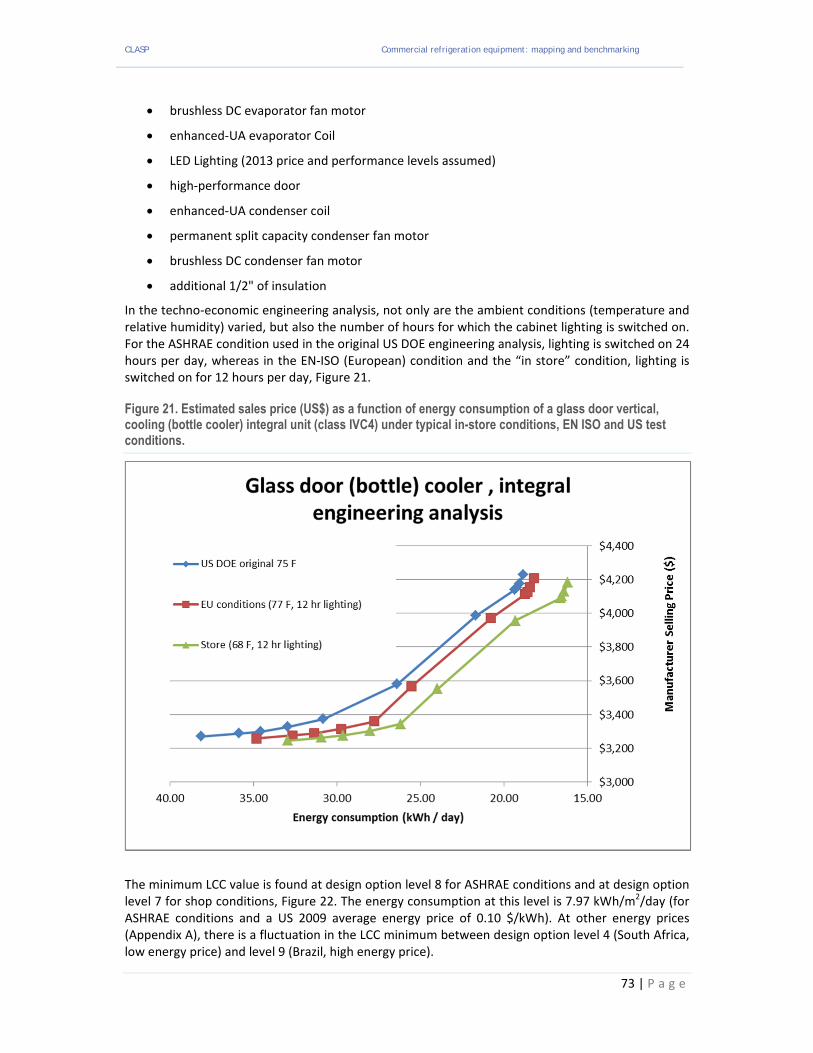
CLASP Commercial refrigeration equipment: mapping and benchmarking
73 | P a g e
brushless DC evaporator fan motor
enhanced‐UA evaporator Coil
LED Lighting (2013 price and performance levels assumed)
high‐performance door
enhanced‐UA condenser coil
permanent split capacity condenser fan motor
brushless DC condenser fan motor
additional 1/2" of insulation
In the techno‐economic engineering analysis, not only are the ambient conditions (temperature and relative humidity) varied, but also the number of hours for which the cabinet lighting is switched on. For the ASHRAE condition used in the original US DOE engineering analysis, lighting is switched on 24 hours per day, whereas in the EN‐ISO (European) condition and the “in store” condition, lighting is switched on for 12 hours per day, Figure 21.
Figure 21. Estimated sales price (US$) as a function of energy consumption of a glass door vertical, cooling (bottle cooler) integral unit (class IVC4) under typical in-store conditions, EN ISO and US test conditions.
The minimum LCC value is found at design option level 8 for ASHRAE conditions and at design option level 7 for shop conditions, Figure 22. The energy consumption at this level is 7.97 kWh/m2/day (for ASHRAE conditions and a US 2009 average energy price of 0.10 $/kWh). At other energy prices (Appendix A), there is a fluctuation in the LCC minimum between design option level 4 (South Africa, low energy price) and level 9 (Brazil, high energy price).

CLASP Commercial refrigeration equipment: mapping and benchmarking
74 | P a g e
Figure 22. Estimated life cycle cost (US$) as a function of energy consumption of a glass door vertical, cooling (bottle cooler) integral unit (class IVC4) under typical in-store conditions, EN ISO and US test conditions.
Energy performance data on glass door vertical bottle coolers are available in the IEA 4E benchmarking study on commercial refrigeration equipment. The IEA reports do not use TEC/TDA values as a comparison basis, but energy consumption per unit (storage) volume. The base case gross refrigerated volume is 48 ft3, or 1.36 m3. At the LCC minimum, the energy consumption is 28.0 kWh/m3/day, which is equivalent to a TEC/TDA of 7.97 kWh/m2/day.
Figures 21 and 22 show that an increase in manufacturer selling price of $844 (from $3245 to $4089) would yield annual energy savings of $286 under store conditions, and life cycle savings (discounted at 0% real discount rate over 7 years) of $2005.
For the US Energy Star data set, the IEA 4E benchmarking study reports energy consumption values of between 2.61 and 60.0 kWh/m3/day, with an average of 8.23 kWh/m3/day. The difference between the highest and lowest energy consumption values is extreme and unrealistic. The data reported on the California Energy Commission data set have the same characteristics; a minimum consumption of 3.08 kWh/m3/day and a maximum consumption of 56.7 kWh/m3/day, with an average of 8.20 kWh/m3/day.
In this case, at the LCC minimum the TEC/TDA value is 7.97 kWh/m2/day, which is in line with the average TEC/TDA value as defined by European manufacturers for this equipment class (7.5 kWh/m2/day). This gives credibility to the idea that the calculated LCC minimum is correct, and the (average) values mentioned in the IEA 4E study are questionable.
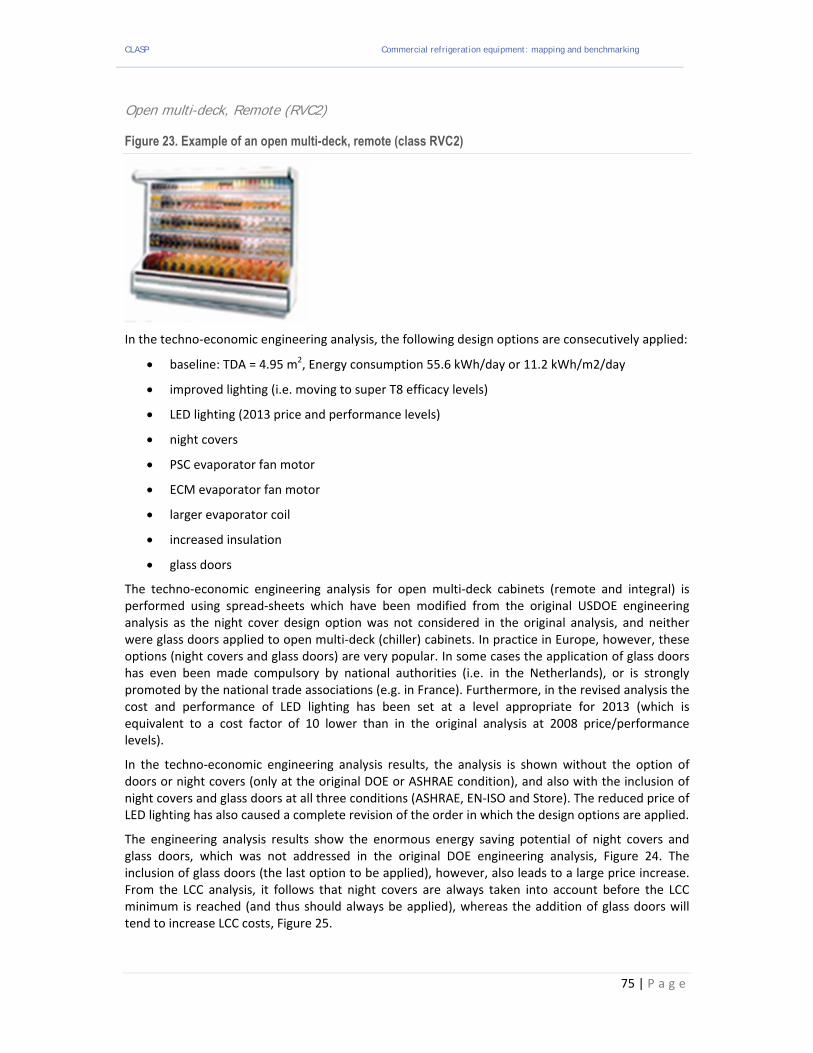
CLASP Commercial refrigeration equipment: mapping and benchmarking
75 | P a g e
Open multi-deck, Remote (RVC2)
Figure 23. Example of an open multi-deck, remote (class RVC2)
In the techno‐economic engineering analysis, the following design options are consecutively applied:
baseline: TDA = 4.95 m2, Energy consumption 55.6 kWh/day or 11.2 kWh/m2/day
improved lighting (i.e. moving to super T8 efficacy levels)
LED lighting (2013 price and performance levels)
night covers
PSC evaporator fan motor
ECM evaporator fan motor
larger evaporator coil
increased insulation
glass doors
The techno‐economic engineering analysis for open multi‐deck cabinets (remote and integral) is performed using spread‐sheets which have been modified from the original USDOE engineering analysis as the night cover design option was not considered in the original analysis, and neither were glass doors applied to open multi‐deck (chiller) cabinets. In practice in Europe, however, these options (night covers and glass doors) are very popular. In some cases the application of glass doors has even been made compulsory by national authorities (i.e. in the Netherlands), or is strongly promoted by the national trade associations (e.g. in France). Furthermore, in the revised analysis the cost and performance of LED lighting has been set at a level appropriate for 2013 (which is equivalent to a cost factor of 10 lower than in the original analysis at 2008 price/performance levels).
In the techno‐economic engineering analysis results, the analysis is shown without the option of doors or night covers (only at the original DOE or ASHRAE condition), and also with the inclusion of night covers and glass doors at all three conditions (ASHRAE, EN‐ISO and Store). The reduced price of LED lighting has also caused a complete revision of the order in which the design options are applied.
The engineering analysis results show the enormous energy saving potential of night covers and glass doors, which was not addressed in the original DOE engineering analysis, Figure 24. The inclusion of glass doors (the last option to be applied), however, also leads to a large price increase. From the LCC analysis, it follows that night covers are always taken into account before the LCC minimum is reached (and thus should always be applied), whereas the addition of glass doors will tend to increase LCC costs, Figure 25.

CLASP Commercial refrigeration equipment: mapping and benchmarking
76 | P a g e
Figure 24. Estimated sales price (US$) as a function of energy consumption of an open multi-deck, remote (class RVC2) under typical in-store conditions, EN ISO and US test conditions.
Figure 25. Estimated life cycle cost (US$) as a function of energy consumption of an open multi-deck, remote (class RVC2) under typical in-store conditions, EN ISO and US test conditions.
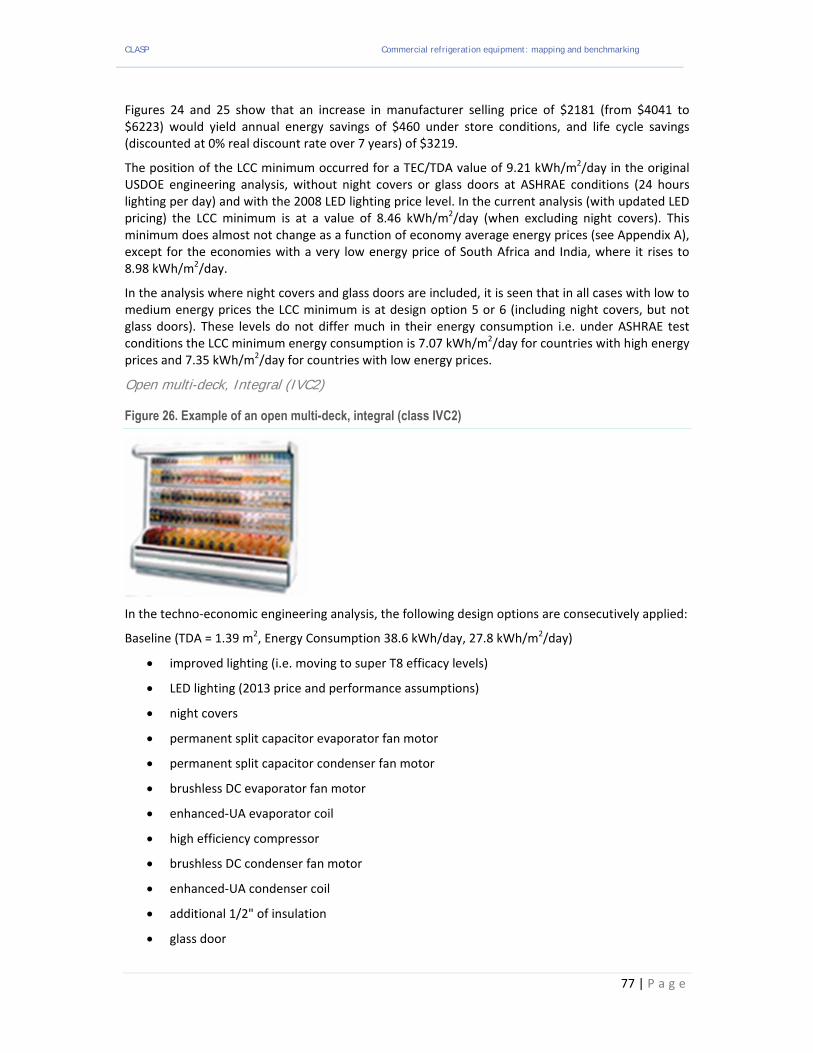
CLASP Commercial refrigeration equipment: mapping and benchmarking
77 | P a g e
Figures 24 and 25 show that an increase in manufacturer selling price of $2181 (from $4041 to $6223) would yield annual energy savings of $460 under store conditions, and life cycle savings (discounted at 0% real discount rate over 7 years) of $3219.
The position of the LCC minimum occurred for a TEC/TDA value of 9.21 kWh/m2/day in the original USDOE engineering analysis, without night covers or glass doors at ASHRAE conditions (24 hours lighting per day) and with the 2008 LED lighting price level. In the current analysis (with updated LED pricing) the LCC minimum is at a value of 8.46 kWh/m2/day (when excluding night covers). This minimum does almost not change as a function of economy average energy prices (see Appendix A), except for the economies with a very low energy price of South Africa and India, where it rises to 8.98 kWh/m2/day.
In the analysis where night covers and glass doors are included, it is seen that in all cases with low to medium energy prices the LCC minimum is at design option 5 or 6 (including night covers, but not glass doors). These levels do not differ much in their energy consumption i.e. under ASHRAE test conditions the LCC minimum energy consumption is 7.07 kWh/m2/day for countries with high energy prices and 7.35 kWh/m2/day for countries with low energy prices.
Open multi-deck, Integral (IVC2)
Figure 26. Example of an open multi-deck, integral (class IVC2)
In the techno‐economic engineering analysis, the following design options are consecutively applied:
Baseline (TDA = 1.39 m2, Energy Consumption 38.6 kWh/day, 27.8 kWh/m2/day)
improved lighting (i.e. moving to super T8 efficacy levels)
LED lighting (2013 price and performance assumptions)
night covers
permanent split capacitor evaporator fan motor
permanent split capacitor condenser fan motor
brushless DC evaporator fan motor
enhanced‐UA evaporator coil
high efficiency compressor
brushless DC condenser fan motor
enhanced‐UA condenser coil
additional 1/2" of insulation
glass door

CLASP Commercial refrigeration equipment: mapping and benchmarking
78 | P a g e
For the Integral (self‐contained) multi‐deck cabinet, the situation is similar to the case of the remote multi‐deck cabinets. Here again the economically optimum order of deployment for the design options changes as price and performance of LED lighting is set to the 2013 level, Figure 27.
Figure 27. Estimated sales price (US$) as a function of energy consumption of an open multi-deck, integral (class IVC2) under typical in-store conditions, EN ISO and US test conditions.
Figures 27 and 28 show that an increase in manufacturer selling price of $727 (from $2065 to $2793) would yield annual energy savings of $256 under store conditions, and life cycle savings (discounted at 0% real discount rate over 7 years) of $1795.
The LCC minima only differ considerably between the original DOE analysis without night covers or glass doors (TEC/TDA at 22.52 kWh/m2/day) and the analysis with night covers and glass doors (TEC/TDA at 17.97 kWh/m2/day), Figure 28. This difference is due to the application of night covers, which save 25 % on average cooling load.
It is remarkable that with the IVC2 cabinet (contrary to the RVC2 cabinet), glass doors become a valid option in regions with a high energy price (EU, Japan, Brazil) – see appendix A for LCC results per region.
The California database shows an average TEC/TDA value for integral cooled multi‐deck cabinets of 9.03 kWh/m2/day – which is most probably an artifact due to erroneous data. Other data sources (EU, UK, Australia) shows average TEC/TDA values in the range of 15 to 17 kWh/m2/day, which is more in line with the calculated LCC minimum.
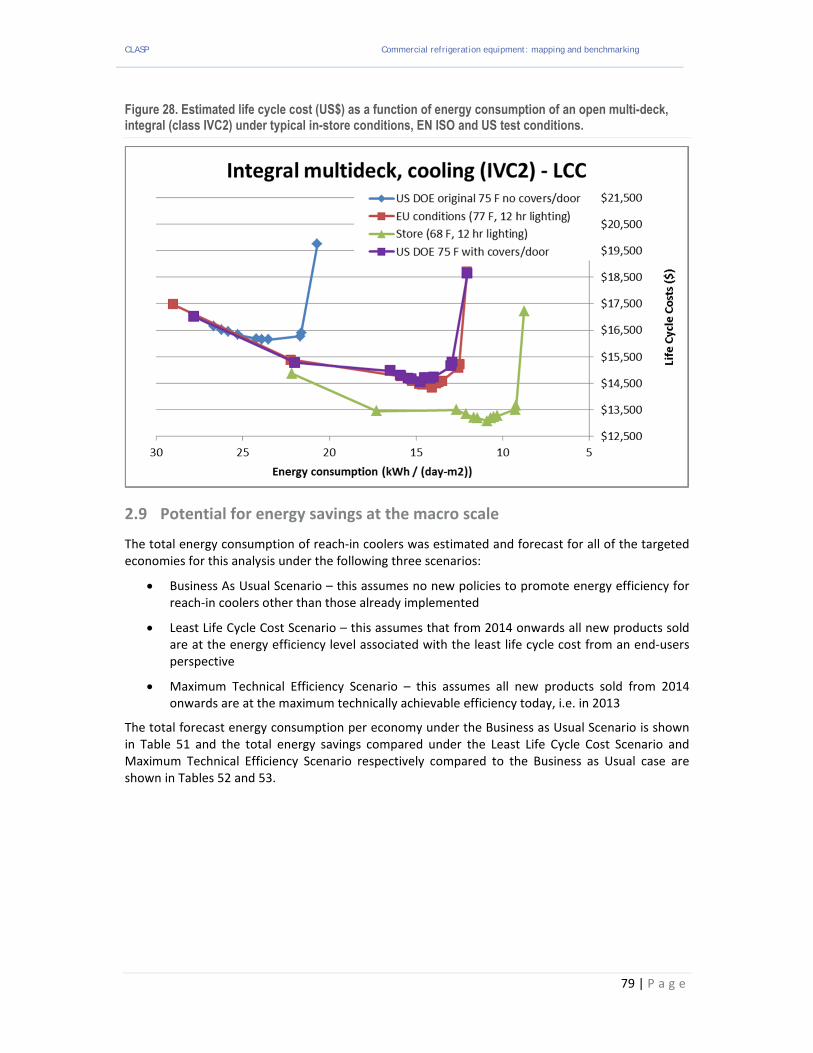
CLASP Commercial refrigeration equipment: mapping and benchmarking
79 | P a g e
Figure 28. Estimated life cycle cost (US$) as a function of energy consumption of an open multi-deck, integral (class IVC2) under typical in-store conditions, EN ISO and US test conditions.
2.9 Potential for energy savings at the macro scale
The total energy consumption of reach‐in coolers was estimated and forecast for all of the targeted economies for this analysis under the following three scenarios:
Business As Usual Scenario – this assumes no new policies to promote energy efficiency for reach‐in coolers other than those already implemented
Least Life Cycle Cost Scenario – this assumes that from 2014 onwards all new products sold are at the energy efficiency level associated with the least life cycle cost from an end‐users perspective
Maximum Technical Efficiency Scenario – this assumes all new products sold from 2014 onwards are at the maximum technically achievable efficiency today, i.e. in 2013
The total forecast energy consumption per economy under the Business as Usual Scenario is shown in Table 51 and the total energy savings compared under the Least Life Cycle Cost Scenario and Maximum Technical Efficiency Scenario respectively compared to the Business as Usual case are shown in Tables 52 and 53.

CLASP Commercial refrigeration equipment: mapping and benchmarking
80 | P a g e
Table 51. Estimated electricity consumption of reach-in coolers under the Business as Usual Scenario
Electricity consumption (TWh/year)
2009 2013 2020 2025 2030 2035
USA 14.2 13.2 14.7 18.1 20.2 22.2
MEXICO 6.6 6.9 8.2 10.0 11.9 13.5
EU 32.9 35.9 42.0 48.3 54.7 60.2
JAPAN 13.5 12.4 12.4 13.6 15.1 16.7
CHINA 3.9 7.3 16.0 22.7 29.7 38.2
INDIA 1.7 2.3 4.2 6.5 9.7 14.1
BRAZIL 3.0 3.5 4.5 5.3 6.2 7.2
RSA 0.4 0.4 0.5 0.7 0.9 1.2
AUSTRALIA 0.7 0.8 0.9 1.1 1.2 1.3
TOTAL 76.8 82.6 103.4 126.3 149.4 174.6
Table 52. Estimated savings in electricity consumption of reach-in coolers under the Least Life Cycle Cost Scenario compared with the Business as Usual Scenario
Electricity consumption (TWh/year)
2009 2013 2020 2025 2030 2035
USA 0.0 0.0 2.3 4.9 5.5 6.1
MEXICO 0.0 0.0 1.4 3.2 3.8 4.3
EU 0.0 0.0 3.9 8.3 9.4 10.4
JAPAN 0.0 0.0 1.7 3.6 4.0 4.4
CHINA 0.0 0.0 3.1 7.2 9.4 12.2
INDIA 0.0 0.0 0.9 2.2 3.3 4.8
BRAZIL 0.0 0.0 0.8 1.7 2.0 2.3
RSA 0.0 0.0 0.1 0.1 0.2 0.2
AUSTRALIA 0.0 0.0 0.1 0.3 0.3 0.4
TOTAL 0.0 0.0 14.2 31.6 37.9 45.0
Total annual energy savings for the Least Life Cycle Cost Scenario are 45.0 TWh of final electricity demand in 2035, which are 26% of the base case value in the same year. The total energy savings under the Maximum Technical Potential Scenario in 2035 are 55.6 TWh, which are 32% of the base case value.
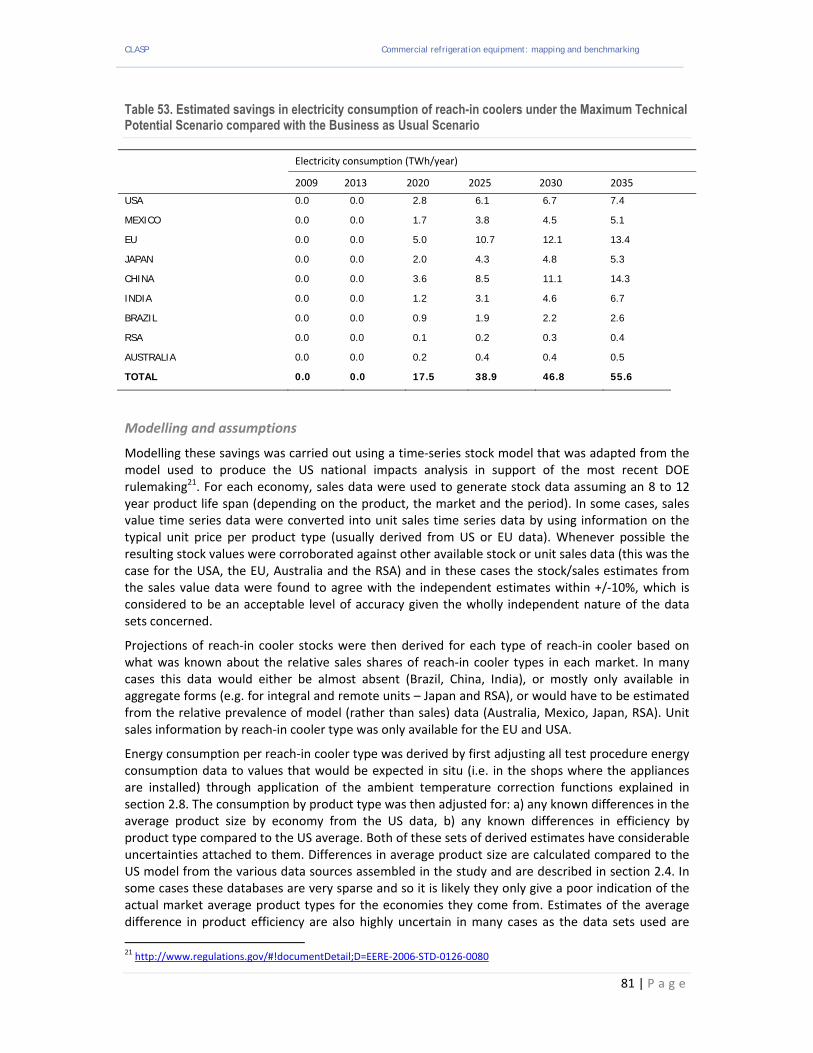
CLASP Commercial refrigeration equipment: mapping and benchmarking
81 | P a g e
Table 53. Estimated savings in electricity consumption of reach-in coolers under the Maximum Technical Potential Scenario compared with the Business as Usual Scenario
Electricity consumption (TWh/year)
2009 2013 2020 2025 2030 2035
USA 0.0 0.0 2.8 6.1 6.7 7.4
MEXICO 0.0 0.0 1.7 3.8 4.5 5.1
EU 0.0 0.0 5.0 10.7 12.1 13.4
JAPAN 0.0 0.0 2.0 4.3 4.8 5.3
CHINA 0.0 0.0 3.6 8.5 11.1 14.3
INDIA 0.0 0.0 1.2 3.1 4.6 6.7
BRAZIL 0.0 0.0 0.9 1.9 2.2 2.6
RSA 0.0 0.0 0.1 0.2 0.3 0.4
AUSTRALIA 0.0 0.0 0.2 0.4 0.4 0.5
TOTAL 0.0 0.0 17.5 38.9 46.8 55.6
Modelling and assumptions
Modelling these savings was carried out using a time‐series stock model that was adapted from the model used to produce the US national impacts analysis in support of the most recent DOE rulemaking21. For each economy, sales data were used to generate stock data assuming an 8 to 12 year product life span (depending on the product, the market and the period). In some cases, sales value time series data were converted into unit sales time series data by using information on the typical unit price per product type (usually derived from US or EU data). Whenever possible the resulting stock values were corroborated against other available stock or unit sales data (this was the case for the USA, the EU, Australia and the RSA) and in these cases the stock/sales estimates from the sales value data were found to agree with the independent estimates within +/‐10%, which is considered to be an acceptable level of accuracy given the wholly independent nature of the data sets concerned.
Projections of reach‐in cooler stocks were then derived for each type of reach‐in cooler based on what was known about the relative sales shares of reach‐in cooler types in each market. In many cases this data would either be almost absent (Brazil, China, India), or mostly only available in aggregate forms (e.g. for integral and remote units – Japan and RSA), or would have to be estimated from the relative prevalence of model (rather than sales) data (Australia, Mexico, Japan, RSA). Unit sales information by reach‐in cooler type was only available for the EU and USA.
Energy consumption per reach‐in cooler type was derived by first adjusting all test procedure energy consumption data to values that would be expected in situ (i.e. in the shops where the appliances are installed) through application of the ambient temperature correction functions explained in section 2.8. The consumption by product type was then adjusted for: a) any known differences in the average product size by economy from the US data, b) any known differences in efficiency by product type compared to the US average. Both of these sets of derived estimates have considerable uncertainties attached to them. Differences in average product size are calculated compared to the US model from the various data sources assembled in the study and are described in section 2.4. In some cases these databases are very sparse and so it is likely they only give a poor indication of the actual market average product types for the economies they come from. Estimates of the average difference in product efficiency are also highly uncertain in many cases as the data sets used are
21 http://www.regulations.gov/#!documentDetail;D=EERE‐2006‐STD‐0126‐0080
CLASP Commercial refrigeration equipment: mapping and benchmarking
82 | P a g e
patchy or incomplete. Apart from the USA, the best data sets are for Europe and Australia. Good product data were available for one manufacturer in Japan. A relatively large data set of certified products was also available for Mexico but this only included integral reach‐in cooler types and hence was only partially useful. A very small amount of model data was available for China but otherwise it was assumed that Chinese products respect the minimum efficiency standards and are distributed among the label classes in the same manner as the products in the small dataset. There was only a very small amount of data available for Brazil from one producer and it is likely this is not representative of the market as a whole. In the case of India, there were no energy performance data available and thus it was arbitrarily assumed that all products are at the efficiency level of the baseline (least efficient) product in the US DOE rulemaking’s technical support document. The uncertainty in all these factors could result in there being significant errors in the base case (business as usual) efficiency level and unit average energy consumption assumed in the Business as Usual Scenario; however, the results are still thought to be helpful in framing the rough magnitude of reach‐in cooler energy consumption in the absence of better data.
For both the Least Life Cycle Cost scenario and the Maximum Technical Efficiency Scenario it is assumed that new products sold up to 2014 are at the Business As Usual Scenario efficiency level and that after 2014 they are at the efficiency associated with the Least Life Cycle Cost or the Maximum Technically Achievable level respectively. The analysis presented in section 2.8 and Appendix A is used to derive these values but in the case of the Least Life Cycle Cost scenario the efficiency level of LLCC varies by economy depending on the average electricity tariff (for the sake of simplicity product costs are assumed to be the same as in the USA for all economies except the EU (where EU data were available and used) although adjusted for differences in average product size – thus variations in labour, transport and material costs are not considered and nor are variations in production/distribution margins and other local factors considered). For both the LLCC and Maximum Technical Efficiency Scenarios it is (conservatively) assumed that there is no ongoing learning effect i.e. that the incremental costs of more efficient products remain unchanged over time and that there is no long term improvement in the maximum efficiency level attainable. Neither of these assumptions is likely to be accurate as the incremental cost of efficiency will probably decline over time as new technology enables higher efficiency products to be produced at lower cost.
Figures showing the results of these three scenarios for each economy are shown in the next sections.

CLASP Commercial refrigeration equipment: mapping and benchmarking
83 | P a g e
Australia
Figure 29. Australia estimated energy consumption for Reach-in Coolers under Business as Usual, Least Life Cycle Cost and Maximum technical efficiency scenarios.
Brazil
Figure 30. Brazil estimated energy consumption for Reach-in Coolers under Business as Usual, Least Life Cycle Cost and Maximum technical efficiency scenarios.
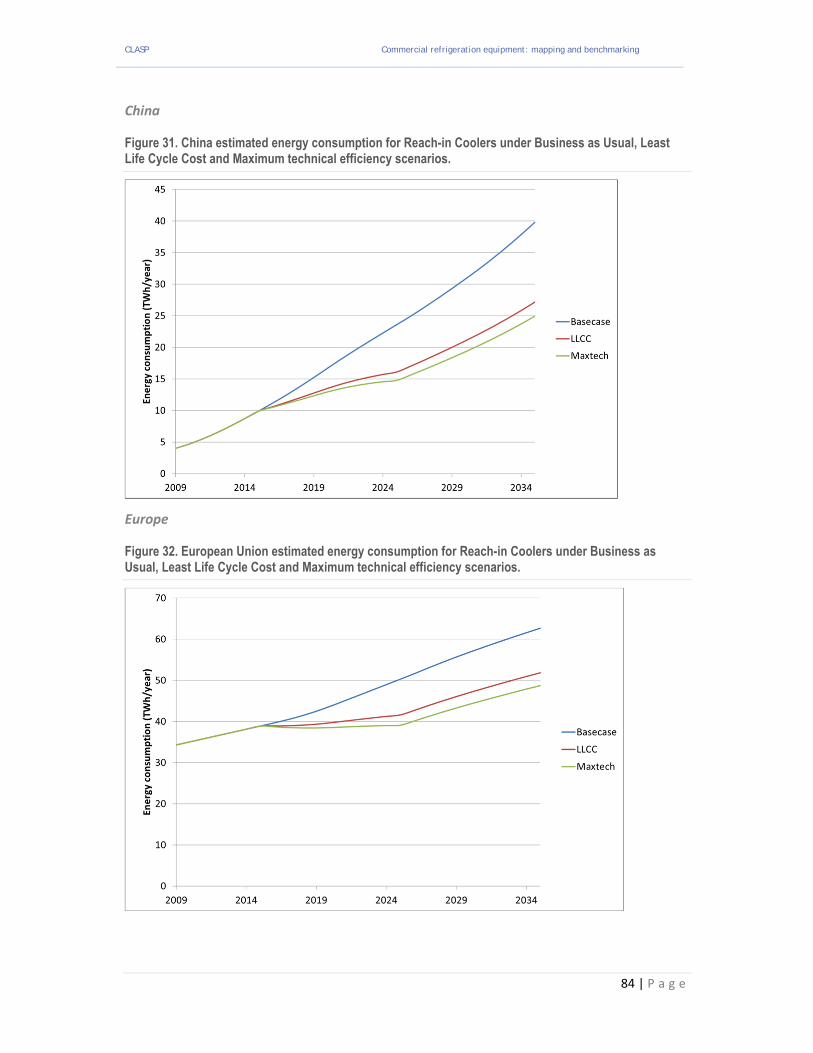
CLASP Commercial refrigeration equipment: mapping and benchmarking
84 | P a g e
China
Figure 31. China estimated energy consumption for Reach-in Coolers under Business as Usual, Least Life Cycle Cost and Maximum technical efficiency scenarios.
Europe
Figure 32. European Union estimated energy consumption for Reach-in Coolers under Business as Usual, Least Life Cycle Cost and Maximum technical efficiency scenarios.

CLASP Commercial refrigeration equipment: mapping and benchmarking
85 | P a g e
India
Figure 33. India estimated energy consumption for Reach-in Coolers under Business as Usual, Least Life Cycle Cost and Maximum technical efficiency scenarios.
Japan
Figure 34. Japan estimated energy consumption for Reach-in Coolers under Business as Usual, Least Life Cycle Cost and Maximum technical efficiency scenarios.

CLASP Commercial refrigeration equipment: mapping and benchmarking
86 | P a g e
Mexico
Figure 35. Mexico estimated energy consumption for Reach-in Coolers under Business as Usual, Least Life Cycle Cost and Maximum technical efficiency scenarios.
South Africa
Figure 36. South Africa estimated energy consumption for Reach-in Coolers under Business as Usual, Least Life Cycle Cost and Maximum technical efficiency scenarios.

CLASP Commercial refrigeration equipment: mapping and benchmarking
87 | P a g e
USA
Figure 37. United States estimated energy consumption for Reach-in Coolers under Business as Usual, Least Life Cycle Cost and Maximum technical efficiency scenarios.
Implications
Overall this analysis shows the strong potential to deliver greater savings through more proactive policy measures. The current mix of policies is rather patchy with many economies not having energy labelling or MEPS for any reach‐in cooler types.
Clearly countries that have no standards or labelling policy measures for retail display cabinets such as Brazil, the EU, India and Japan have a strong potential to save energy by introducing such measures, and the EU is in the process of developing such measures. Countries like China and Mexico which have measures for some equipment types (remote and integral) units respectively would benefit from developing them for all retail display cabinet categories. Interestingly, the markets with standards and labelling in place are not obviously leading the field in retail display cabinet energy efficiency. South Africa, nominally has standards in place for some reach‐in cooler types but they do not seem to be up to date nor mandatory. The US DOE rulemaking process precluded consideration of some high efficiency design options such as night covers and doors that are routinely used in some other markets and could be obliged through regulation. The Australian market does not appear to be any more efficient than the European market, which is not yet regulated. This suggests there is more to be done in all economies to increase the energy efficiency of the market.
CLASP Commercial refrigeration equipment: mapping and benchmarking
88 | P a g e
3. Refrigerated vending machines
This section of the report addresses refrigerated vending machines and follows the same structure as for the reach‐in coolers. It involves:
Identification of the national test procedures applied in the target economies and their equivalence to other commonly used international or national test procedures
Examination of similarities and differences in how the efficiency metrics are derived and applied in the different economies
Conduct of a comparison of the test procedures, and identification of potential issues that are likely to affect the comparability of nominal test results
Comparison of the differences in the testing procedures and protocols to assess the expected impact on rated energy performance associated with variations in: testing conditions, testing methods, calculation methods for efficiencies, uncertainty of measurements, tolerances, etc.
Description of the energy efficiency policies currently in place
Analysis of the sales and stocks of vending machines
Conduct of a techno‐economic energy engineering analysis to determine cost effective energy savings potentials
Derivation of long range economy wide energy consumption scenarios.
3.1 Types of refrigerated vending machine
Refrigerated vending machines are commercial refrigerated cabinets designed to accept consumer payments or tokens to dispense chilled or frozen products without on‐site labour intervention. Vending machines are most often plug‐in appliances.
There are three main types: can, drum and spiral. The prevalence and functionality of these types varies by economy and investigations presented later in the report suggest variation in the proportion of primary types is likely to be a significant cause of variation in nominal benchmarks of energy efficiency from one economy to another. Figure 38 shows a spiral (multi‐purpose) vending machine, the most common type sold in the EU.
In the USA a distinction is made by type of vending machine depending on whether it is a class A machine (i.e. has a glass front) or a class B machine (has an opaque front). This distinction obviously affects how much of the produce is displayed directly at the point of sale but this in turn has an influence on its energy consumption as it is more viable to cool product just prior to sale (via zone cooling) for opaque (class B) machines than it is for transparent class A machines. The spiral vending machines shown in Figure 38 are invariably transparent and do not use zone cooling.
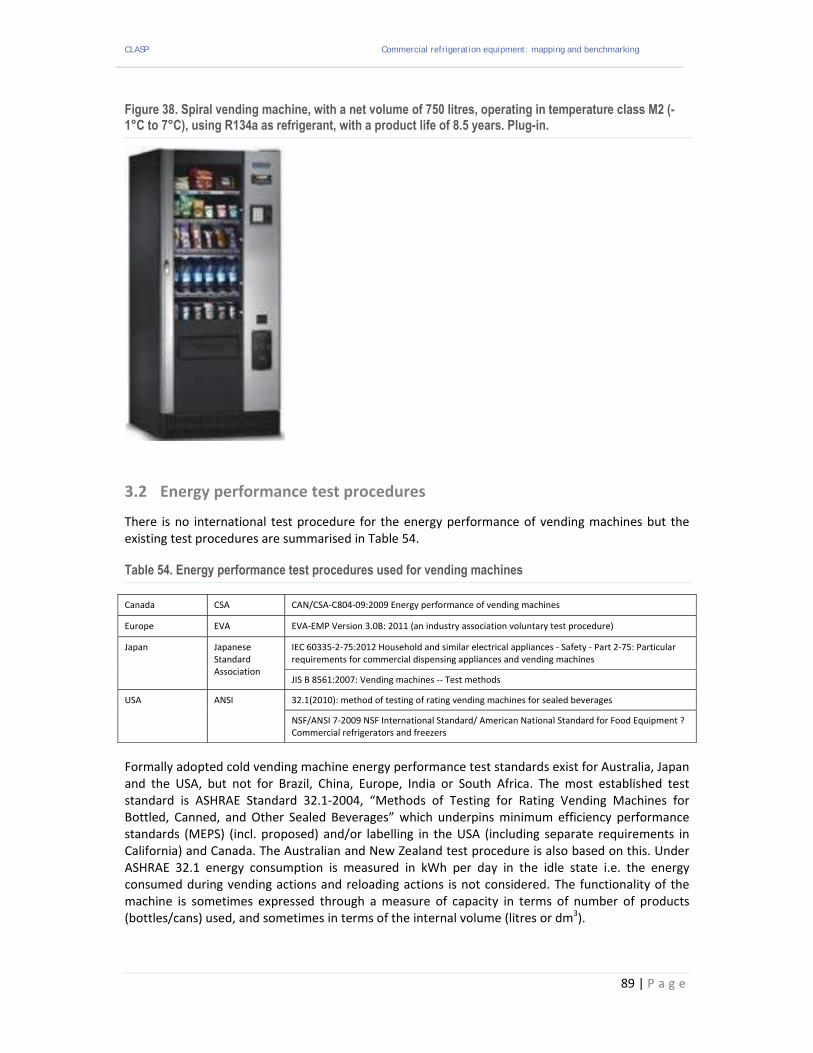
CLASP Commercial refrigeration equipment: mapping and benchmarking
89 | P a g e
Figure 38. Spiral vending machine, with a net volume of 750 litres, operating in temperature class M2 (-1°C to 7°C), using R134a as refrigerant, with a product life of 8.5 years. Plug-in.
3.2 Energy performance test procedures
There is no international test procedure for the energy performance of vending machines but the existing test procedures are summarised in Table 54.
Table 54. Energy performance test procedures used for vending machines
Canada CSA CAN/CSA‐C804‐09:2009 Energy performance of vending machines
Europe EVA EVA‐EMP Version 3.0B: 2011 (an industry association voluntary test procedure)
Japan Japanese Standard Association
IEC 60335‐2‐75:2012 Household and similar electrical appliances ‐ Safety ‐ Part 2‐75: Particular requirements for commercial dispensing appliances and vending machines
JIS B 8561:2007: Vending machines ‐‐ Test methods
USA ANSI 32.1(2010): method of testing of rating vending machines for sealed beverages
NSF/ANSI 7‐2009 NSF International Standard/ American National Standard for Food Equipment ? Commercial refrigerators and freezers
Formally adopted cold vending machine energy performance test standards exist for Australia, Japan and the USA, but not for Brazil, China, Europe, India or South Africa. The most established test standard is ASHRAE Standard 32.1‐2004, “Methods of Testing for Rating Vending Machines for Bottled, Canned, and Other Sealed Beverages” which underpins minimum efficiency performance standards (MEPS) (incl. proposed) and/or labelling in the USA (including separate requirements in California) and Canada. The Australian and New Zealand test procedure is also based on this. Under ASHRAE 32.1 energy consumption is measured in kWh per day in the idle state i.e. the energy consumed during vending actions and reloading actions is not considered. The functionality of the machine is sometimes expressed through a measure of capacity in terms of number of products (bottles/cans) used, and sometimes in terms of the internal volume (litres or dm3).
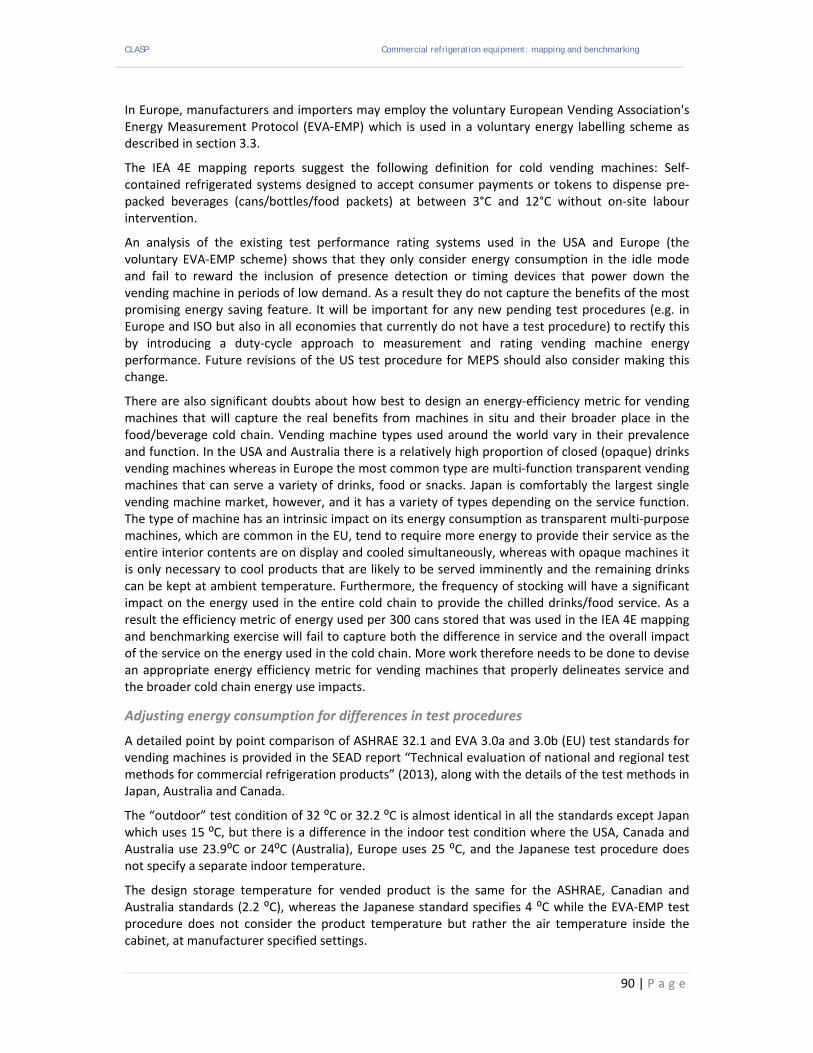
CLASP Commercial refrigeration equipment: mapping and benchmarking
90 | P a g e
In Europe, manufacturers and importers may employ the voluntary European Vending Association's Energy Measurement Protocol (EVA‐EMP) which is used in a voluntary energy labelling scheme as described in section 3.3.
The IEA 4E mapping reports suggest the following definition for cold vending machines: Self‐contained refrigerated systems designed to accept consumer payments or tokens to dispense pre‐packed beverages (cans/bottles/food packets) at between 3°C and 12°C without on‐site labour intervention.
An analysis of the existing test performance rating systems used in the USA and Europe (the voluntary EVA‐EMP scheme) shows that they only consider energy consumption in the idle mode and fail to reward the inclusion of presence detection or timing devices that power down the vending machine in periods of low demand. As a result they do not capture the benefits of the most promising energy saving feature. It will be important for any new pending test procedures (e.g. in Europe and ISO but also in all economies that currently do not have a test procedure) to rectify this by introducing a duty‐cycle approach to measurement and rating vending machine energy performance. Future revisions of the US test procedure for MEPS should also consider making this change.
There are also significant doubts about how best to design an energy‐efficiency metric for vending machines that will capture the real benefits from machines in situ and their broader place in the food/beverage cold chain. Vending machine types used around the world vary in their prevalence and function. In the USA and Australia there is a relatively high proportion of closed (opaque) drinks vending machines whereas in Europe the most common type are multi‐function transparent vending machines that can serve a variety of drinks, food or snacks. Japan is comfortably the largest single vending machine market, however, and it has a variety of types depending on the service function. The type of machine has an intrinsic impact on its energy consumption as transparent multi‐purpose machines, which are common in the EU, tend to require more energy to provide their service as the entire interior contents are on display and cooled simultaneously, whereas with opaque machines it is only necessary to cool products that are likely to be served imminently and the remaining drinks can be kept at ambient temperature. Furthermore, the frequency of stocking will have a significant impact on the energy used in the entire cold chain to provide the chilled drinks/food service. As a result the efficiency metric of energy used per 300 cans stored that was used in the IEA 4E mapping and benchmarking exercise will fail to capture both the difference in service and the overall impact of the service on the energy used in the cold chain. More work therefore needs to be done to devise an appropriate energy efficiency metric for vending machines that properly delineates service and the broader cold chain energy use impacts.
Adjusting energy consumption for differences in test procedures
A detailed point by point comparison of ASHRAE 32.1 and EVA 3.0a and 3.0b (EU) test standards for vending machines is provided in the SEAD report “Technical evaluation of national and regional test methods for commercial refrigeration products” (2013), along with the details of the test methods in Japan, Australia and Canada.
The “outdoor” test condition of 32 ⁰C or 32.2 ⁰C is almost identical in all the standards except Japan which uses 15 ⁰C, but there is a difference in the indoor test condition where the USA, Canada and Australia use 23.9⁰C or 24⁰C (Australia), Europe uses 25 ⁰C, and the Japanese test procedure does not specify a separate indoor temperature.
The design storage temperature for vended product is the same for the ASHRAE, Canadian and Australia standards (2.2 ⁰C), whereas the Japanese standard specifies 4 ⁰C while the EVA‐EMP test procedure does not consider the product temperature but rather the air temperature inside the cabinet, at manufacturer specified settings.
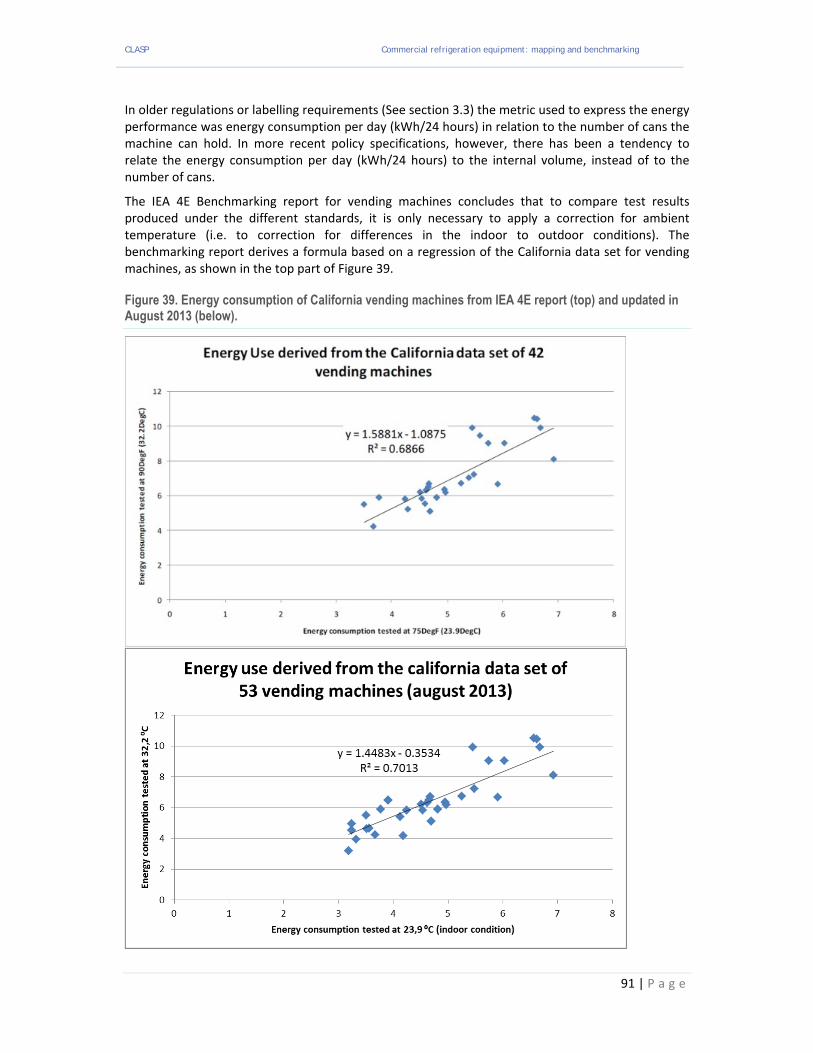
CLASP Commercial refrigeration equipment: mapping and benchmarking
91 | P a g e
In older regulations or labelling requirements (See section 3.3) the metric used to express the energy performance was energy consumption per day (kWh/24 hours) in relation to the number of cans the machine can hold. In more recent policy specifications, however, there has been a tendency to relate the energy consumption per day (kWh/24 hours) to the internal volume, instead of to the number of cans.
The IEA 4E Benchmarking report for vending machines concludes that to compare test results produced under the different standards, it is only necessary to apply a correction for ambient temperature (i.e. to correction for differences in the indoor to outdoor conditions). The benchmarking report derives a formula based on a regression of the California data set for vending machines, as shown in the top part of Figure 39.
Figure 39. Energy consumption of California vending machines from IEA 4E report (top) and updated in August 2013 (below).

CLASP Commercial refrigeration equipment: mapping and benchmarking
92 | P a g e
This formula is very sensitive to changes in the data set, as can be seen from Figure 39 where the top figure is the regression made in the IEA 4E benchmark report, and the bottom figure shows a regression performed on a more current version of the same database. Moreover, the regression type chosen in the benchmark report is linear with an offset, whereas a simple linear regression without an offset provides equally good results. A simple regression without offset is more in line with the actual physics underpinning vending machine energy use, is easier to use, and can be applied more robustly over a wider application range. The simple regression found in the recent analysis of the California data set is:
E (32.2 ⁰C) = 1.373 * E (23.9 ⁰C)
and has an R2 = 0.6993 as opposed to an R2 = 0.7013 for a linear regression with offset. Making the assumption that in general 70 % of the energy is used for cooling and the remaining 30 % is for lighting etc.22, gives:
E (32.2 ⁰C) = 0.30 * E (23.9 ⁰C) + 0.70 * E (23.9 ⁰C) * 1.533
where the energy used for lighting etc. remains constant over the difference in ambient temperatures used in the test, whereas the energy for refrigeration increases by 53.3 %, adding up to an overall consumption increase of 37.3 % (as indicated by the regression line). The increase in energy use per ⁰C in moving from 23.9 ⁰C to 32.2 ⁰C is thus 3.8 %.
The IEA 4E benchmark report reports an apparent discrepancy between the “refrigeration rule of thumb” of 2‐3 % energy consumption increase per ⁰C, and the empirical value of 37% overall increase of energy consumption (or actually 53.3 % increase in refrigeration consumption as demonstrated above). However, this rule of thumb is only intended to apply to the compressor C.O.P. when the load remains constant and the temperature difference between the condenser and ambient remains constant. In reality, the load increases considerably as the ambient temperature increases and the condenser to ambient temperature difference may also increase. Therefore, there is not really a discrepancy between the rule of thumb based on refrigerator physics and the empirical values, even when the empirical data suggest an average increase of 3.8% per ⁰C in moving from an ambient temperature of 23.9 ⁰C to 32.2 ⁰C.
Therefore in place of the ambient temperature energy conversion formula given in the IEA 4E report it is recommended to use a fixed percentage correction factor of +37 % to adjust the average vending machine energy consumption values when changing the ambient test conditions from 23.9 ⁰C (indoors, under ASHRAE test conditions) to 32.2 ⁰C (outdoors, under ASHRAE test conditions).
Similarly, when adjusting energy consumption values from 25 ⁰C ambient (under EU indoor conditions) to 32.2 ⁰C (US outdoor condition) it is recommended that a correction factor of +31 % be applied as follows:
E (32.2 ⁰C) = 0.30 * E (25.0 ⁰C) + 0.70 * E (25.0 ⁰C) * 1.45 = 1.31 * E (25.0 ⁰C)
22 For class B vending machines, the cooling energy consumption comprises 65 % ‐ 76 % of the total energy consumption
according to DOE studies. For spiral vending machines (class A) the variable cooling energy consumption of the EU Ecodesign Lot 12 base case comprises 69.9 % of total energy consumption at 25 ⁰C.
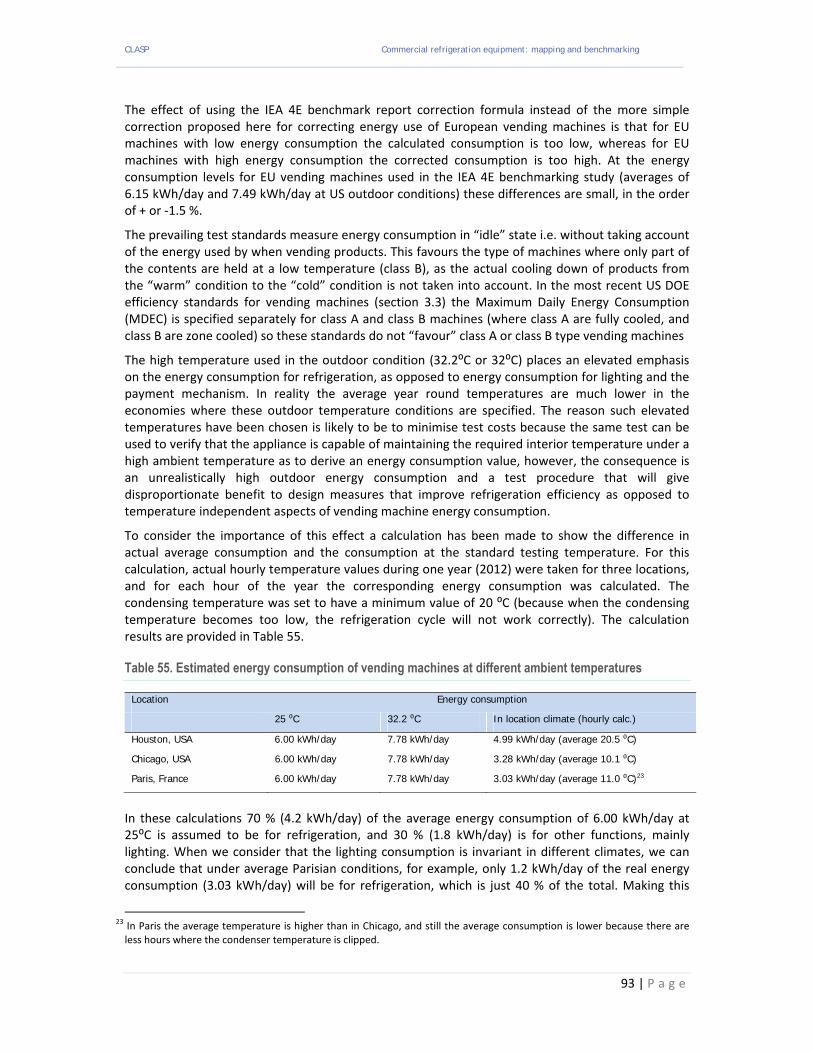
CLASP Commercial refrigeration equipment: mapping and benchmarking
93 | P a g e
The effect of using the IEA 4E benchmark report correction formula instead of the more simple correction proposed here for correcting energy use of European vending machines is that for EU machines with low energy consumption the calculated consumption is too low, whereas for EU machines with high energy consumption the corrected consumption is too high. At the energy consumption levels for EU vending machines used in the IEA 4E benchmarking study (averages of 6.15 kWh/day and 7.49 kWh/day at US outdoor conditions) these differences are small, in the order of + or ‐1.5 %.
The prevailing test standards measure energy consumption in “idle” state i.e. without taking account of the energy used by when vending products. This favours the type of machines where only part of the contents are held at a low temperature (class B), as the actual cooling down of products from the “warm” condition to the “cold” condition is not taken into account. In the most recent US DOE efficiency standards for vending machines (section 3.3) the Maximum Daily Energy Consumption (MDEC) is specified separately for class A and class B machines (where class A are fully cooled, and class B are zone cooled) so these standards do not “favour” class A or class B type vending machines
The high temperature used in the outdoor condition (32.2⁰C or 32⁰C) places an elevated emphasis on the energy consumption for refrigeration, as opposed to energy consumption for lighting and the payment mechanism. In reality the average year round temperatures are much lower in the economies where these outdoor temperature conditions are specified. The reason such elevated temperatures have been chosen is likely to be to minimise test costs because the same test can be used to verify that the appliance is capable of maintaining the required interior temperature under a high ambient temperature as to derive an energy consumption value, however, the consequence is an unrealistically high outdoor energy consumption and a test procedure that will give disproportionate benefit to design measures that improve refrigeration efficiency as opposed to temperature independent aspects of vending machine energy consumption.
To consider the importance of this effect a calculation has been made to show the difference in actual average consumption and the consumption at the standard testing temperature. For this calculation, actual hourly temperature values during one year (2012) were taken for three locations, and for each hour of the year the corresponding energy consumption was calculated. The condensing temperature was set to have a minimum value of 20 ⁰C (because when the condensing temperature becomes too low, the refrigeration cycle will not work correctly). The calculation results are provided in Table 55.
Table 55. Estimated energy consumption of vending machines at different ambient temperatures
Location Energy consumption
25 ⁰C 32.2 ⁰C In location climate (hourly calc.)
Houston, USA 6.00 kWh/day 7.78 kWh/day 4.99 kWh/day (average 20.5 ⁰C)
Chicago, USA 6.00 kWh/day 7.78 kWh/day 3.28 kWh/day (average 10.1 ⁰C)
Paris, France 6.00 kWh/day 7.78 kWh/day 3.03 kWh/day (average 11.0 ⁰C)23
In these calculations 70 % (4.2 kWh/day) of the average energy consumption of 6.00 kWh/day at 25⁰C is assumed to be for refrigeration, and 30 % (1.8 kWh/day) is for other functions, mainly lighting. When we consider that the lighting consumption is invariant in different climates, we can conclude that under average Parisian conditions, for example, only 1.2 kWh/day of the real energy consumption (3.03 kWh/day) will be for refrigeration, which is just 40 % of the total. Making this
23 In Paris the average temperature is higher than in Chicago, and still the average consumption is lower because there are less hours where the condenser temperature is clipped.
CLASP Commercial refrigeration equipment: mapping and benchmarking
94 | P a g e
adjustment for more representative in situ conditions will dramatically influence life cycle cost (LCC) curves, as refrigeration related options will be far less economical to implement compared to how they appear under the existing standard test conditions. Therefore, it is recommended that any techno‐economic energy engineering analysis for determining LCCs be performed at more realistic “real life” ambient conditions. This can be done without changing standard test conditions through application of the adjustment factors set out above.
As previously mentioned standard test conditions are in idle state, and do not cover, “selling” actions or refills. Actual sales of beverages do not increase the energy consumption noticeably. Typical beverage sales volumes are reported to range from 50‐500 cans/week in EU vending machines (EU Ecodesign Lot 12 report). At a sales level of 100 cans per week the cooling power needed to cool down replacement cans from +25 ⁰C to +4 ⁰C loaded into the refrigerated zone in class B vending machines is about 1.7 Watts. This amounts to less than 1% of the overall energy consumption and thus a test procedure focused on idle mode consumption will only slightly underestimate actual consumption.
However, an issue that is not encouraged (i.e. rewarded with a lower rated energy consumption) under any of the current testing standards is the reduction of lighting levels when customers are not present. This is a significant savings option as lighting is already 30 % of the energy consumption under test conditions, and even more in real life conditions. Devices are on the market which can accomplish this function, but they are sold as “add‐ons” with a price level that is much higher than would be expected were the function to be incorporated by the manufacturer (which would also avoid the add‐on installation costs). None of the current test standards encourage manufacturers to do this, but programmes such as Energy Star do require such a ‘low power mode” for periods of extended inactivity, see section 3.3 (USA).
3.3 Energy efficiency policies
Australia
The MEPS specified in AS 1731 for commercial refrigeration equipment do not apply to refrigerated vending machines or cabinets intended for use in catering and similar non‐retail applications. However, MEPS for vending machines are reported to be under consideration.
Brazil
Brazil is not thought to have any energy efficiency requirements for vending machines.
China
China is not thought to have any energy efficiency requirements for vending machines.
Europe
The Commission is developing Ecodesign requirements for vending machines. In addition the EVA (European Vending Association) has developed a voluntary energy labelling scheme for vending machines that uses test results produced according to their voluntary test procedure (EVA‐EMP), Table 56.

CLASP Commercial refrigeration equipment: mapping and benchmarking
95 | P a g e
Table 56. Indicative energy consumption for vending machines (typical internal volume of 500 L for non-perishable food/drink) in each energy label class, according the EVA-EMP voluntary energy labelling scheme
Energy label class
Energy consumption
kWh/24h less than
Power
kW less than
A+ 3.68 0.15
A 4.82 0.20
B 6.58 0.27
C 7.89 0.33
D 8.77 0.37
E 9.65 0.40
F 10.96 0.46
G >10.96 >0.46
India
India is not thought to have any energy efficiency requirements for vending machines.
Japan
Japan applies “Top Runner” programme requirements for vending machines which are a type of minimum fleet average energy efficiency requirement that all suppliers of vending machines onto the Japanese market are required to meet.
Scope
Vending machines for canned/bottled beverages, beverages in paper containers, and beverages served in cups, all of which are specified in JIS B8561. However, the following products shall be excluded.
1) those intended to be used only on ships
2) those intended to be used only on railway cars
3) cup type beverage vending machines that cool beverages (raw materials) by means of electronic cooling (e.g. Peltier cooling)
4) machines of the countertop type
5) machines for alcoholic beverages other than beer (including low‐malt beer).
Energy consumption measurement
(1) For vending machines whose target fiscal year is FY 2005 and each subsequent fiscal year (until FY2011) the annual energy consumption (kWh/year) is measured in accordance with the method specified in JIS B8561 (2000).
(2) For vending machines whose target fiscal year is FY 2012 and each subsequent fiscal year the annual energy consumption (kWh/year) measured in accordance with the method specified in JIS B8561 (2007).
Top Runner energy performance thresholds
In the target fiscal year and each subsequent fiscal year, energy consumption efficiency in each category shall be at or lower than the target standard value.
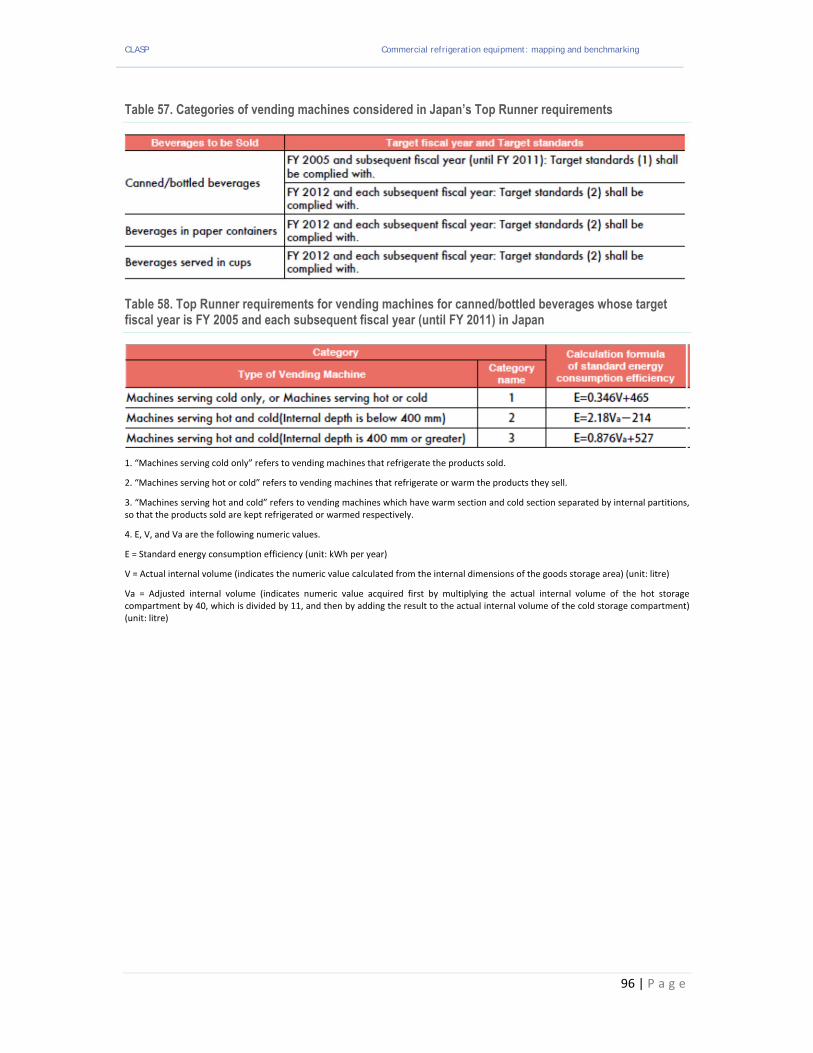
CLASP Commercial refrigeration equipment: mapping and benchmarking
96 | P a g e
Table 57. Categories of vending machines considered in Japan’s Top Runner requirements
Table 58. Top Runner requirements for vending machines for canned/bottled beverages whose target fiscal year is FY 2005 and each subsequent fiscal year (until FY 2011) in Japan
1. “Machines serving cold only” refers to vending machines that refrigerate the products sold.
2. “Machines serving hot or cold” refers to vending machines that refrigerate or warm the products they sell.
3. “Machines serving hot and cold” refers to vending machines which have warm section and cold section separated by internal partitions, so that the products sold are kept refrigerated or warmed respectively.
4. E, V, and Va are the following numeric values.
E = Standard energy consumption efficiency (unit: kWh per year)
V = Actual internal volume (indicates the numeric value calculated from the internal dimensions of the goods storage area) (unit: litre)
Va = Adjusted internal volume (indicates numeric value acquired first by multiplying the actual internal volume of the hot storage compartment by 40, which is divided by 11, and then by adding the result to the actual internal volume of the cold storage compartment) (unit: litre)
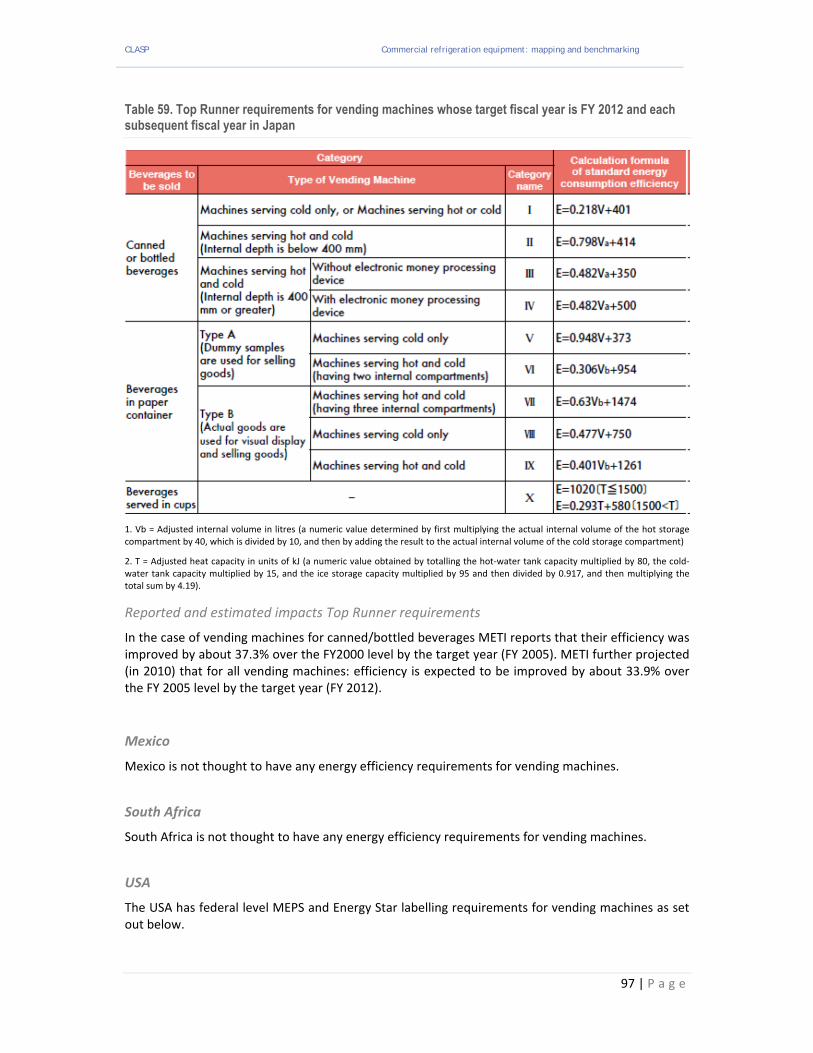
CLASP Commercial refrigeration equipment: mapping and benchmarking
97 | P a g e
Table 59. Top Runner requirements for vending machines whose target fiscal year is FY 2012 and each subsequent fiscal year in Japan
1. Vb = Adjusted internal volume in litres (a numeric value determined by first multiplying the actual internal volume of the hot storage compartment by 40, which is divided by 10, and then by adding the result to the actual internal volume of the cold storage compartment)
2. T = Adjusted heat capacity in units of kJ (a numeric value obtained by totalling the hot‐water tank capacity multiplied by 80, the cold‐water tank capacity multiplied by 15, and the ice storage capacity multiplied by 95 and then divided by 0.917, and then multiplying the total sum by 4.19).
Reported and estimated impacts Top Runner requirements
In the case of vending machines for canned/bottled beverages METI reports that their efficiency was improved by about 37.3% over the FY2000 level by the target year (FY 2005). METI further projected (in 2010) that for all vending machines: efficiency is expected to be improved by about 33.9% over the FY 2005 level by the target year (FY 2012).
Mexico
Mexico is not thought to have any energy efficiency requirements for vending machines.
South Africa
South Africa is not thought to have any energy efficiency requirements for vending machines.
USA
The USA has federal level MEPS and Energy Star labelling requirements for vending machines as set out below.
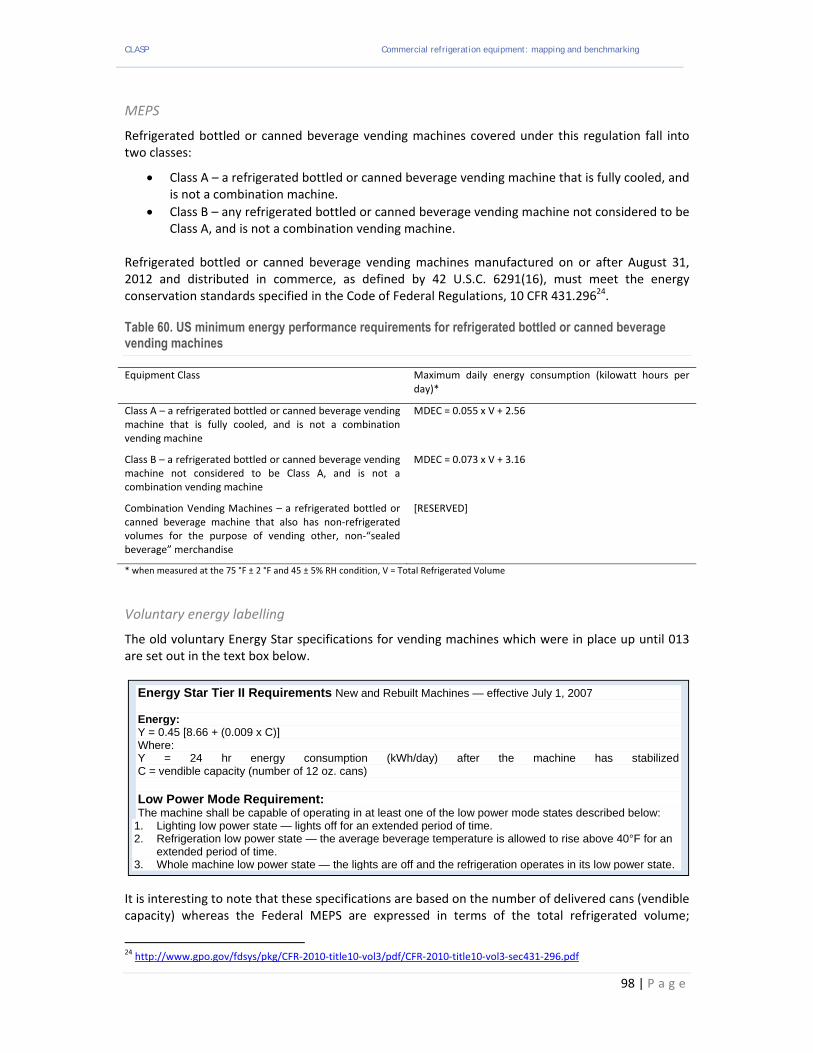
CLASP Commercial refrigeration equipment: mapping and benchmarking
98 | P a g e
Energy Star Tier II Requirements New and Rebuilt Machines — effective July 1, 2007 Energy: Y = 0.45 [8.66 + (0.009 x C)] Where: Y = 24 hr energy consumption (kWh/day) after the machine has stabilizedC = vendible capacity (number of 12 oz. cans) Low Power Mode Requirement: The machine shall be capable of operating in at least one of the low power mode states described below:
1. Lighting low power state — lights off for an extended period of time. 2. Refrigeration low power state — the average beverage temperature is allowed to rise above 40°F for an
extended period of time. 3. Whole machine low power state — the lights are off and the refrigeration operates in its low power state.
MEPS
Refrigerated bottled or canned beverage vending machines covered under this regulation fall into two classes:
Class A – a refrigerated bottled or canned beverage vending machine that is fully cooled, and is not a combination machine.
Class B – any refrigerated bottled or canned beverage vending machine not considered to be Class A, and is not a combination vending machine.
Refrigerated bottled or canned beverage vending machines manufactured on or after August 31, 2012 and distributed in commerce, as defined by 42 U.S.C. 6291(16), must meet the energy conservation standards specified in the Code of Federal Regulations, 10 CFR 431.29624.
Table 60. US minimum energy performance requirements for refrigerated bottled or canned beverage vending machines
Equipment Class Maximum daily energy consumption (kilowatt hours per day)*
Class A – a refrigerated bottled or canned beverage vending machine that is fully cooled, and is not a combination vending machine
MDEC = 0.055 x V + 2.56
Class B – a refrigerated bottled or canned beverage vending machine not considered to be Class A, and is not a combination vending machine
MDEC = 0.073 x V + 3.16
Combination Vending Machines – a refrigerated bottled or canned beverage machine that also has non‐refrigerated volumes for the purpose of vending other, non‐“sealed beverage” merchandise
[RESERVED]
* when measured at the 75 °F ± 2 °F and 45 ± 5% RH condition, V = Total Refrigerated Volume
Voluntary energy labelling
The old voluntary Energy Star specifications for vending machines which were in place up until 013 are set out in the text box below.
It is interesting to note that these specifications are based on the number of delivered cans (vendible capacity) whereas the Federal MEPS are expressed in terms of the total refrigerated volume;
24 http://www.gpo.gov/fdsys/pkg/CFR‐2010‐title10‐vol3/pdf/CFR‐2010‐title10‐vol3‐sec431‐296.pdf

CLASP Commercial refrigeration equipment: mapping and benchmarking
99 | P a g e
however, this has been changed in the new specifications set out below. In addition the Energy Star eligibility specifications require the use of an Energy Star low power mode, which applies to lighting and to refrigeration. It would seem apparent that the “refrigeration low power state” cannot be applied to class A machines that also sell chilled snacks, as snacks must always be kept at the correct temperature. From March 2013 Energy Star requirements have been amended to be as follows: A. Maximum Daily Energy Consumption (MDEC): To qualify for ENERGY STAR, refrigerated beverage vending machines shall consume equal to or less than the MDEC values, in kWh/day, obtained using the equations below:
a. Class A – New and Rebuilt Machines: 0.0523V + 2.432 b. Class B – New and Rebuilt Machines: 0.0657V + 2.844
Where, V = the refrigerated volume (ft3) of the refrigerated bottled or canned beverage vending machine, as measured by the American National Standards Institute (ANSI)/Association of Home Appliance Manufacturers (AHAM) HRF–1–2004, ‘‘Energy, Performance and Capacity of Household Refrigerators, Refrigerator‐Freezers and Freezers.’’ Measurement of refrigerated volume must be in accordance with the methodology specified in Section 5.2, Total Refrigerated Volume (excluding subsections 5.2.2.2 through 5.2.2.4), of ANSI/AHAM HRF–1–200425.
B. Low Power Mode: In addition to meeting the 24‐hour energy consumption requirements in Section 3A, qualifying models shall come equipped with hard wired controls and/or software capable of placing the machine into a low power mode during periods of extended inactivity while still connected to its power source to facilitate the saving of additional energy, where appropriate.
a. The machine shall be capable of operating in at least one of the low power mode states described below:
1. Lighting low power state – lights off for an extended period of time.
2. Refrigeration low power state – the average beverage temperature is allowed to rise to 40°F or higher for an extended period of time.
3. Whole machine low power state – the lights are off and the refrigeration operates in its low power state.
b. Machine shall be capable of returning itself back to its normal operating conditions at the conclusion of the inactivity period.
c. The low power mode‐related controls/software shall be capable of on‐site adjustment by the vending operator or machine owner unless the low power controlling device is already pre‐programmed when installed into the machine.
While only one of the above low power mode states is required, EPA encourages new machine manufacturers to continue to include all of the low power mode options in equipment designs and partners that are rebuilding machines to seek out new technologies that might help to achieve this goal as well.
Alternative refrigerant use
Hydrocarbon R441a may be sold in new vending machines as of May 2012 as stated in a USEPA letter. The Agency has also recently indicated that a draft rule on the use of CO2 in vending
25 10 CFR Part 431.294.

CLASP Commercial refrigeration equipment: mapping and benchmarking
100 | P a g e
machines is in the works before the end of the year. The letter also states that R441a may be sold “in stand‐alone refrigerators and freezers in retail food refrigeration in the US as of June 27, 2012;” the approval also includes use in stand‐alone refrigerated display cases.
Following the determination of the submission as “complete,” the US EPA will initiate the rule‐making procedure, with R441a expected to be listed on the Federal Register within the next 24 months.
Vending machines: In the summer of 2012, the US EPA also found complete another submission requesting SNAP approval for the use of hydrocarbon refrigerant R441a in new vending machines by the US Environmental Protection Agency (EPA). R441a may now be sold in new vending machines as of May 23, 2012. Again, the rule listing R441a on the Federal Register is expected within the next 24 months.
3.4 Energy efficiency of product markets
Data sets on vending machine energy performance are available for:
US data are available from both the Energy Star programme (93 models) and from the California Energy Commission website (49 models). These databases were analysed in the IEA‐4E mapping document for US vending machines. Data on US vending machines and their distribution by efficiency are also available in the US TSD (2009)
Canadian data are available from the federal government database (39 models).
Australian data were collected in the framework of the IEA‐4E mapping project on vending machines (IEA 2012e) (38 models). These data are derived from research reports commissioned by the Australian Government covering 2002 and 2004, completed by a number of independent test reports
European data were collected in the framework of the IEA‐4E mapping project on vending machines (IEA 2012f) (21 models)
The energy performance of Japanese vending machines is discussed and analysed in METI (2012) but no databases were available for use in this project
These data sets were analysed to determine the default efficiency distributions used in the macro level energy consumption scenarios presented in section 3.8.
3.5 Stocks and sales
There are various sources of information on stocks and sales of vending machines for the same markets as for which energy data are available (see above).
As with reach‐in coolers, data on the stocks and sales of vending machines are challenging to come by, however, detailed time‐series have been acquired for the USA (USTSD 2009) and for Japan. Data on the stock of units on the Australian market are available from the IEA 4E (2012) report and also some reported values for the EU market.
In the case of the EU, the European Vending Association also supplied some stock estimates and some information on the size of the Brazilian vending machine market.
In the case of other markets, sales value data are available from a Freedonia market report26 that was extrapolated into unit sales data using the same technique described in section 2.6 for reach‐in coolers. For this exercise it was assumed that the average price of a vending machine was as indicated in the US TSD for class A and class B machines respectively.
26 http://www.mzweb.com.br/metalfrio2008/web/conteudo_en.asp?idioma=1&conta=44&tipo=19837#3

CLASP Commercial refrigeration equipment: mapping and benchmarking
101 | P a g e
The resulting estimates of unit volume sales from 1999 to 2009 are shown in Table 61 and the stock values derived from an extended version of this data run through a stock model are shown in Table 62. Some aspects of these data stand out and are worthy of comment:
Table 61. Estimated sales (thousands of units) of refrigerated vending machines worldwide 1999−2009 (derived from numerous sources including Freedonia, US TSD, EU EVA and METI)
1999 2000 2001 2002 2003 2004 2005 2006 2007 2008 2009
United States 477 338 300 250 200 200 200 125 90 90 90
Canada 11 12 12 12 13 13 13 13 13 14 14
Mexico 35 36 38 40 42 44 43 42 42 41 40
Western Europe 176 181 186 192 197 203 206 208 211 134 135
Russia 11 12 13 13 14 15 16 17 18 19 20
Other Eastern European countries 19 19 20 20 21 22 23 24 25 26 27
Japan 377 364 352 341 329 318 312 307 301 296 291
China 8 10 13 16 20 26 29 33 38 43 48
India 7 8 8 9 10 10 11 12 13 14 16
Other Asian countries 61 63 66 68 71 74 79 83 88 93 98
Brazil 16 16 17 17 17 18 19 20 22 23 25
Rest of Latin America 16 16 17 17 18 18 19 20 21 22 23
Turkey 5 5 5 5 5 6 6 6 7 7 8
Rest of Africa/Middle East 20 21 21 21 22 22 23 25 26 28 29
Total 1238 1102 1067 1023 980 990 1000 936 914 848 863
Japan is comfortably the world’s largest market for vending machines and the stock of refrigerated vending machines was 2.85 million units in 2009.
Sales in the USA peaked in 1999 and underwent a sharp decline to 2009. This phenomenon is not explained in the US DOE TSD (the source of the data) but the dramatic fall in sales could be a combination of transitioning from a new to a replacement market combined with the economic downturn in 2008/9.
Sales in the EU and Japan also declined from 1999 to 2009 but not as dramatically as in the USA. This presumably reflects the general economic climate at that time.
Sales in all other economies would seem to be much less than in the EU, Japan and the USA although growth rates have been greatest in the emerging economies. This suggests that even more so than for reach‐in coolers, sales volumes are strongly related to local cultural factors, and the cost of labour (given that automated vending competes with direct human to human sales), as much as they are to the overall size of the economy.
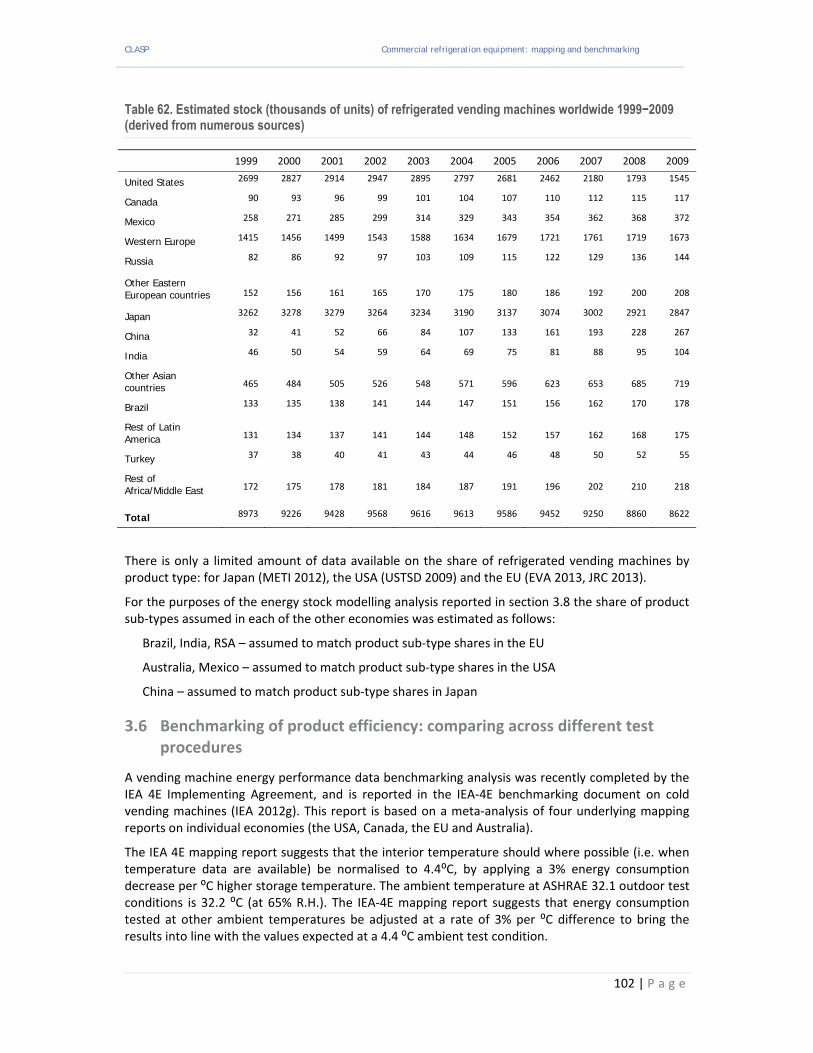
CLASP Commercial refrigeration equipment: mapping and benchmarking
102 | P a g e
Table 62. Estimated stock (thousands of units) of refrigerated vending machines worldwide 1999−2009 (derived from numerous sources)
1999 2000 2001 2002 2003 2004 2005 2006 2007 2008 2009
United States 2699 2827 2914 2947 2895 2797 2681 2462 2180 1793 1545
Canada 90 93 96 99 101 104 107 110 112 115 117
Mexico 258 271 285 299 314 329 343 354 362 368 372
Western Europe 1415 1456 1499 1543 1588 1634 1679 1721 1761 1719 1673
Russia 82 86 92 97 103 109 115 122 129 136 144
Other Eastern European countries 152 156 161 165 170 175 180 186 192 200 208
Japan 3262 3278 3279 3264 3234 3190 3137 3074 3002 2921 2847
China 32 41 52 66 84 107 133 161 193 228 267
India 46 50 54 59 64 69 75 81 88 95 104
Other Asian countries 465 484 505 526 548 571 596 623 653 685 719
Brazil 133 135 138 141 144 147 151 156 162 170 178
Rest of Latin America 131 134 137 141 144 148 152 157 162 168 175
Turkey 37 38 40 41 43 44 46 48 50 52 55
Rest of Africa/Middle East 172 175 178 181 184 187 191 196 202 210 218
Total 8973 9226 9428 9568 9616 9613 9586 9452 9250 8860 8622
There is only a limited amount of data available on the share of refrigerated vending machines by product type: for Japan (METI 2012), the USA (USTSD 2009) and the EU (EVA 2013, JRC 2013).
For the purposes of the energy stock modelling analysis reported in section 3.8 the share of product sub‐types assumed in each of the other economies was estimated as follows:
Brazil, India, RSA – assumed to match product sub‐type shares in the EU
Australia, Mexico – assumed to match product sub‐type shares in the USA
China – assumed to match product sub‐type shares in Japan
3.6 Benchmarking of product efficiency: comparing across different test procedures
A vending machine energy performance data benchmarking analysis was recently completed by the IEA 4E Implementing Agreement, and is reported in the IEA‐4E benchmarking document on cold vending machines (IEA 2012g). This report is based on a meta‐analysis of four underlying mapping reports on individual economies (the USA, Canada, the EU and Australia).
The IEA 4E mapping report suggests that the interior temperature should where possible (i.e. when temperature data are available) be normalised to 4.4⁰C, by applying a 3% energy consumption decrease per ⁰C higher storage temperature. The ambient temperature at ASHRAE 32.1 outdoor test conditions is 32.2 ⁰C (at 65% R.H.). The IEA‐4E mapping report suggests that energy consumption tested at other ambient temperatures be adjusted at a rate of 3% per ⁰C difference to bring the results into line with the values expected at a 4.4 ⁰C ambient test condition.

CLASP Commercial refrigeration equipment: mapping and benchmarking
103 | P a g e
Comparison of the energy performance of vending machines measured under EVA‐EMP or ASHRAE 32.1 is nominally possible after this kind of normalisation.
The results following this kind of adjustment are shown in Table 63, and compare the adjusted average energy consumption of the products in each regional database under a common but arbitrary efficiency metric of the energy used per can stored normalised to the storage of 300 cans. Superficially these results indicate that the EU products are less efficient than the products in the Australian or US Energy Star dataset but this appears to be largely explicable through differences in service (functionality) and may therefore be explained through insufficient product categorisation in the IEA 4E benchmarking analysis.
Table 63. Average normalised energy consumption per 300 cans for cold vending machines at outdoor temperature conditions under ASHRAE 32.1 and at an average product temperature of 4.4°C
Data set No .of models Average consumption per 300 cans (kWh/day)
USA Energy Star (2010) IEA‐4E1 93 3.22
California EC (2010) IEA‐4E 42 5.28
Canada federal database 2010 IEA‐4E 39 4.89
Australia 2009, IEA‐4E mapping report 38 4.02
EU beverage 2011, IEA‐4E mapping report 21 5.63 1 Note the Energy Star database only covers the higher efficiency end of the US market
EU data in the IEA Benchmarking study
The IEA 4E vending machines benchmarking study gives the impression that EU vending machines have a higher energy consumption than other vending machines. In the summary it is noted that “The average European machine is 25% smaller than the Australian one but has only 4 % lower consumption per day.”
Results presented in the US DOE’s energy engineering analysis (USTSD 2009), in which base case vending machines of varying size have been modelled27, indicate that when machines are 25 % smaller, the energy consumption would on average be 6.3 % lower. The benchmark study finds a difference of only 4 %, which would indicate that the EU models actually have a 2.3 % higher energy consumption than their Australian counterparts. However, the prevalence of the type of vending machine sold in each market is likely to have a greater impact. The EU dataset contains relatively more class A models than the other data sets and class A models have a higher energy consumption on average than class B models, as follows:
under the US TSD (2009) energy engineering analysis the base case consumption class A (medium sized) vending machines was 17.4% higher than for class B (medium sized machine)
in the California Energy Commission dataset the average energy consumption of class A vending machines is 18.4% higher than for class B machines
Thus, a dataset containing 62 % class A vending machines (such as the EU 2010 dataset) versus a dataset containing only 15 % class A vending machines (Australian dataset) would show an 8 % higher energy consumption.
27 The DOE engineering analysis considered Class A vending machines of three different sizes: small (300 cans), medium
(400 cans) and large (500 cans), as well as class B machines of three different sizes: small (450 cans), medium (650 cans) and large (800 cans).
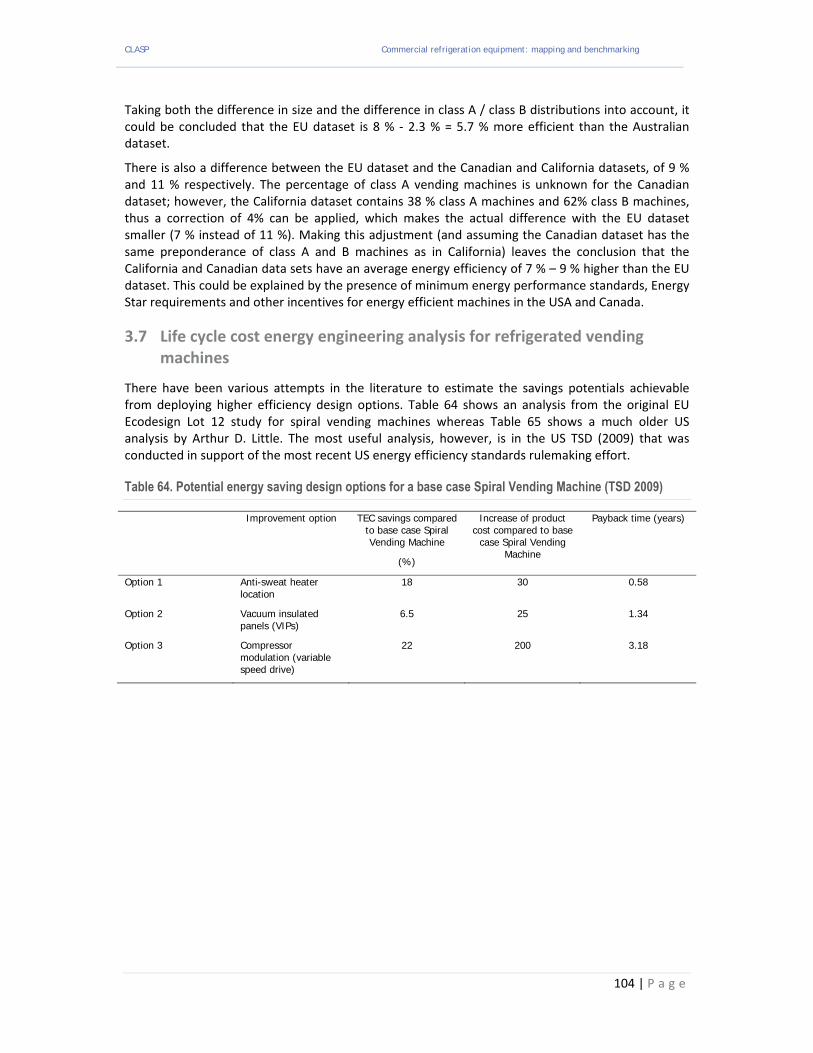
CLASP Commercial refrigeration equipment: mapping and benchmarking
104 | P a g e
Taking both the difference in size and the difference in class A / class B distributions into account, it could be concluded that the EU dataset is 8 % ‐ 2.3 % = 5.7 % more efficient than the Australian dataset.
There is also a difference between the EU dataset and the Canadian and California datasets, of 9 % and 11 % respectively. The percentage of class A vending machines is unknown for the Canadian dataset; however, the California dataset contains 38 % class A machines and 62% class B machines, thus a correction of 4% can be applied, which makes the actual difference with the EU dataset smaller (7 % instead of 11 %). Making this adjustment (and assuming the Canadian dataset has the same preponderance of class A and B machines as in California) leaves the conclusion that the California and Canadian data sets have an average energy efficiency of 7 % – 9 % higher than the EU dataset. This could be explained by the presence of minimum energy performance standards, Energy Star requirements and other incentives for energy efficient machines in the USA and Canada.
3.7 Life cycle cost energy engineering analysis for refrigerated vending machines
There have been various attempts in the literature to estimate the savings potentials achievable from deploying higher efficiency design options. Table 64 shows an analysis from the original EU Ecodesign Lot 12 study for spiral vending machines whereas Table 65 shows a much older US analysis by Arthur D. Little. The most useful analysis, however, is in the US TSD (2009) that was conducted in support of the most recent US energy efficiency standards rulemaking effort.
Table 64. Potential energy saving design options for a base case Spiral Vending Machine (TSD 2009)
Improvement option TEC savings compared to base case Spiral Vending Machine
(%)
Increase of product cost compared to base
case Spiral Vending Machine
Payback time (years)
Option 1 Anti-sweat heater location
18 30 0.58
Option 2 Vacuum insulated panels (VIPs)
6.5 25 1.34
Option 3 Compressor modulation (variable speed drive)
22 200 3.18
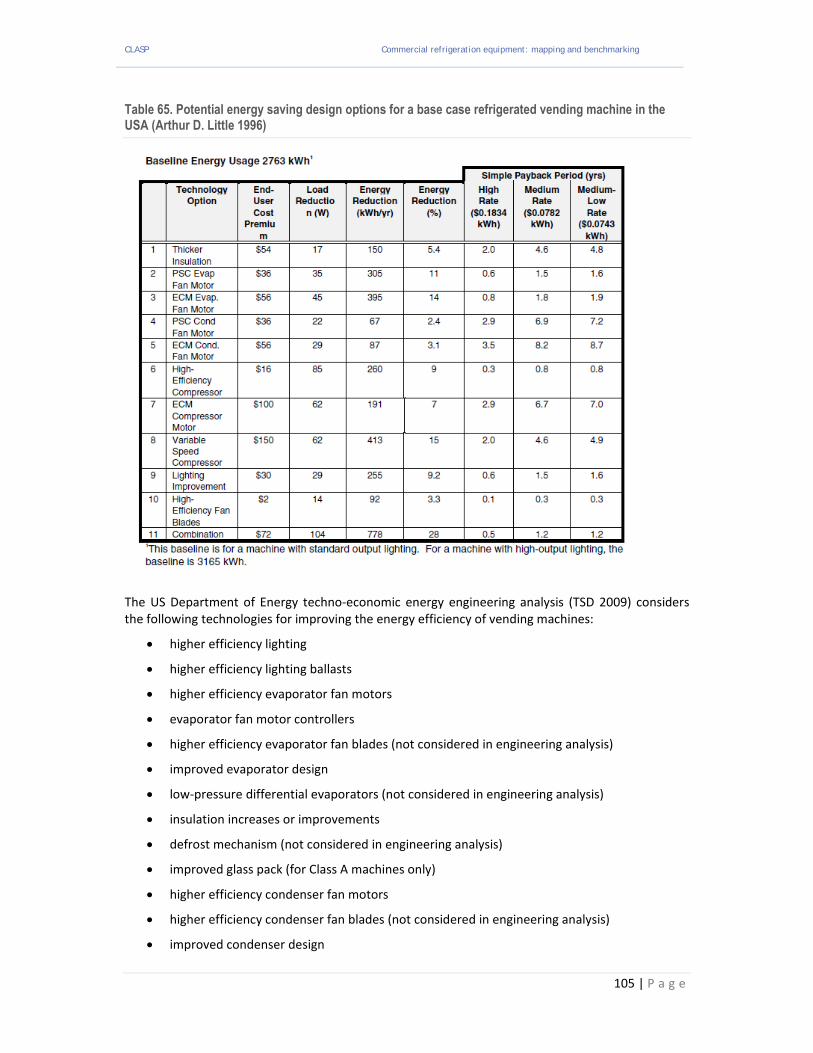
CLASP Commercial refrigeration equipment: mapping and benchmarking
105 | P a g e
Table 65. Potential energy saving design options for a base case refrigerated vending machine in the USA (Arthur D. Little 1996)
The US Department of Energy techno‐economic energy engineering analysis (TSD 2009) considers the following technologies for improving the energy efficiency of vending machines:
higher efficiency lighting
higher efficiency lighting ballasts
higher efficiency evaporator fan motors
evaporator fan motor controllers
higher efficiency evaporator fan blades (not considered in engineering analysis)
improved evaporator design
low‐pressure differential evaporators (not considered in engineering analysis)
insulation increases or improvements
defrost mechanism (not considered in engineering analysis)
improved glass pack (for Class A machines only)
higher efficiency condenser fan motors
higher efficiency condenser fan blades (not considered in engineering analysis)
improved condenser design

CLASP Commercial refrigeration equipment: mapping and benchmarking
106 | P a g e
higher efficiency compressors
For these options, the USDOE performed a detailed engineering analysis for both class A (glass front) and class B (opaque front) vending machines, with three size options per class (small, medium, large). The characteristics of the base case appliances considered in this analysis are presented in the first three rows of data in Table 66.
Table 66. Characteristics of base case refrigerated vending machines considered in the US TSD (2009)
DOE 2009 Basecase Fully refrigerated (glass front) Zone refrigerated, opaque
Class – size A-small A-med A-large B=small B-med B-large
Energy Consumption (kWh/day, 75 ⁰F ) 6.10 6.53 6.75 4.96 5.56 5.85
Refrigerated Volume (ft3) 17 22 34 17 22 26
Capacity (12 oz. cans) 300 400 500 450 650 800
Energy Star Tier 2 (kWh/d) 5.11 5.52 5.92 5.72 6.53 7.14
Energy Star ‘2013 (kWh/d) 3.32 3.58 4.21 3.96 4.29 4.55
*) DOE base cases were designed (in consumption) to fulfil the then Energy Star Tier 1 requirements, which were 22 % above Tier 2 energy consumption requirements.
From the LCC results of the DOE engineering analysis, the savings percentages for the different design options can be calculated and shown in Table 67. The savings percentages shown in this table have been calculated for medium size machines (except for the option of evaporator fan control, which was already present in the medium size base case model but not in the small size units).
Table 67. Potential energy saving design options for refrigerated vending machines in the USA compared to a base case vending machine (US TSD 2009)
Design option Saving in class A Saving in class B
Evaporator fan control 7.0 % -
High performance evaporator coil 8.6 % -
T8 lighting -> Super T8 lighting 2.7 % -
High efficiency compressor 1.9 % 1.5 %
ECM evaporator fan motor 3.3 % 6.5 %
Super T8 lighting -> LED lighting 24 % 10.6 %
High performance condenser coil 5.7 % 4.6 %
Add 1/8 inch of insulation 3.0 % 2.5 %
ECM condenser fan motor 1.0 % 0.8 %
Super-enhanced doors (glass) 7.1 % -
Aerogel insulation 2.6 % 2.4 %
The requirement in the test standards used in the rulemaking that vending machines must be tested under factory settings and not using adjustable user settings will have impeded consideration of energy saving design options that power down the machines during night periods or whenever consumers are not present. However, the advent of cheap electronics and improved sensors is opening new opportunities for automatic (low energy) response to such factors. Thus there is likely to be a considerable potential for cost‐effective energy saving using such technologies in reality.
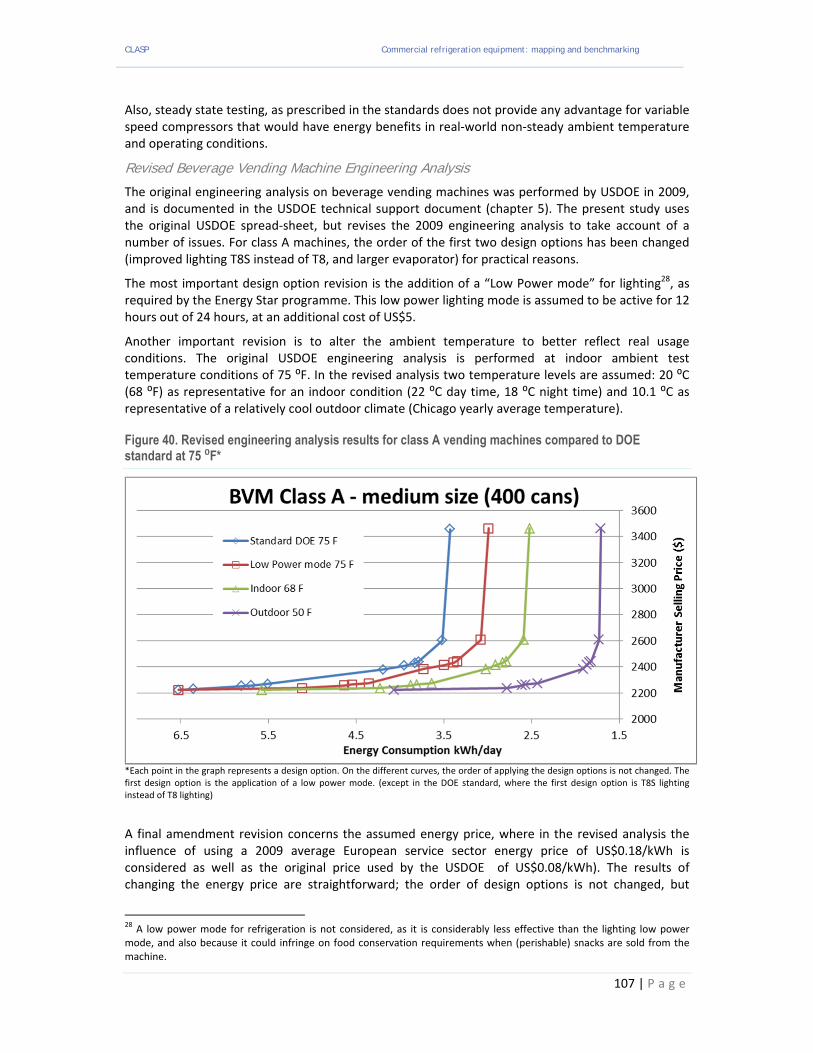
CLASP Commercial refrigeration equipment: mapping and benchmarking
107 | P a g e
Also, steady state testing, as prescribed in the standards does not provide any advantage for variable speed compressors that would have energy benefits in real‐world non‐steady ambient temperature and operating conditions.
Revised Beverage Vending Machine Engineering Analysis
The original engineering analysis on beverage vending machines was performed by USDOE in 2009, and is documented in the USDOE technical support document (chapter 5). The present study uses the original USDOE spread‐sheet, but revises the 2009 engineering analysis to take account of a number of issues. For class A machines, the order of the first two design options has been changed (improved lighting T8S instead of T8, and larger evaporator) for practical reasons.
The most important design option revision is the addition of a “Low Power mode” for lighting28, as required by the Energy Star programme. This low power lighting mode is assumed to be active for 12 hours out of 24 hours, at an additional cost of US$5.
Another important revision is to alter the ambient temperature to better reflect real usage conditions. The original USDOE engineering analysis is performed at indoor ambient test temperature conditions of 75 ⁰F. In the revised analysis two temperature levels are assumed: 20 ⁰C (68 ⁰F) as representative for an indoor condition (22 ⁰C day time, 18 ⁰C night time) and 10.1 ⁰C as representative of a relatively cool outdoor climate (Chicago yearly average temperature).
Figure 40. Revised engineering analysis results for class A vending machines compared to DOE standard at 75 ⁰F*
*Each point in the graph represents a design option. On the different curves, the order of applying the design options is not changed. The first design option is the application of a low power mode. (except in the DOE standard, where the first design option is T8S lighting instead of T8 lighting)
A final amendment revision concerns the assumed energy price, where in the revised analysis the influence of using a 2009 average European service sector energy price of US$0.18/kWh is considered as well as the original price used by the USDOE of US$0.08/kWh). The results of changing the energy price are straightforward; the order of design options is not changed, but
28 A low power mode for refrigeration is not considered, as it is considerably less effective than the lighting low power
mode, and also because it could infringe on food conservation requirements when (perishable) snacks are sold from the machine.
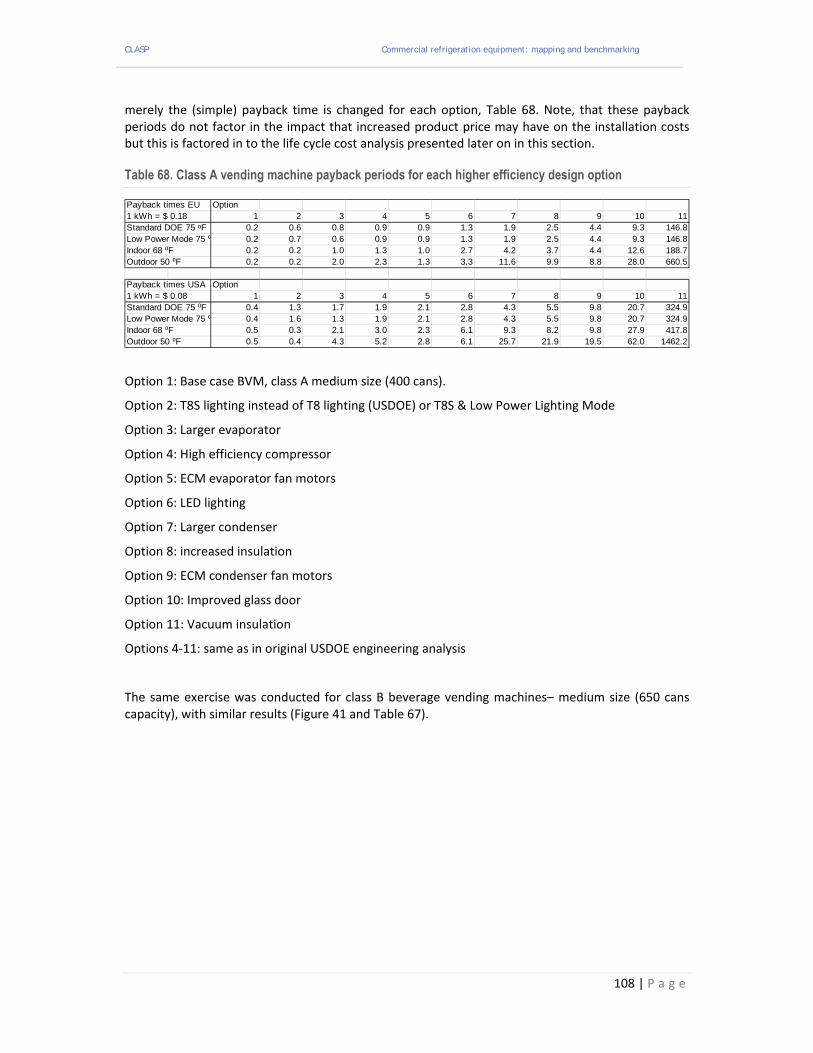
CLASP Commercial refrigeration equipment: mapping and benchmarking
108 | P a g e
merely the (simple) payback time is changed for each option, Table 68. Note, that these payback periods do not factor in the impact that increased product price may have on the installation costs but this is factored in to the life cycle cost analysis presented later on in this section.
Table 68. Class A vending machine payback periods for each higher efficiency design option
Option 1: Base case BVM, class A medium size (400 cans).
Option 2: T8S lighting instead of T8 lighting (USDOE) or T8S & Low Power Lighting Mode
Option 3: Larger evaporator
Option 4: High efficiency compressor
Option 5: ECM evaporator fan motors
Option 6: LED lighting
Option 7: Larger condenser
Option 8: increased insulation
Option 9: ECM condenser fan motors
Option 10: Improved glass door
Option 11: Vacuum insulation
Options 4‐11: same as in original USDOE engineering analysis
The same exercise was conducted for class B beverage vending machines– medium size (650 cans capacity), with similar results (Figure 41 and Table 67).
Payback times EU Option1 kWh = $ 0.18 1 2 3 4 5 6 7 8 9 10 11Standard DOE 75 ⁰F 0.2 0.6 0.8 0.9 0.9 1.3 1.9 2.5 4.4 9.3 146.8Low Power Mode 75 ⁰ 0.2 0.7 0.6 0.9 0.9 1.3 1.9 2.5 4.4 9.3 146.8Indoor 68 ⁰F 0.2 0.2 1.0 1.3 1.0 2.7 4.2 3.7 4.4 12.6 188.7Outdoor 50 ⁰F 0.2 0.2 2.0 2.3 1.3 3.3 11.6 9.9 8.8 28.0 660.5
Payback times USA Option1 kWh = $ 0.08 1 2 3 4 5 6 7 8 9 10 11Standard DOE 75 ⁰F 0.4 1.3 1.7 1.9 2.1 2.8 4.3 5.5 9.8 20.7 324.9Low Power Mode 75 ⁰ 0.4 1.6 1.3 1.9 2.1 2.8 4.3 5.5 9.8 20.7 324.9Indoor 68 ⁰F 0.5 0.3 2.1 3.0 2.3 6.1 9.3 8.2 9.8 27.9 417.8Outdoor 50 ⁰F 0.5 0.4 4.3 5.2 2.8 6.1 25.7 21.9 19.5 62.0 1462.2
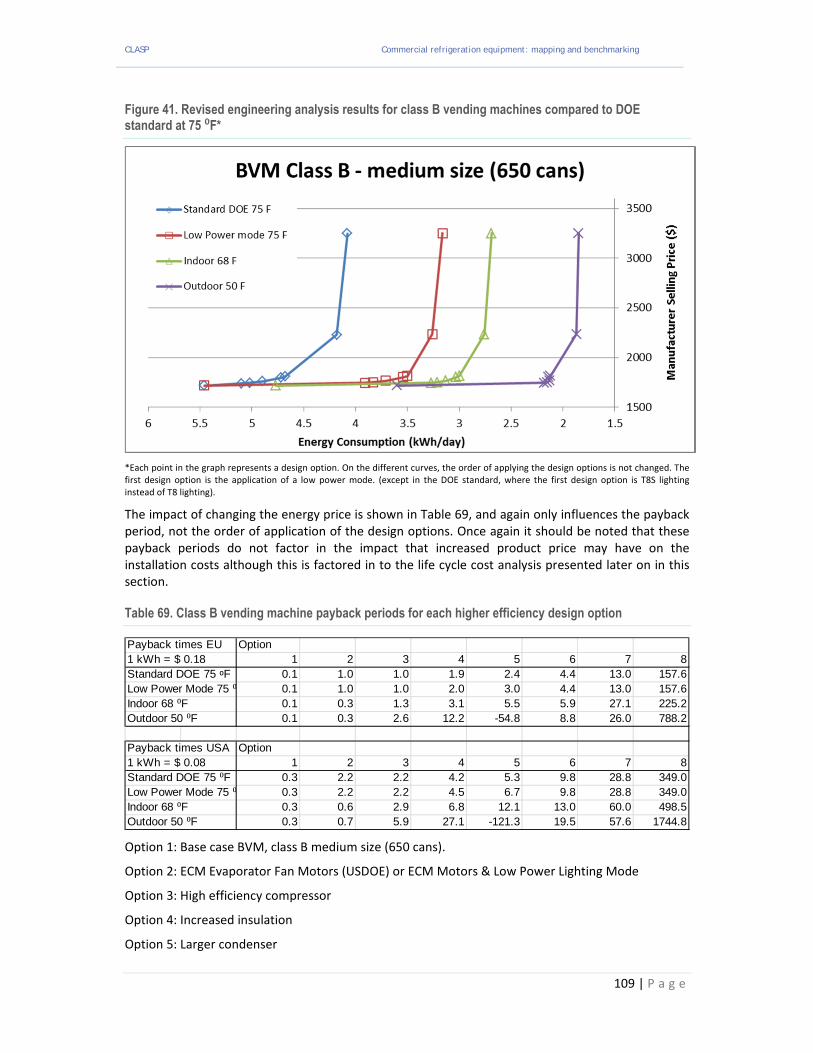
CLASP Commercial refrigeration equipment: mapping and benchmarking
109 | P a g e
Figure 41. Revised engineering analysis results for class B vending machines compared to DOE standard at 75 ⁰F*
*Each point in the graph represents a design option. On the different curves, the order of applying the design options is not changed. The first design option is the application of a low power mode. (except in the DOE standard, where the first design option is T8S lighting instead of T8 lighting).
The impact of changing the energy price is shown in Table 69, and again only influences the payback period, not the order of application of the design options. Once again it should be noted that these payback periods do not factor in the impact that increased product price may have on the installation costs although this is factored in to the life cycle cost analysis presented later on in this section.
Table 69. Class B vending machine payback periods for each higher efficiency design option
Option 1: Base case BVM, class B medium size (650 cans).
Option 2: ECM Evaporator Fan Motors (USDOE) or ECM Motors & Low Power Lighting Mode
Option 3: High efficiency compressor
Option 4: Increased insulation
Option 5: Larger condenser
Payback times EU Option1 kWh = $ 0.18 1 2 3 4 5 6 7 8Standard DOE 75 ⁰F 0.1 1.0 1.0 1.9 2.4 4.4 13.0 157.6Low Power Mode 75 ⁰ 0.1 1.0 1.0 2.0 3.0 4.4 13.0 157.6Indoor 68 ⁰F 0.1 0.3 1.3 3.1 5.5 5.9 27.1 225.2Outdoor 50 ⁰F 0.1 0.3 2.6 12.2 -54.8 8.8 26.0 788.2
Payback times USA Option1 kWh = $ 0.08 1 2 3 4 5 6 7 8Standard DOE 75 ⁰F 0.3 2.2 2.2 4.2 5.3 9.8 28.8 349.0Low Power Mode 75 ⁰ 0.3 2.2 2.2 4.5 6.7 9.8 28.8 349.0Indoor 68 ⁰F 0.3 0.6 2.9 6.8 12.1 13.0 60.0 498.5Outdoor 50 ⁰F 0.3 0.7 5.9 27.1 -121.3 19.5 57.6 1744.8

CLASP Commercial refrigeration equipment: mapping and benchmarking
110 | P a g e
Option 6: ECM condenser fan motors
Option 7: LED lighting
Option 8: Vacuum insulation
Options 3 ‐ 8: same as in original USDOE engineering analysis
Life cycle cost curves
Life cycle cost curves can be produced, for both class A and class B vending machines, from the revised engineering analysis results, Figures 42 to 45. The assumed mark‐up on manufacturer selling price, installation costs, yearly service and maintenance costs and average life of beverage vending machines as the same as in the original USDOE TSD. Two levels of energy costs are considered: US$ 0.08/kWh (to illustrate the US case) and US$ 0.18/kWh (to illustrate the EU case).
Figure 42: LCC curves for BVM class A at an energy price of $ 0.08 / kWh
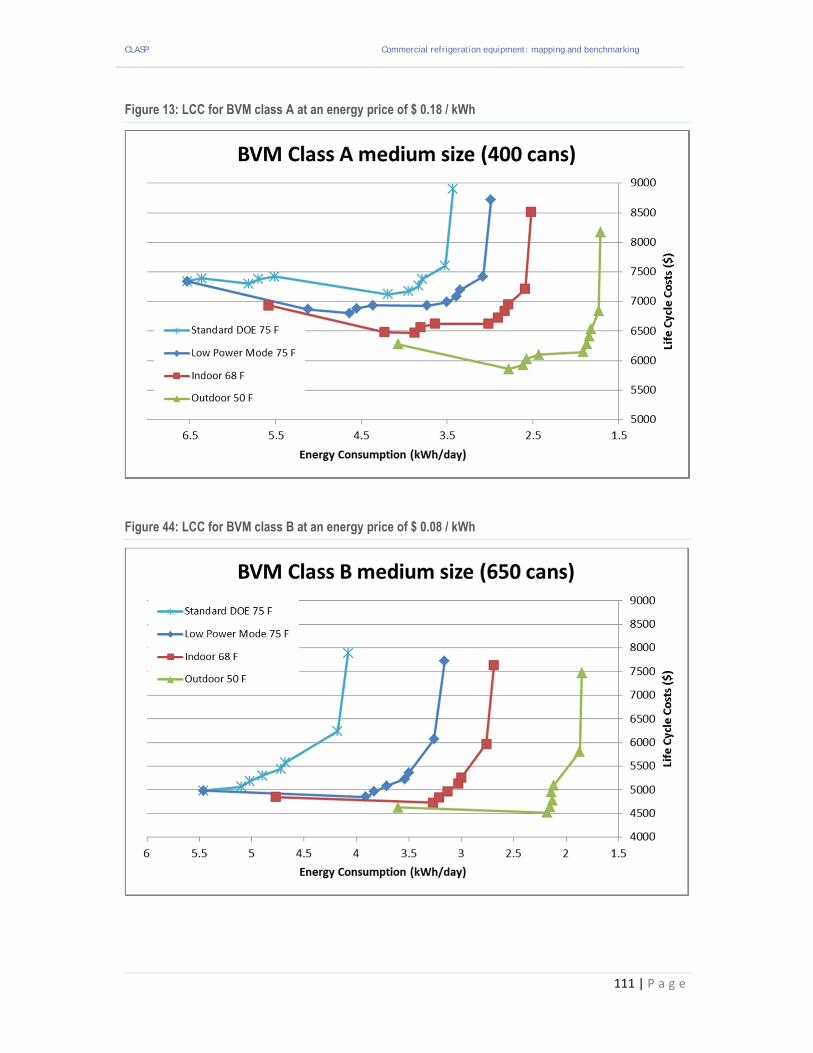
CLASP Commercial refrigeration equipment: mapping and benchmarking
111 | P a g e
Figure 13: LCC for BVM class A at an energy price of $ 0.18 / kWh
Figure 44: LCC for BVM class B at an energy price of $ 0.08 / kWh

CLASP Commercial refrigeration equipment: mapping and benchmarking
112 | P a g e
Figure 45: LCC for BVM class B at an energy price of $ 0.18 / kWh
The life cycle cost minimum occurs for the first option (the low power lighting mode) for all the cases of class B machine considered.
For class A machines – except in the original USDOE analysis – the LCC minimum either occurs for the low power lighting mode option or at the option following that (the high efficiency compressor). The LCC minimum is more pronounced at higher energy prices and lower temperatures.
3.8 Potential for energy savings at the macro scale
The total energy consumption of refrigerated vending machines was estimated and forecast for all of the targeted economies for this analysis under three scenarios as follows:
Business As Usual Scenario – this assumes no new policies to promote energy efficiency for refrigerated vending machines other than those already implemented
Least Life Cycle Cost Scenario – this assumes that from 2014 onwards all new products sold are at the energy efficiency level associated with the least life cycle cost from an end‐users perspective
Maximum Technical Efficiency Scenario – this assumes all new products sold from 2014 onwards are at the maximum technically achievable efficiency today, i.e. in 2013
The total forecast energy consumption per economy under the Business as Usual Scenario is shown in Table 70 and the total energy savings compared under the Least Life Cycle Cost Scenario and Maximum Technical Efficiency Scenario respectively compared to the Business as Usual case are shown in Tables 71 and 72.
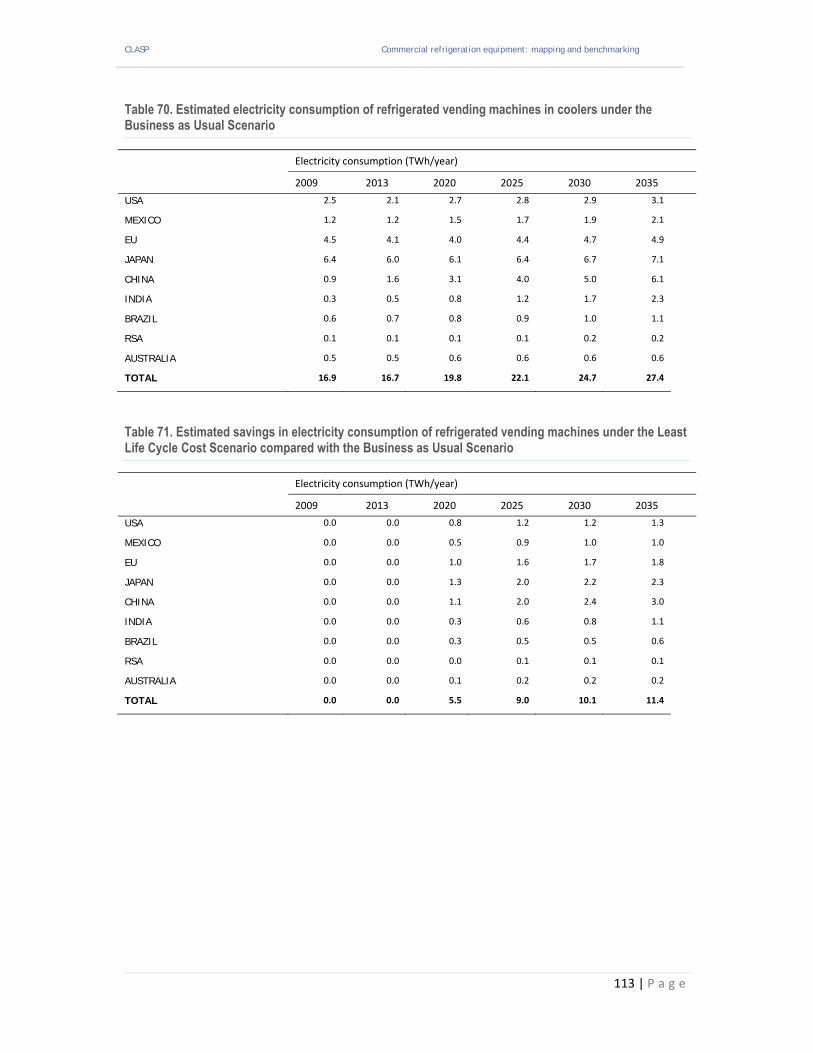
CLASP Commercial refrigeration equipment: mapping and benchmarking
113 | P a g e
Table 70. Estimated electricity consumption of refrigerated vending machines in coolers under the Business as Usual Scenario
Electricity consumption (TWh/year)
2009 2013 2020 2025 2030 2035
USA 2.5 2.1 2.7 2.8 2.9 3.1
MEXICO 1.2 1.2 1.5 1.7 1.9 2.1
EU 4.5 4.1 4.0 4.4 4.7 4.9
JAPAN 6.4 6.0 6.1 6.4 6.7 7.1
CHINA 0.9 1.6 3.1 4.0 5.0 6.1
INDIA 0.3 0.5 0.8 1.2 1.7 2.3
BRAZIL 0.6 0.7 0.8 0.9 1.0 1.1
RSA 0.1 0.1 0.1 0.1 0.2 0.2
AUSTRALIA 0.5 0.5 0.6 0.6 0.6 0.6
TOTAL 16.9 16.7 19.8 22.1 24.7 27.4
Table 71. Estimated savings in electricity consumption of refrigerated vending machines under the Least Life Cycle Cost Scenario compared with the Business as Usual Scenario
Electricity consumption (TWh/year)
2009 2013 2020 2025 2030 2035
USA 0.0 0.0 0.8 1.2 1.2 1.3
MEXICO 0.0 0.0 0.5 0.9 1.0 1.0
EU 0.0 0.0 1.0 1.6 1.7 1.8
JAPAN 0.0 0.0 1.3 2.0 2.2 2.3
CHINA 0.0 0.0 1.1 2.0 2.4 3.0
INDIA 0.0 0.0 0.3 0.6 0.8 1.1
BRAZIL 0.0 0.0 0.3 0.5 0.5 0.6
RSA 0.0 0.0 0.0 0.1 0.1 0.1
AUSTRALIA 0.0 0.0 0.1 0.2 0.2 0.2
TOTAL 0.0 0.0 5.5 9.0 10.1 11.4

CLASP Commercial refrigeration equipment: mapping and benchmarking
114 | P a g e
Table 72. Estimated savings in electricity consumption of refrigerated vending machines under the Maximum Technical Potential Scenario compared with the Business as Usual Scenario
Electricity consumption (TWh/year)
2009 2013 2020 2025 2030 2035
USA 0.0 0.0 0.9 1.4 1.5 1.5
MEXICO 0.0 0.0 0.8 1.3 1.5 1.6
EU 0.0 0.0 1.9 3.0 3.1 3.3
JAPAN 0.0 0.0 2.6 4.1 4.3 4.5
CHINA 0.0 0.0 1.7 3.0 3.7 4.6
INDIA 0.0 0.0 0.5 0.9 1.3 1.7
BRAZIL 0.0 0.0 0.4 0.7 0.7 0.8
RSA 0.0 0.0 0.1 0.1 0.1 0.1
AUSTRALIA 0.0 0.0 0.2 0.3 0.3 0.3
TOTAL 0.0 0.0 9.0 14.7 16.5 18.5
For refrigerated vending machines, the Least Life Cycle Cost Scenario shows energy savings of 11.4 TWh (42%) and the Maximum Technical Potential Scenario shows energy savings of 18.5 TWh (67%) compared to Business As Usual.
Modelling and assumptions
Modelling these savings was done using a time‐series stock model that was adapted from the model used to produce the US national impacts analysis in support of the most recent DOE rulemaking29. For each economy, sales data were used to generate stock data assuming an average 8 year product life span. In some cases sales value time series data was converted into unit sales time series data by using information on the typical unit price per product type (usually derived from US or EU data). Whenever possible the resulting stock values were corroborated against other available stock or unit sales data (this was the case for Japan, the USA, the EU, Brazil and Australia) and in these cases the stock/sales estimates from the sales value data were found to agree with the independent estimates within +/‐15%. Although the independent stock size estimates were used in preference to the model projections in those markets where such data were available, the closeness of the results gives a certain degree of confidence in the projections made for those markets where such data were not available.
Projections of refrigerated vending machine stocks were then derived for class A and class B machines based on what was known about the relative sales shares of refrigerated vending machine types in each market. In several cases these data are not available (Brazil, China, India, Japan, Mexico, RSA) and hence was estimated by using the distribution of class A and class B machines in other economies as a proxy.
Energy consumption per refrigerated vending machine type was derived by first adjusting all test procedure energy consumption data to values that would be expected in situ (i.e. in the locations where the appliances are installed) by applying the ambient temperature correction functions explained in section 3.2. The consumption by product type was then adjusted for: a) any known differences in the average product size by economy from the US data, b) any known differences in efficiency by product type compared to the US average. Both of these sets of derived estimates have considerable uncertainties attached to them. Differences in average product size are calculated compared to the US model from the various data sources assembled in the study. Estimates of the
29 http://www.regulations.gov/#!documentDetail;D=EERE‐2006‐STD‐0125‐0080

CLASP Commercial refrigeration equipment: mapping and benchmarking
115 | P a g e
average difference in product efficiency are highly uncertain in many cases as the data sets used are patchy or incomplete. The uncertainty in all these factors could result in there being significant errors in the base case (business as usual) efficiency level and unit average energy consumption assumed in the Business as Usual Scenario.
For both the Least Life Cycle Cost scenario and the Maximum Technical Efficiency Scenario it is assumed that new products sold up to 2014 are at the Business As Usual Scenario efficiency level and that after 2014 they are at the efficiency associated with the Least Life Cycle Cost or the Maximum Technically Achievable level respectively. The analysis presented in section 3.7 is used to derive these values but in the case of the Least Life Cycle Cost scenario the efficiency level of LLCC varies by economy depending on the average electricity tariff (for the sake of simplicity product costs are assumed to be the same as in the USA for all economies except the EU (where EU data were available and used) although adjusted for differences in average product size – thus variations in labour, transport and material costs are not considered and nor are variations in production/distribution margins and other local factors considered). For both the LLCC and Maximum Technical Efficiency Scenarios it is (conservatively) assumed that there is no ongoing learning effect i.e. that the incremental costs of more efficient products remain unchanged over time and that there is no long term improvement in the maximum efficiency level attainable. Neither of these assumptions is likely to be accurate as the incremental cost of efficiency will most likely decline over time and new technology will enable higher efficiency products to be produced.
The energy consumption under the business as usual scenario is shown in Figure 46, whereas Figures 47 and 48 shows the savings projected under the least life cycle cost and maximum technically achievable efficiency scenarios respectively.
Figure 46. Estimated energy consumption for Refrigerated Vending Machines in the nine SEAD economies under the Business as Usual scenario.

CLASP Commercial refrigeration equipment: mapping and benchmarking
116 | P a g e
Figure 47. Estimated savings in energy consumption for Refrigerated Vending Machines in the nine SEAD economies under the Least Life Cycle Cost scenario compared to the Business as Usual Scenario.
Figure 48. Estimated savings in energy consumption for Refrigerated Vending Machines in the nine SEAD economies under the Maximum Technical Efficiency scenario compared to the Business as Usual Scenario.
CLASP Commercial refrigeration equipment: mapping and benchmarking
117 | P a g e
Appendix A: Life cycle costs for reach‐in coolers as a function of energy efficiency
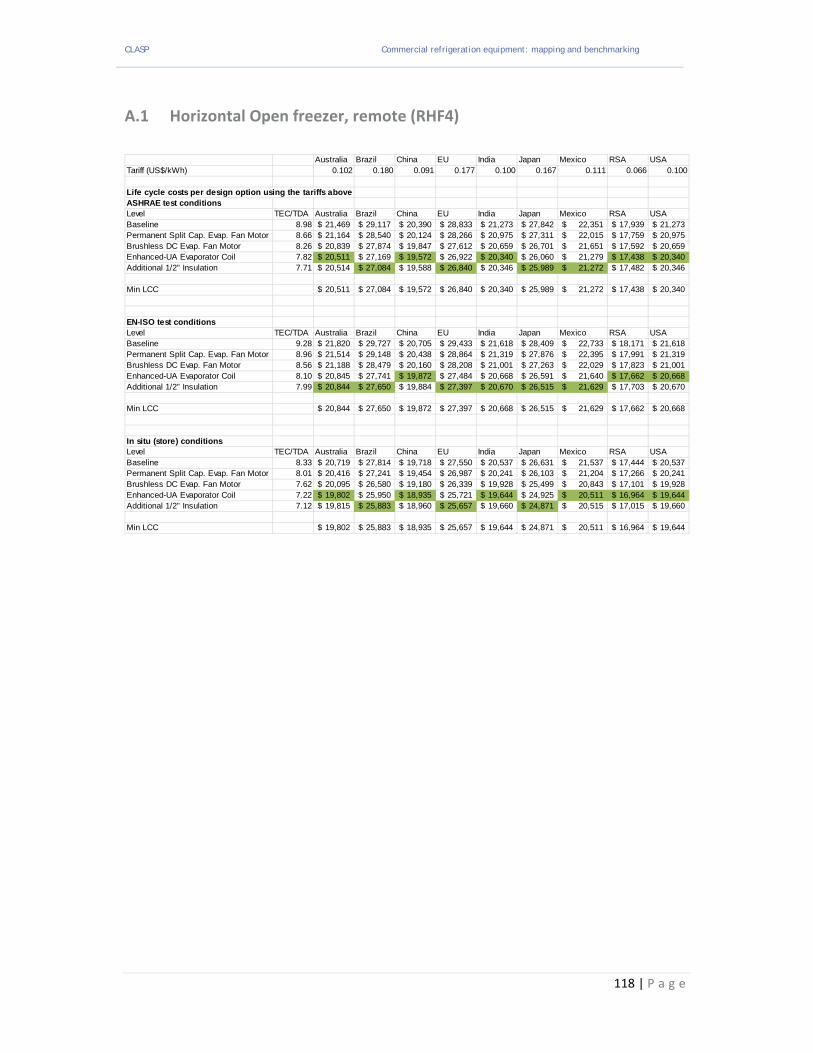
CLASP Commercial refrigeration equipment: mapping and benchmarking
118 | P a g e
A.1 Horizontal Open freezer, remote (RHF4)
Australia Brazil China EU India Japan Mexico RSA USATariff (US$/kWh) 0.102 0.180 0.091 0.177 0.100 0.167 0.111 0.066 0.100
Life cycle costs per design option using the tariffs aboveASHRAE test conditionsLevel TEC/TDA Australia Brazil China EU India Japan Mexico RSA USABaseline 8.98 21,469$ 29,117$ 20,390$ 28,833$ 21,273$ 27,842$ 22,351$ 17,939$ 21,273$ Permanent Split Cap. Evap. Fan Motor 8.66 21,164$ 28,540$ 20,124$ 28,266$ 20,975$ 27,311$ 22,015$ 17,759$ 20,975$ Brushless DC Evap. Fan Motor 8.26 20,839$ 27,874$ 19,847$ 27,612$ 20,659$ 26,701$ 21,651$ 17,592$ 20,659$ Enhanced-UA Evaporator Coil 7.82 20,511$ 27,169$ 19,572$ 26,922$ 20,340$ 26,060$ 21,279$ 17,438$ 20,340$ Additional 1/2" Insulation 7.71 20,514$ 27,084$ 19,588$ 26,840$ 20,346$ 25,989$ 21,272$ 17,482$ 20,346$
Min LCC 20,511$ 27,084$ 19,572$ 26,840$ 20,340$ 25,989$ 21,272$ 17,438$ 20,340$
EN-ISO test conditionsLevel TEC/TDA Australia Brazil China EU India Japan Mexico RSA USABaseline 9.28 21,820$ 29,727$ 20,705$ 29,433$ 21,618$ 28,409$ 22,733$ 18,171$ 21,618$ Permanent Split Cap. Evap. Fan Motor 8.96 21,514$ 29,148$ 20,438$ 28,864$ 21,319$ 27,876$ 22,395$ 17,991$ 21,319$ Brushless DC Evap. Fan Motor 8.56 21,188$ 28,479$ 20,160$ 28,208$ 21,001$ 27,263$ 22,029$ 17,823$ 21,001$ Enhanced-UA Evaporator Coil 8.10 20,845$ 27,741$ 19,872$ 27,484$ 20,668$ 26,591$ 21,640$ 17,662$ 20,668$ Additional 1/2" Insulation 7.99 20,844$ 27,650$ 19,884$ 27,397$ 20,670$ 26,515$ 21,629$ 17,703$ 20,670$
Min LCC 20,844$ 27,650$ 19,872$ 27,397$ 20,668$ 26,515$ 21,629$ 17,662$ 20,668$
In situ (store) conditionsLevel TEC/TDA Australia Brazil China EU India Japan Mexico RSA USABaseline 8.33 20,719$ 27,814$ 19,718$ 27,550$ 20,537$ 26,631$ 21,537$ 17,444$ 20,537$ Permanent Split Cap. Evap. Fan Motor 8.01 20,416$ 27,241$ 19,454$ 26,987$ 20,241$ 26,103$ 21,204$ 17,266$ 20,241$ Brushless DC Evap. Fan Motor 7.62 20,095$ 26,580$ 19,180$ 26,339$ 19,928$ 25,499$ 20,843$ 17,101$ 19,928$ Enhanced-UA Evaporator Coil 7.22 19,802$ 25,950$ 18,935$ 25,721$ 19,644$ 24,925$ 20,511$ 16,964$ 19,644$ Additional 1/2" Insulation 7.12 19,815$ 25,883$ 18,960$ 25,657$ 19,660$ 24,871$ 20,515$ 17,015$ 19,660$
Min LCC 19,802$ 25,883$ 18,935$ 25,657$ 19,644$ 24,871$ 20,511$ 16,964$ 19,644$
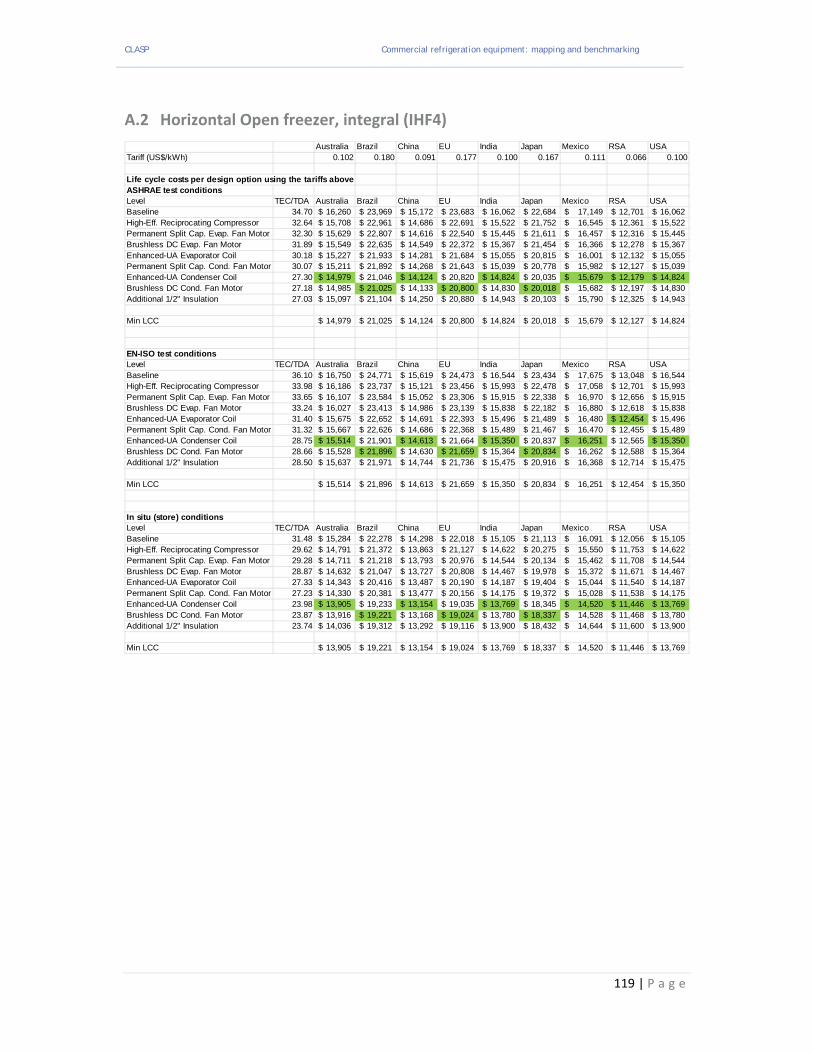
CLASP Commercial refrigeration equipment: mapping and benchmarking
119 | P a g e
A.2 Horizontal Open freezer, integral (IHF4)
Australia Brazil China EU India Japan Mexico RSA USATariff (US$/kWh) 0.102 0.180 0.091 0.177 0.100 0.167 0.111 0.066 0.100
Life cycle costs per design option using the tariffs aboveASHRAE test conditionsLevel TEC/TDA Australia Brazil China EU India Japan Mexico RSA USABaseline 34.70 16,260$ 23,969$ 15,172$ 23,683$ 16,062$ 22,684$ 17,149$ 12,701$ 16,062$ High-Eff. Reciprocating Compressor 32.64 15,708$ 22,961$ 14,686$ 22,691$ 15,522$ 21,752$ 16,545$ 12,361$ 15,522$ Permanent Split Cap. Evap. Fan Motor 32.30 15,629$ 22,807$ 14,616$ 22,540$ 15,445$ 21,611$ 16,457$ 12,316$ 15,445$ Brushless DC Evap. Fan Motor 31.89 15,549$ 22,635$ 14,549$ 22,372$ 15,367$ 21,454$ 16,366$ 12,278$ 15,367$ Enhanced-UA Evaporator Coil 30.18 15,227$ 21,933$ 14,281$ 21,684$ 15,055$ 20,815$ 16,001$ 12,132$ 15,055$ Permanent Split Cap. Cond. Fan Motor 30.07 15,211$ 21,892$ 14,268$ 21,643$ 15,039$ 20,778$ 15,982$ 12,127$ 15,039$ Enhanced-UA Condenser Coil 27.30 14,979$ 21,046$ 14,124$ 20,820$ 14,824$ 20,035$ 15,679$ 12,179$ 14,824$ Brushless DC Cond. Fan Motor 27.18 14,985$ 21,025$ 14,133$ 20,800$ 14,830$ 20,018$ 15,682$ 12,197$ 14,830$ Additional 1/2" Insulation 27.03 15,097$ 21,104$ 14,250$ 20,880$ 14,943$ 20,103$ 15,790$ 12,325$ 14,943$
Min LCC 14,979$ 21,025$ 14,124$ 20,800$ 14,824$ 20,018$ 15,679$ 12,127$ 14,824$
EN-ISO test conditionsLevel TEC/TDA Australia Brazil China EU India Japan Mexico RSA USABaseline 36.10 16,750$ 24,771$ 15,619$ 24,473$ 16,544$ 23,434$ 17,675$ 13,048$ 16,544$ High-Eff. Reciprocating Compressor 33.98 16,186$ 23,737$ 15,121$ 23,456$ 15,993$ 22,478$ 17,058$ 12,701$ 15,993$ Permanent Split Cap. Evap. Fan Motor 33.65 16,107$ 23,584$ 15,052$ 23,306$ 15,915$ 22,338$ 16,970$ 12,656$ 15,915$ Brushless DC Evap. Fan Motor 33.24 16,027$ 23,413$ 14,986$ 23,139$ 15,838$ 22,182$ 16,880$ 12,618$ 15,838$ Enhanced-UA Evaporator Coil 31.40 15,675$ 22,652$ 14,691$ 22,393$ 15,496$ 21,489$ 16,480$ 12,454$ 15,496$ Permanent Split Cap. Cond. Fan Motor 31.32 15,667$ 22,626$ 14,686$ 22,368$ 15,489$ 21,467$ 16,470$ 12,455$ 15,489$ Enhanced-UA Condenser Coil 28.75 15,514$ 21,901$ 14,613$ 21,664$ 15,350$ 20,837$ 16,251$ 12,565$ 15,350$ Brushless DC Cond. Fan Motor 28.66 15,528$ 21,896$ 14,630$ 21,659$ 15,364$ 20,834$ 16,262$ 12,588$ 15,364$ Additional 1/2" Insulation 28.50 15,637$ 21,971$ 14,744$ 21,736$ 15,475$ 20,916$ 16,368$ 12,714$ 15,475$
Min LCC 15,514$ 21,896$ 14,613$ 21,659$ 15,350$ 20,834$ 16,251$ 12,454$ 15,350$
In situ (store) conditionsLevel TEC/TDA Australia Brazil China EU India Japan Mexico RSA USABaseline 31.48 15,284$ 22,278$ 14,298$ 22,018$ 15,105$ 21,113$ 16,091$ 12,056$ 15,105$ High-Eff. Reciprocating Compressor 29.62 14,791$ 21,372$ 13,863$ 21,127$ 14,622$ 20,275$ 15,550$ 11,753$ 14,622$ Permanent Split Cap. Evap. Fan Motor 29.28 14,711$ 21,218$ 13,793$ 20,976$ 14,544$ 20,134$ 15,462$ 11,708$ 14,544$ Brushless DC Evap. Fan Motor 28.87 14,632$ 21,047$ 13,727$ 20,808$ 14,467$ 19,978$ 15,372$ 11,671$ 14,467$ Enhanced-UA Evaporator Coil 27.33 14,343$ 20,416$ 13,487$ 20,190$ 14,187$ 19,404$ 15,044$ 11,540$ 14,187$ Permanent Split Cap. Cond. Fan Motor 27.23 14,330$ 20,381$ 13,477$ 20,156$ 14,175$ 19,372$ 15,028$ 11,538$ 14,175$ Enhanced-UA Condenser Coil 23.98 13,905$ 19,233$ 13,154$ 19,035$ 13,769$ 18,345$ 14,520$ 11,446$ 13,769$ Brushless DC Cond. Fan Motor 23.87 13,916$ 19,221$ 13,168$ 19,024$ 13,780$ 18,337$ 14,528$ 11,468$ 13,780$ Additional 1/2" Insulation 23.74 14,036$ 19,312$ 13,292$ 19,116$ 13,900$ 18,432$ 14,644$ 11,600$ 13,900$
Min LCC 13,905$ 19,221$ 13,154$ 19,024$ 13,769$ 18,337$ 14,520$ 11,446$ 13,769$
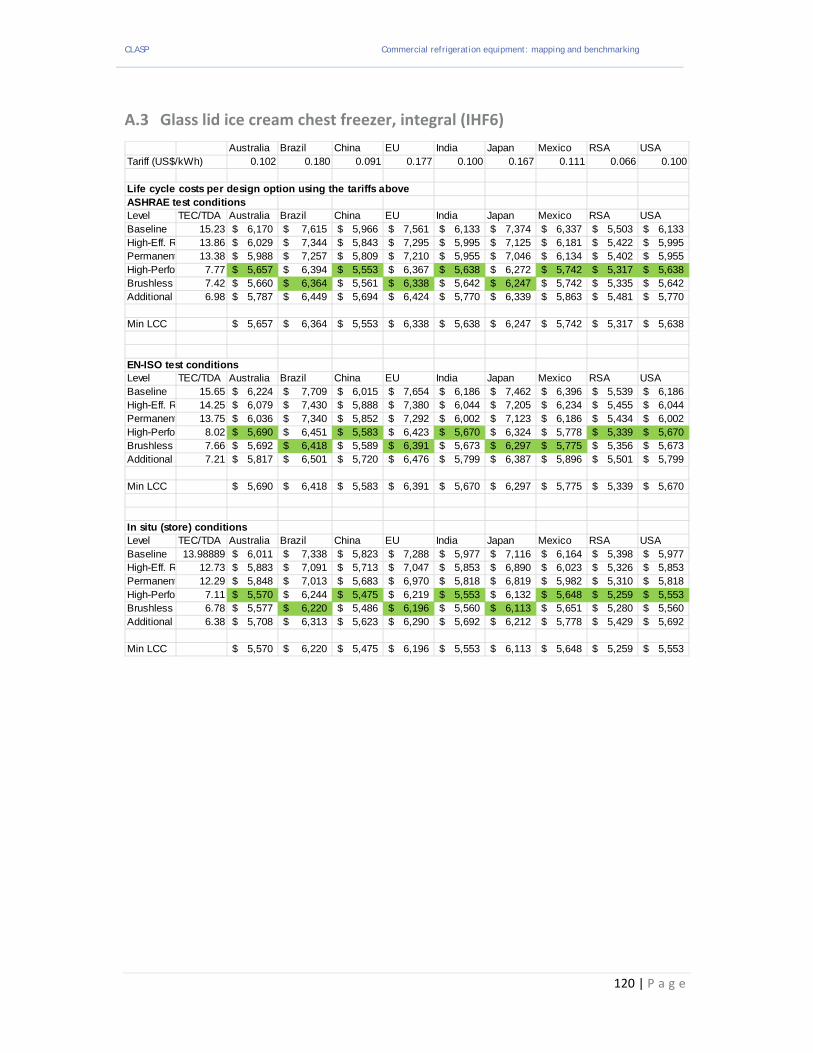
CLASP Commercial refrigeration equipment: mapping and benchmarking
120 | P a g e
A.3 Glass lid ice cream chest freezer, integral (IHF6)
Australia Brazil China EU India Japan Mexico RSA USATariff (US$/kWh) 0.102 0.180 0.091 0.177 0.100 0.167 0.111 0.066 0.100
Life cycle costs per design option using the tariffs aboveASHRAE test conditionsLevel TEC/TDA Australia Brazil China EU India Japan Mexico RSA USABaseline 15.23 6,170$ 7,615$ 5,966$ 7,561$ 6,133$ 7,374$ 6,337$ 5,503$ 6,133$ High-Eff. R 13.86 6,029$ 7,344$ 5,843$ 7,295$ 5,995$ 7,125$ 6,181$ 5,422$ 5,995$ Permanent 13.38 5,988$ 7,257$ 5,809$ 7,210$ 5,955$ 7,046$ 6,134$ 5,402$ 5,955$ High-Perfor 7.77 5,657$ 6,394$ 5,553$ 6,367$ 5,638$ 6,272$ 5,742$ 5,317$ 5,638$ Brushless 7.42 5,660$ 6,364$ 5,561$ 6,338$ 5,642$ 6,247$ 5,742$ 5,335$ 5,642$ Additional 6.98 5,787$ 6,449$ 5,694$ 6,424$ 5,770$ 6,339$ 5,863$ 5,481$ 5,770$
Min LCC 5,657$ 6,364$ 5,553$ 6,338$ 5,638$ 6,247$ 5,742$ 5,317$ 5,638$
EN-ISO test conditionsLevel TEC/TDA Australia Brazil China EU India Japan Mexico RSA USABaseline 15.65 6,224$ 7,709$ 6,015$ 7,654$ 6,186$ 7,462$ 6,396$ 5,539$ 6,186$ High-Eff. R 14.25 6,079$ 7,430$ 5,888$ 7,380$ 6,044$ 7,205$ 6,234$ 5,455$ 6,044$ Permanent 13.75 6,036$ 7,340$ 5,852$ 7,292$ 6,002$ 7,123$ 6,186$ 5,434$ 6,002$ High-Perfor 8.02 5,690$ 6,451$ 5,583$ 6,423$ 5,670$ 6,324$ 5,778$ 5,339$ 5,670$ Brushless 7.66 5,692$ 6,418$ 5,589$ 6,391$ 5,673$ 6,297$ 5,775$ 5,356$ 5,673$ Additional 7.21 5,817$ 6,501$ 5,720$ 6,476$ 5,799$ 6,387$ 5,896$ 5,501$ 5,799$
Min LCC 5,690$ 6,418$ 5,583$ 6,391$ 5,670$ 6,297$ 5,775$ 5,339$ 5,670$
In situ (store) conditionsLevel TEC/TDA Australia Brazil China EU India Japan Mexico RSA USABaseline 13.98889 6,011$ 7,338$ 5,823$ 7,288$ 5,977$ 7,116$ 6,164$ 5,398$ 5,977$ High-Eff. R 12.73 5,883$ 7,091$ 5,713$ 7,047$ 5,853$ 6,890$ 6,023$ 5,326$ 5,853$ Permanent 12.29 5,848$ 7,013$ 5,683$ 6,970$ 5,818$ 6,819$ 5,982$ 5,310$ 5,818$ High-Perfor 7.11 5,570$ 6,244$ 5,475$ 6,219$ 5,553$ 6,132$ 5,648$ 5,259$ 5,553$ Brushless 6.78 5,577$ 6,220$ 5,486$ 6,196$ 5,560$ 6,113$ 5,651$ 5,280$ 5,560$ Additional 6.38 5,708$ 6,313$ 5,623$ 6,290$ 5,692$ 6,212$ 5,778$ 5,429$ 5,692$
Min LCC 5,570$ 6,220$ 5,475$ 6,196$ 5,553$ 6,113$ 5,648$ 5,259$ 5,553$

CLASP Commercial refrigeration equipment: mapping and benchmarking
121 | P a g e
A.4 Glass door (vertical) bottle cooler, integral (IVC4)
Australia Brazil China EU India Japan Mexico South AfricUSATariff (US$/kWh) 0.102 0.180 0.091 0.177 0.100 0.167 0.111 0.066 0.100
Life cycle costs per design option using the tariffs aboveASHRAE test conditionsLevel TEC/TDA Australia Brazil China EU India Japan Mexico South AfricUSABaseline 15.79 19,020$ 26,618$ 17,949$ 26,335$ 18,826$ 25,352$ 19,897$ 15,514$ 18,826$ High-Eff. R 14.84 18,473$ 25,618$ 17,466$ 25,352$ 18,290$ 24,427$ 19,298$ 15,176$ 18,290$ Permanent 14.31 18,163$ 25,048$ 17,192$ 24,792$ 17,986$ 23,900$ 18,957$ 14,985$ 17,986$ Brushless 13.64 17,813$ 24,377$ 16,888$ 24,133$ 17,645$ 23,283$ 18,571$ 14,784$ 17,645$ Enhanced- 12.75 17,376$ 23,515$ 16,511$ 23,287$ 17,219$ 22,492$ 18,085$ 14,543$ 17,219$ LED Lightin 10.93 16,755$ 22,015$ 16,014$ 21,819$ 16,620$ 21,138$ 17,362$ 14,328$ 16,620$ High-Perfor 8.98 16,558$ 20,878$ 15,948$ 20,717$ 16,447$ 20,158$ 17,056$ 14,564$ 16,447$ Enhanced- 8.02 16,344$ 20,203$ 15,800$ 20,059$ 16,246$ 19,560$ 16,790$ 14,564$ 16,246$ Permanent 7.97 16,341$ 20,175$ 15,801$ 20,032$ 16,243$ 19,536$ 16,784$ 14,572$ 16,243$ Brushless 7.90 16,371$ 20,174$ 15,835$ 20,033$ 16,273$ 19,540$ 16,810$ 14,616$ 16,273$ Additional 7.81 16,447$ 20,204$ 15,917$ 20,065$ 16,351$ 19,578$ 16,880$ 14,713$ 16,351$
Min LCC 16,341$ 20,174$ 15,800$ 20,032$ 16,243$ 19,536$ 16,784$ 14,328$ 16,243$
EN-ISO test conditionsLevel TEC/TDA Australia Brazil China EU India Japan Mexico South AfricUSABaseline 14.41 18,136$ 25,072$ 17,158$ 24,814$ 17,958$ 23,916$ 18,936$ 14,935$ 17,958$ High-Eff. R 13.53 17,624$ 24,133$ 16,706$ 23,891$ 17,457$ 23,048$ 18,375$ 14,619$ 17,457$ Permanent 12.99 17,313$ 23,563$ 16,432$ 23,331$ 17,153$ 22,521$ 18,034$ 14,429$ 17,153$ Brushless 12.32 16,964$ 22,894$ 16,128$ 22,673$ 16,812$ 21,905$ 17,648$ 14,227$ 16,812$ Enhanced- 11.50 16,558$ 22,090$ 15,778$ 21,885$ 16,416$ 21,168$ 17,196$ 14,004$ 16,416$ LED Lightin 10.58 16,511$ 21,603$ 15,793$ 21,414$ 16,381$ 20,755$ 17,099$ 14,161$ 16,381$ High-Perfor 8.61 16,303$ 20,447$ 15,719$ 20,293$ 16,197$ 19,756$ 16,781$ 14,391$ 16,197$ Enhanced- 7.76 16,135$ 19,869$ 15,608$ 19,730$ 16,039$ 19,247$ 16,566$ 14,412$ 16,039$ Permanent 7.71 16,132$ 19,841$ 15,609$ 19,703$ 16,037$ 19,223$ 16,560$ 14,420$ 16,037$ Brushless 7.64 16,162$ 19,841$ 15,643$ 19,704$ 16,068$ 19,228$ 16,586$ 14,464$ 16,068$ Additional 7.54 16,235$ 19,866$ 15,723$ 19,731$ 16,142$ 19,261$ 16,654$ 14,559$ 16,142$
Min LCC 16,132$ 19,841$ 15,608$ 19,703$ 16,037$ 19,223$ 16,560$ 14,004$ 16,037$
In situ (store) conditionsLevel TEC/TDA Australia Brazil China EU India Japan Mexico South AfricUSABaseline 13.64 17,626$ 24,189$ 16,701$ 23,945$ 17,458$ 23,095$ 18,383$ 14,597$ 17,458$ High-Eff. R 12.81 17,152$ 23,318$ 16,283$ 23,088$ 16,994$ 22,290$ 17,864$ 14,307$ 16,994$ Permanent 12.27 16,842$ 22,748$ 16,009$ 22,528$ 16,691$ 21,763$ 17,523$ 14,116$ 16,691$ Brushless 11.61 16,494$ 22,079$ 15,706$ 21,871$ 16,350$ 21,148$ 17,138$ 13,916$ 16,350$ Enhanced- 10.85 16,121$ 21,341$ 15,384$ 21,146$ 15,987$ 20,471$ 16,723$ 13,711$ 15,987$ LED Lightin 9.93 16,075$ 20,855$ 15,401$ 20,677$ 15,952$ 20,058$ 16,626$ 13,869$ 15,952$ High-Perfor 8.01 15,897$ 19,750$ 15,353$ 19,607$ 15,798$ 19,108$ 16,341$ 14,118$ 15,798$ Enhanced- 6.89 15,538$ 18,854$ 15,070$ 18,731$ 15,453$ 18,301$ 15,920$ 14,007$ 15,453$ Permanent 6.85 15,539$ 18,835$ 15,075$ 18,712$ 15,455$ 18,286$ 15,920$ 14,018$ 15,455$ Brushless 6.79 15,576$ 18,845$ 15,115$ 18,724$ 15,492$ 18,300$ 15,953$ 14,067$ 15,492$ Additional 6.71 15,660$ 18,889$ 15,204$ 18,769$ 15,577$ 18,351$ 16,032$ 14,169$ 15,577$
Min LCC 15,538$ 18,835$ 15,070$ 18,712$ 15,453$ 18,286$ 15,920$ 13,711$ 15,453$
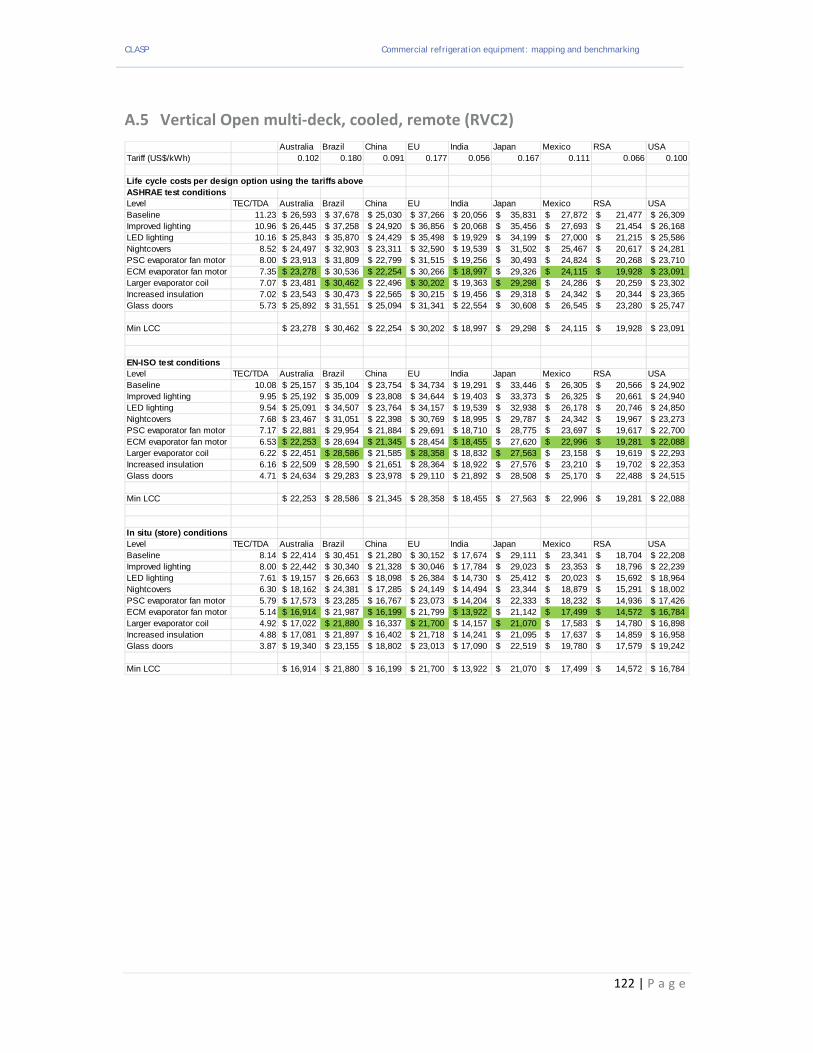
CLASP Commercial refrigeration equipment: mapping and benchmarking
122 | P a g e
A.5 Vertical Open multi‐deck, cooled, remote (RVC2)
Australia Brazil China EU India Japan Mexico RSA USATariff (US$/kWh) 0.102 0.180 0.091 0.177 0.056 0.167 0.111 0.066 0.100
Life cycle costs per design option using the tariffs aboveASHRAE test conditionsLevel TEC/TDA Australia Brazil China EU India Japan Mexico RSA USABaseline 11.23 26,593$ 37,678$ 25,030$ 37,266$ 20,056$ 35,831$ 27,872$ 21,477$ 26,309$ Improved lighting 10.96 26,445$ 37,258$ 24,920$ 36,856$ 20,068$ 35,456$ 27,693$ 21,454$ 26,168$ LED lighting 10.16 25,843$ 35,870$ 24,429$ 35,498$ 19,929$ 34,199$ 27,000$ 21,215$ 25,586$ Nightcovers 8.52 24,497$ 32,903$ 23,311$ 32,590$ 19,539$ 31,502$ 25,467$ 20,617$ 24,281$ PSC evaporator fan motor 8.00 23,913$ 31,809$ 22,799$ 31,515$ 19,256$ 30,493$ 24,824$ 20,268$ 23,710$ ECM evaporator fan motor 7.35 23,278$ 30,536$ 22,254$ 30,266$ 18,997$ 29,326$ 24,115$ 19,928$ 23,091$ Larger evaporator coil 7.07 23,481$ 30,462$ 22,496$ 30,202$ 19,363$ 29,298$ 24,286$ 20,259$ 23,302$ Increased insulation 7.02 23,543$ 30,473$ 22,565$ 30,215$ 19,456$ 29,318$ 24,342$ 20,344$ 23,365$ Glass doors 5.73 25,892$ 31,551$ 25,094$ 31,341$ 22,554$ 30,608$ 26,545$ 23,280$ 25,747$
Min LCC 23,278$ 30,462$ 22,254$ 30,202$ 18,997$ 29,298$ 24,115$ 19,928$ 23,091$
EN-ISO test conditionsLevel TEC/TDA Australia Brazil China EU India Japan Mexico RSA USABaseline 10.08 25,157$ 35,104$ 23,754$ 34,734$ 19,291$ 33,446$ 26,305$ 20,566$ 24,902$ Improved lighting 9.95 25,192$ 35,009$ 23,808$ 34,644$ 19,403$ 33,373$ 26,325$ 20,661$ 24,940$ LED lighting 9.54 25,091$ 34,507$ 23,764$ 34,157$ 19,539$ 32,938$ 26,178$ 20,746$ 24,850$ Nightcovers 7.68 23,467$ 31,051$ 22,398$ 30,769$ 18,995$ 29,787$ 24,342$ 19,967$ 23,273$ PSC evaporator fan motor 7.17 22,881$ 29,954$ 21,884$ 29,691$ 18,710$ 28,775$ 23,697$ 19,617$ 22,700$ ECM evaporator fan motor 6.53 22,253$ 28,694$ 21,345$ 28,454$ 18,455$ 27,620$ 22,996$ 19,281$ 22,088$ Larger evaporator coil 6.22 22,451$ 28,586$ 21,585$ 28,358$ 18,832$ 27,563$ 23,158$ 19,619$ 22,293$ Increased insulation 6.16 22,509$ 28,590$ 21,651$ 28,364$ 18,922$ 27,576$ 23,210$ 19,702$ 22,353$ Glass doors 4.71 24,634$ 29,283$ 23,978$ 29,110$ 21,892$ 28,508$ 25,170$ 22,488$ 24,515$
Min LCC 22,253$ 28,586$ 21,345$ 28,358$ 18,455$ 27,563$ 22,996$ 19,281$ 22,088$
In situ (store) conditionsLevel TEC/TDA Australia Brazil China EU India Japan Mexico RSA USABaseline 8.14 22,414$ 30,451$ 21,280$ 30,152$ 17,674$ 29,111$ 23,341$ 18,704$ 22,208$ Improved lighting 8.00 22,442$ 30,340$ 21,328$ 30,046$ 17,784$ 29,023$ 23,353$ 18,796$ 22,239$ LED lighting 7.61 19,157$ 26,663$ 18,098$ 26,384$ 14,730$ 25,412$ 20,023$ 15,692$ 18,964$ Nightcovers 6.30 18,162$ 24,381$ 17,285$ 24,149$ 14,494$ 23,344$ 18,879$ 15,291$ 18,002$ PSC evaporator fan motor 5.79 17,573$ 23,285$ 16,767$ 23,073$ 14,204$ 22,333$ 18,232$ 14,936$ 17,426$ ECM evaporator fan motor 5.14 16,914$ 21,987$ 16,199$ 21,799$ 13,922$ 21,142$ 17,499$ 14,572$ 16,784$ Larger evaporator coil 4.92 17,022$ 21,880$ 16,337$ 21,700$ 14,157$ 21,070$ 17,583$ 14,780$ 16,898$ Increased insulation 4.88 17,081$ 21,897$ 16,402$ 21,718$ 14,241$ 21,095$ 17,637$ 14,859$ 16,958$ Glass doors 3.87 19,340$ 23,155$ 18,802$ 23,013$ 17,090$ 22,519$ 19,780$ 17,579$ 19,242$
Min LCC 16,914$ 21,880$ 16,199$ 21,700$ 13,922$ 21,070$ 17,499$ 14,572$ 16,784$
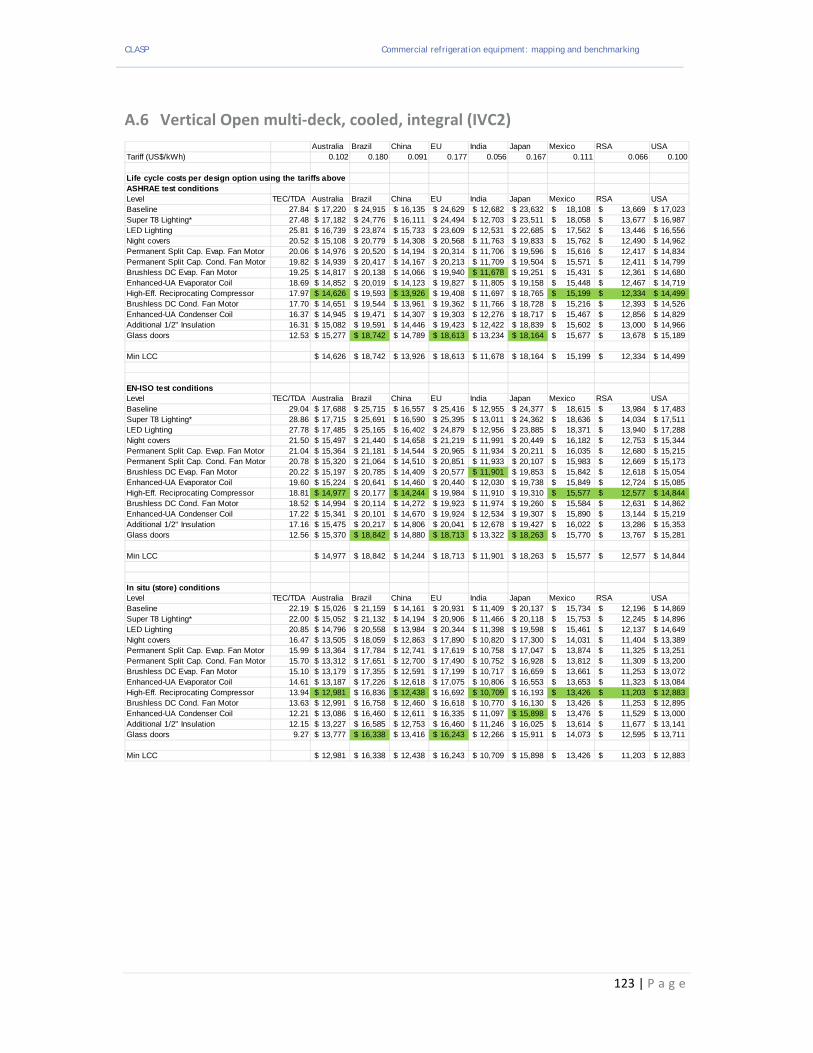
CLASP Commercial refrigeration equipment: mapping and benchmarking
123 | P a g e
A.6 Vertical Open multi‐deck, cooled, integral (IVC2)
Australia Brazil China EU India Japan Mexico RSA USATariff (US$/kWh) 0.102 0.180 0.091 0.177 0.056 0.167 0.111 0.066 0.100
Life cycle costs per design option using the tariffs aboveASHRAE test conditionsLevel TEC/TDA Australia Brazil China EU India Japan Mexico RSA USABaseline 27.84 17,220$ 24,915$ 16,135$ 24,629$ 12,682$ 23,632$ 18,108$ 13,669$ 17,023$ Super T8 Lighting* 27.48 17,182$ 24,776$ 16,111$ 24,494$ 12,703$ 23,511$ 18,058$ 13,677$ 16,987$ LED Lighting 25.81 16,739$ 23,874$ 15,733$ 23,609$ 12,531$ 22,685$ 17,562$ 13,446$ 16,556$ Night covers 20.52 15,108$ 20,779$ 14,308$ 20,568$ 11,763$ 19,833$ 15,762$ 12,490$ 14,962$ Permanent Split Cap. Evap. Fan Motor 20.06 14,976$ 20,520$ 14,194$ 20,314$ 11,706$ 19,596$ 15,616$ 12,417$ 14,834$ Permanent Split Cap. Cond. Fan Motor 19.82 14,939$ 20,417$ 14,167$ 20,213$ 11,709$ 19,504$ 15,571$ 12,411$ 14,799$ Brushless DC Evap. Fan Motor 19.25 14,817$ 20,138$ 14,066$ 19,940$ 11,678$ 19,251$ 15,431$ 12,361$ 14,680$ Enhanced-UA Evaporator Coil 18.69 14,852$ 20,019$ 14,123$ 19,827$ 11,805$ 19,158$ 15,448$ 12,467$ 14,719$ High-Eff. Reciprocating Compressor 17.97 14,626$ 19,593$ 13,926$ 19,408$ 11,697$ 18,765$ 15,199$ 12,334$ 14,499$ Brushless DC Cond. Fan Motor 17.70 14,651$ 19,544$ 13,961$ 19,362$ 11,766$ 18,728$ 15,216$ 12,393$ 14,526$ Enhanced-UA Condenser Coil 16.37 14,945$ 19,471$ 14,307$ 19,303$ 12,276$ 18,717$ 15,467$ 12,856$ 14,829$ Additional 1/2" Insulation 16.31 15,082$ 19,591$ 14,446$ 19,423$ 12,422$ 18,839$ 15,602$ 13,000$ 14,966$ Glass doors 12.53 15,277$ 18,742$ 14,789$ 18,613$ 13,234$ 18,164$ 15,677$ 13,678$ 15,189$
Min LCC 14,626$ 18,742$ 13,926$ 18,613$ 11,678$ 18,164$ 15,199$ 12,334$ 14,499$
EN-ISO test conditionsLevel TEC/TDA Australia Brazil China EU India Japan Mexico RSA USABaseline 29.04 17,688$ 25,715$ 16,557$ 25,416$ 12,955$ 24,377$ 18,615$ 13,984$ 17,483$ Super T8 Lighting* 28.86 17,715$ 25,691$ 16,590$ 25,395$ 13,011$ 24,362$ 18,636$ 14,034$ 17,511$ LED Lighting 27.78 17,485$ 25,165$ 16,402$ 24,879$ 12,956$ 23,885$ 18,371$ 13,940$ 17,288$ Night covers 21.50 15,497$ 21,440$ 14,658$ 21,219$ 11,991$ 20,449$ 16,182$ 12,753$ 15,344$ Permanent Split Cap. Evap. Fan Motor 21.04 15,364$ 21,181$ 14,544$ 20,965$ 11,934$ 20,211$ 16,035$ 12,680$ 15,215$ Permanent Split Cap. Cond. Fan Motor 20.78 15,320$ 21,064$ 14,510$ 20,851$ 11,933$ 20,107$ 15,983$ 12,669$ 15,173$ Brushless DC Evap. Fan Motor 20.22 15,197$ 20,785$ 14,409$ 20,577$ 11,901$ 19,853$ 15,842$ 12,618$ 15,054$ Enhanced-UA Evaporator Coil 19.60 15,224$ 20,641$ 14,460$ 20,440$ 12,030$ 19,738$ 15,849$ 12,724$ 15,085$ High-Eff. Reciprocating Compressor 18.81 14,977$ 20,177$ 14,244$ 19,984$ 11,910$ 19,310$ 15,577$ 12,577$ 14,844$ Brushless DC Cond. Fan Motor 18.52 14,994$ 20,114$ 14,272$ 19,923$ 11,974$ 19,260$ 15,584$ 12,631$ 14,862$ Enhanced-UA Condenser Coil 17.22 15,341$ 20,101$ 14,670$ 19,924$ 12,534$ 19,307$ 15,890$ 13,144$ 15,219$ Additional 1/2" Insulation 17.16 15,475$ 20,217$ 14,806$ 20,041$ 12,678$ 19,427$ 16,022$ 13,286$ 15,353$ Glass doors 12.56 15,370$ 18,842$ 14,880$ 18,713$ 13,322$ 18,263$ 15,770$ 13,767$ 15,281$
Min LCC 14,977$ 18,842$ 14,244$ 18,713$ 11,901$ 18,263$ 15,577$ 12,577$ 14,844$
In situ (store) conditionsLevel TEC/TDA Australia Brazil China EU India Japan Mexico RSA USABaseline 22.19 15,026$ 21,159$ 14,161$ 20,931$ 11,409$ 20,137$ 15,734$ 12,196$ 14,869$ Super T8 Lighting* 22.00 15,052$ 21,132$ 14,194$ 20,906$ 11,466$ 20,118$ 15,753$ 12,245$ 14,896$ LED Lighting 20.85 14,796$ 20,558$ 13,984$ 20,344$ 11,398$ 19,598$ 15,461$ 12,137$ 14,649$ Night covers 16.47 13,505$ 18,059$ 12,863$ 17,890$ 10,820$ 17,300$ 14,031$ 11,404$ 13,389$ Permanent Split Cap. Evap. Fan Motor 15.99 13,364$ 17,784$ 12,741$ 17,619$ 10,758$ 17,047$ 13,874$ 11,325$ 13,251$ Permanent Split Cap. Cond. Fan Motor 15.70 13,312$ 17,651$ 12,700$ 17,490$ 10,752$ 16,928$ 13,812$ 11,309$ 13,200$ Brushless DC Evap. Fan Motor 15.10 13,179$ 17,355$ 12,591$ 17,199$ 10,717$ 16,659$ 13,661$ 11,253$ 13,072$ Enhanced-UA Evaporator Coil 14.61 13,187$ 17,226$ 12,618$ 17,075$ 10,806$ 16,553$ 13,653$ 11,323$ 13,084$ High-Eff. Reciprocating Compressor 13.94 12,981$ 16,836$ 12,438$ 16,692$ 10,709$ 16,193$ 13,426$ 11,203$ 12,883$ Brushless DC Cond. Fan Motor 13.63 12,991$ 16,758$ 12,460$ 16,618$ 10,770$ 16,130$ 13,426$ 11,253$ 12,895$ Enhanced-UA Condenser Coil 12.21 13,086$ 16,460$ 12,611$ 16,335$ 11,097$ 15,898$ 13,476$ 11,529$ 13,000$ Additional 1/2" Insulation 12.15 13,227$ 16,585$ 12,753$ 16,460$ 11,246$ 16,025$ 13,614$ 11,677$ 13,141$ Glass doors 9.27 13,777$ 16,338$ 13,416$ 16,243$ 12,266$ 15,911$ 14,073$ 12,595$ 13,711$
Min LCC 12,981$ 16,338$ 12,438$ 16,243$ 10,709$ 15,898$ 13,426$ 11,203$ 12,883$

CLASP Commercial refrigeration equipment: mapping and benchmarking
124 | P a g e
4. References
BIOS (2007) Preparatory Studies for Eco‐design requirements of EuPs (TREN/D1/40‐2005/LOT12/S07.56644), Lot 12, Commercial refrigerators and freezers, Final Report, BIO Intelligence Service.
CT (2012) Refrigeration Road Map, Carbon Trust, the Institute of Refrigeration and the British Refrigeration Association, March 2012, UK (CTG021). http://www.carbontrust.com/media/147175/j7924_ctg021_refrigeration_road_map_aw.pdf
EC (2006) Regulation (EC) No 842/2006 of the European Parliament and of the Council of 17 May 2006 on certain fluorinated greenhouse gases.
EC (2009) Regulation (EC) No 1005/2009 of the European parliament and of the Council of 16 September 2009 on substances that deplete the ozone layer (recast).
EC (2012) Proposal for a Regulation of the European Parliament and of the Council on fluorinated greenhouse gases http://ec.europa.eu/clima/policies/fgas/legislation/docs/com_2012_643_en.pdf
Ellis (2009) In from the Cold – strategies to increase the energy efficiency of non‐domestic refrigeration in Australia and New Zealand, Background technical report Vol. 1, Mark Ellis and Associates Pty Ltd, 2009.
Ellis (2013) Technical Evaluation of National and Regional Test Methods for Commercial Refrigeration Products, August, 2013 for SEAD, http://www.superefficient.org/Products/Commercial%20Refrigeration.aspx
IEA (2012b) 4E Mapping document, United Kingdom, refrigerated display cabinets. International Energy Agency. IEA‐4E, 2012
IEA (2012c) 4E Mapping document, USA, refrigerated display cabinets. International Energy Agency. IEA‐4E, 2012
IEA (2012d) 4E Mapping document, Australia, refrigerated display cabinets. International Energy Agency. IEA‐4E, 2012
IEA (2012a) Benchmarking report for refrigerated display cabinets, International Energy Agency. IEA‐4E, 2012
IEA (2012e) 4E Mapping document, Australia, vending machines. International Energy Agency. IEA‐4E, 2012
IEA (2012f) 4E Mapping document, European Union, vending machines. International Energy Agency. IEA‐4E, 2012
IEA (2012g) Benchmarking report for refrigerated vending machines. International Energy Agency. IEA‐4E, 2012
JRC (2013) Ecodesign for Commercial Refrigeration: TECHNICAL PROPOSALS (Draft) Background Document, Hans Moons, Alejandro Villanueva, Oliver Wolf (JRC‐IPTS), April 2013
Kauffeld (2012) Availability of low GWP alternatives to HFCs: Feasibility of an early phase‐out of HFCs by 2020, Michael Kauffeld for the Environmental Investigation Agency (EIA), www.eia‐international.org
Klinckenberg & Puddle (2012). Scoping Study for Commercial Refrigerating Equipment Mapping and Benchmarking Project, Klinckenberg Consultants & Puddle consultancy for CLASP
MTP (2009) Market Transformation Programme, BNCR VM0X: Cold Vending Machines Government Standards Evidence Base 2009, Defra, UK, http://efficientproducts.defra.gov.uk

CLASP Commercial refrigeration equipment: mapping and benchmarking
125 | P a g e
RDTL (2013) Test standards for retail cabinets Worldwide, Refrigeration Developments and Testing Ltd.
TSD (2009) Final Rule Technical Support Document (TSD): Energy Efficiency Standards for Commercial and Industrial Equipment: Refrigerated Bottled or Canned Beverage Vending Machines US Department of Energy.
http://www.regulations.gov/#!documentDetail;D=EERE‐2006‐STD‐0125‐0079
USTSD (2008) Technical support document energy efficiency standards for commercial and industrial equipment – commercial ice cream freezers, self‐contained commercial refrigerators, freezers, and refrigerator‐freezers without doors, and remote condensing commercial refrigerators, freezers, and refrigerator‐freezers. US Department of Energy, August. http://www.regulations.gov/#!documentDetail;D=EERE‐2006‐STD‐0126‐0058