clarksburg, northwest, and seneca valley ... -...
TRANSCRIPT
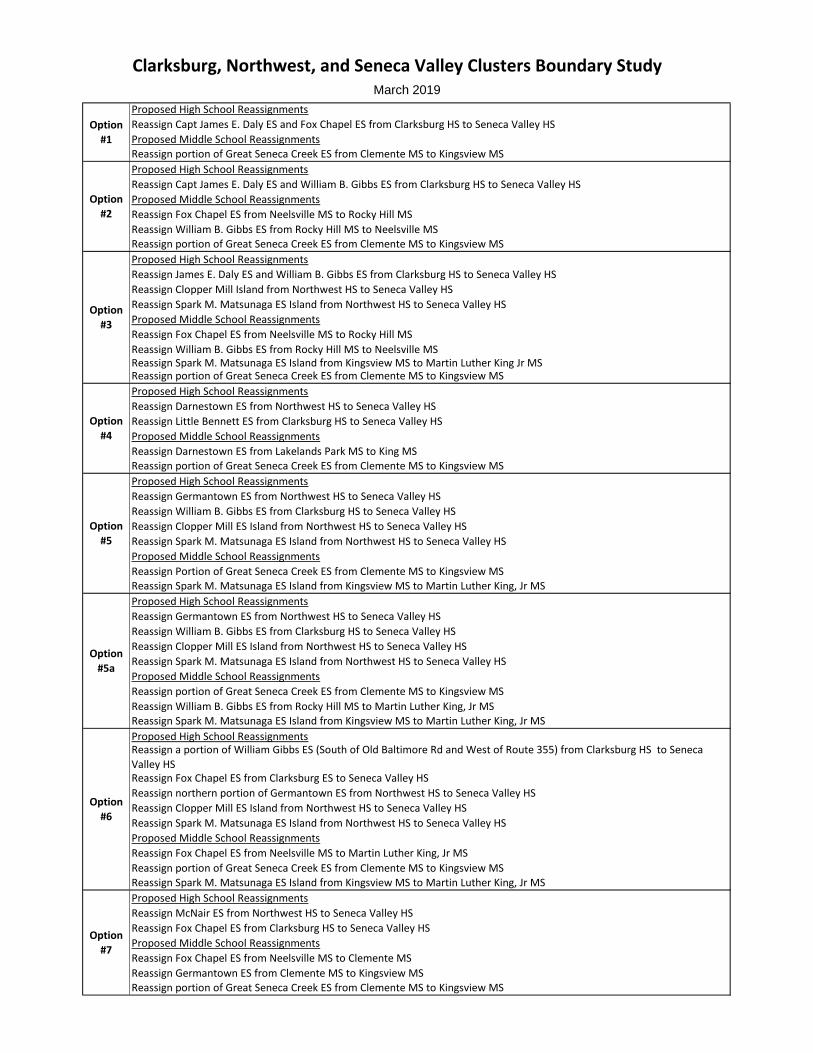
Clarksburg, Northwest, and Seneca Valley Clusters Boundary Study
Proposed High School Reassignments
Reassign Capt James E. Daly ES and Fox Chapel ES from Clarksburg HS to Seneca Valley HS
Proposed Middle School ReassignmentsReassign portion of Great Seneca Creek ES from Clemente MS to Kingsview MS
Proposed High School Reassignments
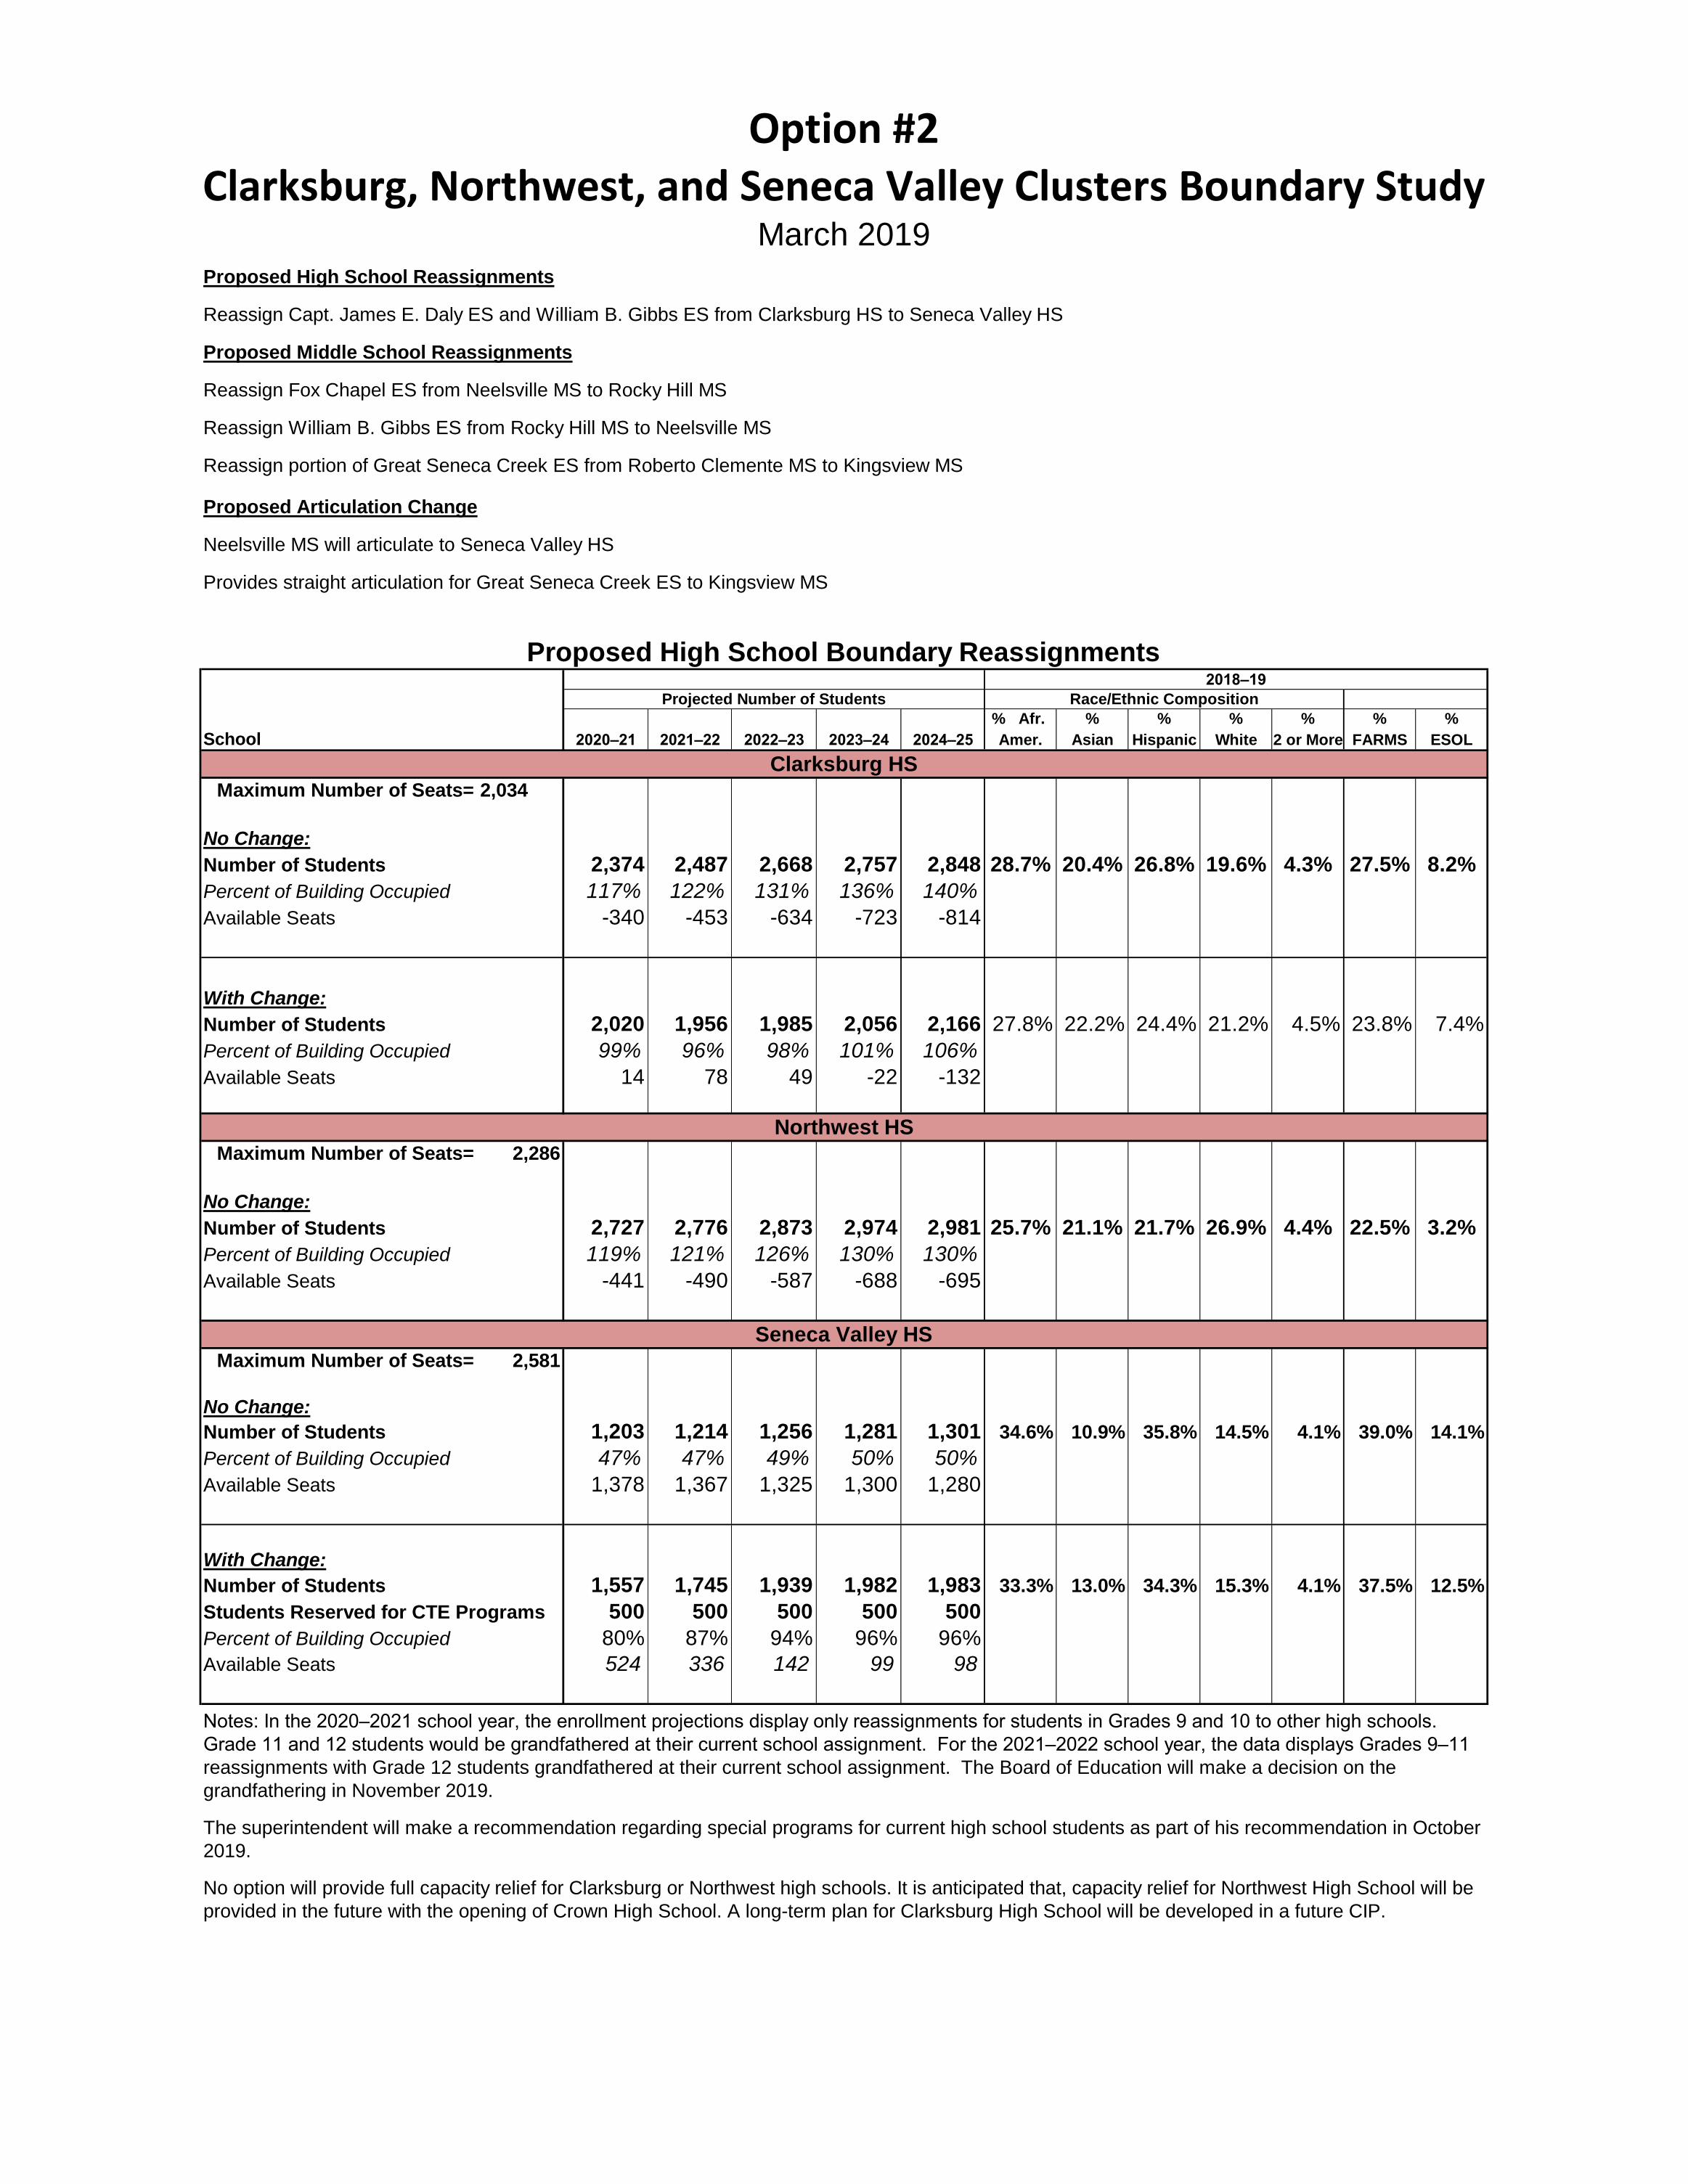
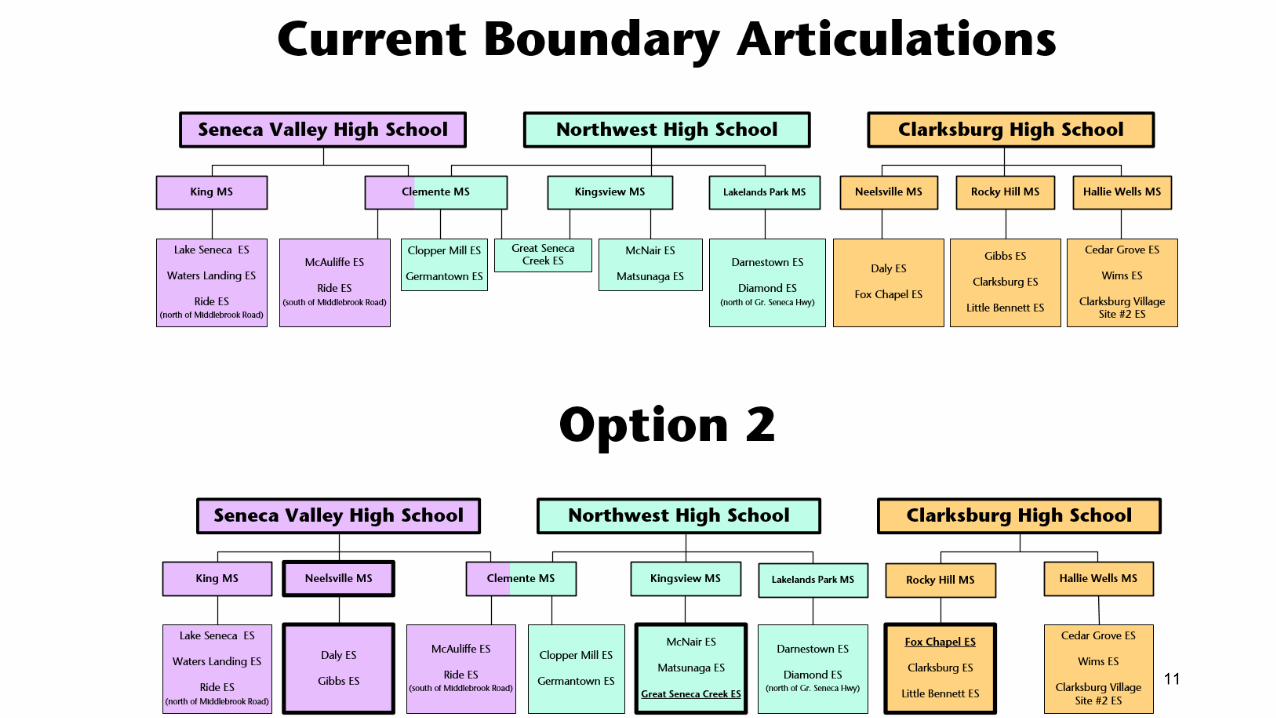
Reassign Capt James E. Daly ES and William B. Gibbs ES from Clarksburg HS to Seneca Valley HS
Proposed Middle School Reassignments
Reassign Fox Chapel ES from Neelsville MS to Rocky Hill MS
Reassign William B. Gibbs ES from Rocky Hill MS to Neelsville MSReassign portion of Great Seneca Creek ES from Clemente MS to Kingsview MS
Proposed High School Reassignments
Reassign James E. Daly ES and William B. Gibbs ES from Clarksburg HS to Seneca Valley HS
Reassign Clopper Mill Island from Northwest HS to Seneca Valley HS
Reassign Spark M. Matsunaga ES Island from Northwest HS to Seneca Valley HS
Proposed Middle School Reassignments
Reassign Fox Chapel ES from Neelsville MS to Rocky Hill MS
Reassign William B. Gibbs ES from Rocky Hill MS to Neelsville MSReassign Spark M. Matsunaga ES Island from Kingsview MS to Martin Luther King Jr MSReassign portion of Great Seneca Creek ES from Clemente MS to Kingsview MS
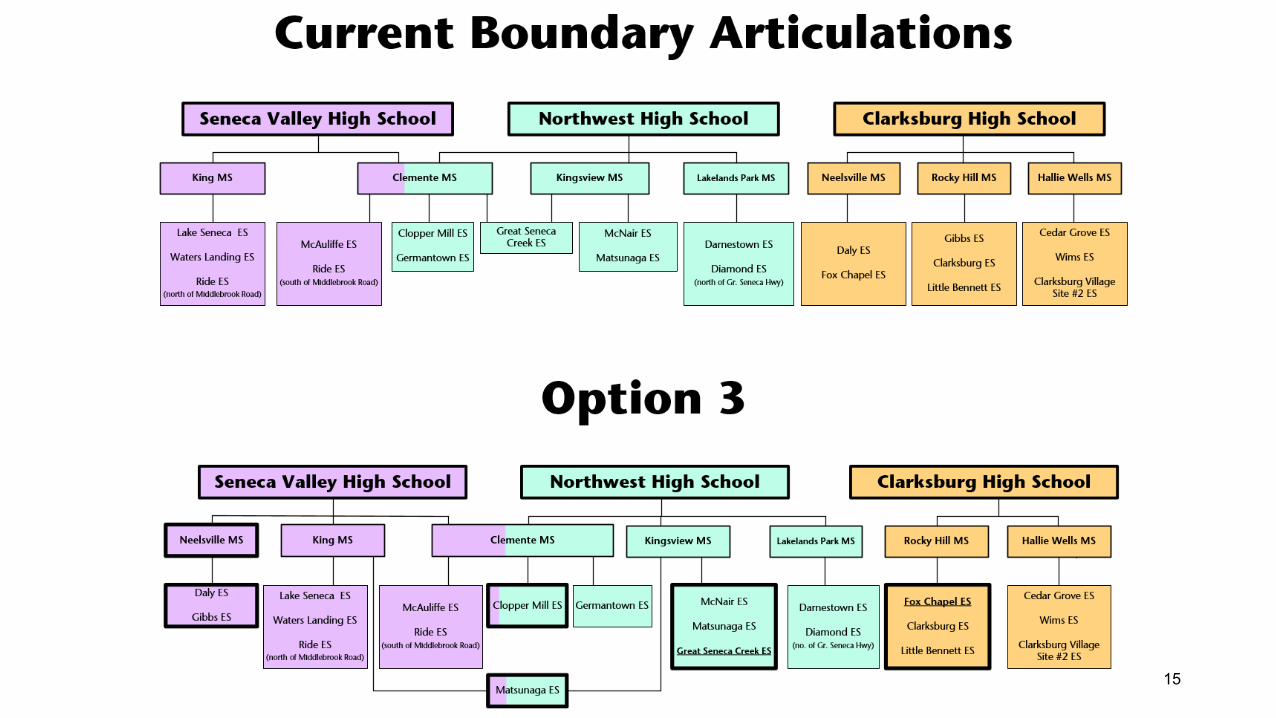
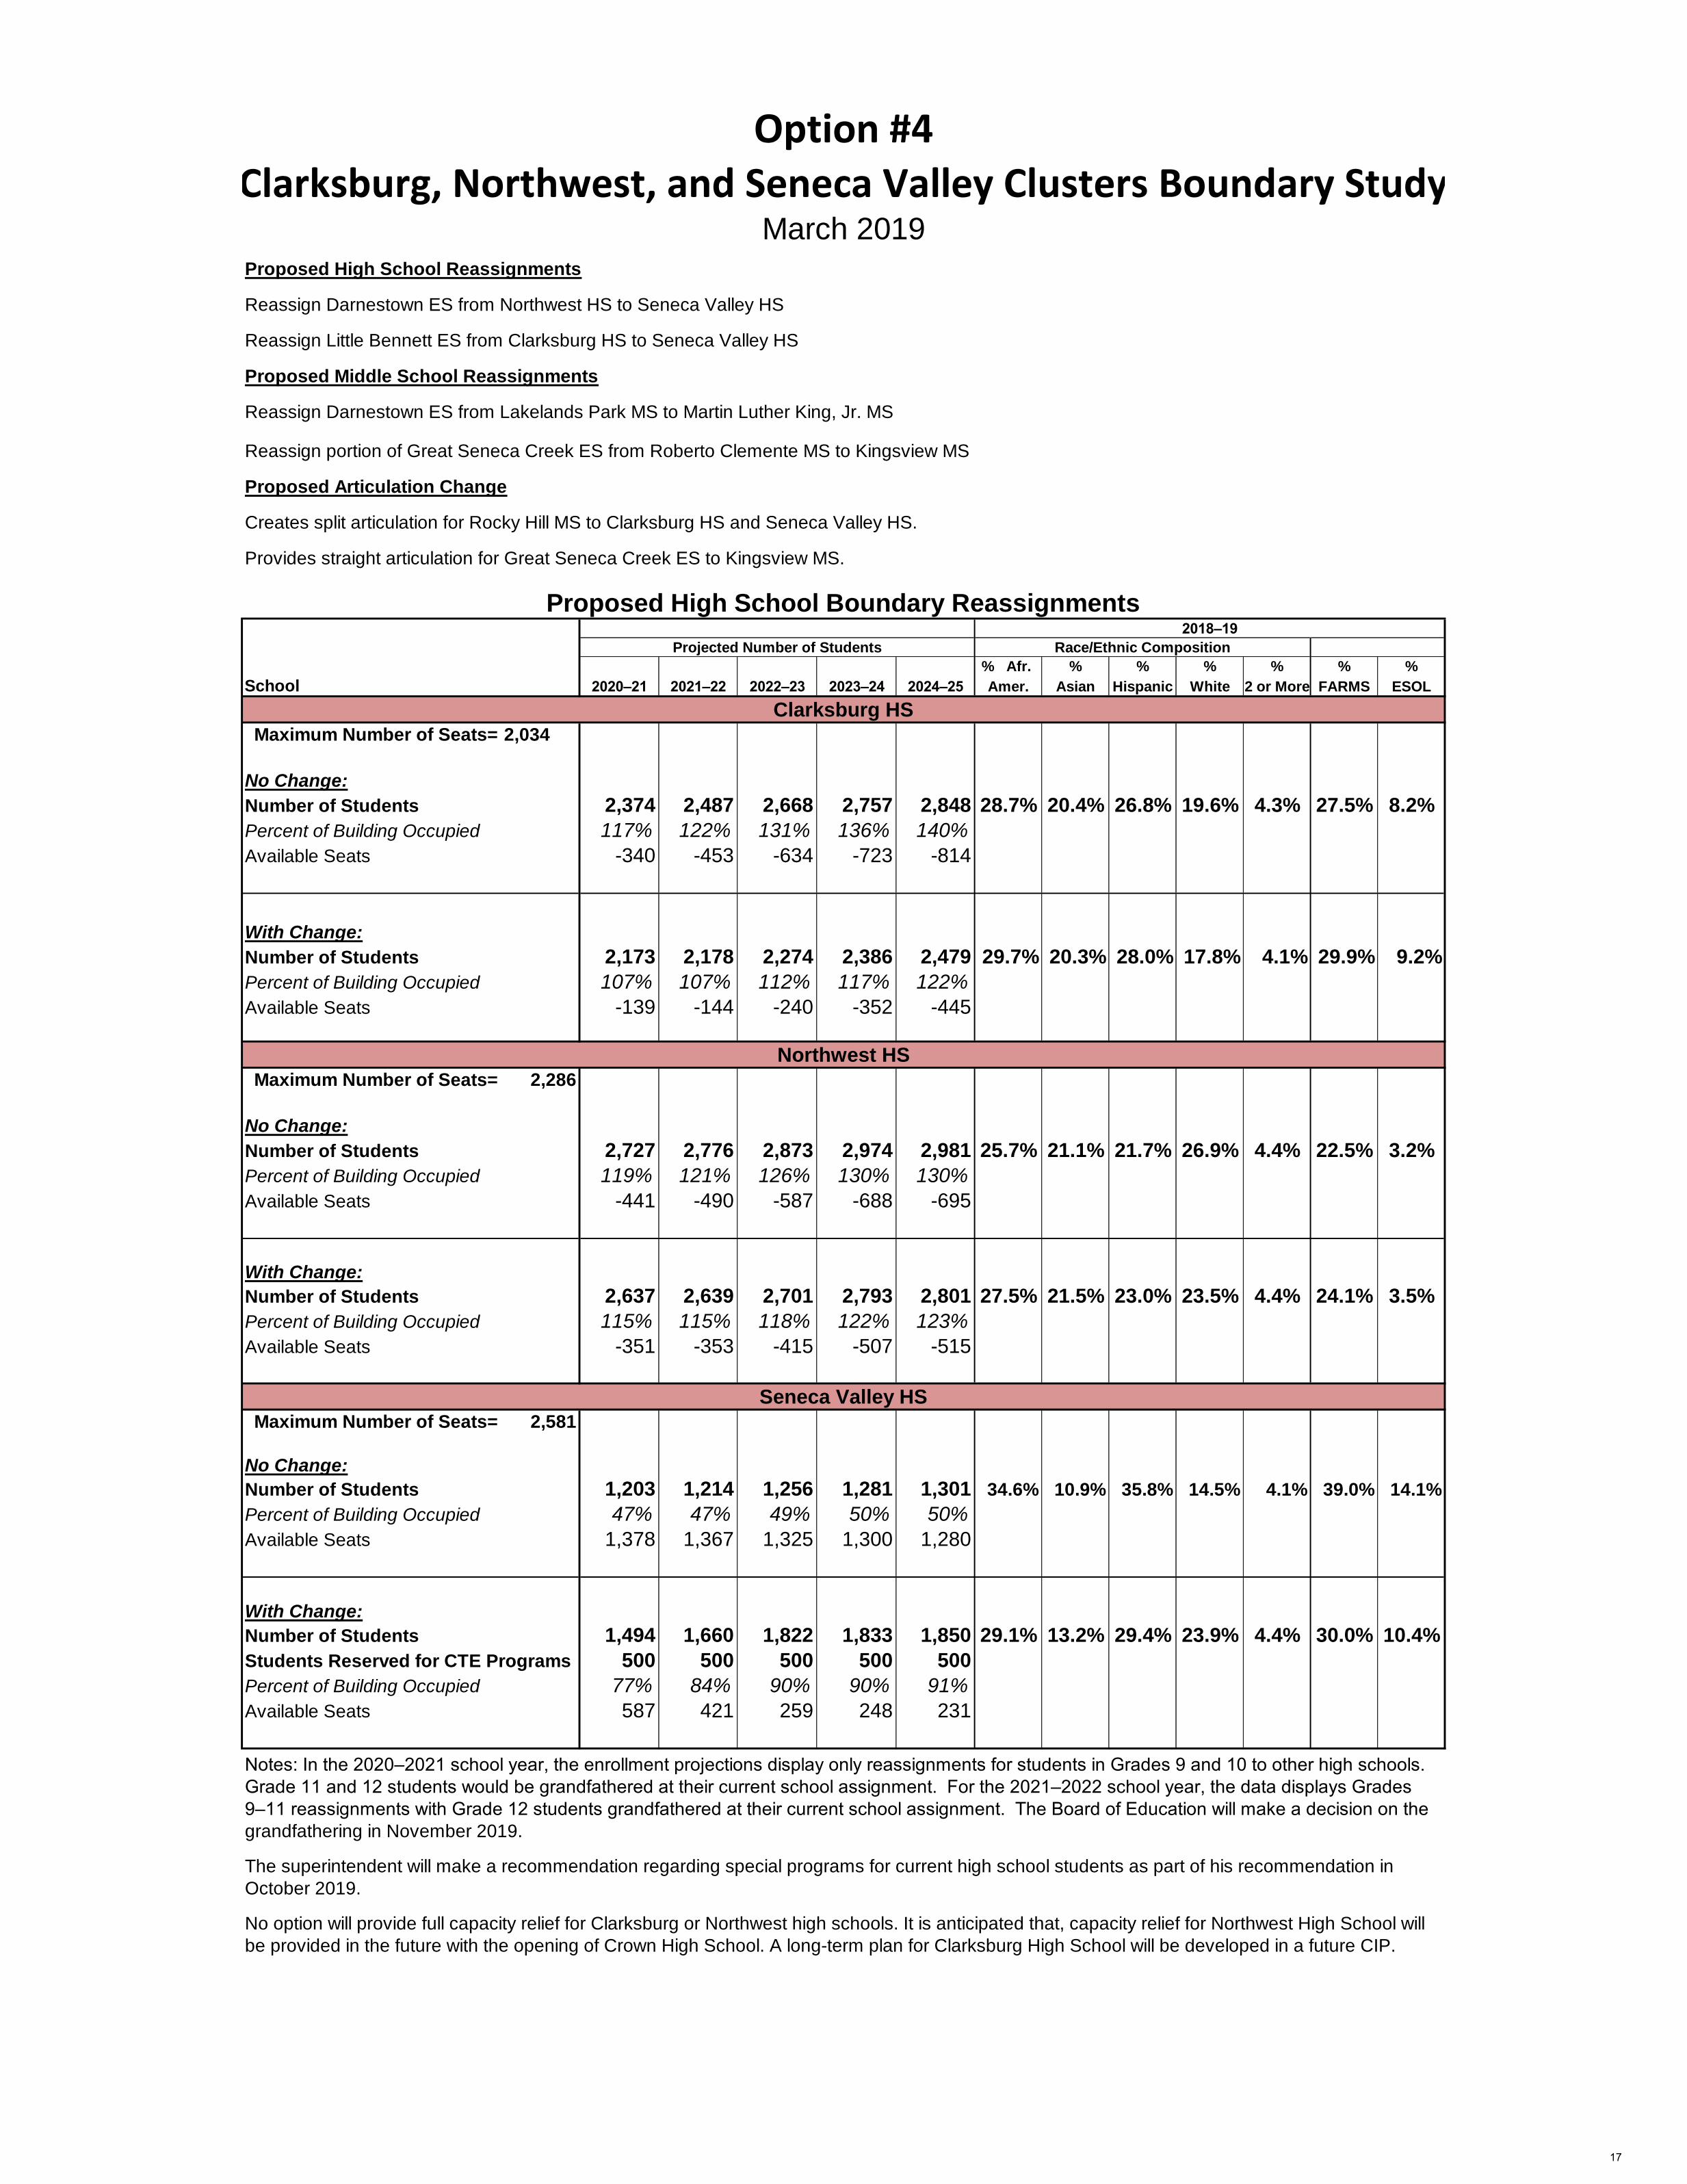
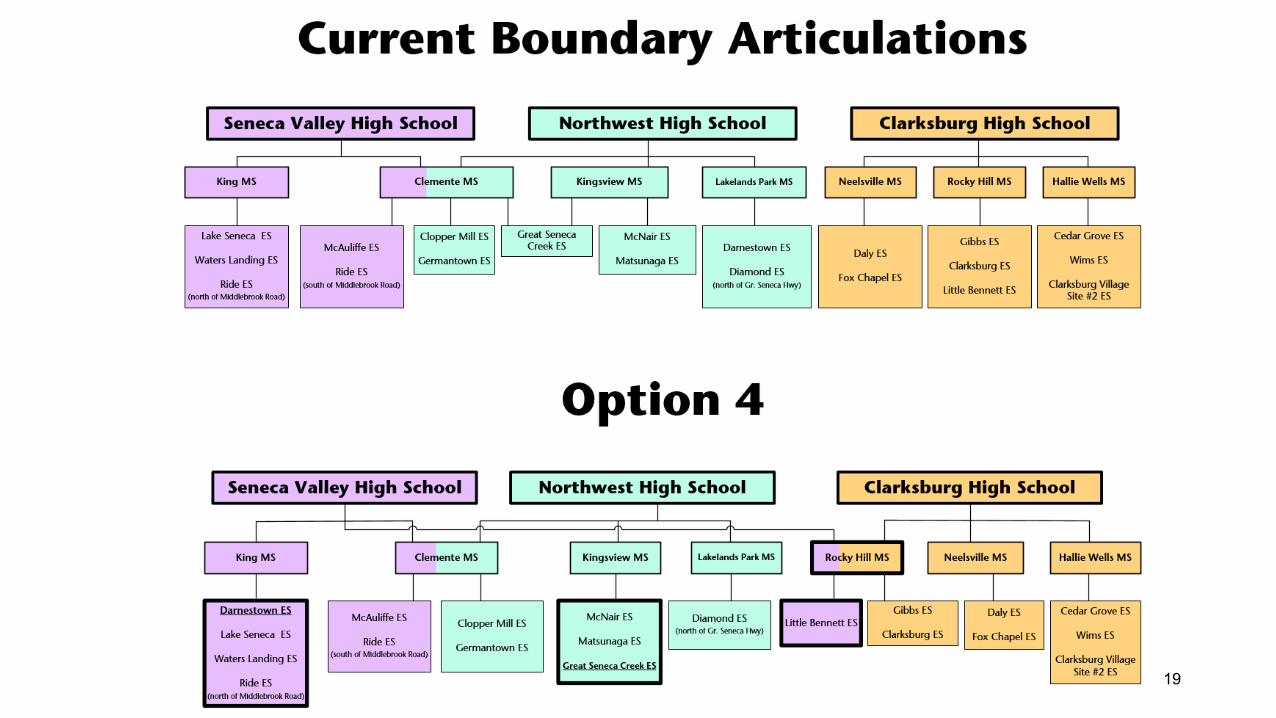
Proposed High School Reassignments
Reassign Darnestown ES from Northwest HS to Seneca Valley HS
Reassign Little Bennett ES from Clarksburg HS to Seneca Valley HS
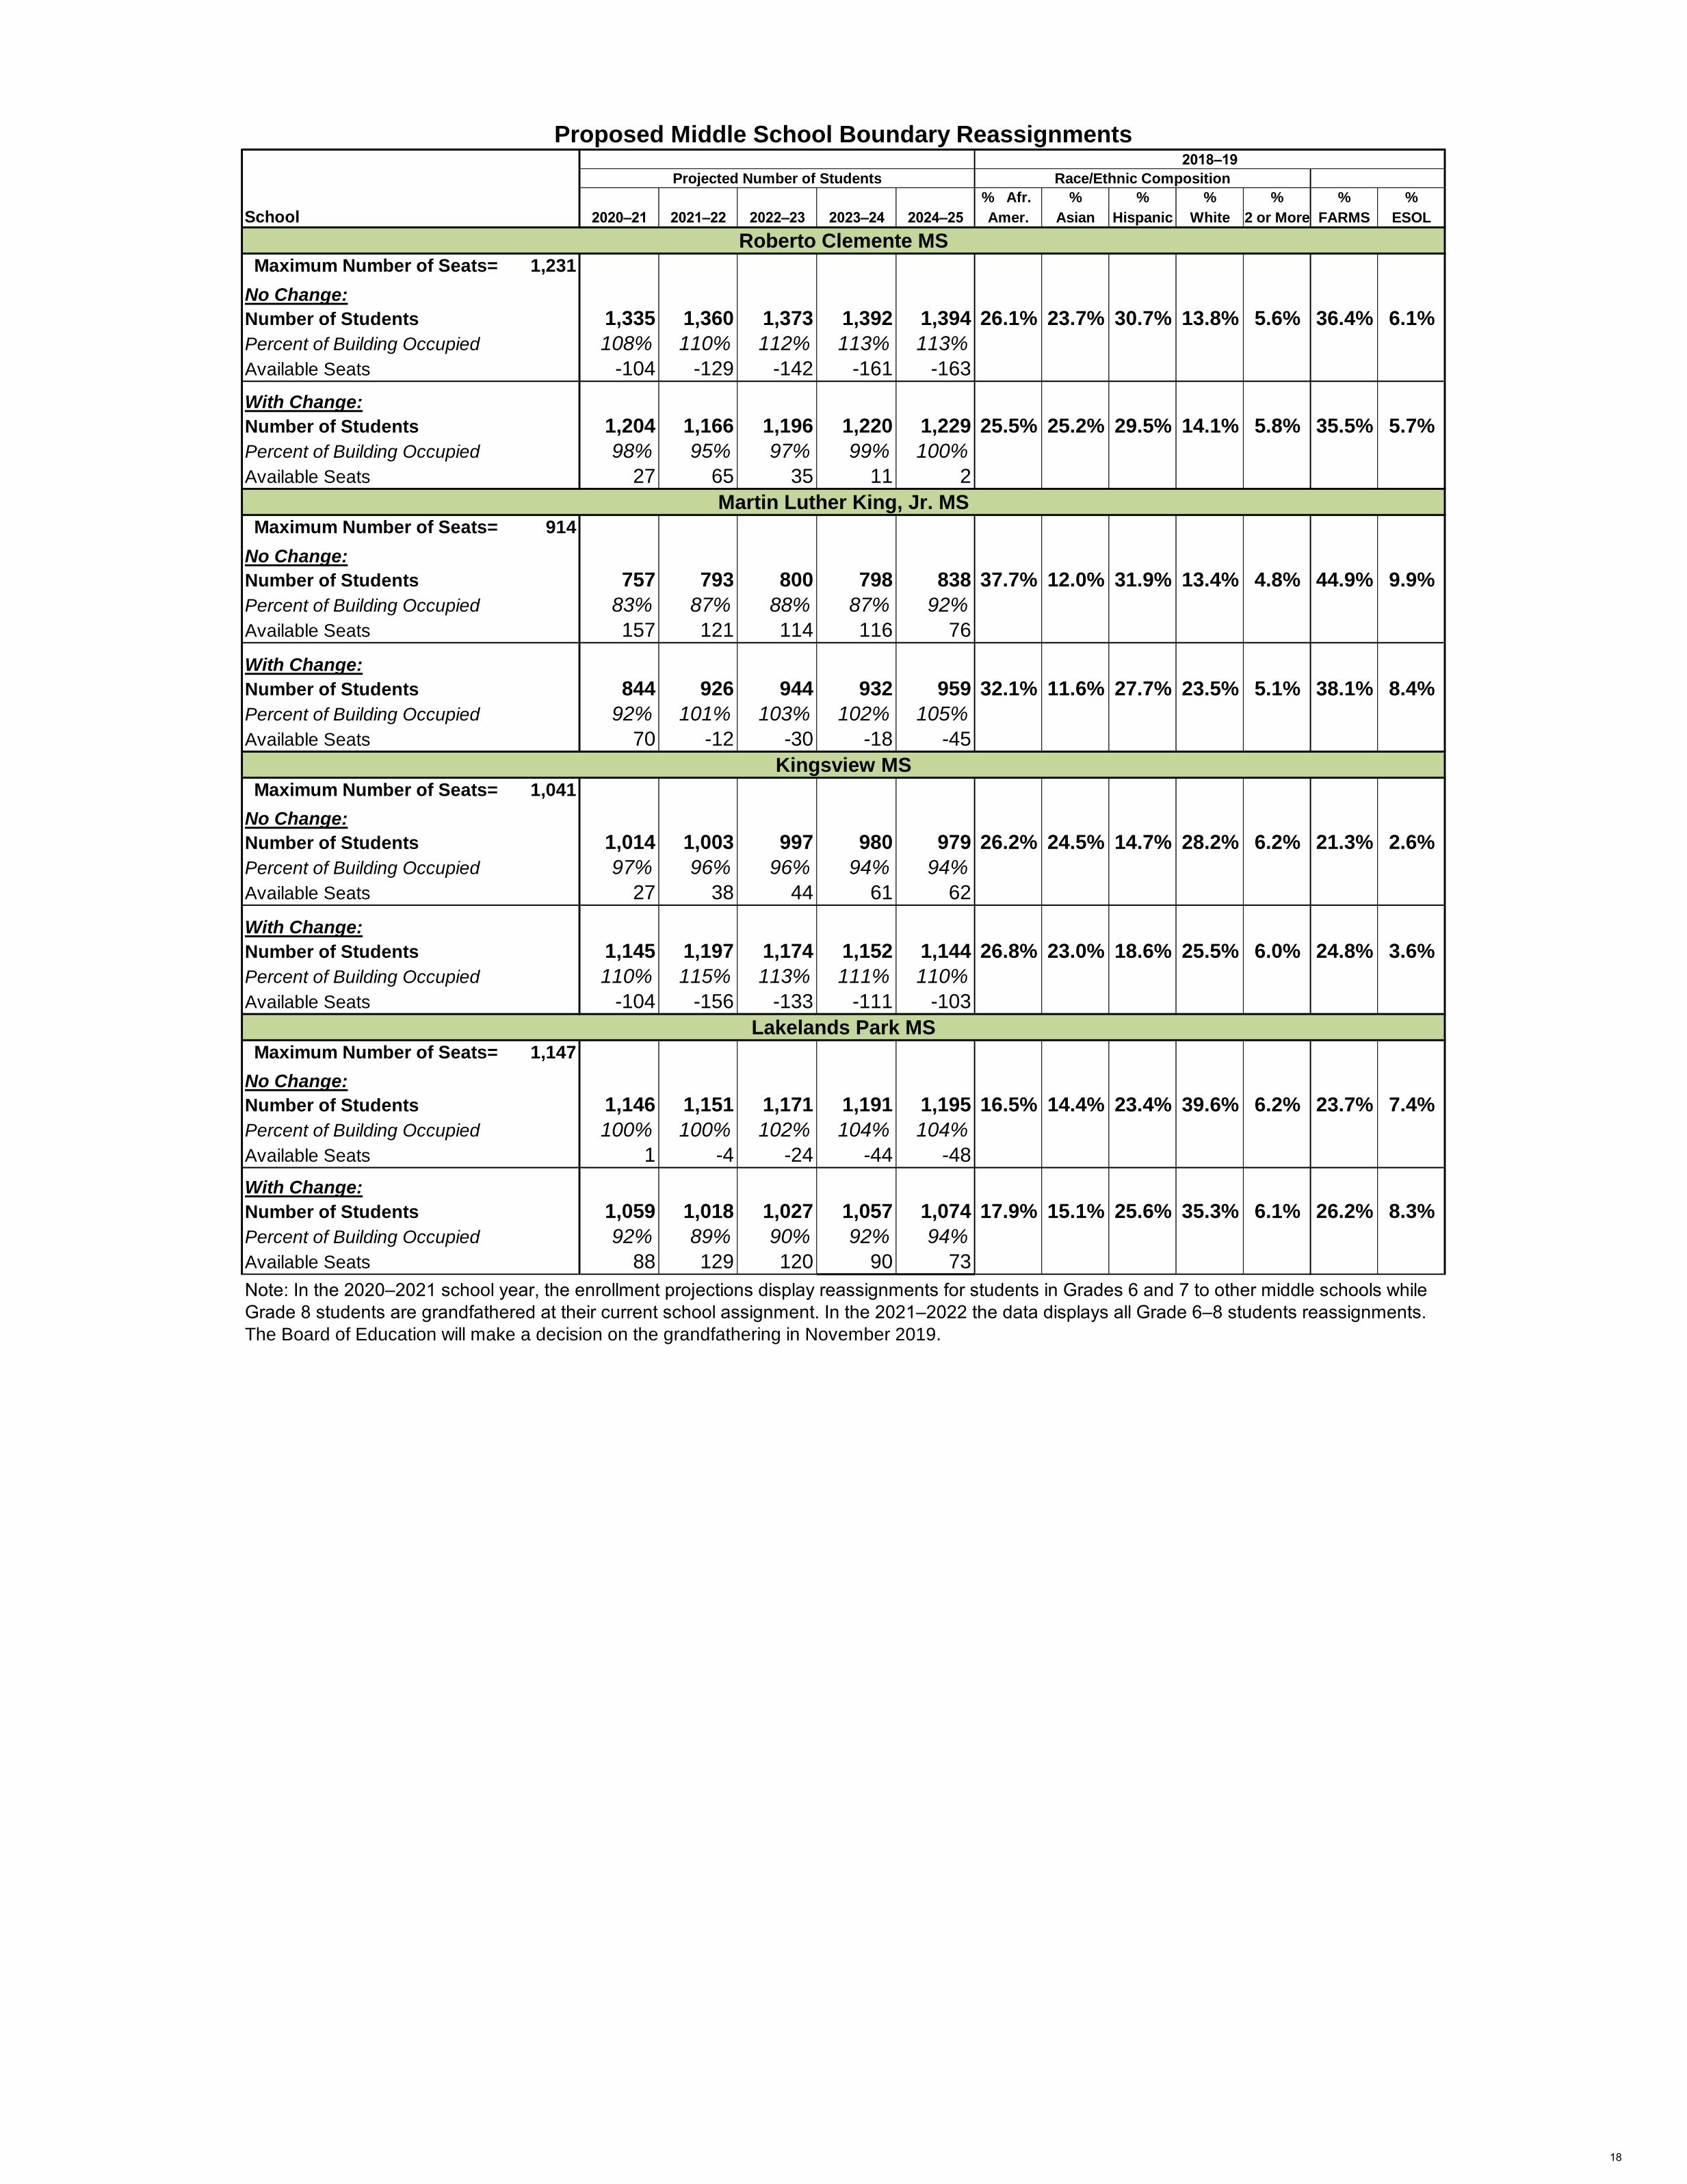
Proposed Middle School Reassignments
Reassign Darnestown ES from Lakelands Park MS to King MSReassign portion of Great Seneca Creek ES from Clemente MS to Kingsview MS
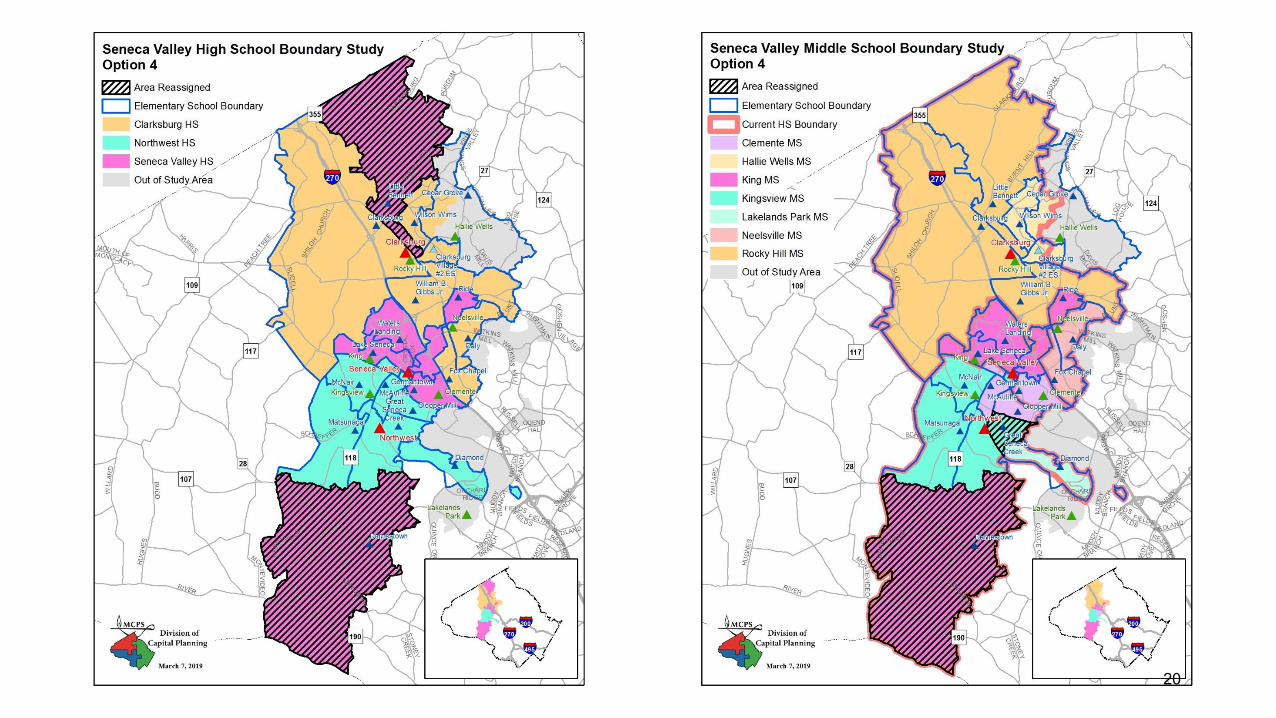
Proposed High School Reassignments
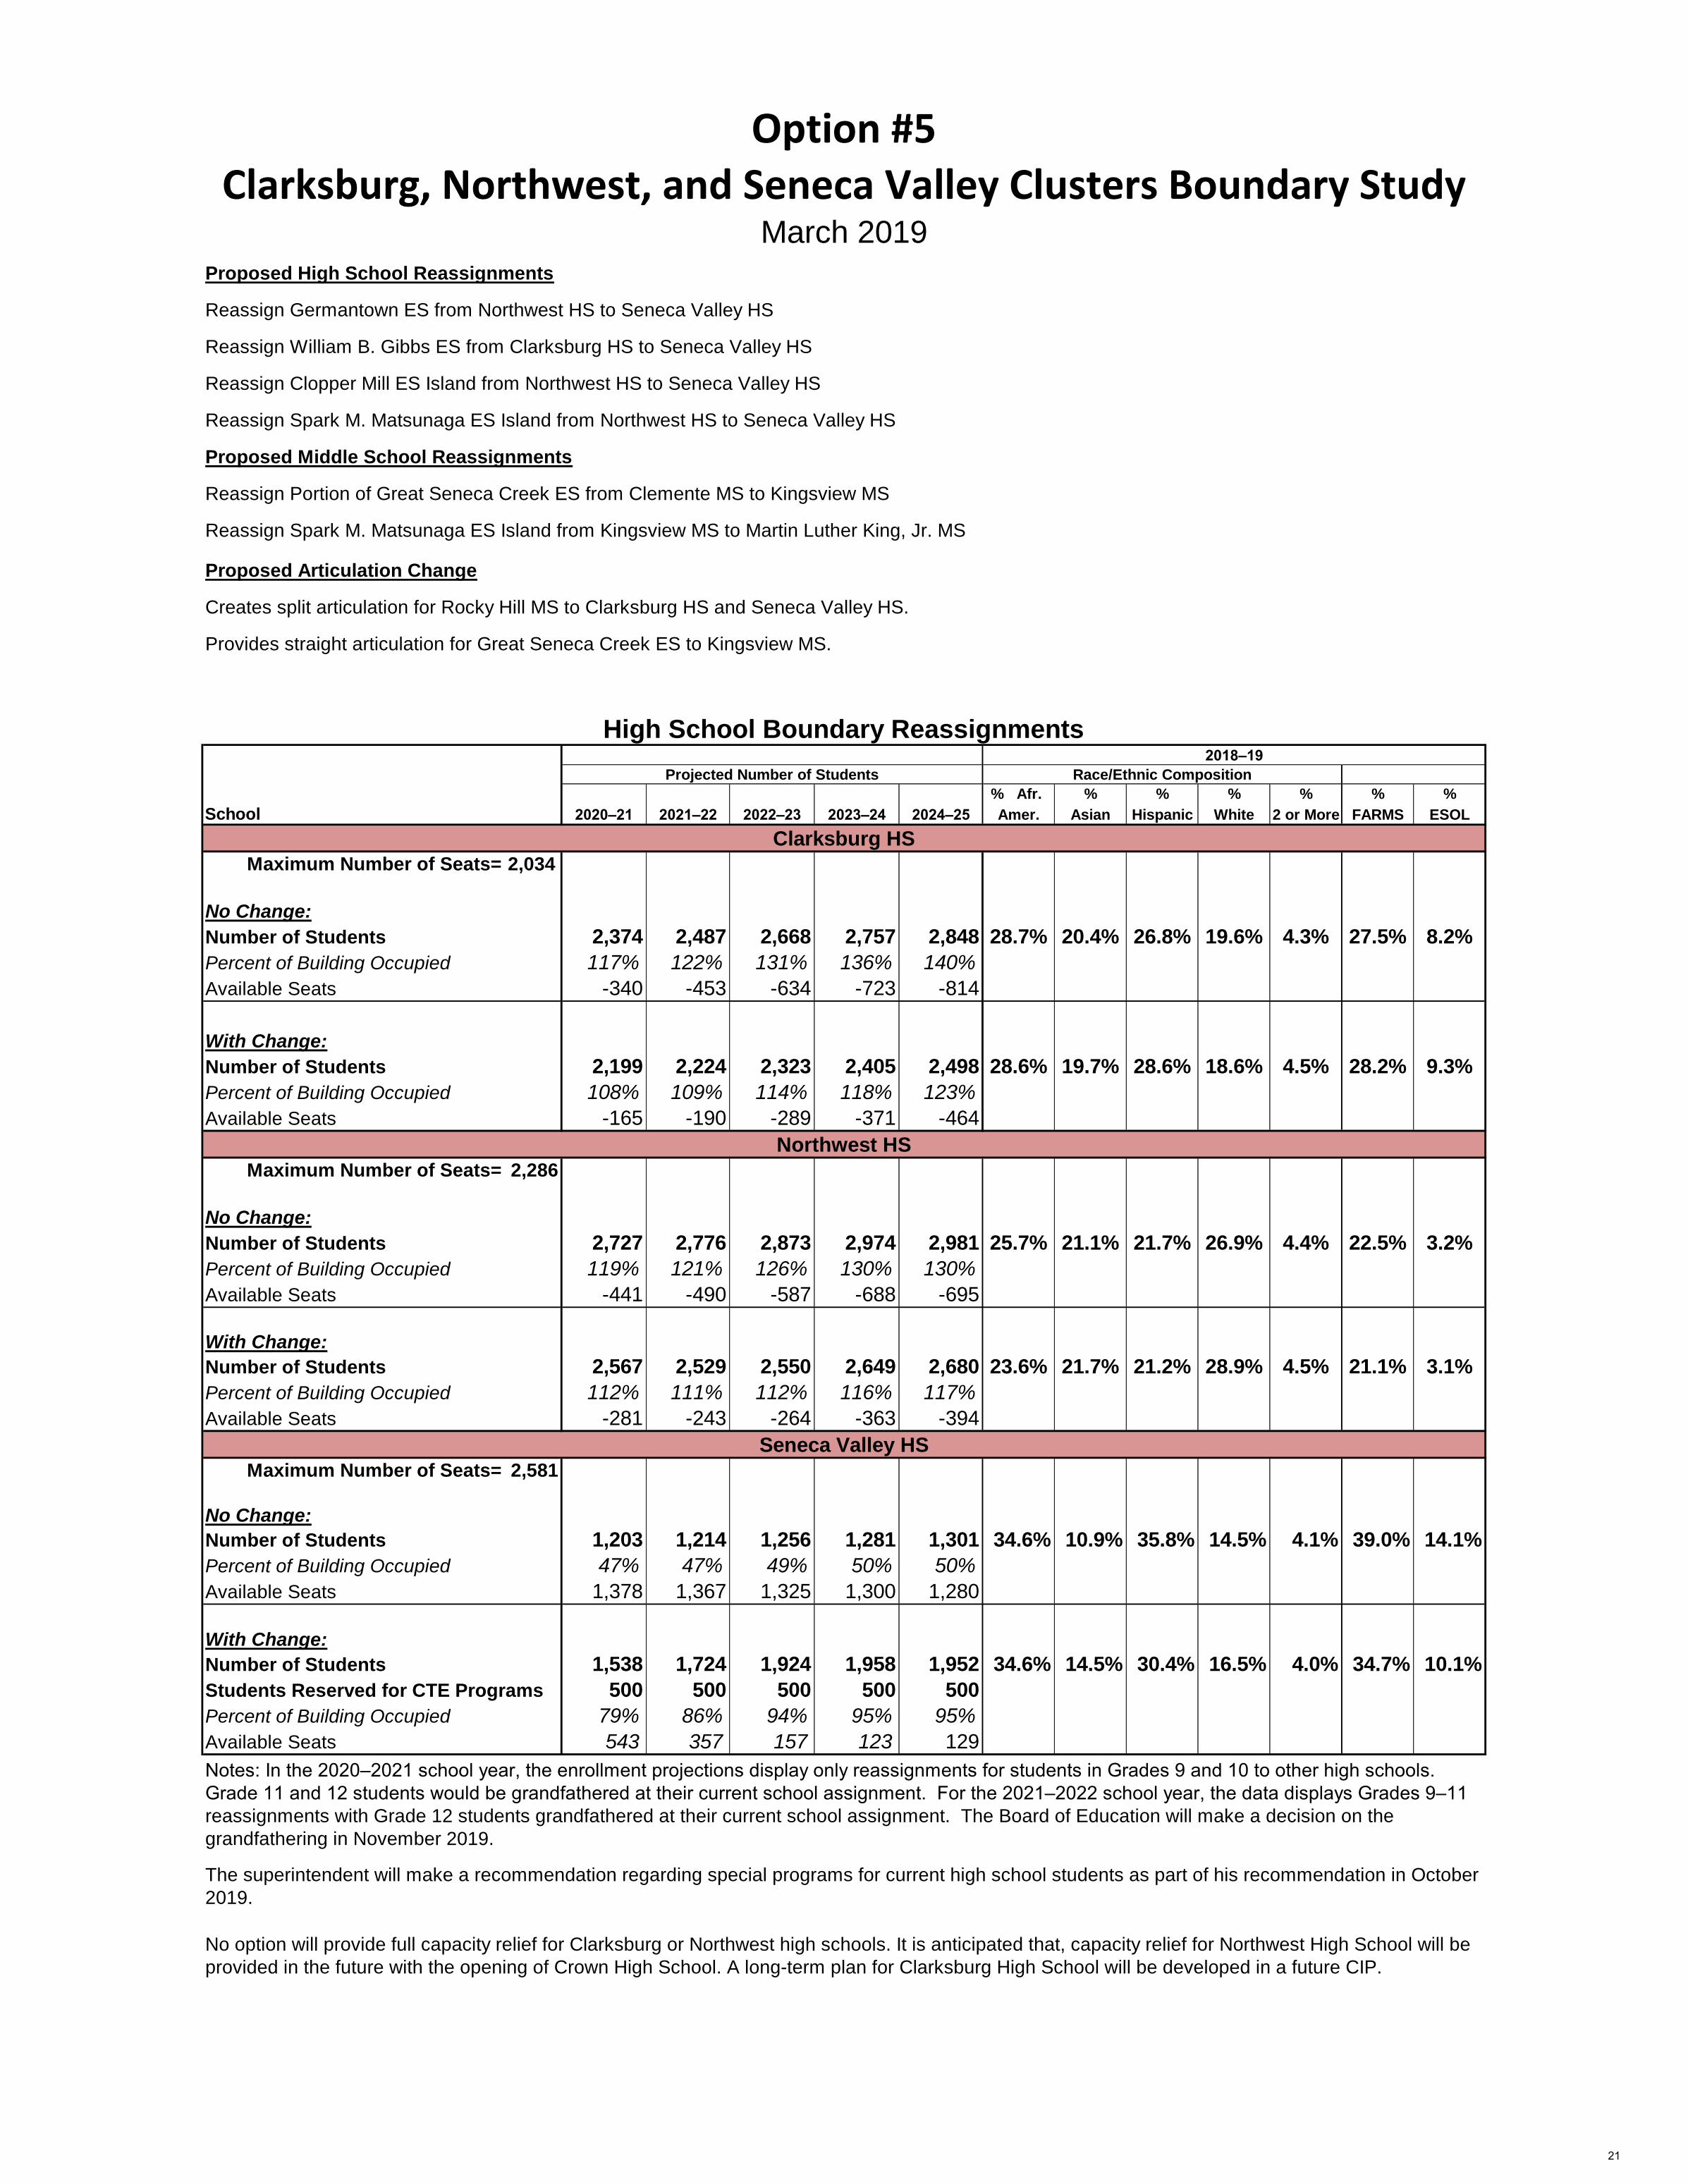
Reassign Germantown ES from Northwest HS to Seneca Valley HS
Reassign William B. Gibbs ES from Clarksburg HS to Seneca Valley HS
Reassign Clopper Mill ES Island from Northwest HS to Seneca Valley HS
Reassign Spark M. Matsunaga ES Island from Northwest HS to Seneca Valley HS
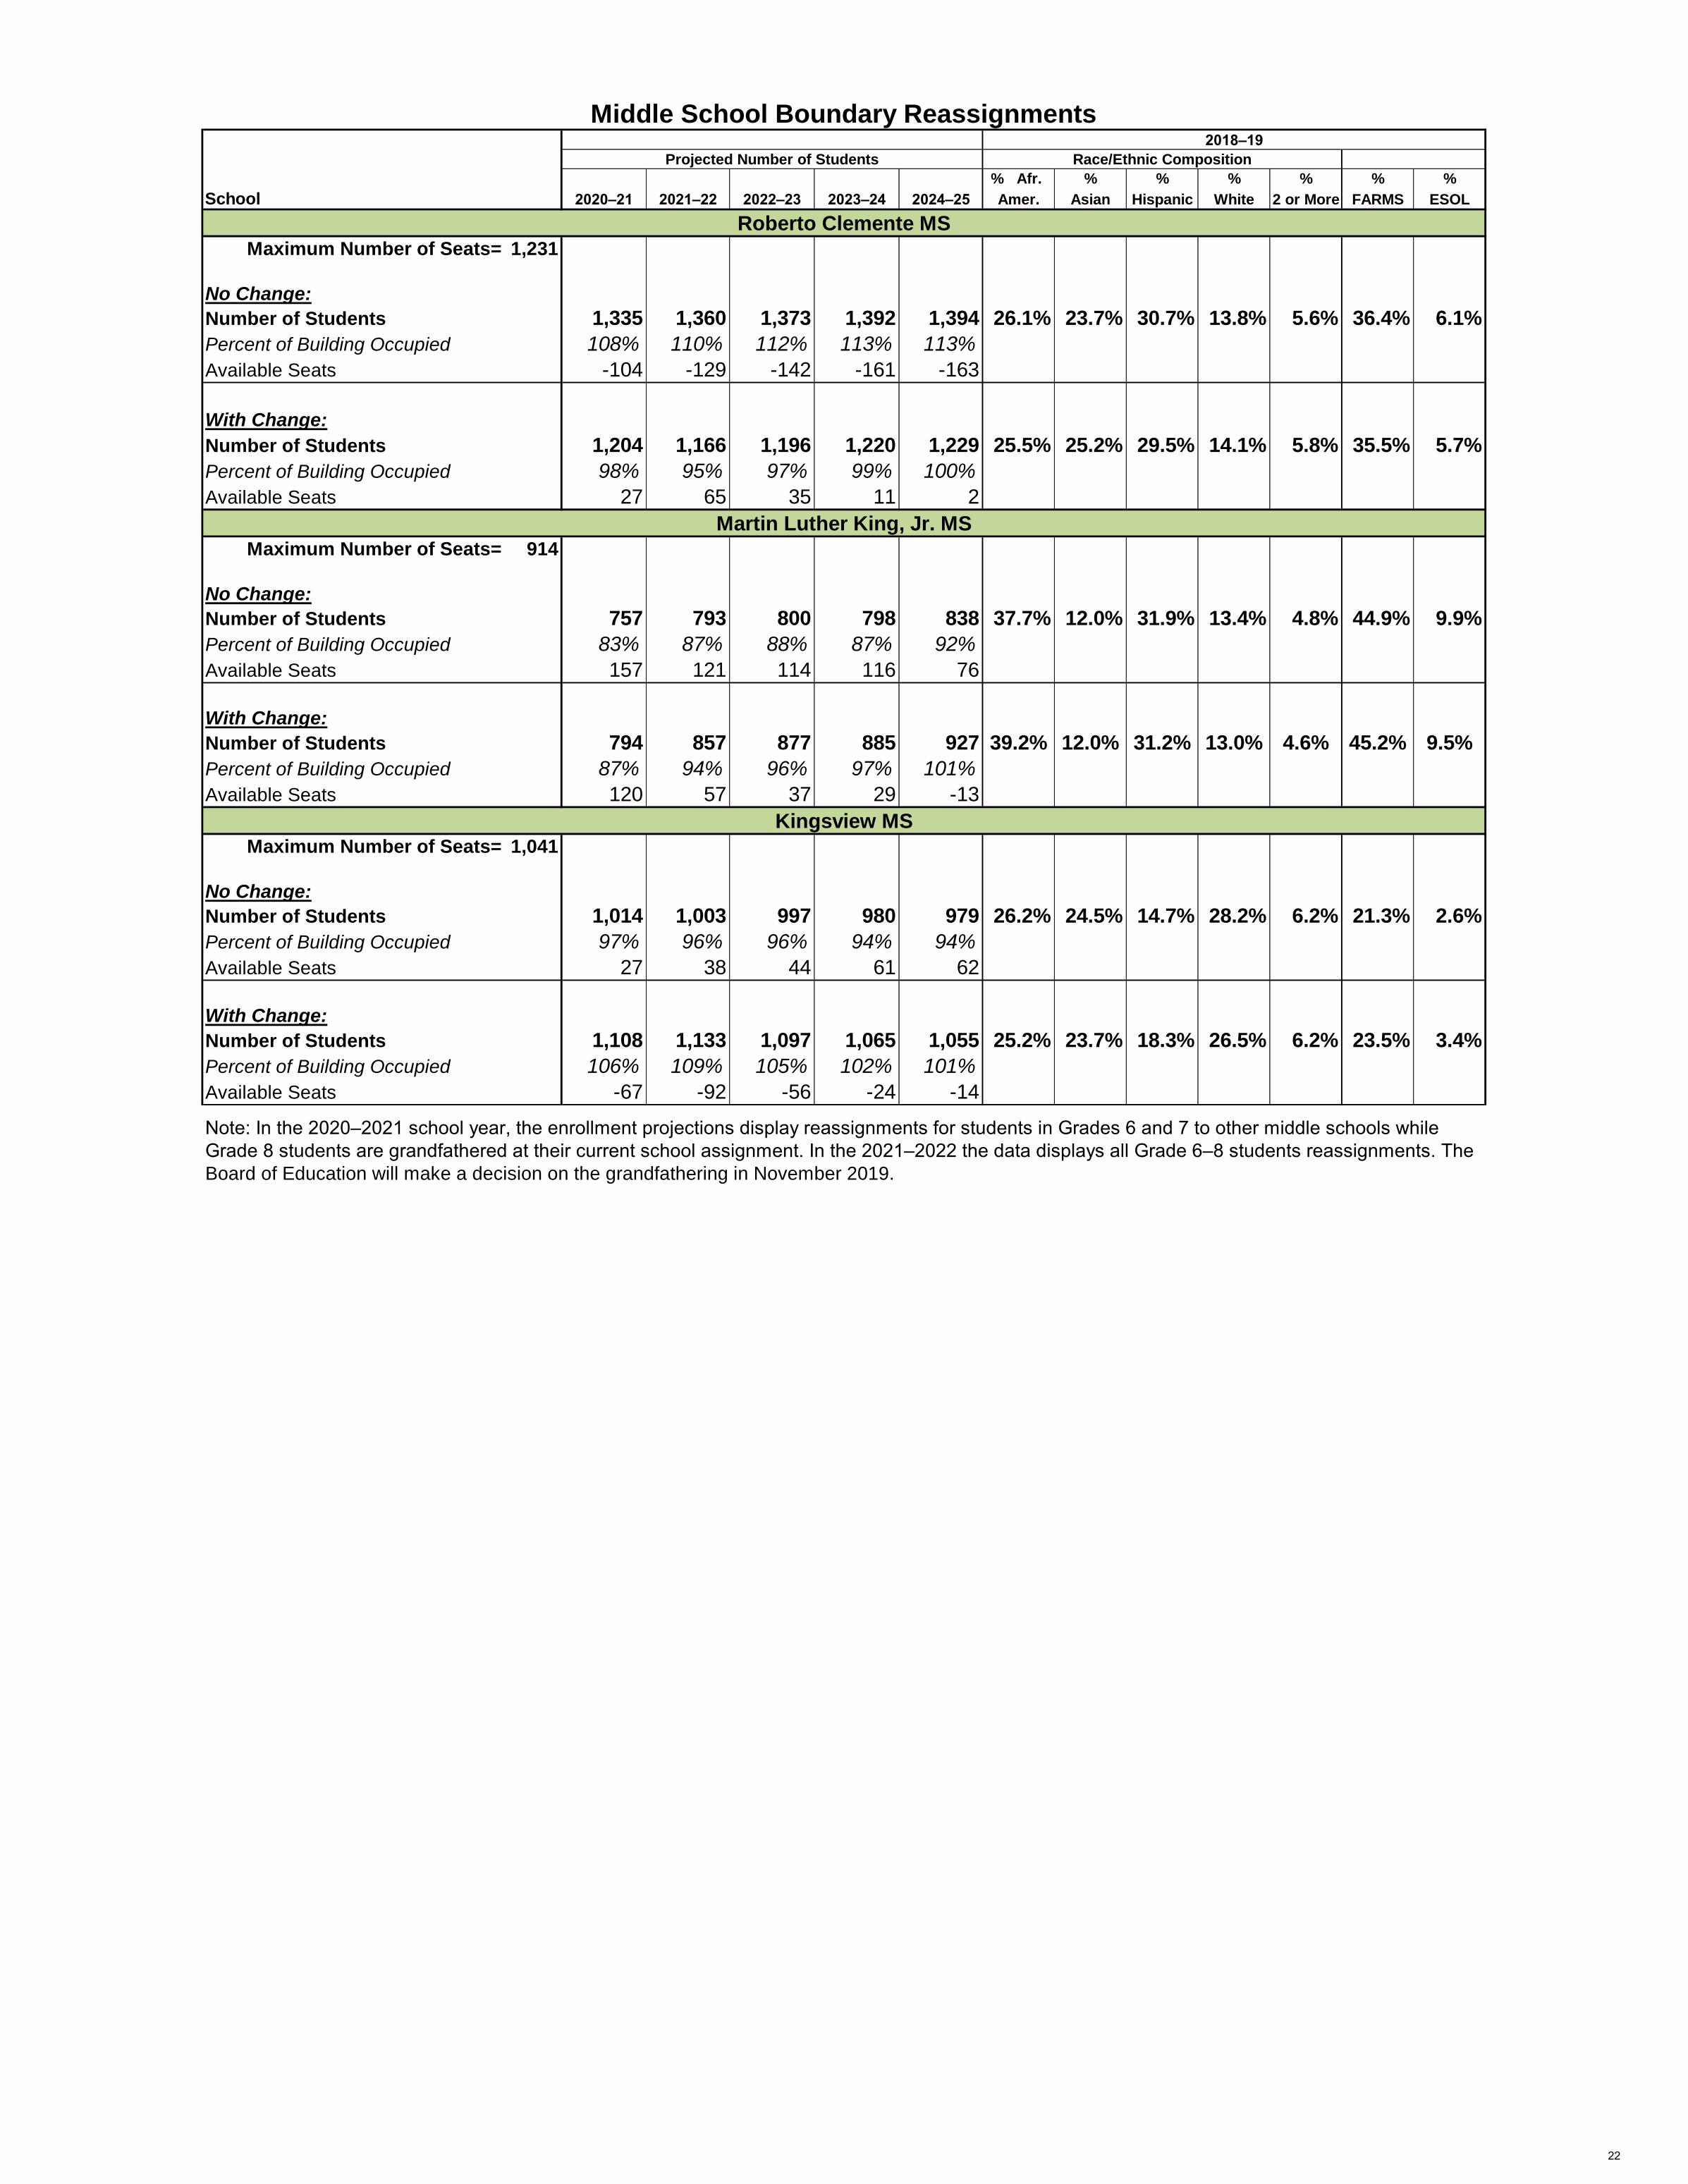
Proposed Middle School Reassignments
Reassign Portion of Great Seneca Creek ES from Clemente MS to Kingsview MSReassign Spark M. Matsunaga ES Island from Kingsview MS to Martin Luther King, Jr MS
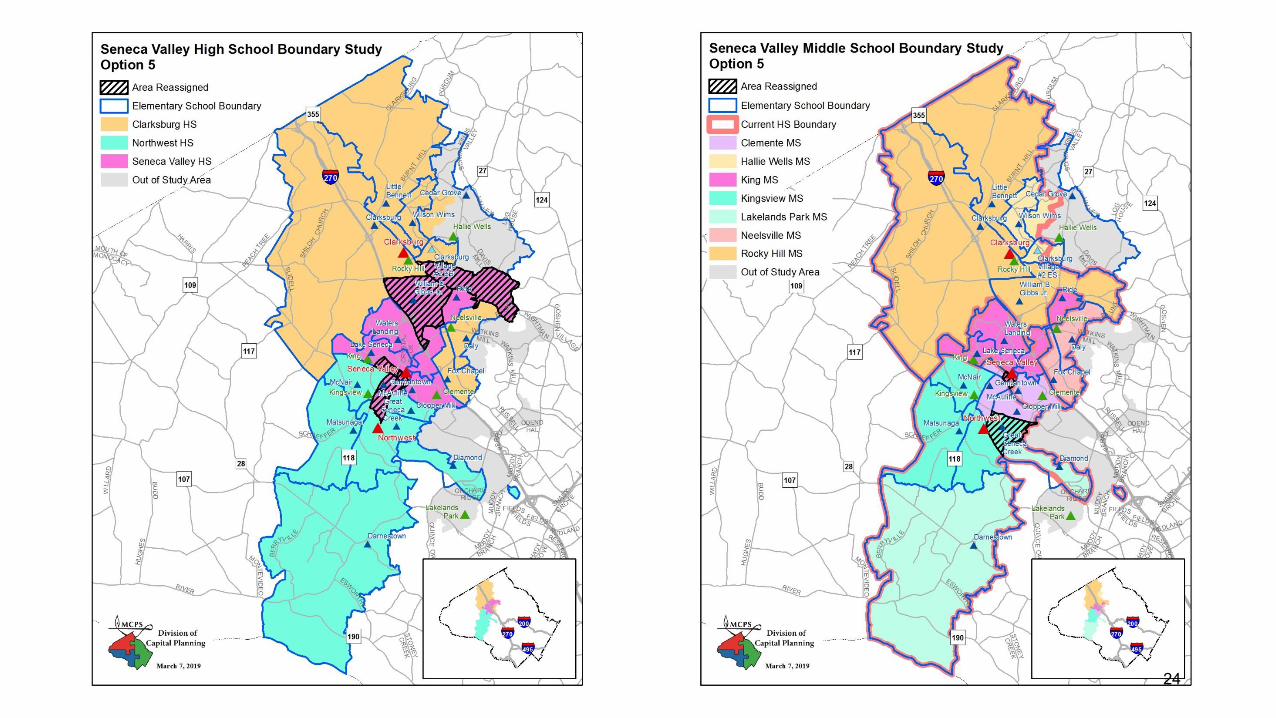
Proposed High School Reassignments
Reassign Germantown ES from Northwest HS to Seneca Valley HS
Reassign William B. Gibbs ES from Clarksburg HS to Seneca Valley HS
Reassign Clopper Mill ES Island from Northwest HS to Seneca Valley HS
Reassign Spark M. Matsunaga ES Island from Northwest HS to Seneca Valley HS
Proposed Middle School Reassignments
Reassign portion of Great Seneca Creek ES from Clemente MS to Kingsview MS
Reassign William B. Gibbs ES from Rocky Hill MS to Martin Luther King, Jr MSReassign Spark M. Matsunaga ES Island from Kingsview MS to Martin Luther King, Jr MS
Proposed High School ReassignmentsReassign a portion of William Gibbs ES (South of Old Baltimore Rd and West of Route 355) from Clarksburg HS to Seneca
Valley HSReassign Fox Chapel ES from Clarksburg ES to Seneca Valley HS
Reassign northern portion of Germantown ES from Northwest HS to Seneca Valley HS
Reassign Clopper Mill ES Island from Northwest HS to Seneca Valley HS
Reassign Spark M. Matsunaga ES Island from Northwest HS to Seneca Valley HS
Proposed Middle School Reassignments
Reassign Fox Chapel ES from Neelsville MS to Martin Luther King, Jr MS
Reassign portion of Great Seneca Creek ES from Clemente MS to Kingsview MSReassign Spark M. Matsunaga ES Island from Kingsview MS to Martin Luther King, Jr MS
Proposed High School Reassignments
Reassign McNair ES from Northwest HS to Seneca Valley HS
Reassign Fox Chapel ES from Clarksburg HS to Seneca Valley HS
Proposed Middle School Reassignments
Reassign Fox Chapel ES from Neelsville MS to Clemente MS
Reassign Germantown ES from Clemente MS to Kingsview MSReassign portion of Great Seneca Creek ES from Clemente MS to Kingsview MS
Option
#7
Option
#6
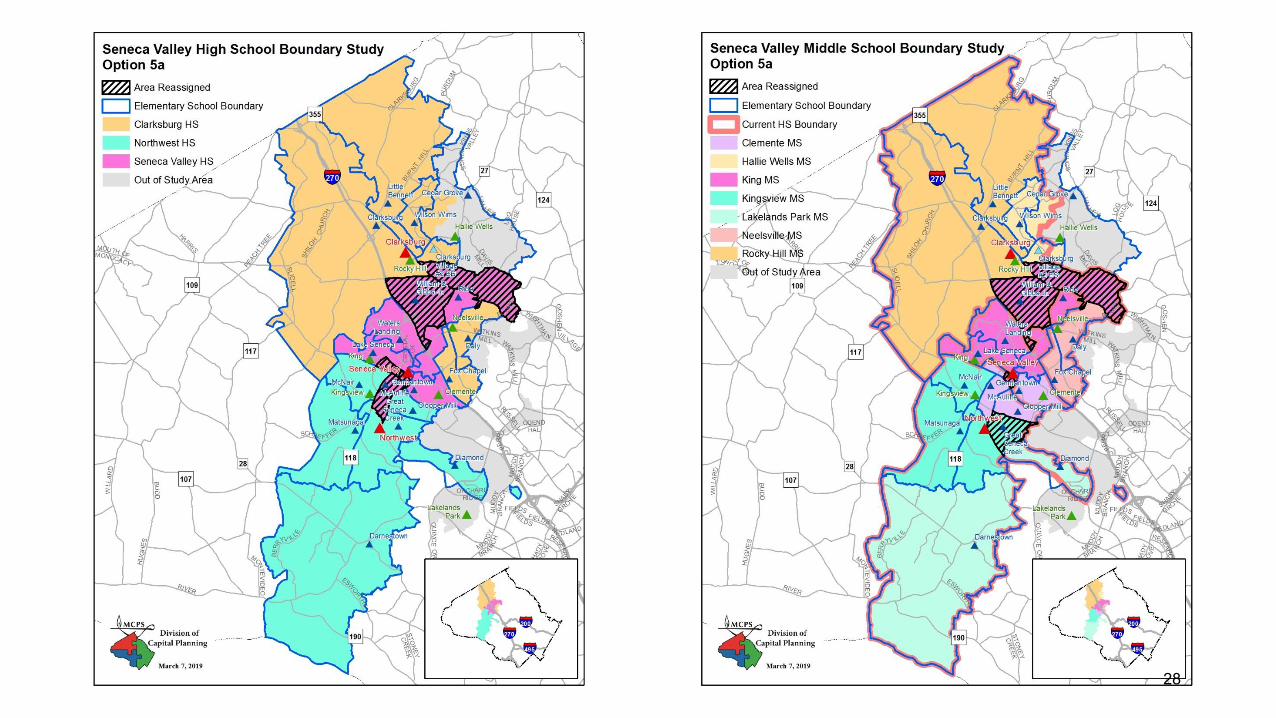
Option
#5a
Option
#4
Option
#2
Option
#3
Option
#5
Option
#1
March 2019
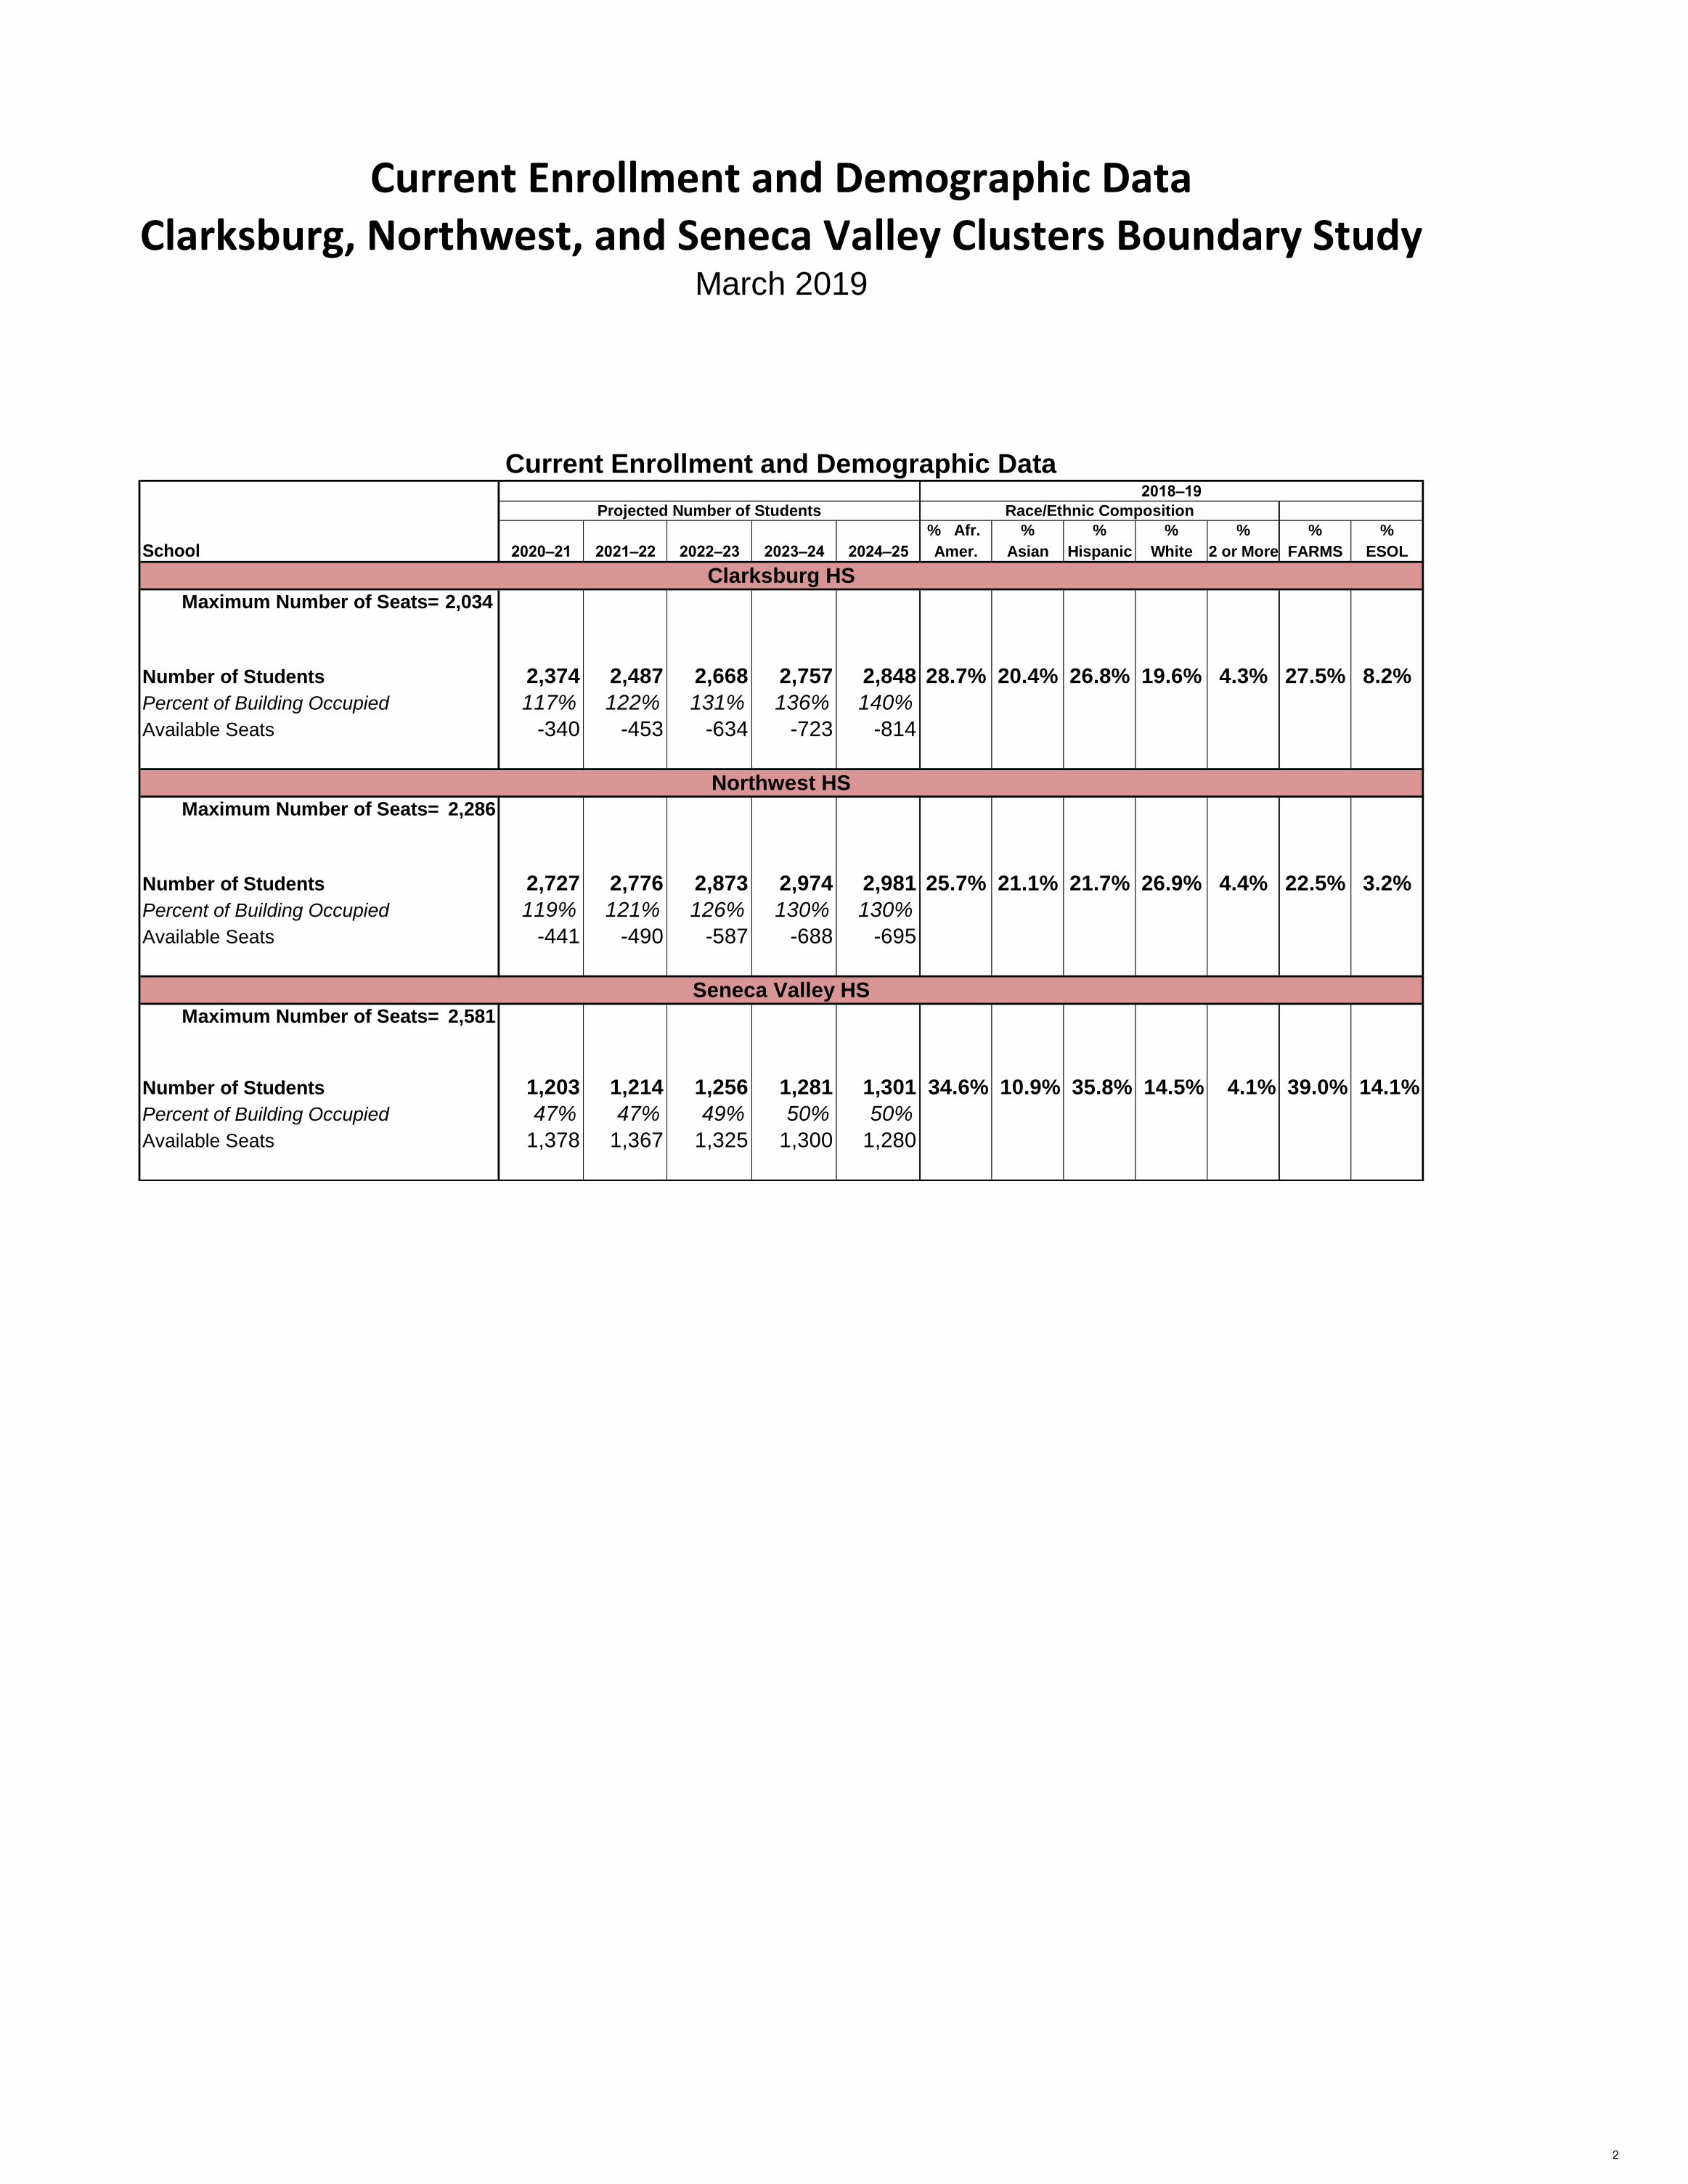
% Afr. % % % % % %
School 2020–21 2021–22 2022–23 2023–24 2024–25 Amer. Asian Hispanic White 2 or More FARMS ESOL
Maximum Number of Seats= 2,034
Number of Students 2,374 2,487 2,668 2,757 2,848 28.7% 20.4% 26.8% 19.6% 4.3% 27.5% 8.2%
Percent of Building Occupied 117% 122% 131% 136% 140%
Available Seats -340 -453 -634 -723 -814
Maximum Number of Seats= 2,286
Number of Students 2,727 2,776 2,873 2,974 2,981 25.7% 21.1% 21.7% 26.9% 4.4% 22.5% 3.2%
Percent of Building Occupied 119% 121% 126% 130% 130%
Available Seats -441 -490 -587 -688 -695
Maximum Number of Seats= 2,581
Number of Students 1,203 1,214 1,256 1,281 1,301 34.6% 10.9% 35.8% 14.5% 4.1% 39.0% 14.1%
Percent of Building Occupied 47% 47% 49% 50% 50%
Available Seats 1,378 1,367 1,325 1,300 1,280
Clarksburg HS
Northwest HS
Seneca Valley HS
Clarksburg, Northwest, and Seneca Valley Clusters Boundary StudyMarch 2019
Current Enrollment and Demographic Data2018–19
Projected Number of Students Race/Ethnic Composition
Current Enrollment and Demographic Data
2
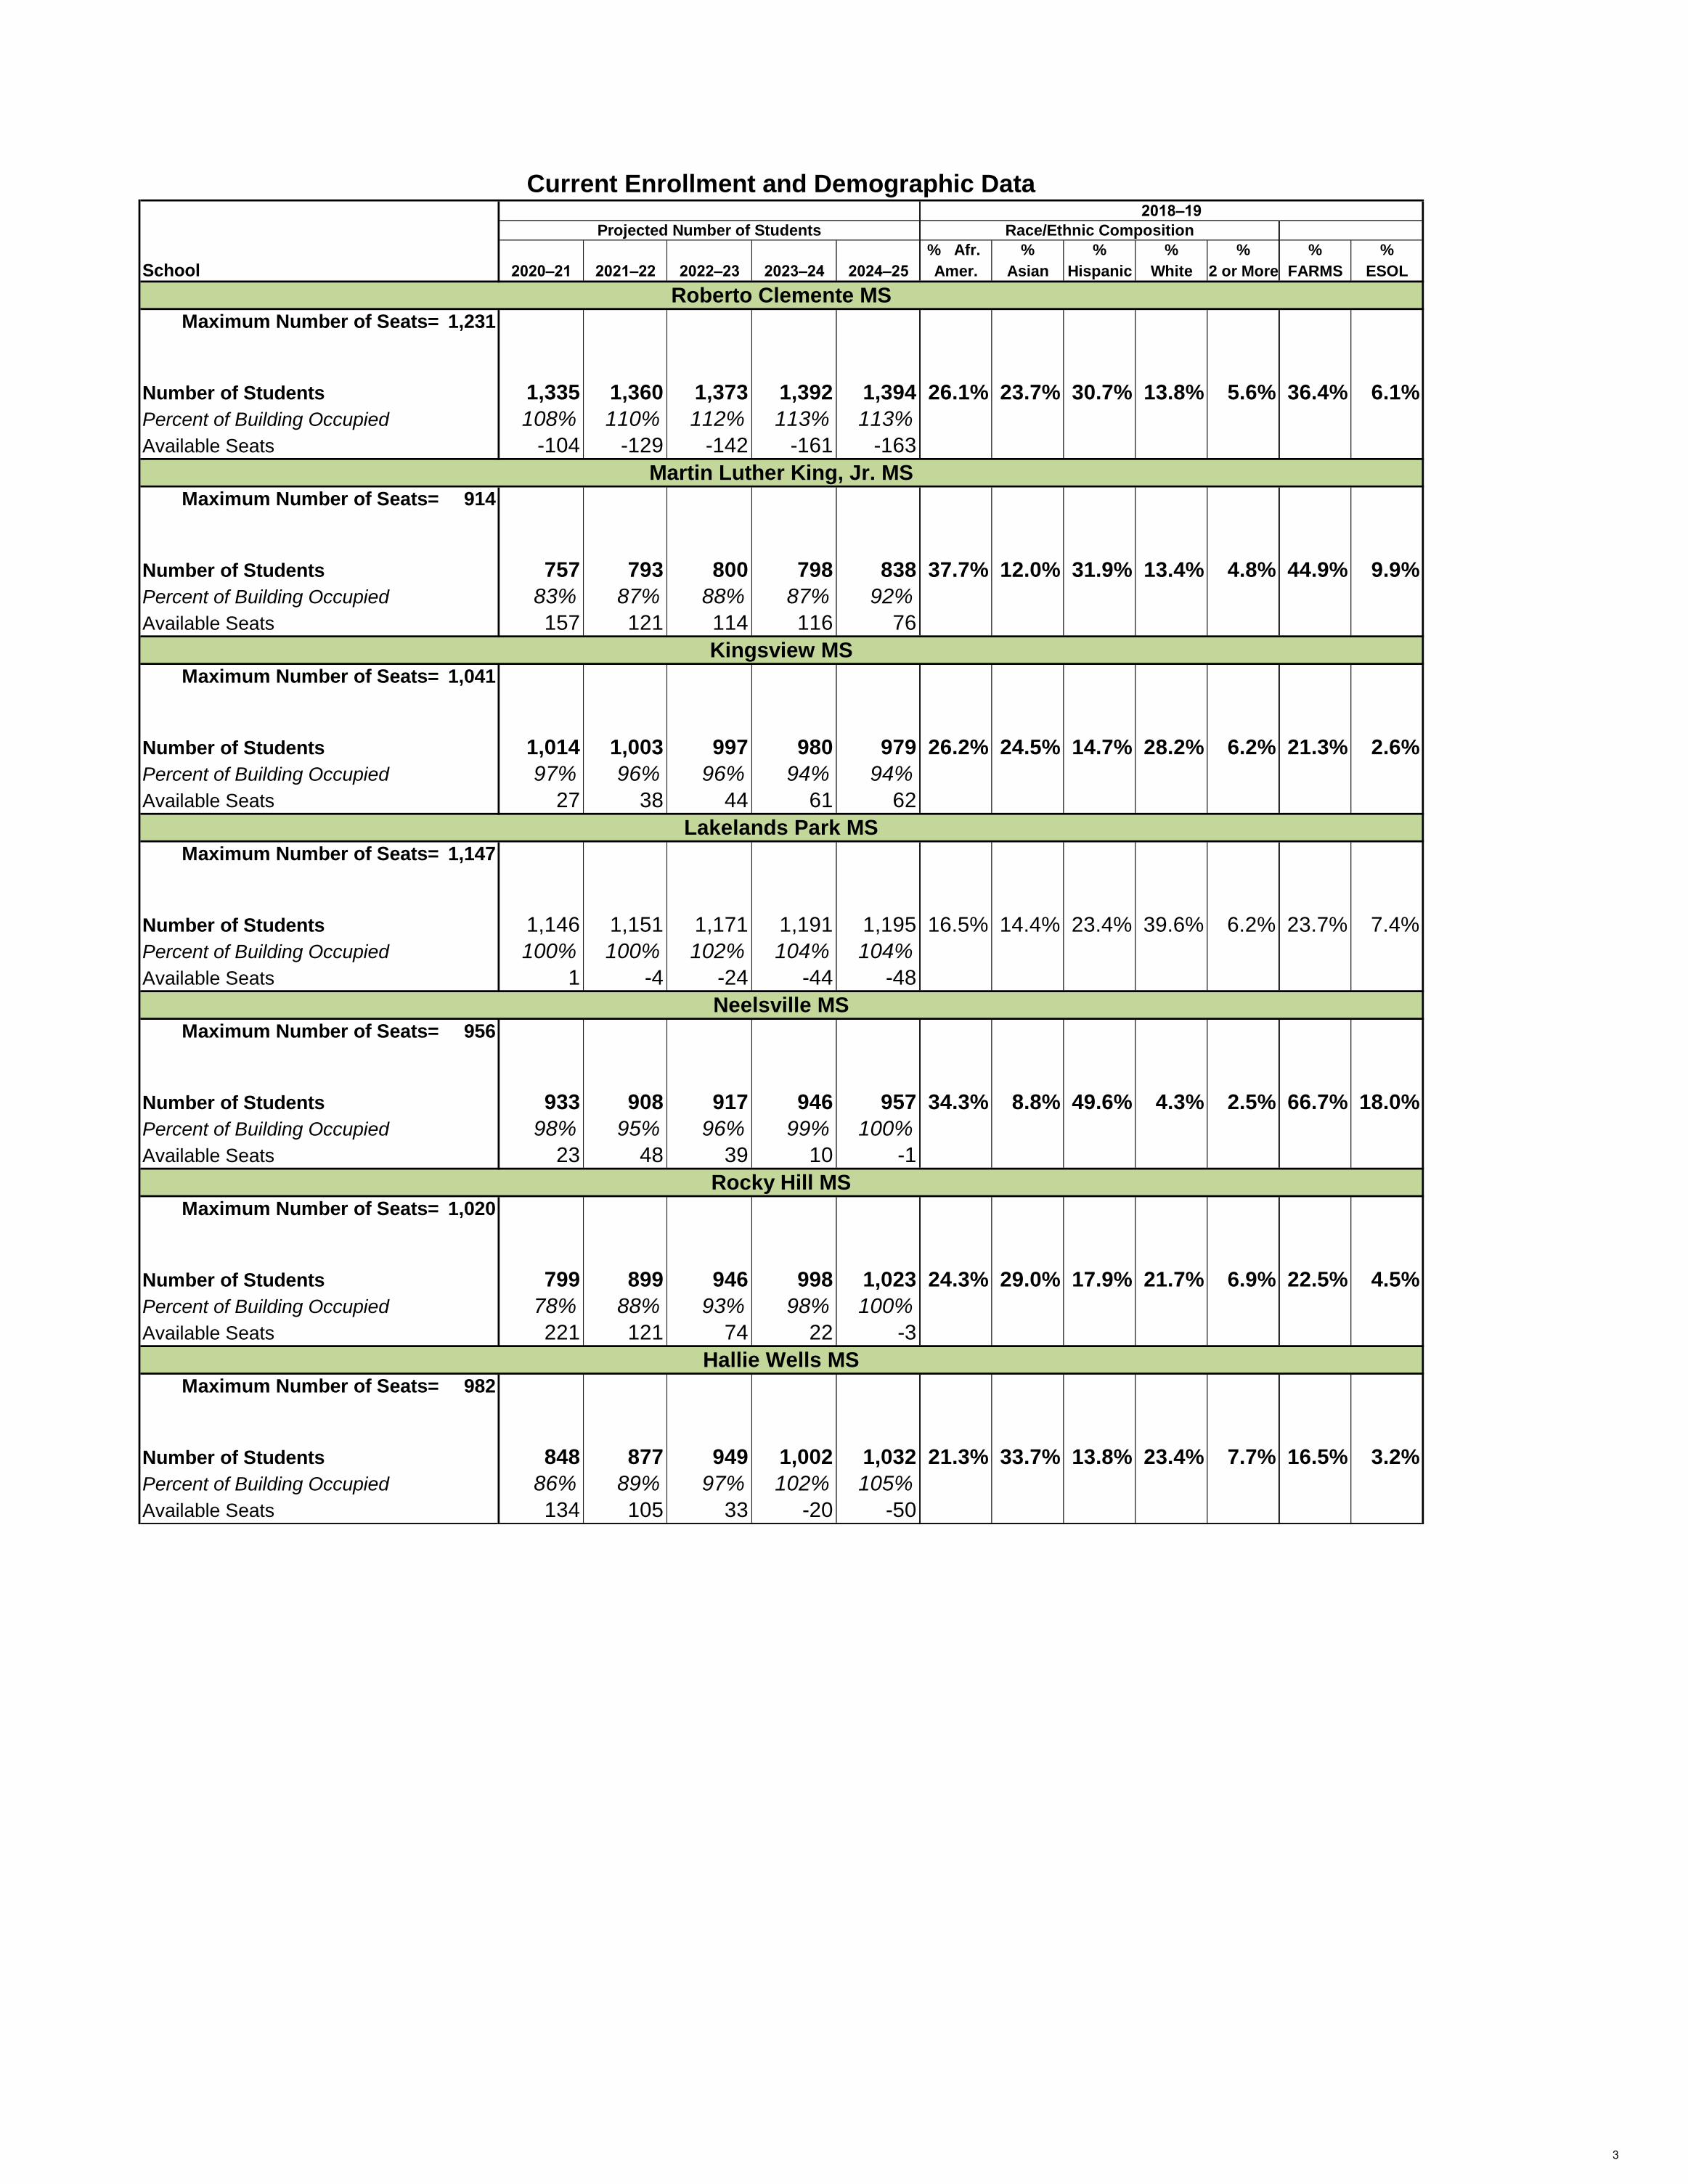
% Afr. % % % % % %
School 2020–21 2021–22 2022–23 2023–24 2024–25 Amer. Asian Hispanic White 2 or More FARMS ESOL
Maximum Number of Seats= 1,231
Number of Students 1,335 1,360 1,373 1,392 1,394 26.1% 23.7% 30.7% 13.8% 5.6% 36.4% 6.1%
Percent of Building Occupied 108% 110% 112% 113% 113%
Available Seats -104 -129 -142 -161 -163
Maximum Number of Seats= 914
Number of Students 757 793 800 798 838 37.7% 12.0% 31.9% 13.4% 4.8% 44.9% 9.9%
Percent of Building Occupied 83% 87% 88% 87% 92%
Available Seats 157 121 114 116 76
Maximum Number of Seats= 1,041
Number of Students 1,014 1,003 997 980 979 26.2% 24.5% 14.7% 28.2% 6.2% 21.3% 2.6%
Percent of Building Occupied 97% 96% 96% 94% 94%
Available Seats 27 38 44 61 62
Maximum Number of Seats= 1,147
Number of Students 1,146 1,151 1,171 1,191 1,195 16.5% 14.4% 23.4% 39.6% 6.2% 23.7% 7.4%
Percent of Building Occupied 100% 100% 102% 104% 104%
Available Seats 1 -4 -24 -44 -48
Maximum Number of Seats= 956
Number of Students 933 908 917 946 957 34.3% 8.8% 49.6% 4.3% 2.5% 66.7% 18.0%
Percent of Building Occupied 98% 95% 96% 99% 100%
Available Seats 23 48 39 10 -1
Maximum Number of Seats= 1,020
Number of Students 799 899 946 998 1,023 24.3% 29.0% 17.9% 21.7% 6.9% 22.5% 4.5%
Percent of Building Occupied 78% 88% 93% 98% 100%
Available Seats 221 121 74 22 -3
Maximum Number of Seats= 982
Number of Students 848 877 949 1,002 1,032 21.3% 33.7% 13.8% 23.4% 7.7% 16.5% 3.2%
Percent of Building Occupied 86% 89% 97% 102% 105%
Available Seats 134 105 33 -20 -50
Rocky Hill MS
Hallie Wells MS
Current Enrollment and Demographic Data
Roberto Clemente MS
Martin Luther King, Jr. MS
Kingsview MS
Lakelands Park MS
Neelsville MS
2018–19
Projected Number of Students Race/Ethnic Composition
3
4
Proposed High School Reassignments
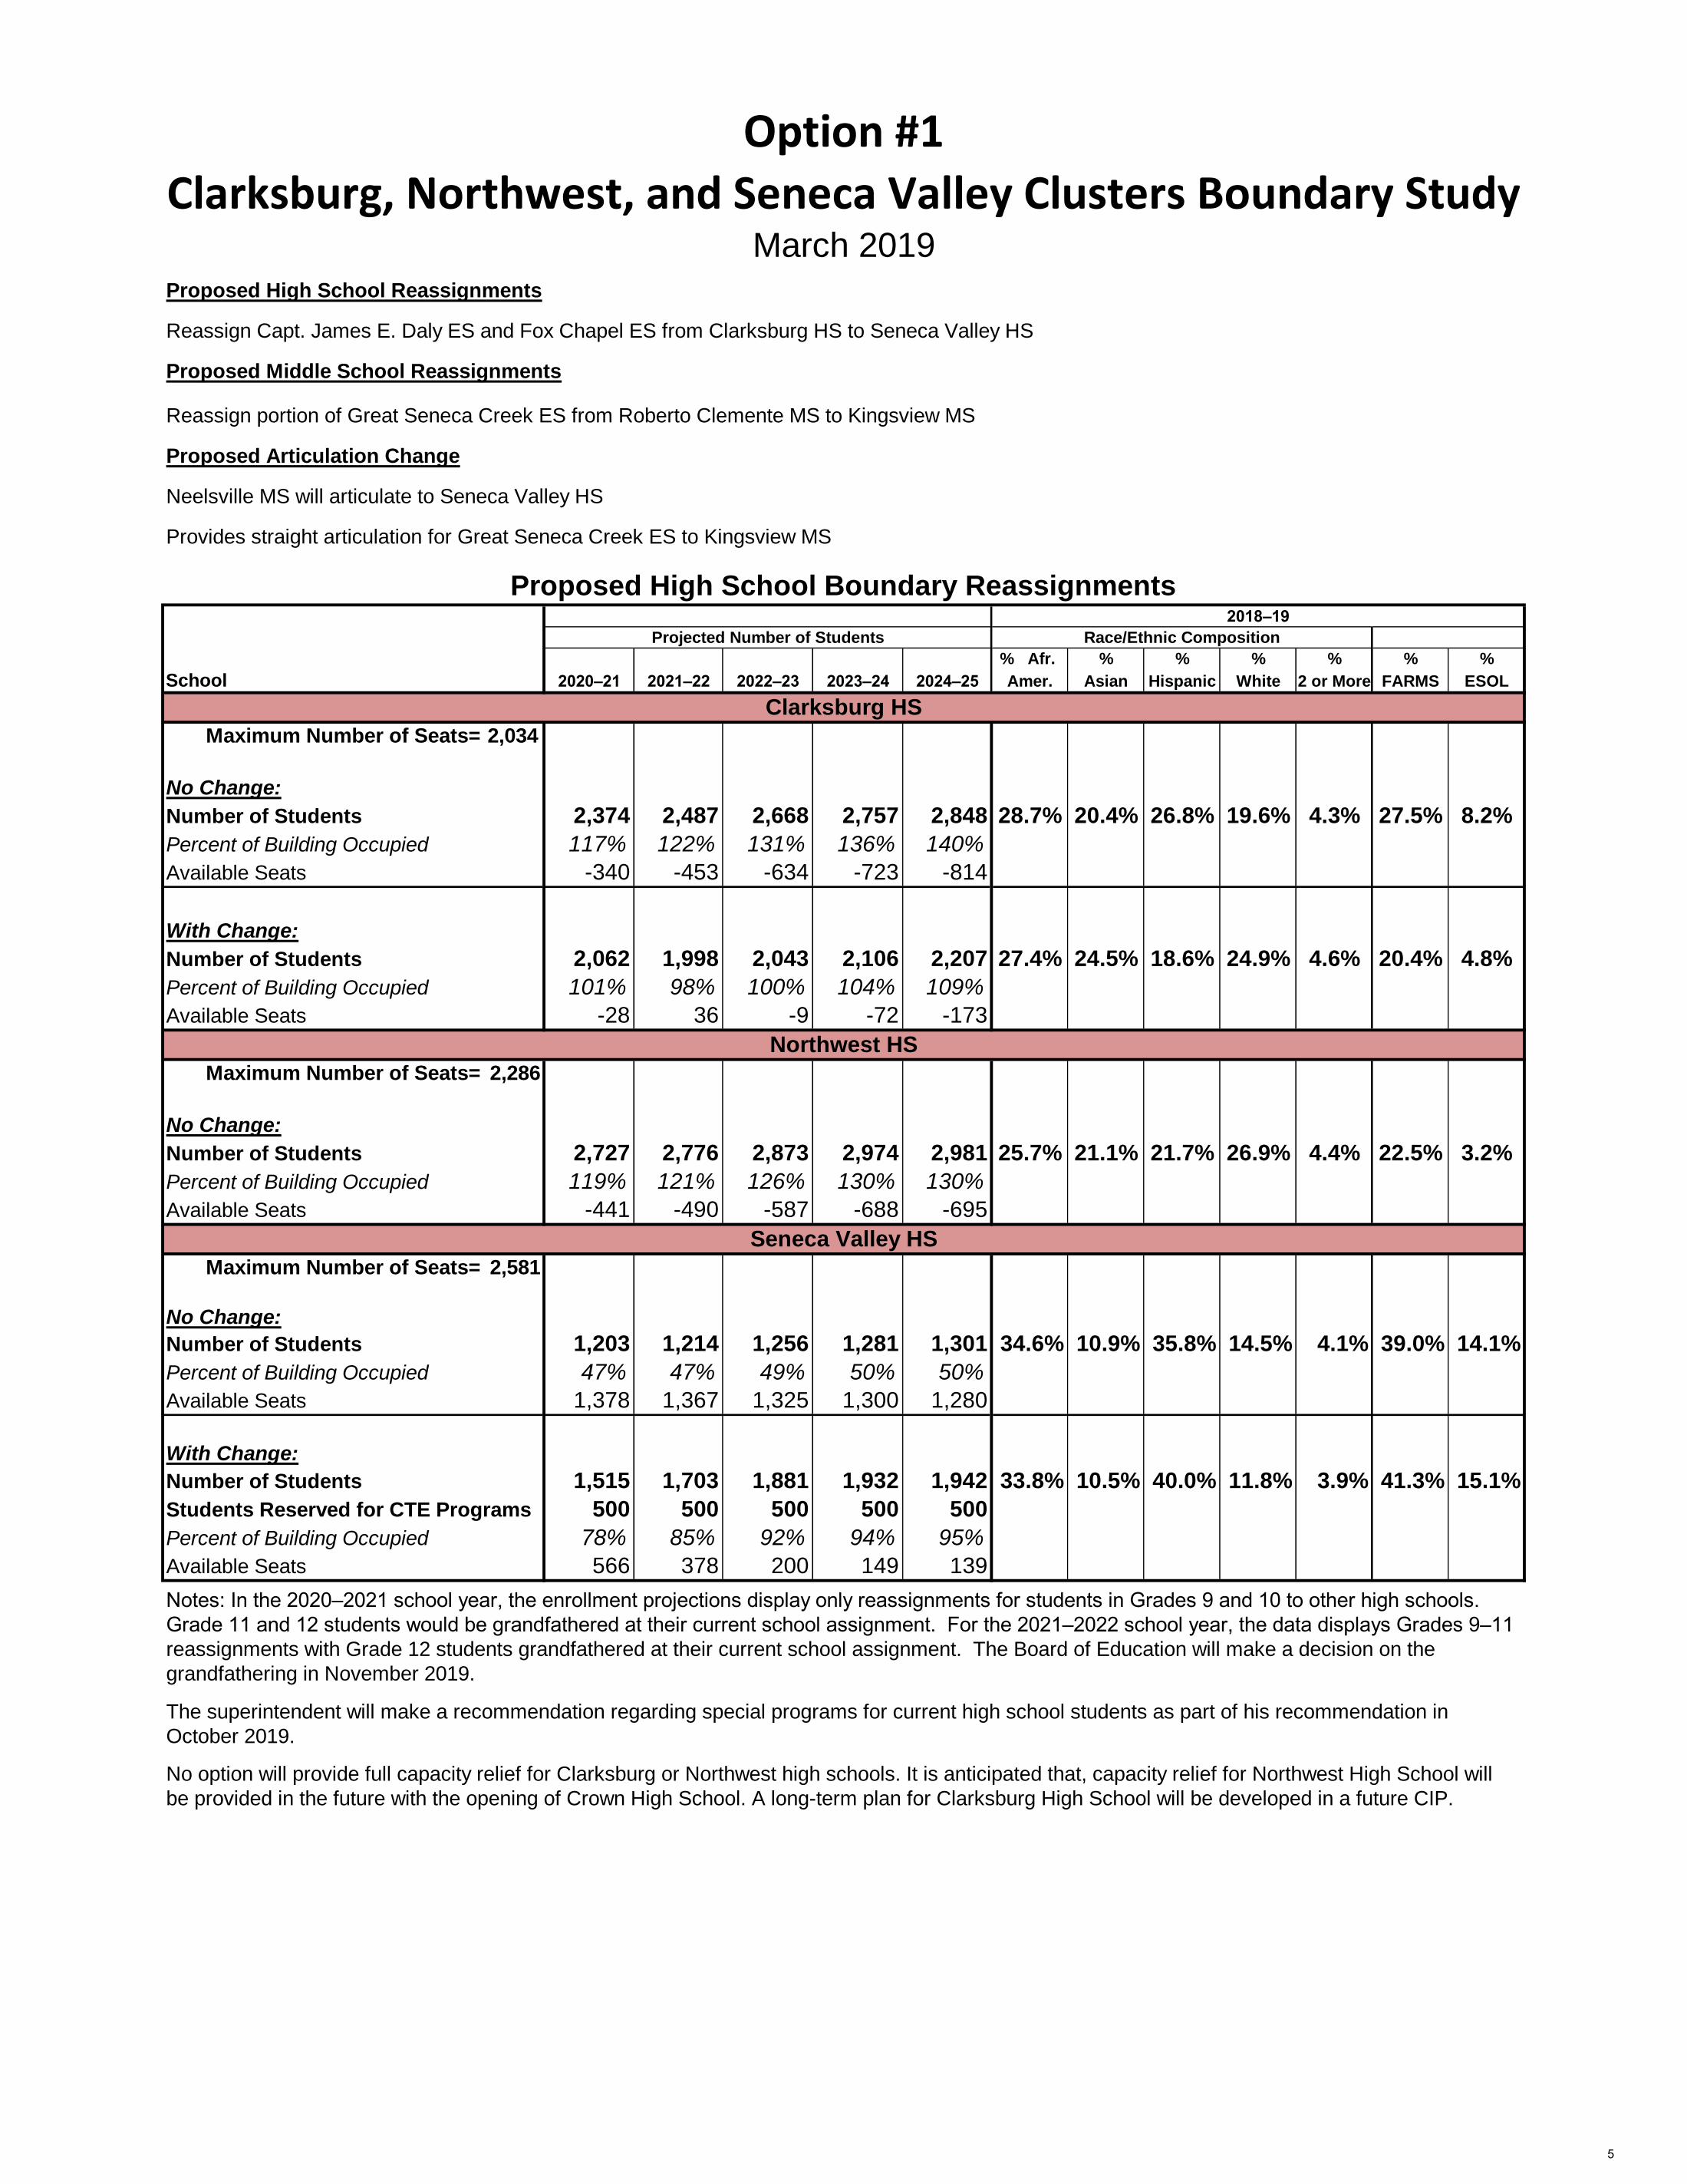
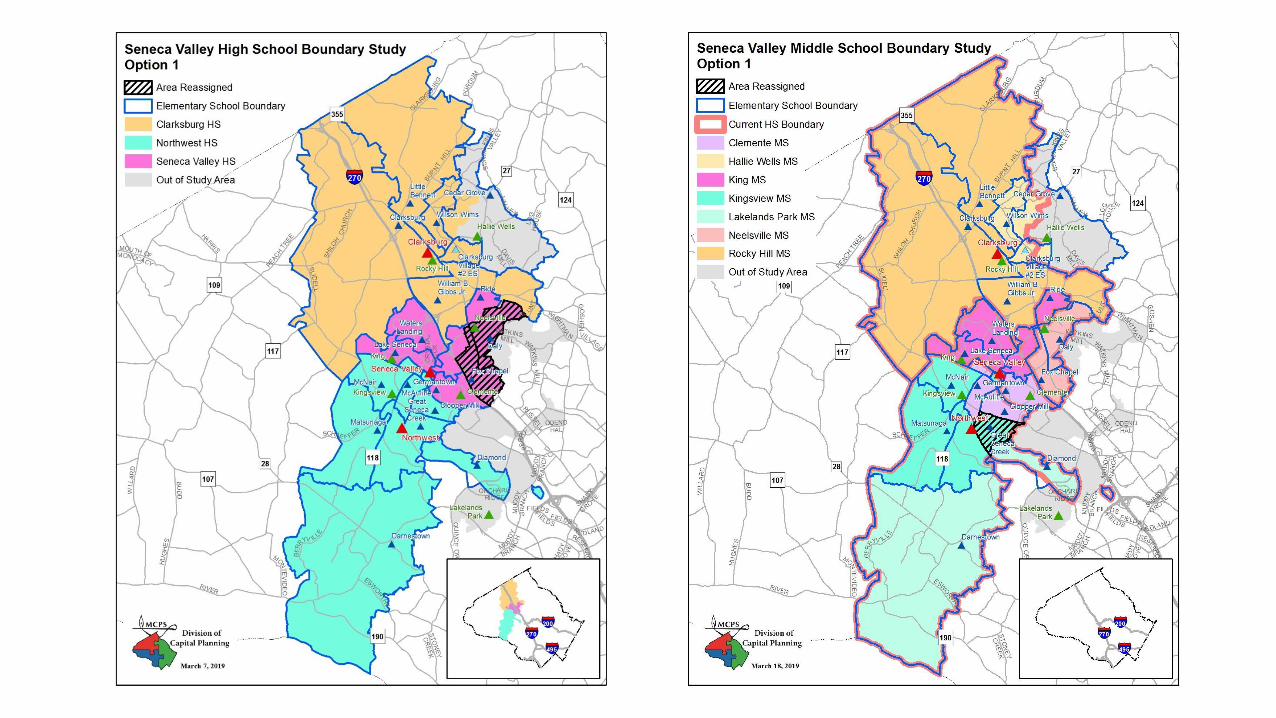
Reassign Capt. James E. Daly ES and Fox Chapel ES from Clarksburg HS to Seneca Valley HS
Proposed Middle School Reassignments
Reassign portion of Great Seneca Creek ES from Roberto Clemente MS to Kingsview MS
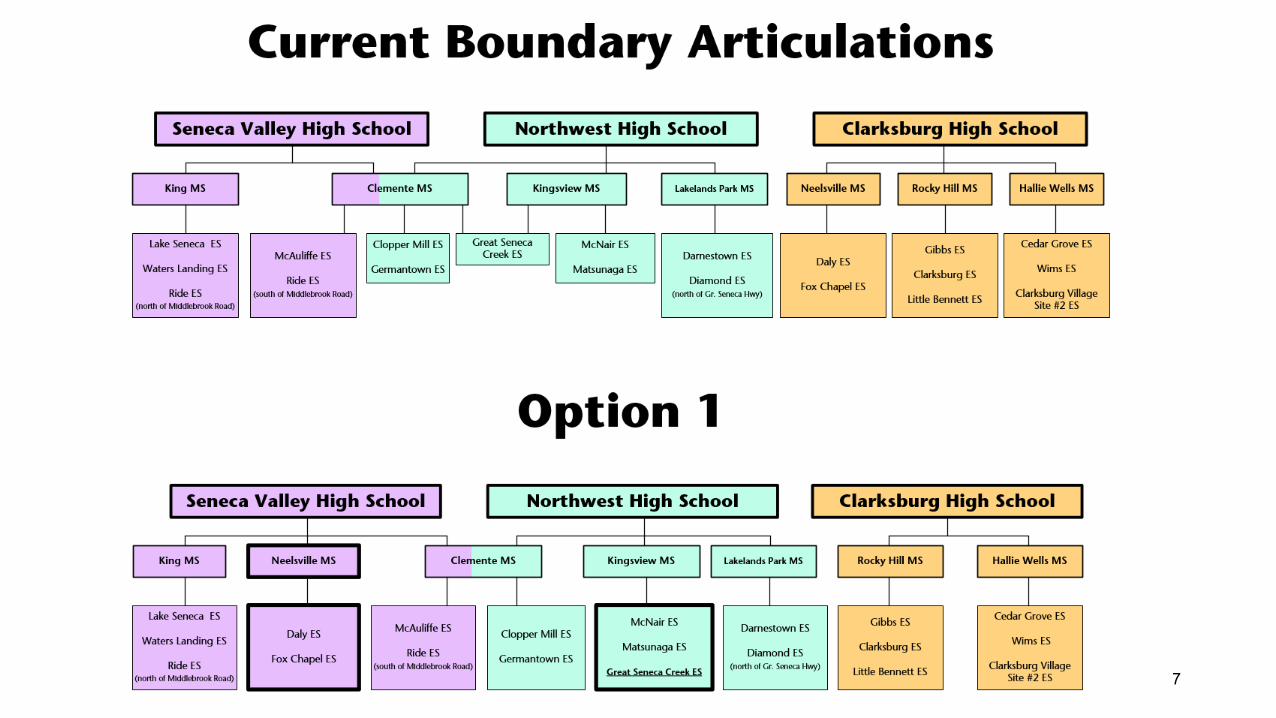
Proposed Articulation Change
Neelsville MS will articulate to Seneca Valley HS
Provides straight articulation for Great Seneca Creek ES to Kingsview MS
% Afr. % % % % % %
School 2020–21 2021–22 2022–23 2023–24 2024–25 Amer. Asian Hispanic White 2 or More FARMS ESOL
Maximum Number of Seats= 2,034
No Change:
Number of Students 2,374 2,487 2,668 2,757 2,848 28.7% 20.4% 26.8% 19.6% 4.3% 27.5% 8.2%
Percent of Building Occupied 117% 122% 131% 136% 140%
Available Seats -340 -453 -634 -723 -814
With Change:
Number of Students 2,062 1,998 2,043 2,106 2,207 27.4% 24.5% 18.6% 24.9% 4.6% 20.4% 4.8%
Percent of Building Occupied 101% 98% 100% 104% 109%
Available Seats -28 36 -9 -72 -173
Maximum Number of Seats= 2,286
No Change:
Number of Students 2,727 2,776 2,873 2,974 2,981 25.7% 21.1% 21.7% 26.9% 4.4% 22.5% 3.2%
Percent of Building Occupied 119% 121% 126% 130% 130%
Available Seats -441 -490 -587 -688 -695
Maximum Number of Seats= 2,581
No Change:
Number of Students 1,203 1,214 1,256 1,281 1,301 34.6% 10.9% 35.8% 14.5% 4.1% 39.0% 14.1%
Percent of Building Occupied 47% 47% 49% 50% 50%
Available Seats 1,378 1,367 1,325 1,300 1,280
With Change:
Number of Students 1,515 1,703 1,881 1,932 1,942 33.8% 10.5% 40.0% 11.8% 3.9% 41.3% 15.1%
Students Reserved for CTE Programs 500 500 500 500 500
Percent of Building Occupied 78% 85% 92% 94% 95%
Available Seats 566 378 200 149 139
Option #1
Clarksburg, Northwest, and Seneca Valley Clusters Boundary StudyMarch 2019
Proposed High School Boundary Reassignments2018–19
Projected Number of Students Race/Ethnic Composition
Notes: In the 2020–2021 school year, the enrollment projections display only reassignments for students in Grades 9 and 10 to other high schools.
Grade 11 and 12 students would be grandfathered at their current school assignment. For the 2021–2022 school year, the data displays Grades 9–11
reassignments with Grade 12 students grandfathered at their current school assignment. The Board of Education will make a decision on the
grandfathering in November 2019.
Clarksburg HS
Northwest HS
Seneca Valley HS
The superintendent will make a recommendation regarding special programs for current high school students as part of his recommendation in
October 2019.
No option will provide full capacity relief for Clarksburg or Northwest high schools. It is anticipated that, capacity relief for Northwest High School will
be provided in the future with the opening of Crown High School. A long-term plan for Clarksburg High School will be developed in a future CIP.
5
% Afr. % % % % % %
School 2020–21 2021–22 2022–23 2023–24 2024–25 Amer. Asian Hispanic White 2 or More FARMS ESOL
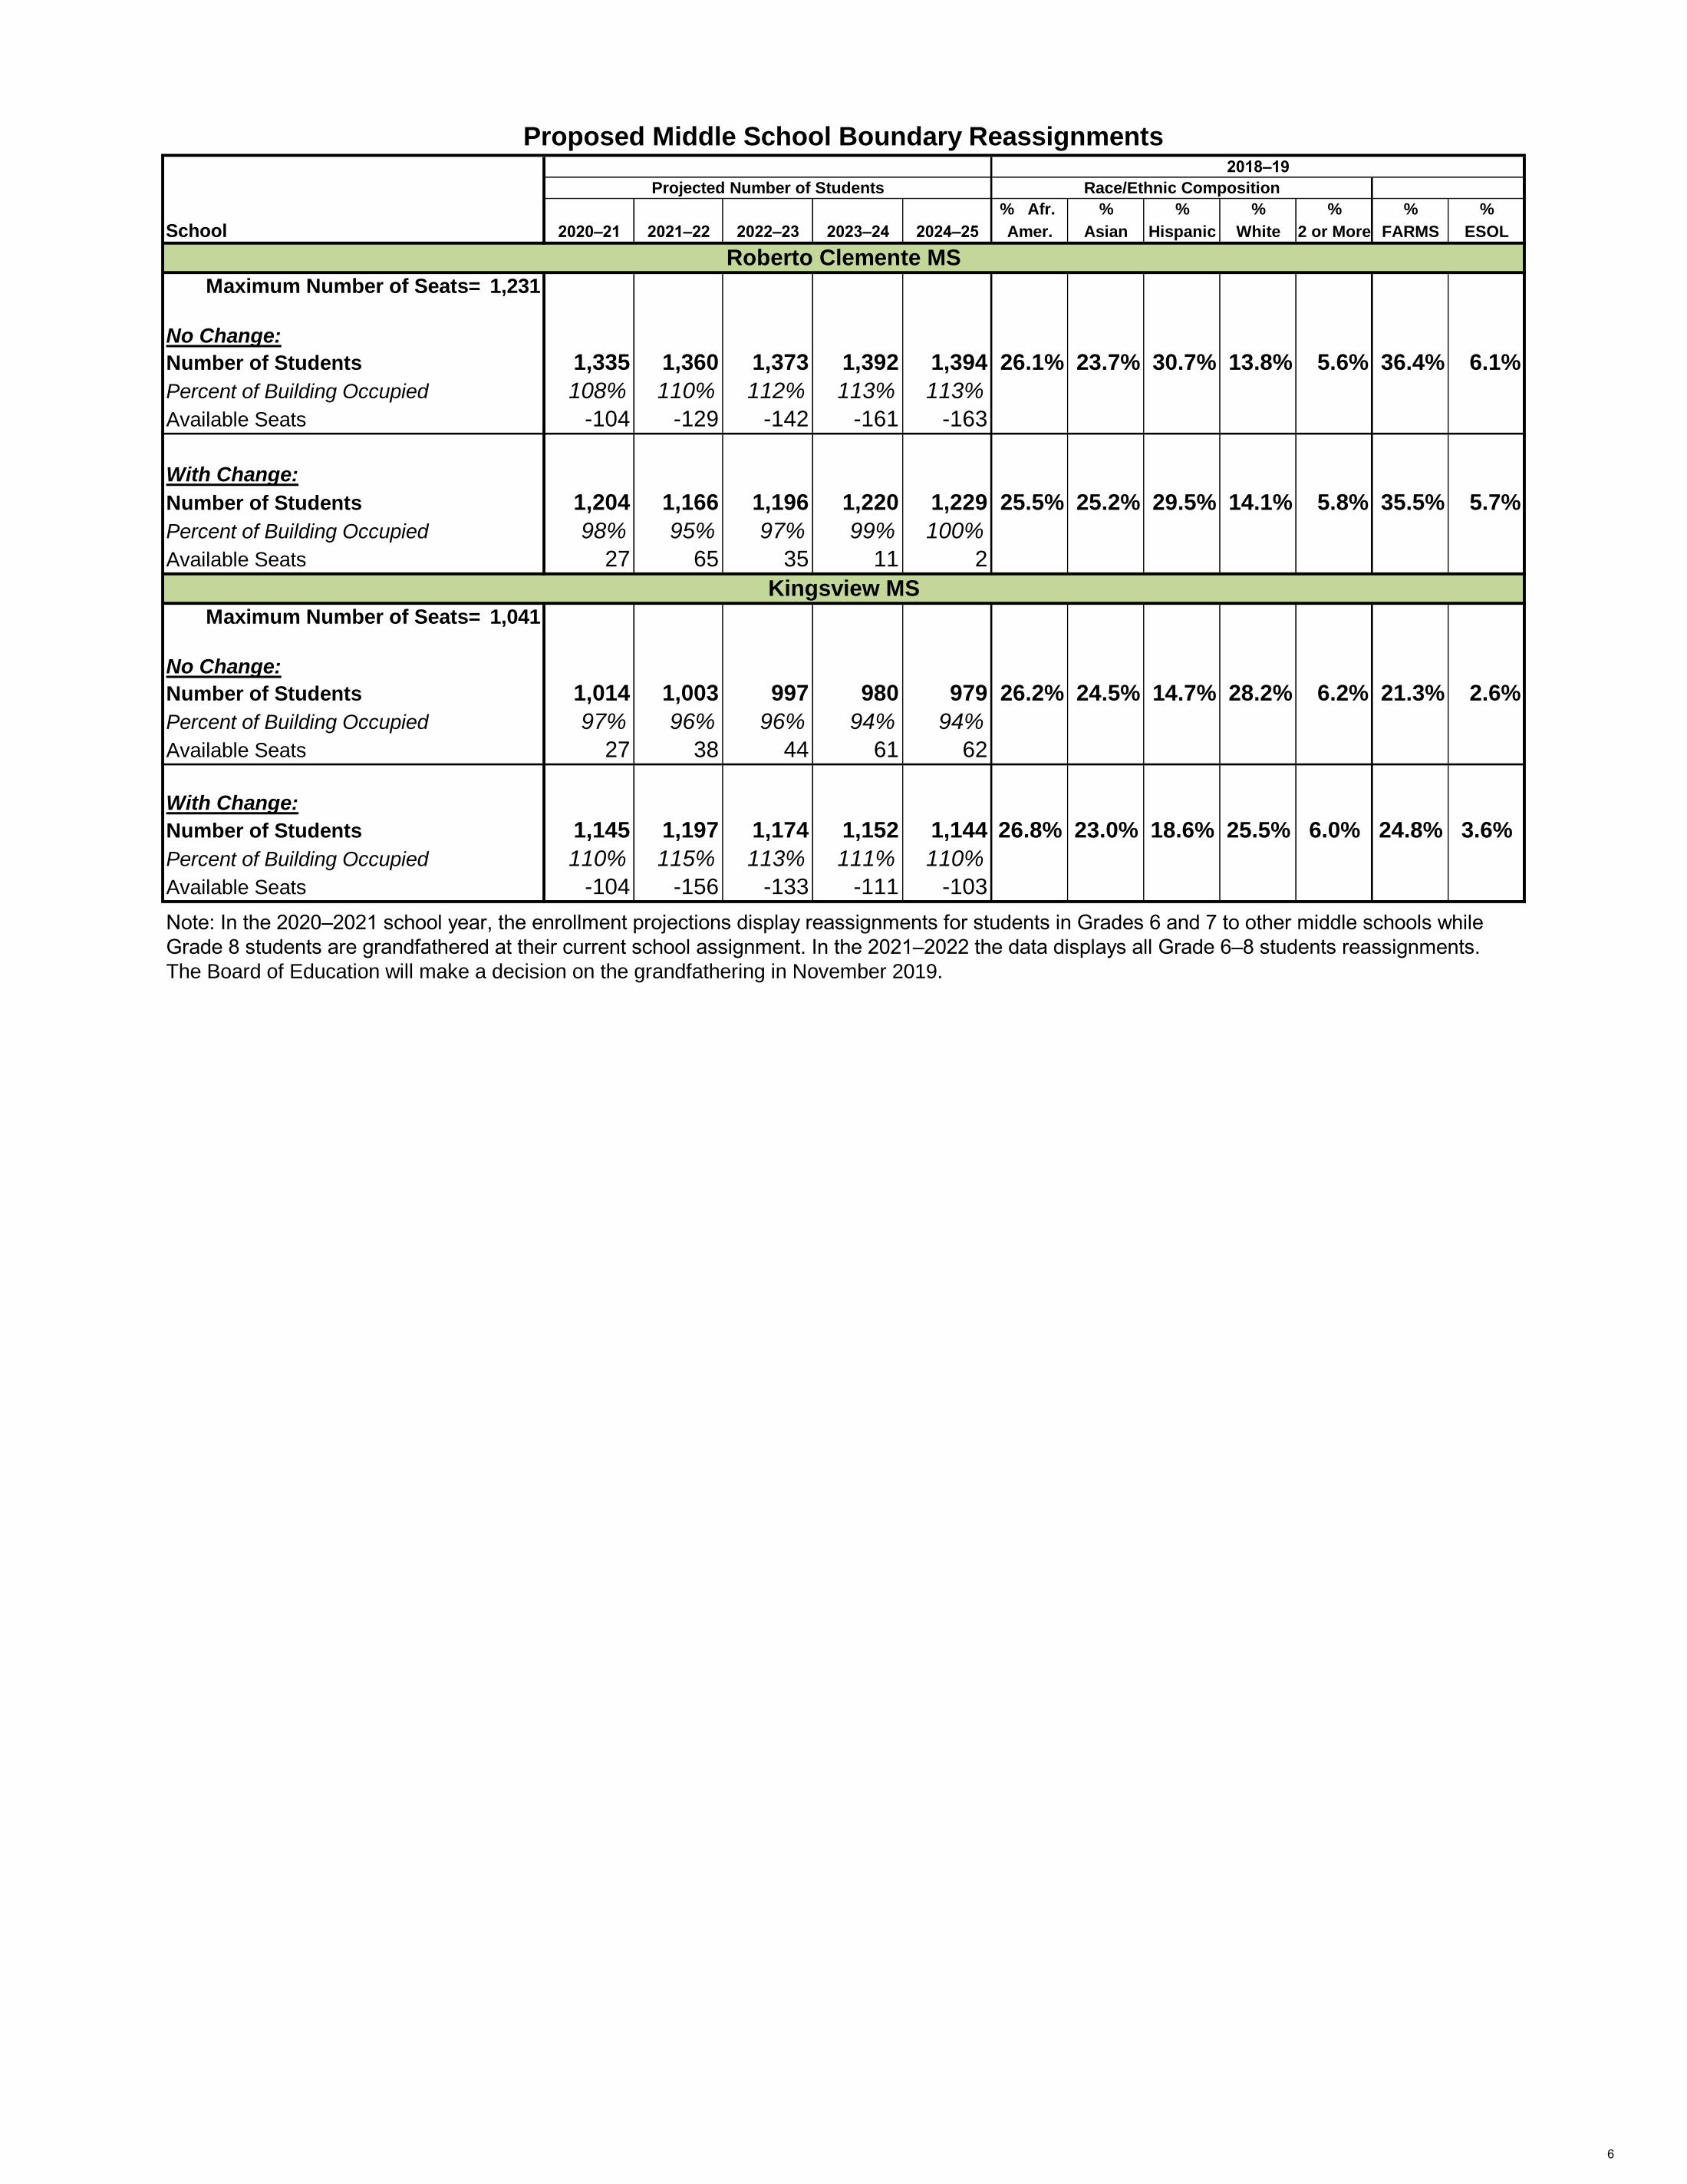
Maximum Number of Seats= 1,231
No Change:
Number of Students 1,335 1,360 1,373 1,392 1,394 26.1% 23.7% 30.7% 13.8% 5.6% 36.4% 6.1%
Percent of Building Occupied 108% 110% 112% 113% 113%
Available Seats -104 -129 -142 -161 -163
With Change:
Number of Students 1,204 1,166 1,196 1,220 1,229 25.5% 25.2% 29.5% 14.1% 5.8% 35.5% 5.7%
Percent of Building Occupied 98% 95% 97% 99% 100%
Available Seats 27 65 35 11 2
Maximum Number of Seats= 1,041
No Change:
Number of Students 1,014 1,003 997 980 979 26.2% 24.5% 14.7% 28.2% 6.2% 21.3% 2.6%
Percent of Building Occupied 97% 96% 96% 94% 94%
Available Seats 27 38 44 61 62
With Change:
Number of Students 1,145 1,197 1,174 1,152 1,144 26.8% 23.0% 18.6% 25.5% 6.0% 24.8% 3.6%
Percent of Building Occupied 110% 115% 113% 111% 110%
Available Seats -104 -156 -133 -111 -103
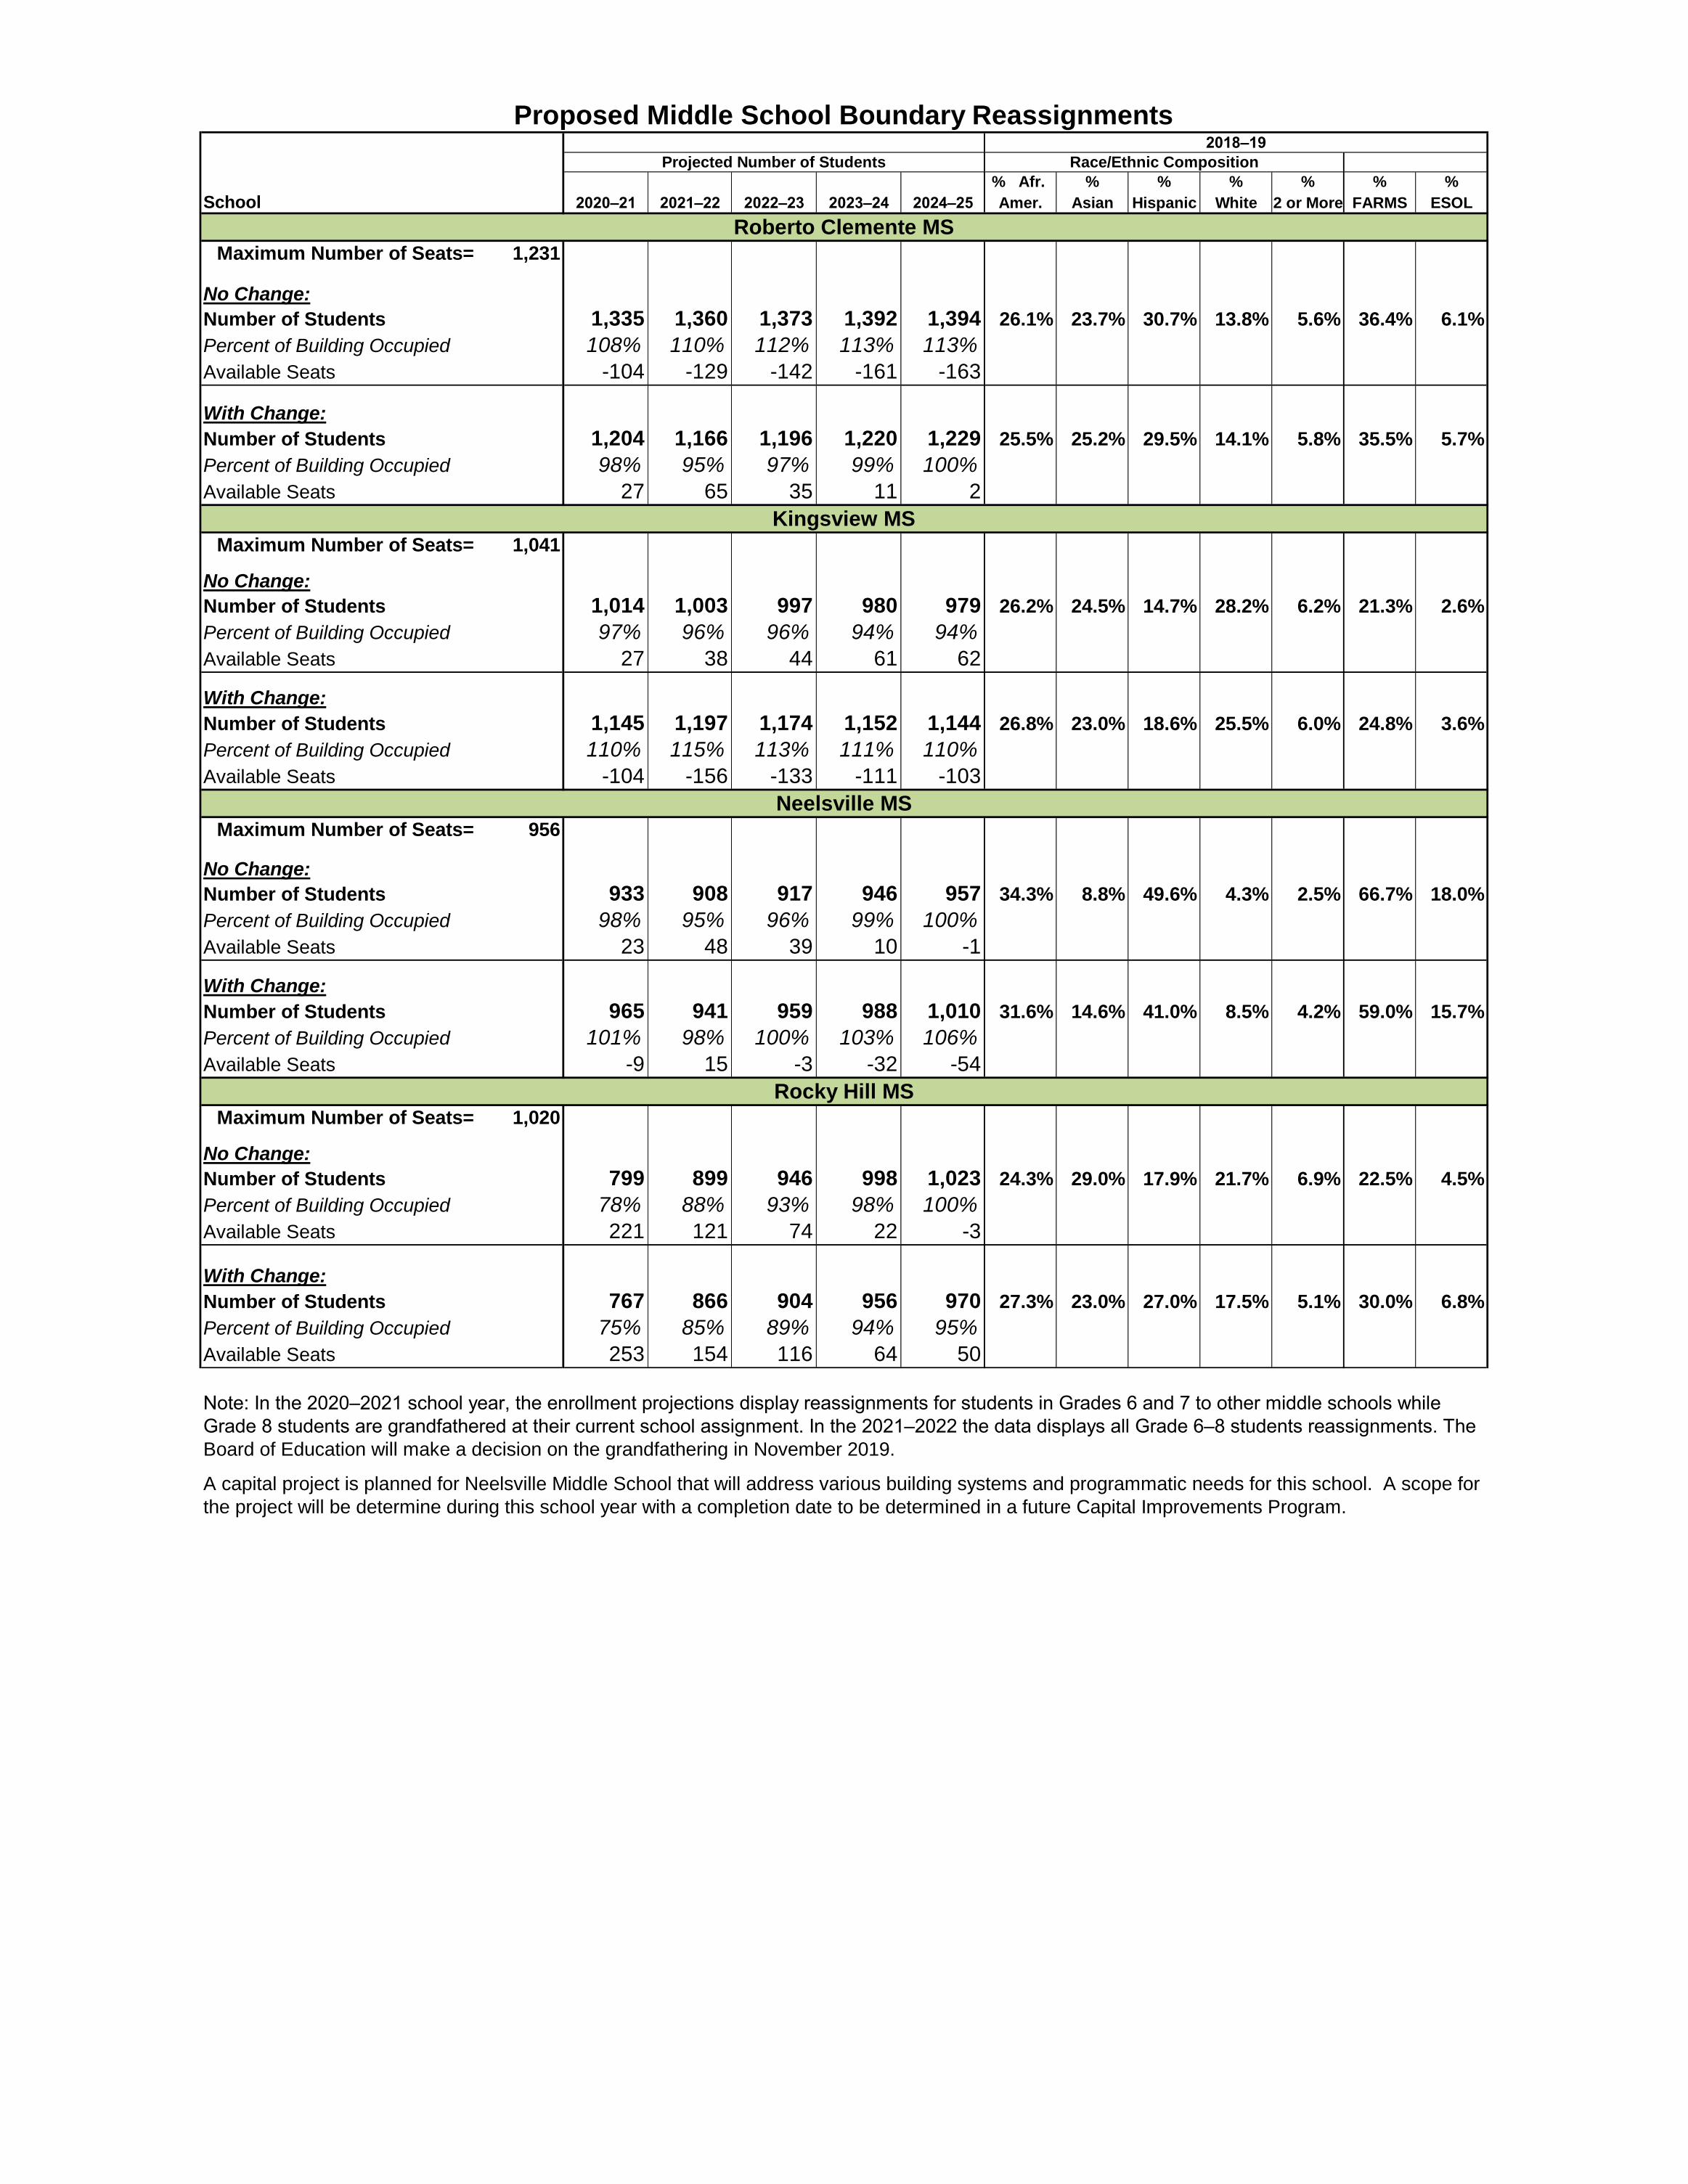
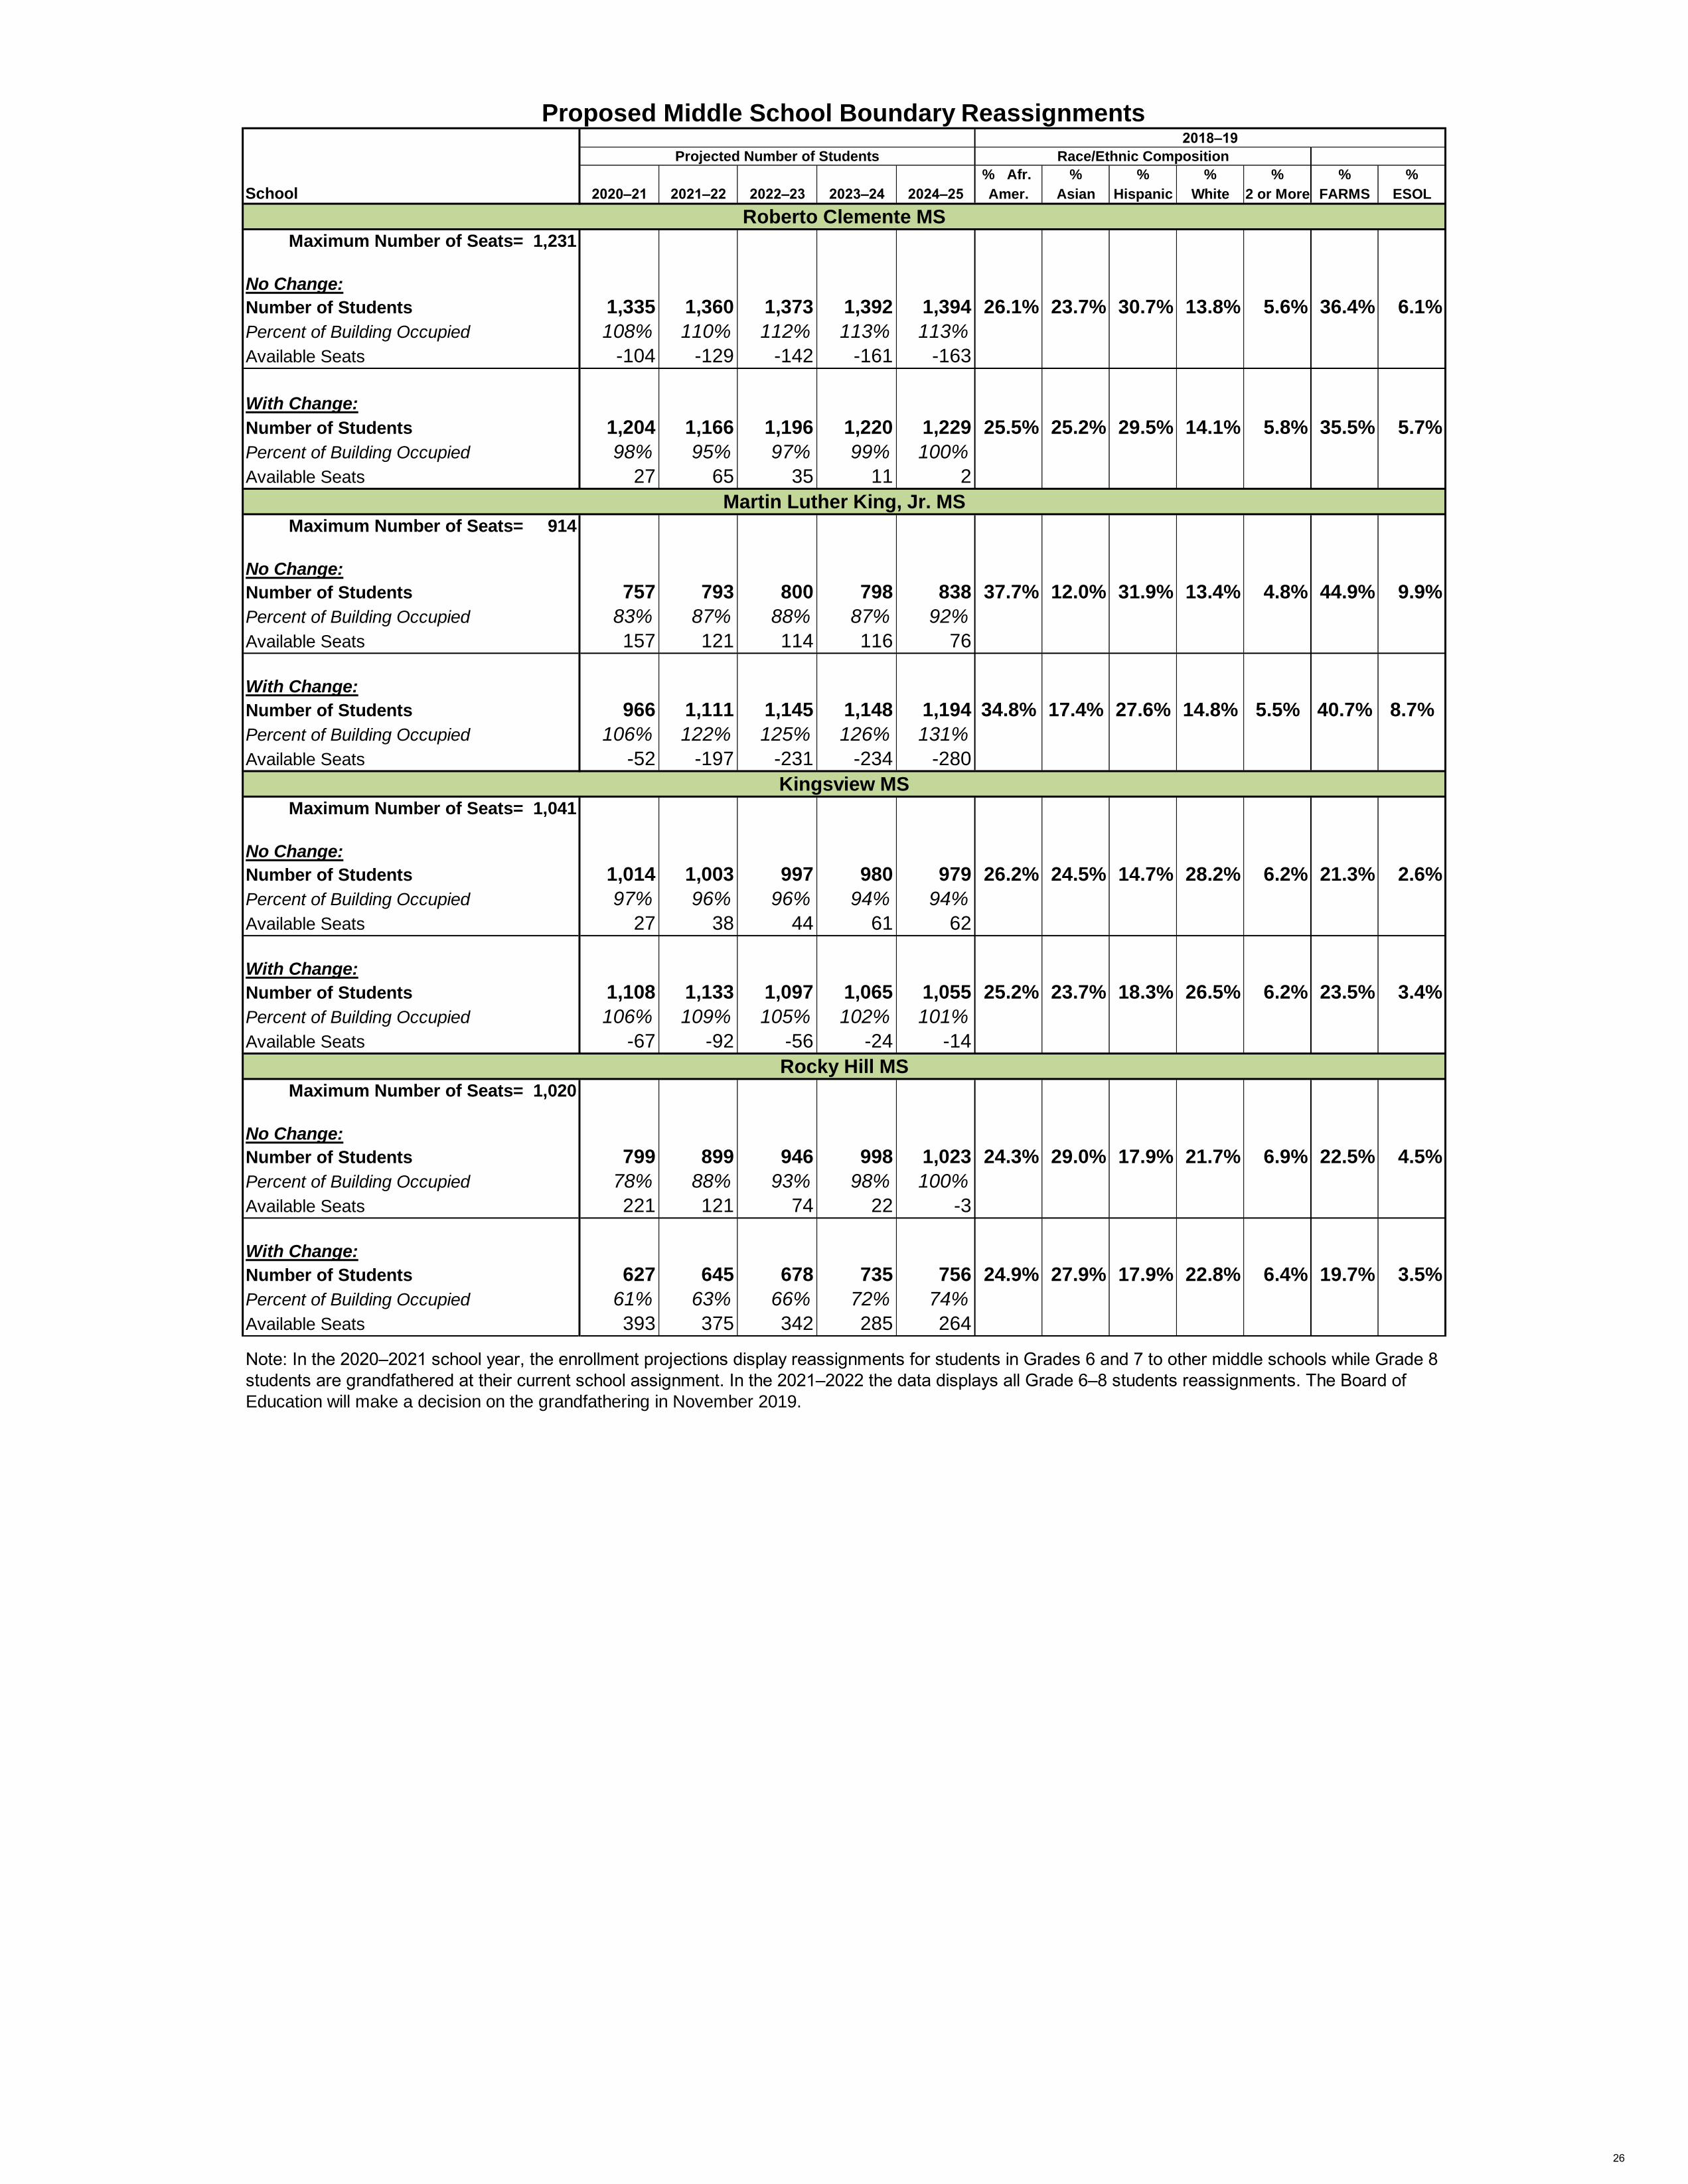
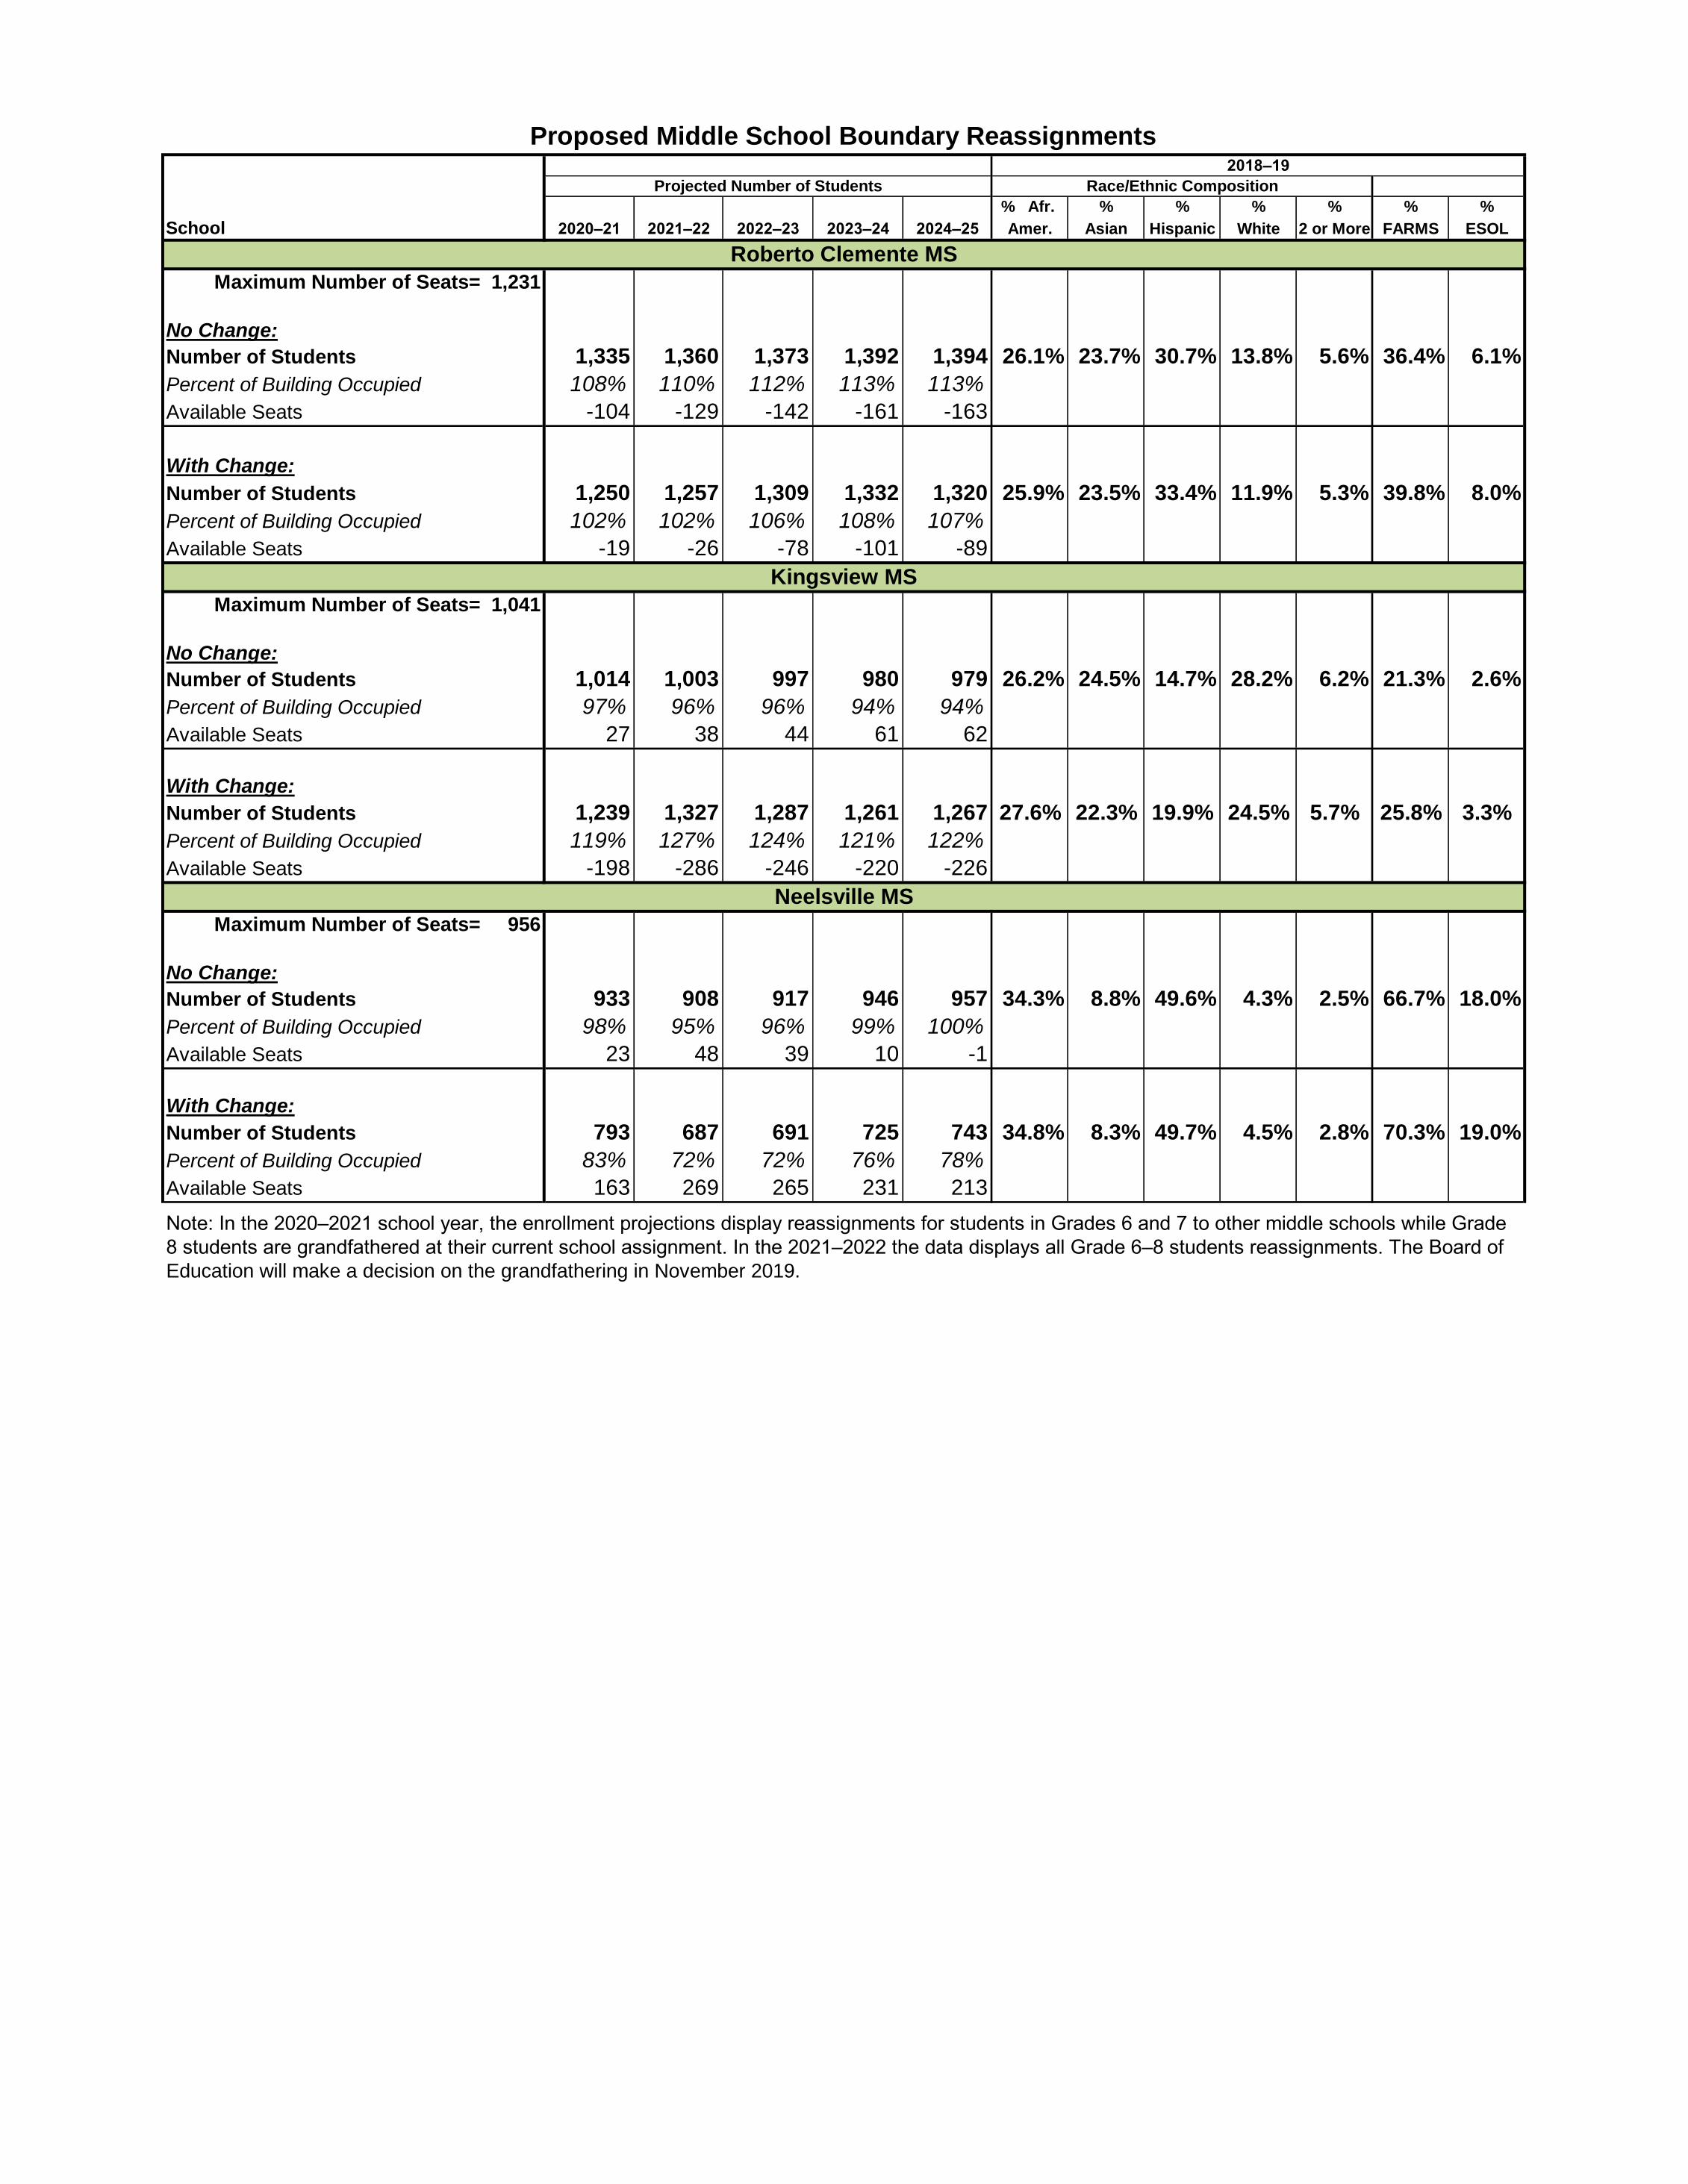
Note: In the 2020–2021 school year, the enrollment projections display reassignments for students in Grades 6 and 7 to other middle schools while
Grade 8 students are grandfathered at their current school assignment. In the 2021–2022 the data displays all Grade 6–8 students reassignments.
The Board of Education will make a decision on the grandfathering in November 2019.
Roberto Clemente MS
2018–19
Projected Number of Students Race/Ethnic Composition
Proposed Middle School Boundary Reassignments
Kingsview MS
6
7
Proposed High School Reassignments
Reassign Capt. James E. Daly ES and William B. Gibbs ES from Clarksburg HS to Seneca Valley HS
Proposed Middle School Reassignments
Reassign Fox Chapel ES from Neelsville MS to Rocky Hill MS
Reassign William B. Gibbs ES from Rocky Hill MS to Neelsville MS
Reassign portion of Great Seneca Creek ES from Roberto Clemente MS to Kingsview MS
Proposed Articulation Change
Neelsville MS will articulate to Seneca Valley HS
Provides straight articulation for Great Seneca Creek ES to Kingsview MS
% Afr. % % % % % %
School 2020–21 2021–22 2022–23 2023–24 2024–25 Amer. Asian Hispanic White 2 or More FARMS ESOL
Maximum Number of Seats= 2,034
No Change:
Number of Students 2,374 2,487 2,668 2,757 2,848 28.7% 20.4% 26.8% 19.6% 4.3% 27.5% 8.2%
Percent of Building Occupied 117% 122% 131% 136% 140%
Available Seats -340 -453 -634 -723 -814
With Change:
Number of Students 2,020 1,956 1,985 2,056 2,166 27.8% 22.2% 24.4% 21.2% 4.5% 23.8% 7.4%
Percent of Building Occupied 99% 96% 98% 101% 106%
Available Seats 14 78 49 -22 -132
Maximum Number of Seats= 2,286
No Change:
Number of Students 2,727 2,776 2,873 2,974 2,981 25.7% 21.1% 21.7% 26.9% 4.4% 22.5% 3.2%
Percent of Building Occupied 119% 121% 126% 130% 130%
Available Seats -441 -490 -587 -688 -695
Maximum Number of Seats= 2,581
No Change:
Number of Students 1,203 1,214 1,256 1,281 1,301 34.6% 10.9% 35.8% 14.5% 4.1% 39.0% 14.1%
Percent of Building Occupied 47% 47% 49% 50% 50%
Available Seats 1,378 1,367 1,325 1,300 1,280
With Change:
Number of Students 1,557 1,745 1,939 1,982 1,983 33.3% 13.0% 34.3% 15.3% 4.1% 37.5% 12.5%
Students Reserved for CTE Programs 500 500 500 500 500
Percent of Building Occupied 80% 87% 94% 96% 96%
Available Seats 524 336 142 99 98
Seneca Valley HS
Option #2Clarksburg, Northwest, and Seneca Valley Clusters Boundary Study
March 2019
Proposed High School Boundary Reassignments2018–19
Notes: In the 2020–2021 school year, the enrollment projections display only reassignments for students in Grades 9 and 10 to other high schools.
Grade 11 and 12 students would be grandfathered at their current school assignment. For the 2021–2022 school year, the data displays Grades 9–11
reassignments with Grade 12 students grandfathered at their current school assignment. The Board of Education will make a decision on the
grandfathering in November 2019.
The superintendent will make a recommendation regarding special programs for current high school students as part of his recommendation in October
2019.
No option will provide full capacity relief for Clarksburg or Northwest high schools. It is anticipated that, capacity relief for Northwest High School will be
provided in the future with the opening of Crown High School. A long-term plan for Clarksburg High School will be developed in a future CIP.
Projected Number of Students Race/Ethnic Composition
Clarksburg HS
Northwest HS
% Afr. % % % % % %
School 2020–21 2021–22 2022–23 2023–24 2024–25 Amer. Asian Hispanic White 2 or More FARMS ESOL
Maximum Number of Seats= 1,231
No Change:
Number of Students 1,335 1,360 1,373 1,392 1,394 26.1% 23.7% 30.7% 13.8% 5.6% 36.4% 6.1%
Percent of Building Occupied 108% 110% 112% 113% 113%
Available Seats -104 -129 -142 -161 -163
With Change:
Number of Students 1,204 1,166 1,196 1,220 1,229 25.5% 25.2% 29.5% 14.1% 5.8% 35.5% 5.7%
Percent of Building Occupied 98% 95% 97% 99% 100%
Available Seats 27 65 35 11 2
Maximum Number of Seats= 1,041
No Change:
Number of Students 1,014 1,003 997 980 979 26.2% 24.5% 14.7% 28.2% 6.2% 21.3% 2.6%
Percent of Building Occupied 97% 96% 96% 94% 94%
Available Seats 27 38 44 61 62
With Change:
Number of Students 1,145 1,197 1,174 1,152 1,144 26.8% 23.0% 18.6% 25.5% 6.0% 24.8% 3.6%
Percent of Building Occupied 110% 115% 113% 111% 110%
Available Seats -104 -156 -133 -111 -103
Maximum Number of Seats= 956
No Change:
Number of Students 933 908 917 946 957 34.3% 8.8% 49.6% 4.3% 2.5% 66.7% 18.0%
Percent of Building Occupied 98% 95% 96% 99% 100%
Available Seats 23 48 39 10 -1
With Change:
Number of Students 965 941 959 988 1,010 31.6% 14.6% 41.0% 8.5% 4.2% 59.0% 15.7%
Percent of Building Occupied 101% 98% 100% 103% 106%
Available Seats -9 15 -3 -32 -54
Maximum Number of Seats= 1,020
No Change:
Number of Students 799 899 946 998 1,023 24.3% 29.0% 17.9% 21.7% 6.9% 22.5% 4.5%
Percent of Building Occupied 78% 88% 93% 98% 100%
Available Seats 221 121 74 22 -3
With Change:
Number of Students 767 866 904 956 970 27.3% 23.0% 27.0% 17.5% 5.1% 30.0% 6.8%
Percent of Building Occupied 75% 85% 89% 94% 95%
Available Seats 253 154 116 64 50
A capital project is planned for Neelsville Middle School that will address various building systems and programmatic needs for this school. A scope for
the project will be determine during this school year with a completion date to be determined in a future Capital Improvements Program.
Proposed Middle School Boundary Reassignments
Kingsview MS
Roberto Clemente MS
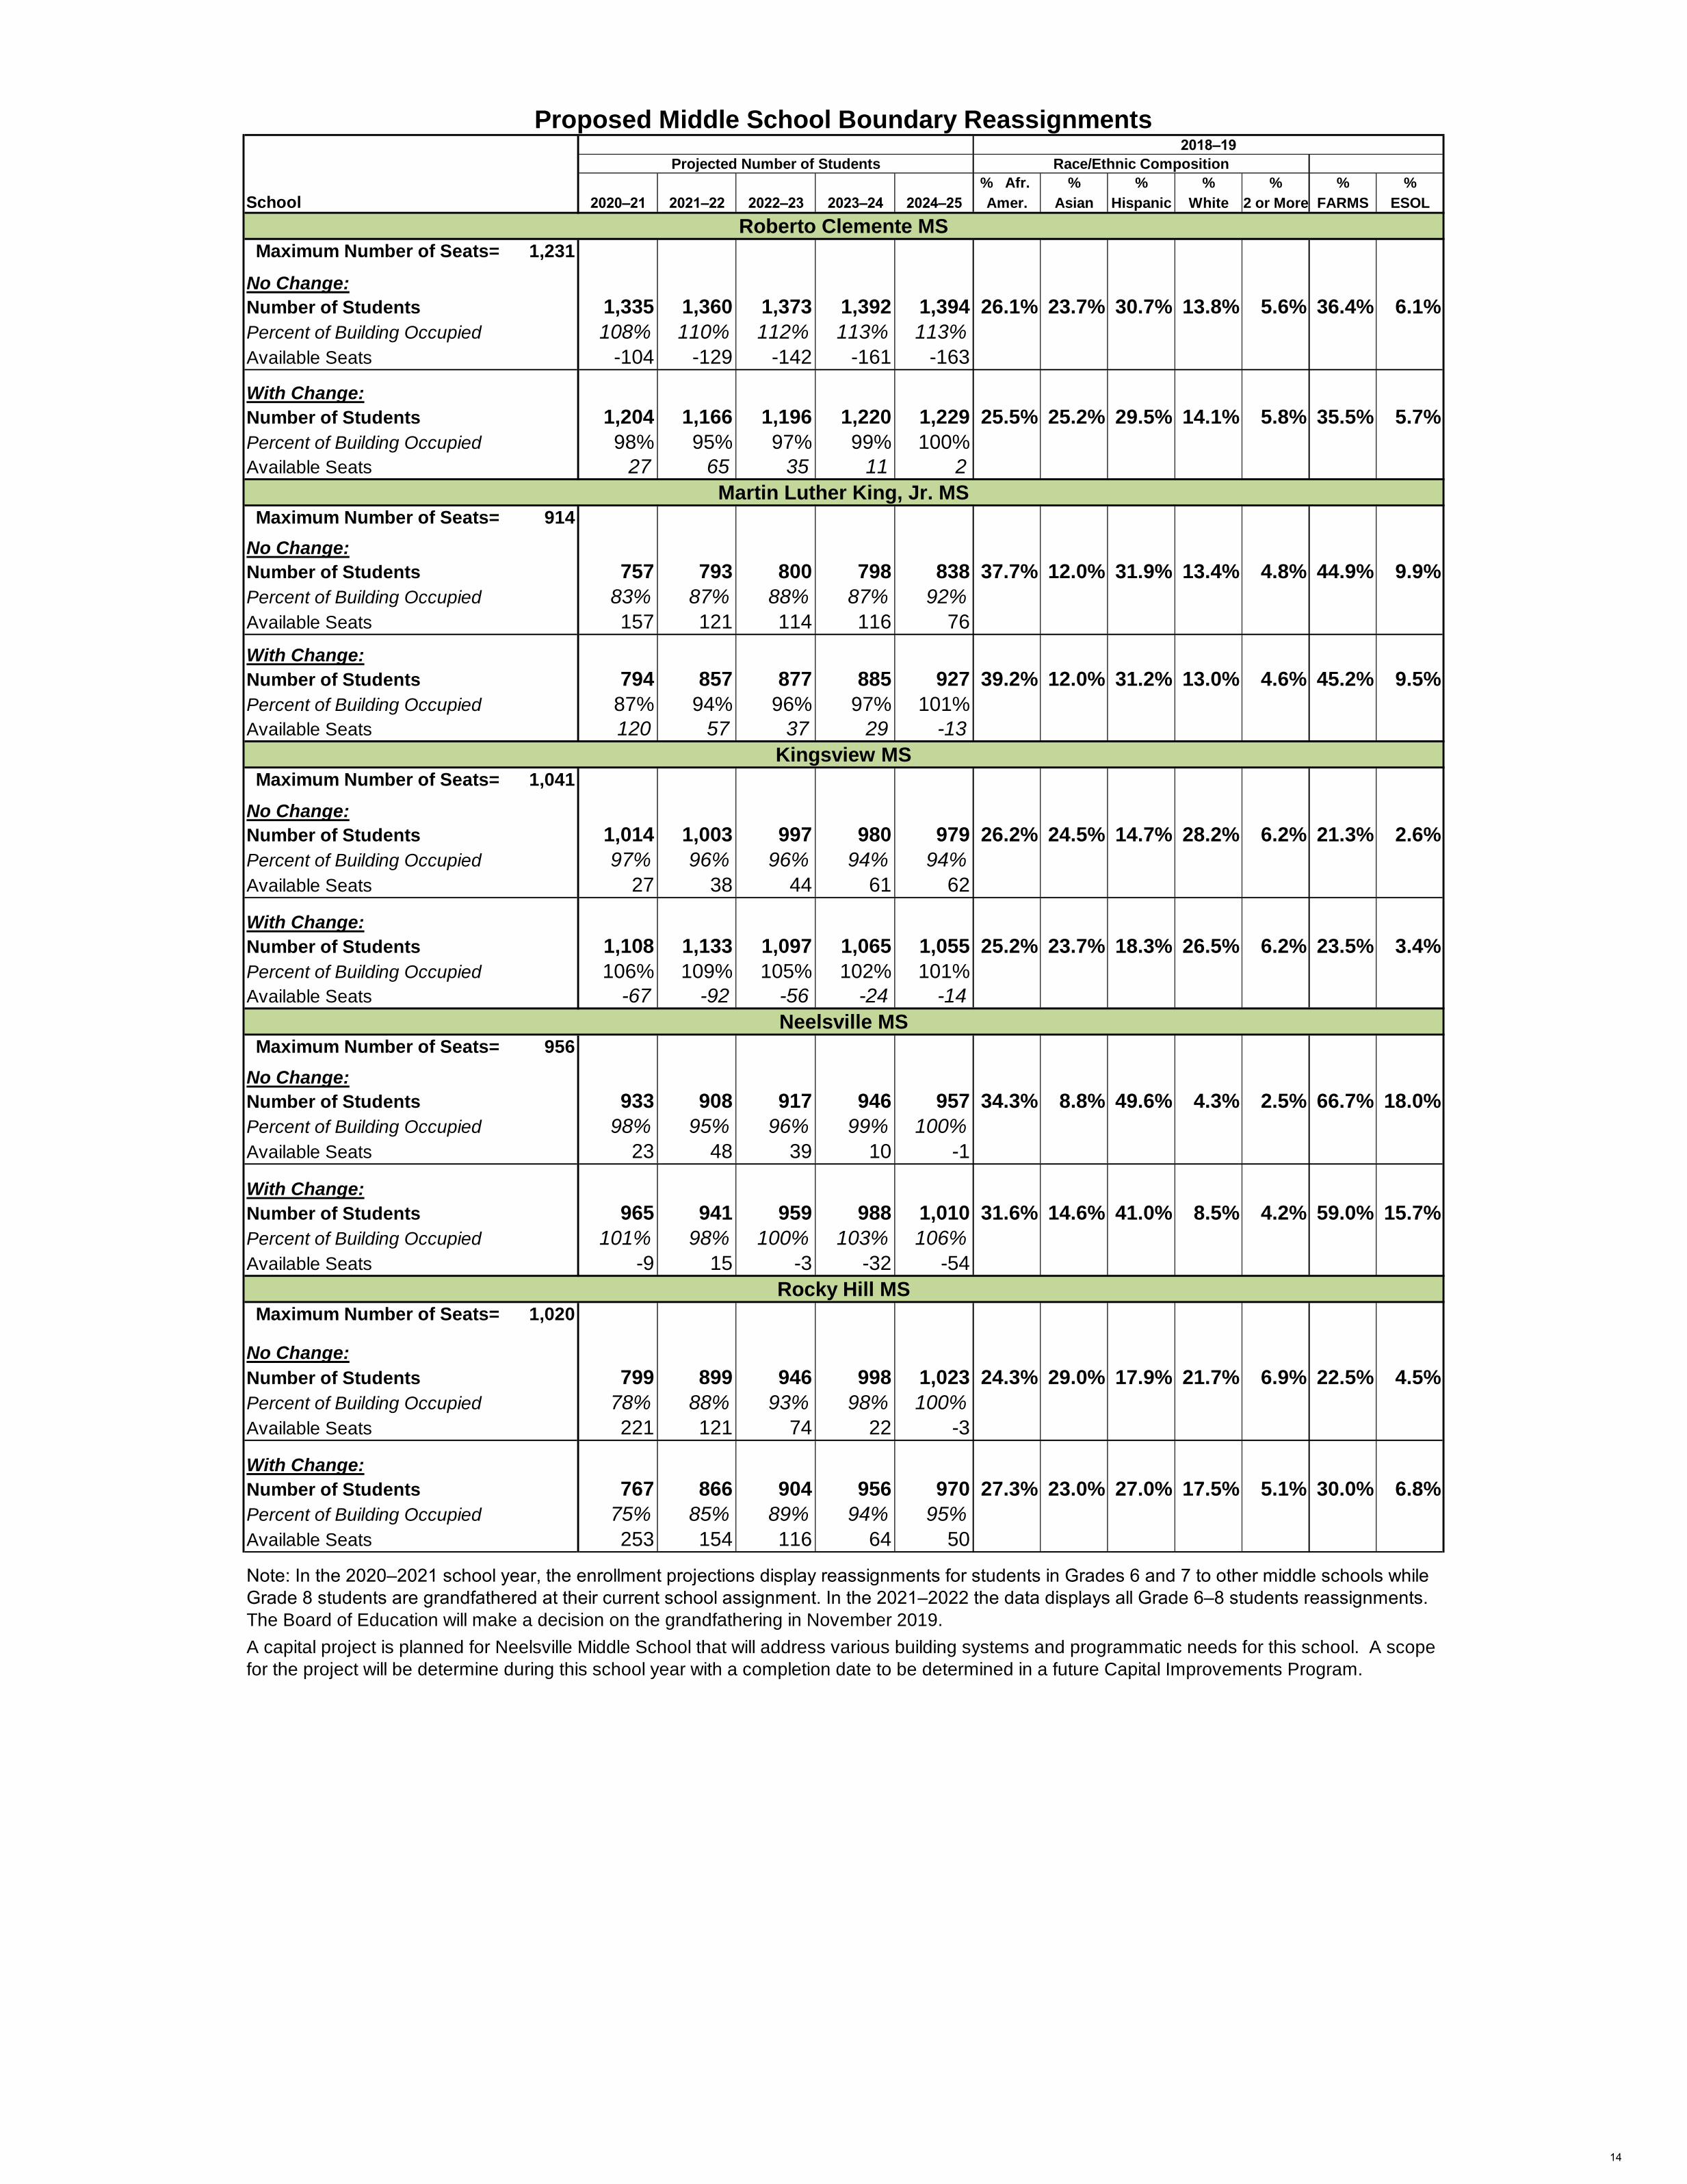
Note: In the 2020–2021 school year, the enrollment projections display reassignments for students in Grades 6 and 7 to other middle schools while
Grade 8 students are grandfathered at their current school assignment. In the 2021–2022 the data displays all Grade 6–8 students reassignments. The
Board of Education will make a decision on the grandfathering in November 2019.
2018–19
Projected Number of Students Race/Ethnic Composition
Neelsville MS
Rocky Hill MS
11

12

Proposed High School Reassignments
Reassign James. E. Daly ES and William B. Gibbs ES from Clarksburg HS to Seneca Valley HS
Reassign Clopper Mill Island from Northwest HS to Seneca Valley HS
Reassign Spark M. Matsunaga ES Island from Northwest HS to Seneca Valley HS
Proposed Middle School Reassignments
Reassign Fox Chapel ES from Neelsville MS to Rocky Hill MS
Reassign William B. Gibbs ES from Rocky Hill MS to Neelsville MS
Reassign Spark M. Matsunaga ES Island from Kingsview MS to Martin Luther King Jr. MS
Reassign portion of Great Seneca Creek ES from Clemente MS to Kingsview MS
Proposed Articulation Change
Neelsville MS will articulate to Seneca Valley HS
Provides straight articulation for Great Seneca Creek ES to Kingsview MS
% Afr. % % % % % %
School 2020–21 2021–22 2022–23 2023–24 2024–25 Amer. Asian Hispanic White 2 or More FARMS ESOL
Maximum Number of Seats= 2,034
No Change:
Number of Students 2,374 2,487 2,668 2,757 2,848 28.7% 20.4% 26.8% 19.6% 4.3% 27.5% 8.2%
Percent of Building Occupied 117% 122% 131% 136% 140%
Available Seats -340 -453 -634 -723 -814
With Change:
Number of Students 2,020 1,956 1,985 2,056 2,166 27.8% 22.2% 24.4% 21.2% 4.5% 23.8% 7.4%
Percent of Building Occupied 99% 96% 98% 101% 106%
Available Seats 14 78 49 -22 -132
Maximum Number of Seats= 2,286
No Change:
Number of Students 2,727 2,776 2,873 2,974 2,981 25.7% 21.1% 21.7% 26.9% 4.4% 22.5% 3.2%
Percent of Building Occupied 119% 121% 126% 130% 130%
Available Seats -441 -490 -587 -688 -695
With Change:
Number of Students 2,665 2,671 2,744 2,847 2,854 24.6% 21.4% 21.7% 27.8% 4.6% 21.6% 3.2%
Percent of Building Occupied 117% 117% 120% 125% 125%
Available Seats -379 -385 -458 -561 -568
Maximum Number of Seats= 2,581
No Change:
Number of Students 1,203 1,214 1,256 1,281 1,301 34.6% 10.9% 35.8% 14.5% 4.1% 39.0% 14.1%
Percent of Building Occupied 47% 47% 49% 50% 50%
Available Seats 1,378 1,367 1,325 1,300 1,280
With Change:
Number of Students 1,619 1,850 2,068 2,109 2,110 34.2% 13.2% 33.7% 15.0% 3.9% 37.8% 12.0%
Students Reserved for CTE Programs 500 500 500 500 500
Percent of Building Occupied 82% 91% 99% 101% 101%
Available Seats 462 231 13 -28 -29
Projected Number of Students Race/Ethnic Composition
Clarksburg HS
Northwest HS
Seneca Valley HS
Option #3Clarksburg, Northwest, and Seneca Valley Clusters Boundary Study
March 2019
Proposed High School Boundary Reassignments2018–19
Notes: In the 2020–2021 school year, the enrollment projections display only reassignments for students in Grades 9 and 10 to other high schools.
Grade 11 and 12 students would be grandfathered at their current school assignment. For the 2021–2022 school year, the data displays Grades
9–11 reassignments with Grade 12 students grandfathered at their current school assignment. The Board of Education will make a decision on the
grandfathering in November 2019.
The superintendent will make a recommendation regarding special programs for current high school students as part of his recommendation in
October 2019.
No option will provide full capacity relief for Clarksburg or Northwest high schools. It is anticipated that, capacity relief for Northwest High School will
be provided in the future with the opening of Crown High School. A long-term plan for Clarksburg High School will be developed in a future CIP.
13
% Afr. % % % % % %
School 2020–21 2021–22 2022–23 2023–24 2024–25 Amer. Asian Hispanic White 2 or More FARMS ESOL
Maximum Number of Seats= 1,231
No Change:
Number of Students 1,335 1,360 1,373 1,392 1,394 26.1% 23.7% 30.7% 13.8% 5.6% 36.4% 6.1%
Percent of Building Occupied 108% 110% 112% 113% 113%
Available Seats -104 -129 -142 -161 -163
With Change:
Number of Students 1,204 1,166 1,196 1,220 1,229 25.5% 25.2% 29.5% 14.1% 5.8% 35.5% 5.7%
Percent of Building Occupied 98% 95% 97% 99% 100%
Available Seats 27 65 35 11 2
Maximum Number of Seats= 914
No Change:
Number of Students 757 793 800 798 838 37.7% 12.0% 31.9% 13.4% 4.8% 44.9% 9.9%
Percent of Building Occupied 83% 87% 88% 87% 92%
Available Seats 157 121 114 116 76
With Change:
Number of Students 794 857 877 885 927 39.2% 12.0% 31.2% 13.0% 4.6% 45.2% 9.5%
Percent of Building Occupied 87% 94% 96% 97% 101%
Available Seats 120 57 37 29 -13
Maximum Number of Seats= 1,041
No Change:
Number of Students 1,014 1,003 997 980 979 26.2% 24.5% 14.7% 28.2% 6.2% 21.3% 2.6%
Percent of Building Occupied 97% 96% 96% 94% 94%
Available Seats 27 38 44 61 62
With Change:
Number of Students 1,108 1,133 1,097 1,065 1,055 25.2% 23.7% 18.3% 26.5% 6.2% 23.5% 3.4%
Percent of Building Occupied 106% 109% 105% 102% 101%
Available Seats -67 -92 -56 -24 -14
Maximum Number of Seats= 956
No Change:
Number of Students 933 908 917 946 957 34.3% 8.8% 49.6% 4.3% 2.5% 66.7% 18.0%
Percent of Building Occupied 98% 95% 96% 99% 100%
Available Seats 23 48 39 10 -1
With Change:
Number of Students 965 941 959 988 1,010 31.6% 14.6% 41.0% 8.5% 4.2% 59.0% 15.7%
Percent of Building Occupied 101% 98% 100% 103% 106%
Available Seats -9 15 -3 -32 -54
Maximum Number of Seats= 1,020
No Change:
Number of Students 799 899 946 998 1,023 24.3% 29.0% 17.9% 21.7% 6.9% 22.5% 4.5%
Percent of Building Occupied 78% 88% 93% 98% 100%
Available Seats 221 121 74 22 -3
With Change:
Number of Students 767 866 904 956 970 27.3% 23.0% 27.0% 17.5% 5.1% 30.0% 6.8%
Percent of Building Occupied 75% 85% 89% 94% 95%
Available Seats 253 154 116 64 50
A capital project is planned for Neelsville Middle School that will address various building systems and programmatic needs for this school. A scope
for the project will be determine during this school year with a completion date to be determined in a future Capital Improvements Program.
2018–19
Projected Number of Students Race/Ethnic Composition
Note: In the 2020–2021 school year, the enrollment projections display reassignments for students in Grades 6 and 7 to other middle schools while
Grade 8 students are grandfathered at their current school assignment. In the 2021–2022 the data displays all Grade 6–8 students reassignments.
The Board of Education will make a decision on the grandfathering in November 2019.
Rocky Hill MS
Proposed Middle School Boundary Reassignments
Roberto Clemente MS
Kingsview MS
Neelsville MS
Martin Luther King, Jr. MS
14
15

16
Proposed High School Reassignments
Reassign Darnestown ES from Northwest HS to Seneca Valley HS
Reassign Little Bennett ES from Clarksburg HS to Seneca Valley HS
Proposed Middle School Reassignments
Reassign Darnestown ES from Lakelands Park MS to Martin Luther King, Jr. MS
Reassign portion of Great Seneca Creek ES from Roberto Clemente MS to Kingsview MS
Proposed Articulation Change
Creates split articulation for Rocky Hill MS to Clarksburg HS and Seneca Valley HS.
Provides straight articulation for Great Seneca Creek ES to Kingsview MS.
% Afr. % % % % % %
School 2020–21 2021–22 2022–23 2023–24 2024–25 Amer. Asian Hispanic White 2 or More FARMS ESOL
Maximum Number of Seats= 2,034
No Change:
Number of Students 2,374 2,487 2,668 2,757 2,848 28.7% 20.4% 26.8% 19.6% 4.3% 27.5% 8.2%
Percent of Building Occupied 117% 122% 131% 136% 140%
Available Seats -340 -453 -634 -723 -814
With Change:
Number of Students 2,173 2,178 2,274 2,386 2,479 29.7% 20.3% 28.0% 17.8% 4.1% 29.9% 9.2%
Percent of Building Occupied 107% 107% 112% 117% 122%
Available Seats -139 -144 -240 -352 -445
Maximum Number of Seats= 2,286
No Change:
Number of Students 2,727 2,776 2,873 2,974 2,981 25.7% 21.1% 21.7% 26.9% 4.4% 22.5% 3.2%
Percent of Building Occupied 119% 121% 126% 130% 130%
Available Seats -441 -490 -587 -688 -695
With Change:
Number of Students 2,637 2,639 2,701 2,793 2,801 27.5% 21.5% 23.0% 23.5% 4.4% 24.1% 3.5%
Percent of Building Occupied 115% 115% 118% 122% 123%
Available Seats -351 -353 -415 -507 -515
Maximum Number of Seats= 2,581
No Change:
Number of Students 1,203 1,214 1,256 1,281 1,301 34.6% 10.9% 35.8% 14.5% 4.1% 39.0% 14.1%
Percent of Building Occupied 47% 47% 49% 50% 50%
Available Seats 1,378 1,367 1,325 1,300 1,280
With Change:
Number of Students 1,494 1,660 1,822 1,833 1,850 29.1% 13.2% 29.4% 23.9% 4.4% 30.0% 10.4%
Students Reserved for CTE Programs 500 500 500 500 500
Percent of Building Occupied 77% 84% 90% 90% 91%
Available Seats 587 421 259 248 231
Seneca Valley HS
Notes: In the 2020–2021 school year, the enrollment projections display only reassignments for students in Grades 9 and 10 to other high schools.
Grade 11 and 12 students would be grandfathered at their current school assignment. For the 2021–2022 school year, the data displays Grades
9–11 reassignments with Grade 12 students grandfathered at their current school assignment. The Board of Education will make a decision on the
grandfathering in November 2019.
The superintendent will make a recommendation regarding special programs for current high school students as part of his recommendation in
October 2019.
No option will provide full capacity relief for Clarksburg or Northwest high schools. It is anticipated that, capacity relief for Northwest High School will
be provided in the future with the opening of Crown High School. A long-term plan for Clarksburg High School will be developed in a future CIP.
Option #4Clarksburg, Northwest, and Seneca Valley Clusters Boundary Study
March 2019
Proposed High School Boundary Reassignments2018–19
Projected Number of Students Race/Ethnic Composition
Clarksburg HS
Northwest HS
17
% Afr. % % % % % %
School 2020–21 2021–22 2022–23 2023–24 2024–25 Amer. Asian Hispanic White 2 or More FARMS ESOL
Maximum Number of Seats= 1,231
No Change:
Number of Students 1,335 1,360 1,373 1,392 1,394 26.1% 23.7% 30.7% 13.8% 5.6% 36.4% 6.1%
Percent of Building Occupied 108% 110% 112% 113% 113%
Available Seats -104 -129 -142 -161 -163
With Change:
Number of Students 1,204 1,166 1,196 1,220 1,229 25.5% 25.2% 29.5% 14.1% 5.8% 35.5% 5.7%
Percent of Building Occupied 98% 95% 97% 99% 100%
Available Seats 27 65 35 11 2
Maximum Number of Seats= 914
No Change:
Number of Students 757 793 800 798 838 37.7% 12.0% 31.9% 13.4% 4.8% 44.9% 9.9%
Percent of Building Occupied 83% 87% 88% 87% 92%
Available Seats 157 121 114 116 76
With Change:
Number of Students 844 926 944 932 959 32.1% 11.6% 27.7% 23.5% 5.1% 38.1% 8.4%
Percent of Building Occupied 92% 101% 103% 102% 105%
Available Seats 70 -12 -30 -18 -45
Maximum Number of Seats= 1,041
No Change:
Number of Students 1,014 1,003 997 980 979 26.2% 24.5% 14.7% 28.2% 6.2% 21.3% 2.6%
Percent of Building Occupied 97% 96% 96% 94% 94%
Available Seats 27 38 44 61 62
With Change:
Number of Students 1,145 1,197 1,174 1,152 1,144 26.8% 23.0% 18.6% 25.5% 6.0% 24.8% 3.6%
Percent of Building Occupied 110% 115% 113% 111% 110%
Available Seats -104 -156 -133 -111 -103
Maximum Number of Seats= 1,147
No Change:
Number of Students 1,146 1,151 1,171 1,191 1,195 16.5% 14.4% 23.4% 39.6% 6.2% 23.7% 7.4%
Percent of Building Occupied 100% 100% 102% 104% 104%
Available Seats 1 -4 -24 -44 -48
With Change:
Number of Students 1,059 1,018 1,027 1,057 1,074 17.9% 15.1% 25.6% 35.3% 6.1% 26.2% 8.3%
Percent of Building Occupied 92% 89% 90% 92% 94%
Available Seats 88 129 120 90 73
Proposed Middle School Boundary Reassignments
Martin Luther King, Jr. MS
Roberto Clemente MS
Projected Number of Students Race/Ethnic Composition
Kingsview MS
Lakelands Park MS
Note: In the 2020–2021 school year, the enrollment projections display reassignments for students in Grades 6 and 7 to other middle schools while
Grade 8 students are grandfathered at their current school assignment. In the 2021–2022 the data displays all Grade 6–8 students reassignments.
The Board of Education will make a decision on the grandfathering in November 2019.
2018–19
18
19
20
Proposed High School Reassignments
Reassign Germantown ES from Northwest HS to Seneca Valley HS
Reassign William B. Gibbs ES from Clarksburg HS to Seneca Valley HS
Reassign Clopper Mill ES Island from Northwest HS to Seneca Valley HS
Reassign Spark M. Matsunaga ES Island from Northwest HS to Seneca Valley HS
Proposed Middle School Reassignments
Reassign Portion of Great Seneca Creek ES from Clemente MS to Kingsview MS
Reassign Spark M. Matsunaga ES Island from Kingsview MS to Martin Luther King, Jr. MS
Proposed Articulation Change
Creates split articulation for Rocky Hill MS to Clarksburg HS and Seneca Valley HS.
Provides straight articulation for Great Seneca Creek ES to Kingsview MS.
% Afr. % % % % % %
School 2020–21 2021–22 2022–23 2023–24 2024–25 Amer. Asian Hispanic White 2 or More FARMS ESOL
Maximum Number of Seats= 2,034
No Change:
Number of Students 2,374 2,487 2,668 2,757 2,848 28.7% 20.4% 26.8% 19.6% 4.3% 27.5% 8.2%
Percent of Building Occupied 117% 122% 131% 136% 140%
Available Seats -340 -453 -634 -723 -814
With Change:
Number of Students 2,199 2,224 2,323 2,405 2,498 28.6% 19.7% 28.6% 18.6% 4.5% 28.2% 9.3%
Percent of Building Occupied 108% 109% 114% 118% 123%
Available Seats -165 -190 -289 -371 -464
Maximum Number of Seats= 2,286
No Change:
Number of Students 2,727 2,776 2,873 2,974 2,981 25.7% 21.1% 21.7% 26.9% 4.4% 22.5% 3.2%
Percent of Building Occupied 119% 121% 126% 130% 130%
Available Seats -441 -490 -587 -688 -695
With Change:
Number of Students 2,567 2,529 2,550 2,649 2,680 23.6% 21.7% 21.2% 28.9% 4.5% 21.1% 3.1%
Percent of Building Occupied 112% 111% 112% 116% 117%
Available Seats -281 -243 -264 -363 -394
Maximum Number of Seats= 2,581
No Change:
Number of Students 1,203 1,214 1,256 1,281 1,301 34.6% 10.9% 35.8% 14.5% 4.1% 39.0% 14.1%
Percent of Building Occupied 47% 47% 49% 50% 50%
Available Seats 1,378 1,367 1,325 1,300 1,280
With Change:
Number of Students 1,538 1,724 1,924 1,958 1,952 34.6% 14.5% 30.4% 16.5% 4.0% 34.7% 10.1%
Students Reserved for CTE Programs 500 500 500 500 500
Percent of Building Occupied 79% 86% 94% 95% 95%
Available Seats 543 357 157 123 129
High School Boundary Reassignments
Option #5Clarksburg, Northwest, and Seneca Valley Clusters Boundary Study
March 2019
Northwest HS
Seneca Valley HS
Notes: In the 2020–2021 school year, the enrollment projections display only reassignments for students in Grades 9 and 10 to other high schools.
Grade 11 and 12 students would be grandfathered at their current school assignment. For the 2021–2022 school year, the data displays Grades 9–11
reassignments with Grade 12 students grandfathered at their current school assignment. The Board of Education will make a decision on the
grandfathering in November 2019.
The superintendent will make a recommendation regarding special programs for current high school students as part of his recommendation in October
2019.
No option will provide full capacity relief for Clarksburg or Northwest high schools. It is anticipated that, capacity relief for Northwest High School will be
provided in the future with the opening of Crown High School. A long-term plan for Clarksburg High School will be developed in a future CIP.
2018–19
Projected Number of Students Race/Ethnic Composition
Clarksburg HS
21
% Afr. % % % % % %
School 2020–21 2021–22 2022–23 2023–24 2024–25 Amer. Asian Hispanic White 2 or More FARMS ESOL
Maximum Number of Seats= 1,231
No Change:
Number of Students 1,335 1,360 1,373 1,392 1,394 26.1% 23.7% 30.7% 13.8% 5.6% 36.4% 6.1%
Percent of Building Occupied 108% 110% 112% 113% 113%
Available Seats -104 -129 -142 -161 -163
With Change:
Number of Students 1,204 1,166 1,196 1,220 1,229 25.5% 25.2% 29.5% 14.1% 5.8% 35.5% 5.7%
Percent of Building Occupied 98% 95% 97% 99% 100%
Available Seats 27 65 35 11 2
Maximum Number of Seats= 914
No Change:
Number of Students 757 793 800 798 838 37.7% 12.0% 31.9% 13.4% 4.8% 44.9% 9.9%
Percent of Building Occupied 83% 87% 88% 87% 92%
Available Seats 157 121 114 116 76
With Change:
Number of Students 794 857 877 885 927 39.2% 12.0% 31.2% 13.0% 4.6% 45.2% 9.5%
Percent of Building Occupied 87% 94% 96% 97% 101%
Available Seats 120 57 37 29 -13
Maximum Number of Seats= 1,041
No Change:
Number of Students 1,014 1,003 997 980 979 26.2% 24.5% 14.7% 28.2% 6.2% 21.3% 2.6%
Percent of Building Occupied 97% 96% 96% 94% 94%
Available Seats 27 38 44 61 62
With Change:
Number of Students 1,108 1,133 1,097 1,065 1,055 25.2% 23.7% 18.3% 26.5% 6.2% 23.5% 3.4%
Percent of Building Occupied 106% 109% 105% 102% 101%
Available Seats -67 -92 -56 -24 -14
Middle School Boundary Reassignments
Note: In the 2020–2021 school year, the enrollment projections display reassignments for students in Grades 6 and 7 to other middle schools while
Grade 8 students are grandfathered at their current school assignment. In the 2021–2022 the data displays all Grade 6–8 students reassignments. The
Board of Education will make a decision on the grandfathering in November 2019.
2018–19
Projected Number of Students Race/Ethnic Composition
Roberto Clemente MS
Martin Luther King, Jr. MS
Kingsview MS
22

23
24

Proposed High School Reassignments
Reassign Germantown ES from Northwest HS to Seneca Valley HS
Reassign William B. Gibbs ES from Clarksburg HS to Seneca Valley HS
Reassign Clopper Mill ES Island from Northwest HS to Seneca Valley HS
Reassign Spark M. Matsunaga ES Island from Northwest HS to Seneca Valley HS
Proposed Middle School Reassignments
Reassign portion of Great Seneca Creek ES from Clemente MS to Kingsview MS
Reassign William B. Gibbs ES from Rocky Hill MS to Martin Luther King, Jr. MS
Reassign Spark M. Matsunaga ES Island from Kingsview MS to Martin Luther King, Jr. MS
Proposed Articulation Change
Provides straight articulation for Great Seneca Creek ES to Kingsview MS.
% Afr. % % % % % %
School 2020–21 2021–22 2022–23 2023–24 2024–25 Amer. Asian Hispanic White 2 or More FARMS ESOL
Maximum Number of Seats= 2,034
No Change:
Number of Students 2,374 2,487 2,668 2,757 2,848 28.7% 20.4% 26.8% 19.6% 4.3% 27.5% 8.2%
Percent of Building Occupied 117% 122% 131% 136% 140%
Available Seats -340 -453 -634 -723 -814
With Change:
Number of Students 2,199 2,224 2,323 2,405 2,498 28.6% 19.7% 28.6% 18.6% 4.5% 28.2% 9.3%
Percent of Building Occupied 108% 109% 114% 118% 123%
Available Seats -165 -190 -289 -371 -464
Maximum Number of Seats= 2,286
No Change:
Number of Students 2,727 2,776 2,873 2,974 2,981 25.7% 21.1% 21.7% 26.9% 4.4% 22.5% 3.2%
Percent of Building Occupied 119% 121% 126% 130% 130%
Available Seats -441 -490 -587 -688 -695
With Change:
Number of Students 2,567 2,529 2,550 2,649 2,680 23.6% 21.7% 21.2% 28.9% 4.5% 21.1% 3.1%
Percent of Building Occupied 112% 111% 112% 116% 117%
Available Seats -281 -243 -264 -363 -394
Maximum Number of Seats= 2,581
No Change:
Number of Students 1,203 1,214 1,256 1,281 1,301 34.6% 10.9% 35.8% 14.5% 4.1% 39.0% 14.1%
Percent of Building Occupied 47% 47% 49% 50% 50%
Available Seats 1,378 1,367 1,325 1,300 1,280
With Change:
Number of Students 1,538 1,724 1,924 1,958 1,952 34.6% 14.5% 30.4% 16.5% 4.0% 34.7% 10.1%
Students Reserved for CTE Programs 500 500 500 500 500
Percent of Building Occupied 79% 86% 94% 95% 95%
Available Seats 543 357 157 123 129
Projected Number of Students Race/Ethnic Composition
Clarksburg HS
Northwest HS
Seneca Valley HS
Option #5a
Clarksburg, Northwest, and Seneca Valley Clusters Boundary StudyMarch 2019
Proposed High School Boundary Reassignments2018–19
Notes: In the 2020–2021 school year, the enrollment projections display only reassignments for students in Grades 9 and 10 to other high schools. Grade
11 and 12 students would be grandfathered at their current school assignment. For the 2021–2022 school year, the data displays Grades 9–11
reassignments with Grade 12 students grandfathered at their current school assignment. The Board of Education will make a decision on the
grandfathering in November 2019.
The superintendent will make a recommendation regarding special programs for current high school students as part of his recommendation in October
2019.
No option will provide full capacity relief for Clarksburg or Northwest high schools. It is anticipated that, capacity relief for Northwest High School will be
provided in the future with the opening of Crown High School. A long-term plan for Clarksburg High School will be developed in a future CIP.
25
% Afr. % % % % % %
School 2020–21 2021–22 2022–23 2023–24 2024–25 Amer. Asian Hispanic White 2 or More FARMS ESOL
Maximum Number of Seats= 1,231
No Change:
Number of Students 1,335 1,360 1,373 1,392 1,394 26.1% 23.7% 30.7% 13.8% 5.6% 36.4% 6.1%
Percent of Building Occupied 108% 110% 112% 113% 113%
Available Seats -104 -129 -142 -161 -163
With Change:
Number of Students 1,204 1,166 1,196 1,220 1,229 25.5% 25.2% 29.5% 14.1% 5.8% 35.5% 5.7%
Percent of Building Occupied 98% 95% 97% 99% 100%
Available Seats 27 65 35 11 2
Maximum Number of Seats= 914
No Change:
Number of Students 757 793 800 798 838 37.7% 12.0% 31.9% 13.4% 4.8% 44.9% 9.9%
Percent of Building Occupied 83% 87% 88% 87% 92%
Available Seats 157 121 114 116 76
With Change:
Number of Students 966 1,111 1,145 1,148 1,194 34.8% 17.4% 27.6% 14.8% 5.5% 40.7% 8.7%
Percent of Building Occupied 106% 122% 125% 126% 131%
Available Seats -52 -197 -231 -234 -280
Maximum Number of Seats= 1,041
No Change:
Number of Students 1,014 1,003 997 980 979 26.2% 24.5% 14.7% 28.2% 6.2% 21.3% 2.6%
Percent of Building Occupied 97% 96% 96% 94% 94%
Available Seats 27 38 44 61 62
With Change:
Number of Students 1,108 1,133 1,097 1,065 1,055 25.2% 23.7% 18.3% 26.5% 6.2% 23.5% 3.4%
Percent of Building Occupied 106% 109% 105% 102% 101%
Available Seats -67 -92 -56 -24 -14
Maximum Number of Seats= 1,020
No Change:
Number of Students 799 899 946 998 1,023 24.3% 29.0% 17.9% 21.7% 6.9% 22.5% 4.5%
Percent of Building Occupied 78% 88% 93% 98% 100%
Available Seats 221 121 74 22 -3
With Change:
Number of Students 627 645 678 735 756 24.9% 27.9% 17.9% 22.8% 6.4% 19.7% 3.5%
Percent of Building Occupied 61% 63% 66% 72% 74%
Available Seats 393 375 342 285 264
2018–19
Projected Number of Students Race/Ethnic Composition
Proposed Middle School Boundary Reassignments
Rocky Hill MS
Note: In the 2020–2021 school year, the enrollment projections display reassignments for students in Grades 6 and 7 to other middle schools while Grade 8
students are grandfathered at their current school assignment. In the 2021–2022 the data displays all Grade 6–8 students reassignments. The Board of
Education will make a decision on the grandfathering in November 2019.
Kingsview MS
Roberto Clemente MS
Martin Luther King, Jr. MS
26
27
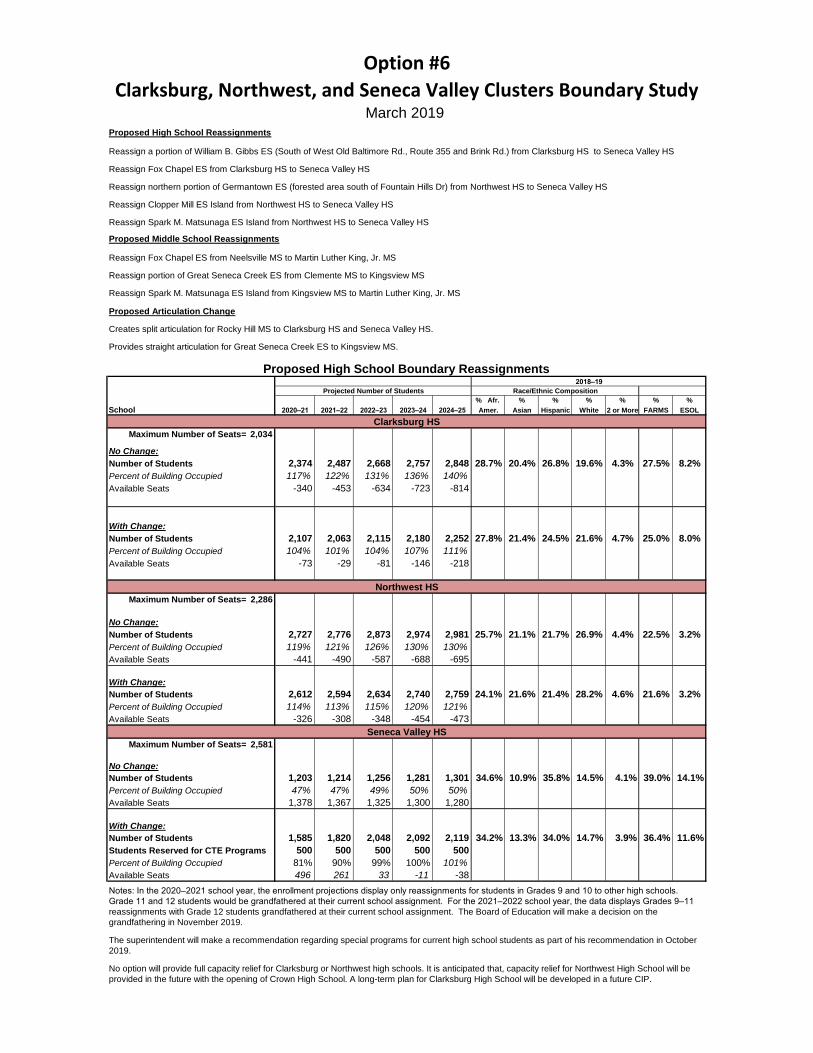
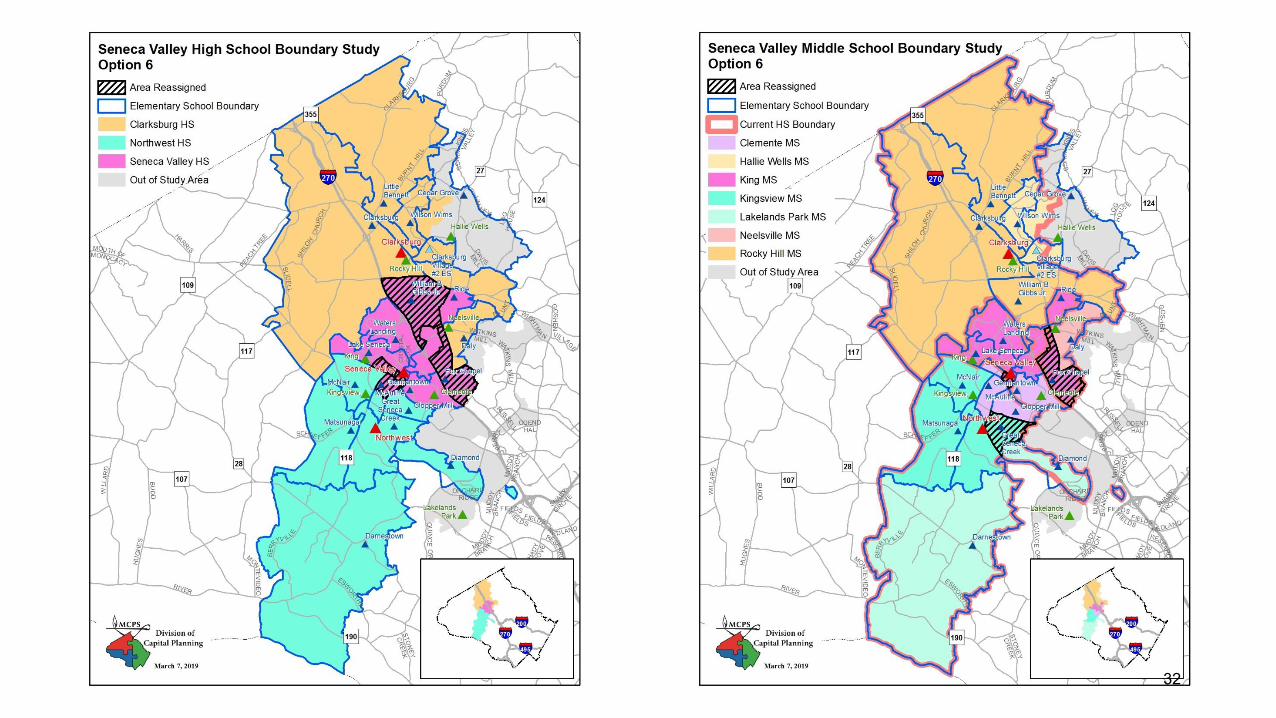
Proposed High School Reassignments
Reassign a portion of William B. Gibbs ES (South of West Old Baltimore Rd., Route 355 and Brink Rd.) from Clarksburg HS to Seneca Valley HS
Reassign Fox Chapel ES from Clarksburg HS to Seneca Valley HS
Reassign northern portion of Germantown ES (forested area south of Fountain Hills Dr) from Northwest HS to Seneca Valley HS
Reassign Clopper Mill ES Island from Northwest HS to Seneca Valley HS
Reassign Spark M. Matsunaga ES Island from Northwest HS to Seneca Valley HS
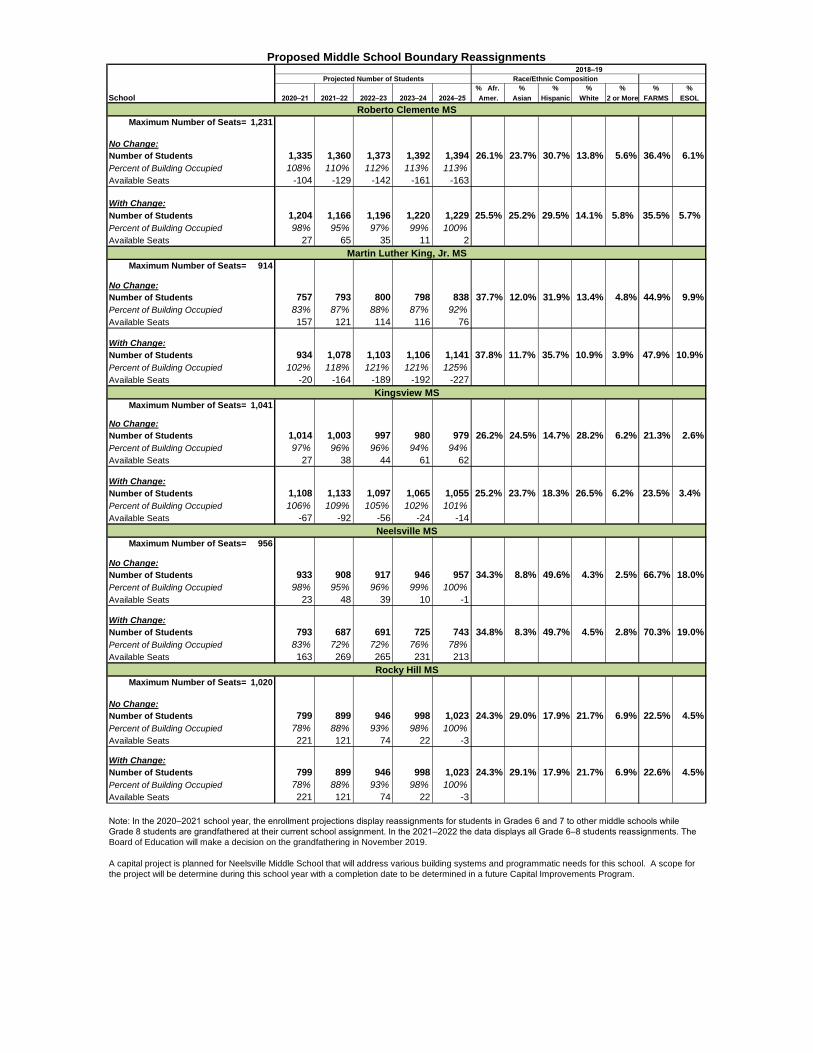
Proposed Middle School Reassignments
Reassign Fox Chapel ES from Neelsville MS to Martin Luther King, Jr. MS
Reassign portion of Great Seneca Creek ES from Clemente MS to Kingsview MS
Reassign Spark M. Matsunaga ES Island from Kingsview MS to Martin Luther King, Jr. MS
Proposed Articulation Change
Creates split articulation for Rocky Hill MS to Clarksburg HS and Seneca Valley HS.
Provides straight articulation for Great Seneca Creek ES to Kingsview MS.
% Afr. % % % % % %
School 2020–21 2021–22 2022–23 2023–24 2024–25 Amer. Asian Hispanic White 2 or More FARMS ESOL
Maximum Number of Seats= 2,034
No Change:
Number of Students 2,374 2,487 2,668 2,757 2,848 28.7% 20.4% 26.8% 19.6% 4.3% 27.5% 8.2%
Percent of Building Occupied 117% 122% 131% 136% 140%
Available Seats -340 -453 -634 -723 -814
With Change:
Number of Students 2,107 2,063 2,115 2,180 2,252 27.8% 21.4% 24.5% 21.6% 4.7% 25.0% 8.0%
Percent of Building Occupied 104% 101% 104% 107% 111%
Available Seats -73 -29 -81 -146 -218
Maximum Number of Seats= 2,286
No Change:
Number of Students 2,727 2,776 2,873 2,974 2,981 25.7% 21.1% 21.7% 26.9% 4.4% 22.5% 3.2%
Percent of Building Occupied 119% 121% 126% 130% 130%
Available Seats -441 -490 -587 -688 -695
With Change:
Number of Students 2,612 2,594 2,634 2,740 2,759 24.1% 21.6% 21.4% 28.2% 4.6% 21.6% 3.2%
Percent of Building Occupied 114% 113% 115% 120% 121%
Available Seats -326 -308 -348 -454 -473
Maximum Number of Seats= 2,581
No Change:
Number of Students 1,203 1,214 1,256 1,281 1,301 34.6% 10.9% 35.8% 14.5% 4.1% 39.0% 14.1%
Percent of Building Occupied 47% 47% 49% 50% 50%
Available Seats 1,378 1,367 1,325 1,300 1,280
With Change:
Number of Students 1,585 1,820 2,048 2,092 2,119 34.2% 13.3% 34.0% 14.7% 3.9% 36.4% 11.6%
Students Reserved for CTE Programs 500 500 500 500 500
Percent of Building Occupied 81% 90% 99% 100% 101%
Available Seats 496 261 33 -11 -38
Option #6
Clarksburg, Northwest, and Seneca Valley Clusters Boundary StudyMarch 2019
Proposed High School Boundary Reassignments2018–19
Projected Number of Students Race/Ethnic Composition
Clarksburg HS
Northwest HS
Seneca Valley HS
Notes: In the 2020–2021 school year, the enrollment projections display only reassignments for students in Grades 9 and 10 to other high schools.
Grade 11 and 12 students would be grandfathered at their current school assignment. For the 2021–2022 school year, the data displays Grades 9–11
reassignments with Grade 12 students grandfathered at their current school assignment. The Board of Education will make a decision on the
grandfathering in November 2019.
The superintendent will make a recommendation regarding special programs for current high school students as part of his recommendation in October
2019.
No option will provide full capacity relief for Clarksburg or Northwest high schools. It is anticipated that, capacity relief for Northwest High School will be
provided in the future with the opening of Crown High School. A long-term plan for Clarksburg High School will be developed in a future CIP.
% Afr. % % % % % %
School 2020–21 2021–22 2022–23 2023–24 2024–25 Amer. Asian Hispanic White 2 or More FARMS ESOL
Maximum Number of Seats= 1,231
No Change:
Number of Students 1,335 1,360 1,373 1,392 1,394 26.1% 23.7% 30.7% 13.8% 5.6% 36.4% 6.1%
Percent of Building Occupied 108% 110% 112% 113% 113%
Available Seats -104 -129 -142 -161 -163
With Change:
Number of Students 1,204 1,166 1,196 1,220 1,229 25.5% 25.2% 29.5% 14.1% 5.8% 35.5% 5.7%
Percent of Building Occupied 98% 95% 97% 99% 100%
Available Seats 27 65 35 11 2
Maximum Number of Seats= 914
No Change:
Number of Students 757 793 800 798 838 37.7% 12.0% 31.9% 13.4% 4.8% 44.9% 9.9%
Percent of Building Occupied 83% 87% 88% 87% 92%
Available Seats 157 121 114 116 76
With Change:
Number of Students 934 1,078 1,103 1,106 1,141 37.8% 11.7% 35.7% 10.9% 3.9% 47.9% 10.9%
Percent of Building Occupied 102% 118% 121% 121% 125%
Available Seats -20 -164 -189 -192 -227
Maximum Number of Seats= 1,041
No Change:
Number of Students 1,014 1,003 997 980 979 26.2% 24.5% 14.7% 28.2% 6.2% 21.3% 2.6%
Percent of Building Occupied 97% 96% 96% 94% 94%
Available Seats 27 38 44 61 62
With Change:
Number of Students 1,108 1,133 1,097 1,065 1,055 25.2% 23.7% 18.3% 26.5% 6.2% 23.5% 3.4%
Percent of Building Occupied 106% 109% 105% 102% 101%
Available Seats -67 -92 -56 -24 -14
Maximum Number of Seats= 956
No Change:
Number of Students 933 908 917 946 957 34.3% 8.8% 49.6% 4.3% 2.5% 66.7% 18.0%
Percent of Building Occupied 98% 95% 96% 99% 100%
Available Seats 23 48 39 10 -1
With Change:
Number of Students 793 687 691 725 743 34.8% 8.3% 49.7% 4.5% 2.8% 70.3% 19.0%
Percent of Building Occupied 83% 72% 72% 76% 78%
Available Seats 163 269 265 231 213
Maximum Number of Seats= 1,020
No Change:
Number of Students 799 899 946 998 1,023 24.3% 29.0% 17.9% 21.7% 6.9% 22.5% 4.5%
Percent of Building Occupied 78% 88% 93% 98% 100%
Available Seats 221 121 74 22 -3
With Change:
Number of Students 799 899 946 998 1,023 24.3% 29.1% 17.9% 21.7% 6.9% 22.6% 4.5%
Percent of Building Occupied 78% 88% 93% 98% 100%
Available Seats 221 121 74 22 -3
Rocky Hill MS
A capital project is planned for Neelsville Middle School that will address various building systems and programmatic needs for this school. A scope for
the project will be determine during this school year with a completion date to be determined in a future Capital Improvements Program.
Proposed Middle School Boundary Reassignments
Roberto Clemente MS
Kingsview MS
2018–19
Projected Number of Students Race/Ethnic Composition
Note: In the 2020–2021 school year, the enrollment projections display reassignments for students in Grades 6 and 7 to other middle schools while
Grade 8 students are grandfathered at their current school assignment. In the 2021–2022 the data displays all Grade 6–8 students reassignments. The
Board of Education will make a decision on the grandfathering in November 2019.
Martin Luther King, Jr. MS
Neelsville MS
28
31
32
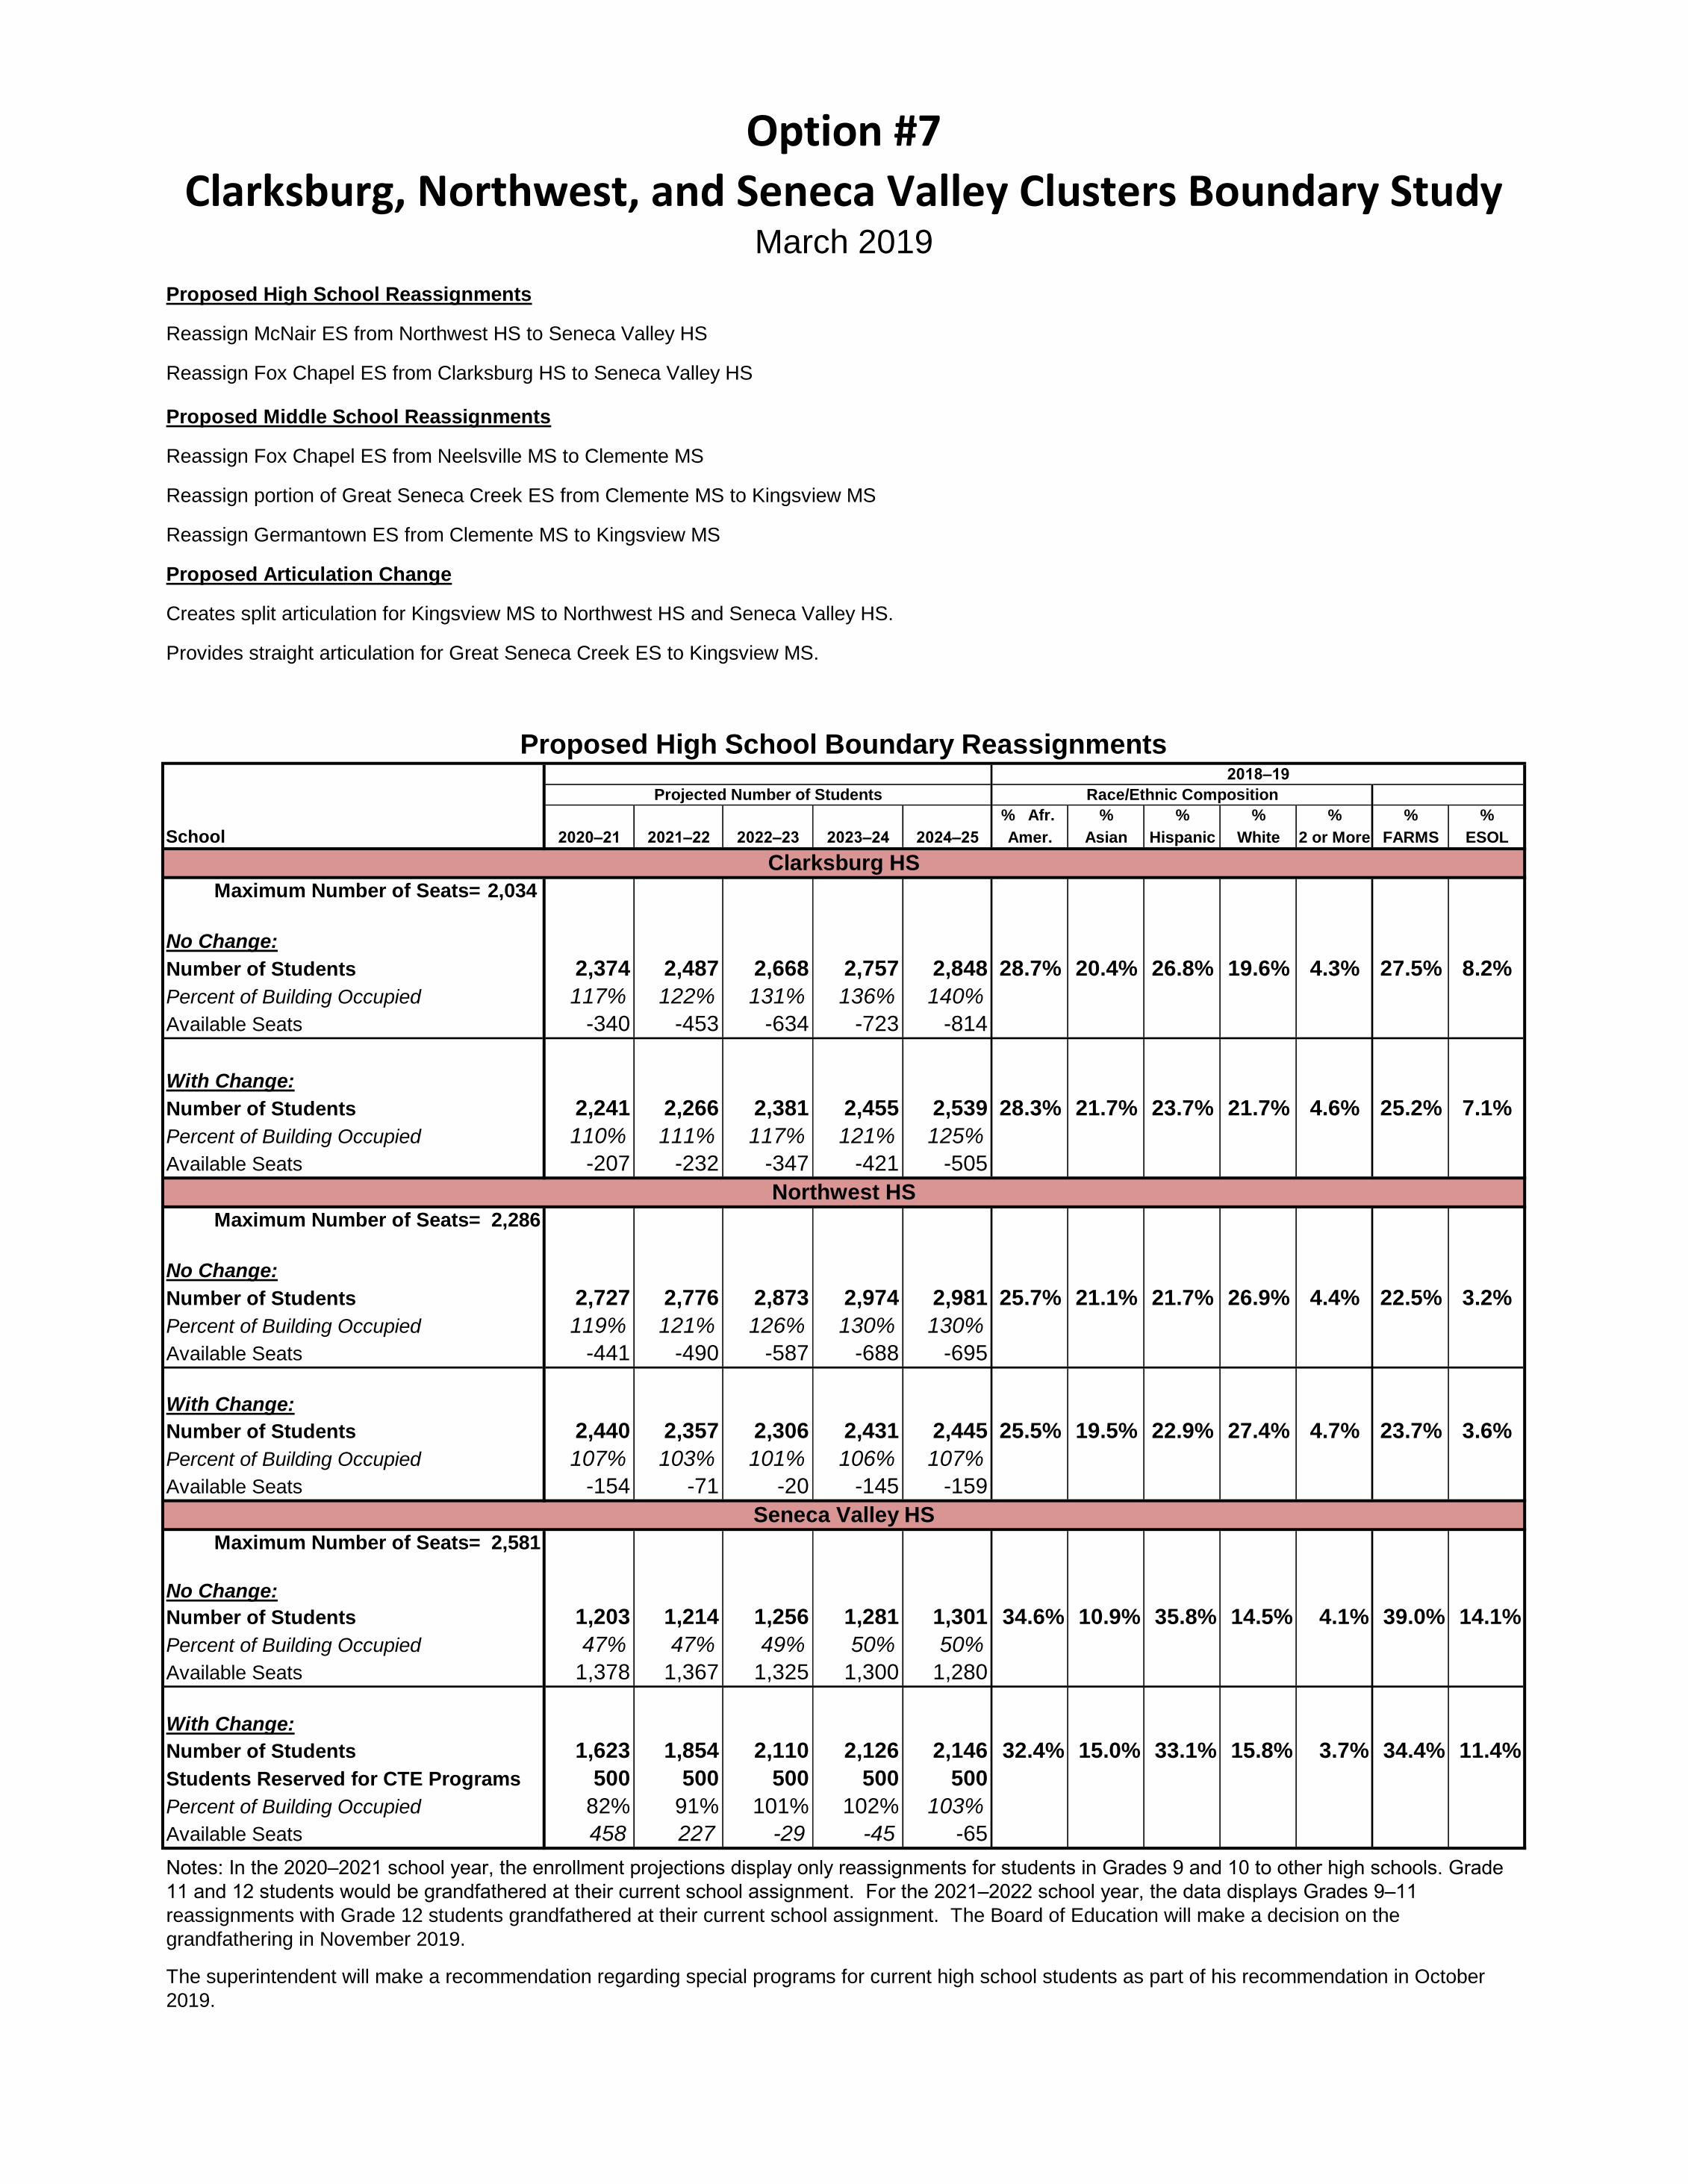
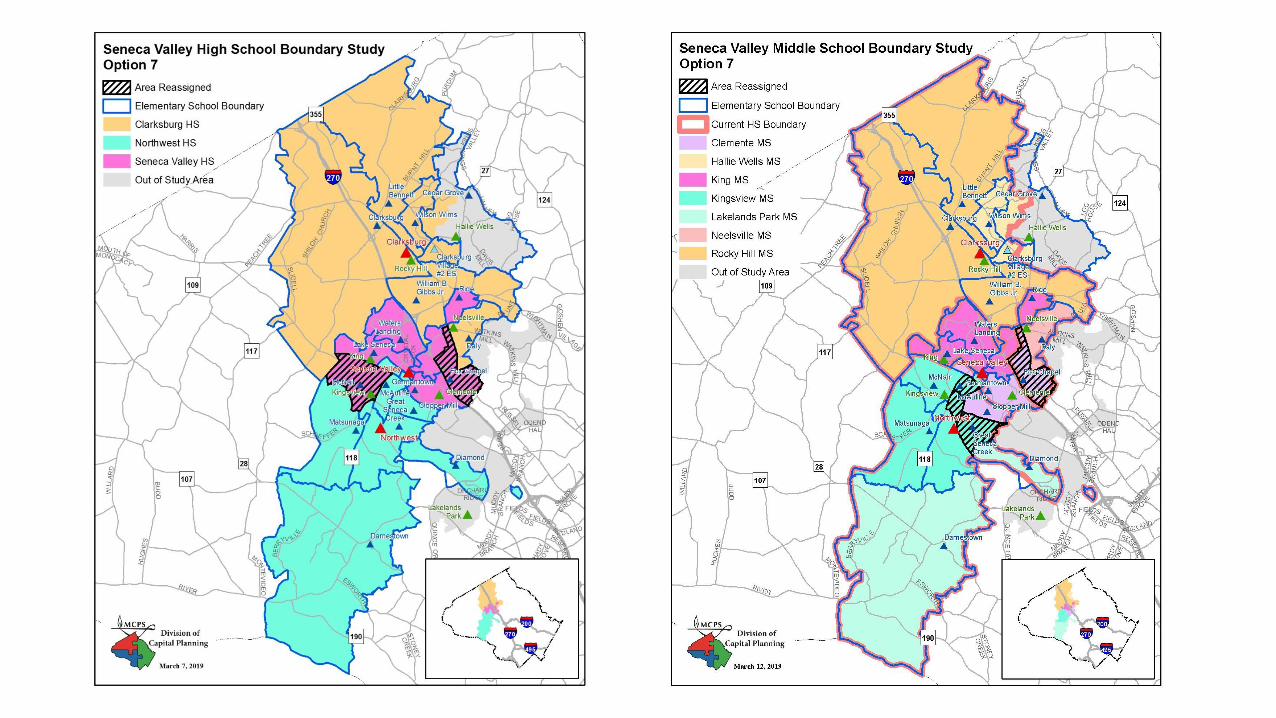
Proposed High School Reassignments
Reassign McNair ES from Northwest HS to Seneca Valley HS
Reassign Fox Chapel ES from Clarksburg HS to Seneca Valley HS
Proposed Middle School Reassignments
Reassign Fox Chapel ES from Neelsville MS to Clemente MS
Reassign portion of Great Seneca Creek ES from Clemente MS to Kingsview MS
Reassign Germantown ES from Clemente MS to Kingsview MS
Proposed Articulation Change
Creates split articulation for Kingsview MS to Northwest HS and Seneca Valley HS.
Provides straight articulation for Great Seneca Creek ES to Kingsview MS.
% Afr. % % % % % %
School 2020–21 2021–22 2022–23 2023–24 2024–25 Amer. Asian Hispanic White 2 or More FARMS ESOL
Maximum Number of Seats= 2,034
No Change:
Number of Students 2,374 2,487 2,668 2,757 2,848 28.7% 20.4% 26.8% 19.6% 4.3% 27.5% 8.2%
Percent of Building Occupied 117% 122% 131% 136% 140%
Available Seats -340 -453 -634 -723 -814
With Change:
Number of Students 2,241 2,266 2,381 2,455 2,539 28.3% 21.7% 23.7% 21.7% 4.6% 25.2% 7.1%
Percent of Building Occupied 110% 111% 117% 121% 125%
Available Seats -207 -232 -347 -421 -505
Maximum Number of Seats= 2,286
No Change:
Number of Students 2,727 2,776 2,873 2,974 2,981 25.7% 21.1% 21.7% 26.9% 4.4% 22.5% 3.2%
Percent of Building Occupied 119% 121% 126% 130% 130%
Available Seats -441 -490 -587 -688 -695
With Change:
Number of Students 2,440 2,357 2,306 2,431 2,445 25.5% 19.5% 22.9% 27.4% 4.7% 23.7% 3.6%
Percent of Building Occupied 107% 103% 101% 106% 107%
Available Seats -154 -71 -20 -145 -159
Maximum Number of Seats= 2,581
No Change:
Number of Students 1,203 1,214 1,256 1,281 1,301 34.6% 10.9% 35.8% 14.5% 4.1% 39.0% 14.1%
Percent of Building Occupied 47% 47% 49% 50% 50%
Available Seats 1,378 1,367 1,325 1,300 1,280
With Change:
Number of Students 1,623 1,854 2,110 2,126 2,146 32.4% 15.0% 33.1% 15.8% 3.7% 34.4% 11.4%
Students Reserved for CTE Programs 500 500 500 500 500
Percent of Building Occupied 82% 91% 101% 102% 103%
Available Seats 458 227 -29 -45 -65
Option #7
Clarksburg, Northwest, and Seneca Valley Clusters Boundary StudyMarch 2019
Proposed High School Boundary Reassignments2018–19
Projected Number of Students Race/Ethnic Composition
Clarksburg HS
Northwest HS
Seneca Valley HS
Notes: In the 2020–2021 school year, the enrollment projections display only reassignments for students in Grades 9 and 10 to other high schools. Grade
11 and 12 students would be grandfathered at their current school assignment. For the 2021–2022 school year, the data displays Grades 9–11
reassignments with Grade 12 students grandfathered at their current school assignment. The Board of Education will make a decision on the
grandfathering in November 2019.
The superintendent will make a recommendation regarding special programs for current high school students as part of his recommendation in October
2019.
No option will provide full capacity relief for Clarksburg or Northwest high schools. It is anticipated that, capacity relief for Northwest High School will be
provided in the future with the opening of Crown High School. A long-term plan for Clarksburg High School will be developed in a future CIP.
% Afr. % % % % % %
School 2020–21 2021–22 2022–23 2023–24 2024–25 Amer. Asian Hispanic White 2 or More FARMS ESOL
Maximum Number of Seats= 1,231
No Change:
Number of Students 1,335 1,360 1,373 1,392 1,394 26.1% 23.7% 30.7% 13.8% 5.6% 36.4% 6.1%
Percent of Building Occupied 108% 110% 112% 113% 113%
Available Seats -104 -129 -142 -161 -163
With Change:
Number of Students 1,250 1,257 1,309 1,332 1,320 25.9% 23.5% 33.4% 11.9% 5.3% 39.8% 8.0%
Percent of Building Occupied 102% 102% 106% 108% 107%
Available Seats -19 -26 -78 -101 -89
Maximum Number of Seats= 1,041
No Change:
Number of Students 1,014 1,003 997 980 979 26.2% 24.5% 14.7% 28.2% 6.2% 21.3% 2.6%
Percent of Building Occupied 97% 96% 96% 94% 94%
Available Seats 27 38 44 61 62
With Change:
Number of Students 1,239 1,327 1,287 1,261 1,267 27.6% 22.3% 19.9% 24.5% 5.7% 25.8% 3.3%
Percent of Building Occupied 119% 127% 124% 121% 122%
Available Seats -198 -286 -246 -220 -226
Maximum Number of Seats= 956
No Change:
Number of Students 933 908 917 946 957 34.3% 8.8% 49.6% 4.3% 2.5% 66.7% 18.0%
Percent of Building Occupied 98% 95% 96% 99% 100%
Available Seats 23 48 39 10 -1
With Change:
Number of Students 793 687 691 725 743 34.8% 8.3% 49.7% 4.5% 2.8% 70.3% 19.0%
Percent of Building Occupied 83% 72% 72% 76% 78%
Available Seats 163 269 265 231 213
Proposed Middle School Boundary Reassignments
Roberto Clemente MS
Kingsview MS
Note: In the 2020–2021 school year, the enrollment projections display reassignments for students in Grades 6 and 7 to other middle schools while Grade
8 students are grandfathered at their current school assignment. In the 2021–2022 the data displays all Grade 6–8 students reassignments. The Board of
Education will make a decision on the grandfathering in November 2019.
2018–19
Projected Number of Students Race/Ethnic Composition
Neelsville MS
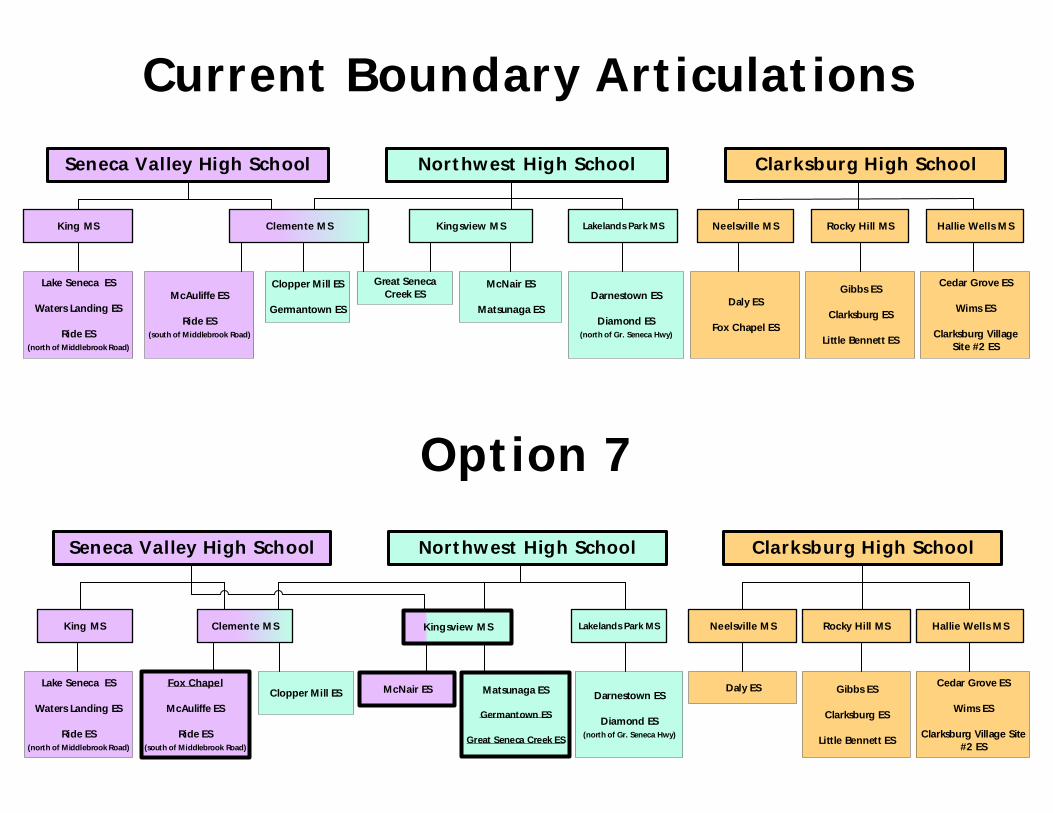
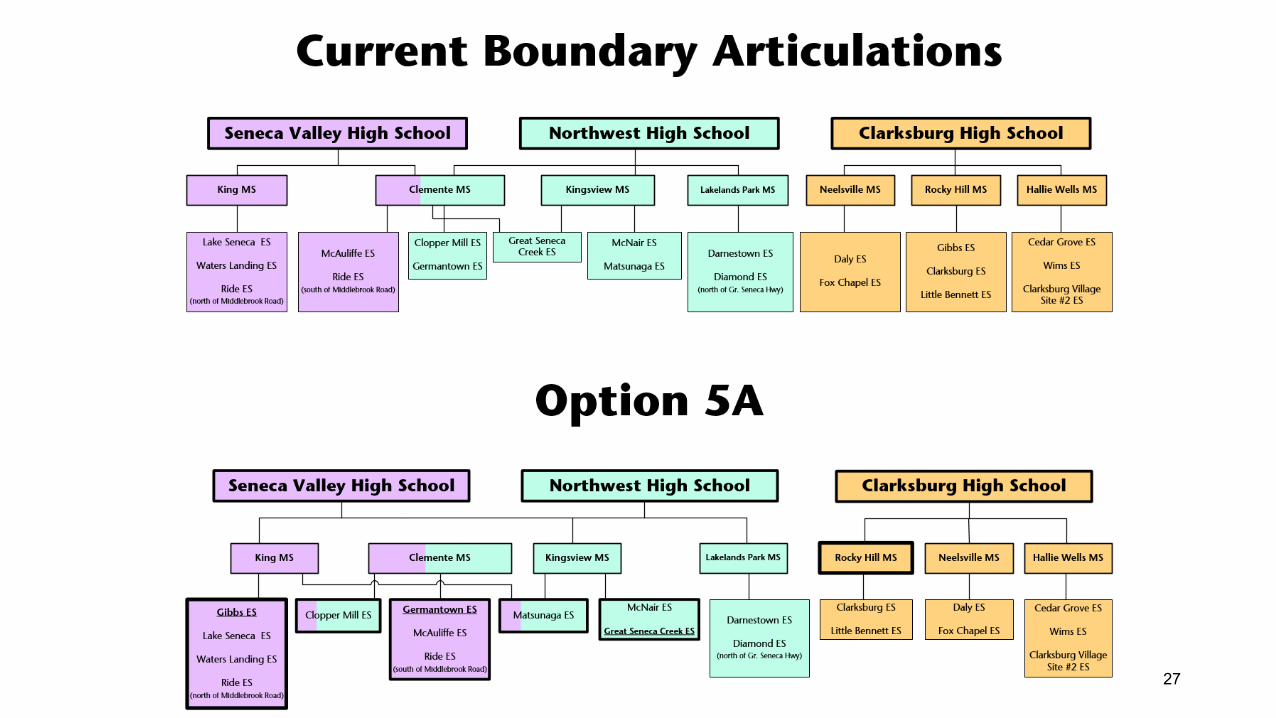
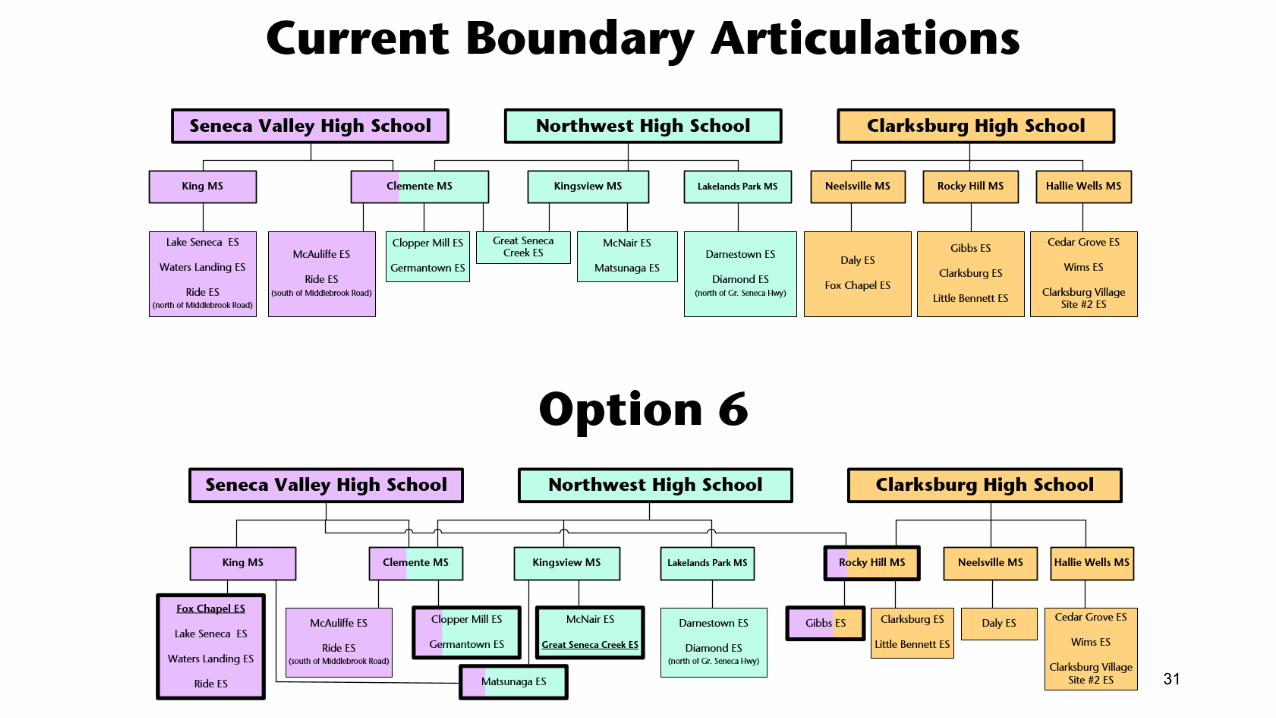
Current Boundary Articulations
Seneca Valley High School
Clemente MSKing MS
Fox Chapel
McAuliffe ES
Ride ES (south of Middlebrook Road)
Kingsview MS Lakelands Park MS
Clopper Mill ES Matsunaga ES
Germantown ES
Great Seneca Creek ES
Darnestown ES
Diamond ES (north of Gr. Seneca Hwy)
Hallie Wells MSRocky Hill MSNeelsville MS
Daly ES Gibbs ES
Clarksburg ES
Little Bennett ES
Cedar Grove ES
Wims ES
Clarksburg Village Site #2 ES
Northwest High School Clarksburg High School
Lake Seneca ES
Waters Landing ES
Ride ES (north of Middlebrook Road)
Option 7
McNair ES
Seneca Valley High School
Clemente MSKing MS
McAuliffe ES
Ride ES (south of Middlebrook Road)
Kingsview MS Lakelands Park MS
Clopper Mill ES
Germantown ES
McNair ES
Matsunaga ES
Darnestown ES
Diamond ES (north of Gr. Seneca Hwy)
Hallie Wells MSRocky Hill MSNeelsville MS
Daly ES
Fox Chapel ES
Gibbs ES
Clarksburg ES
Little Bennett ES
Cedar Grove ES
Wims ES
Clarksburg Village Site #2 ES
Northwest High School Clarksburg High School
Lake Seneca ES
Waters Landing ES
Ride ES (north of Middlebrook Road)
Great Seneca Creek ES
% Afr. % % % % % %
School 2020–21 2021–22 2022–23 2023–24 2024–25 Amer. Asian Hispanic White 2 or More FARMS ESOL
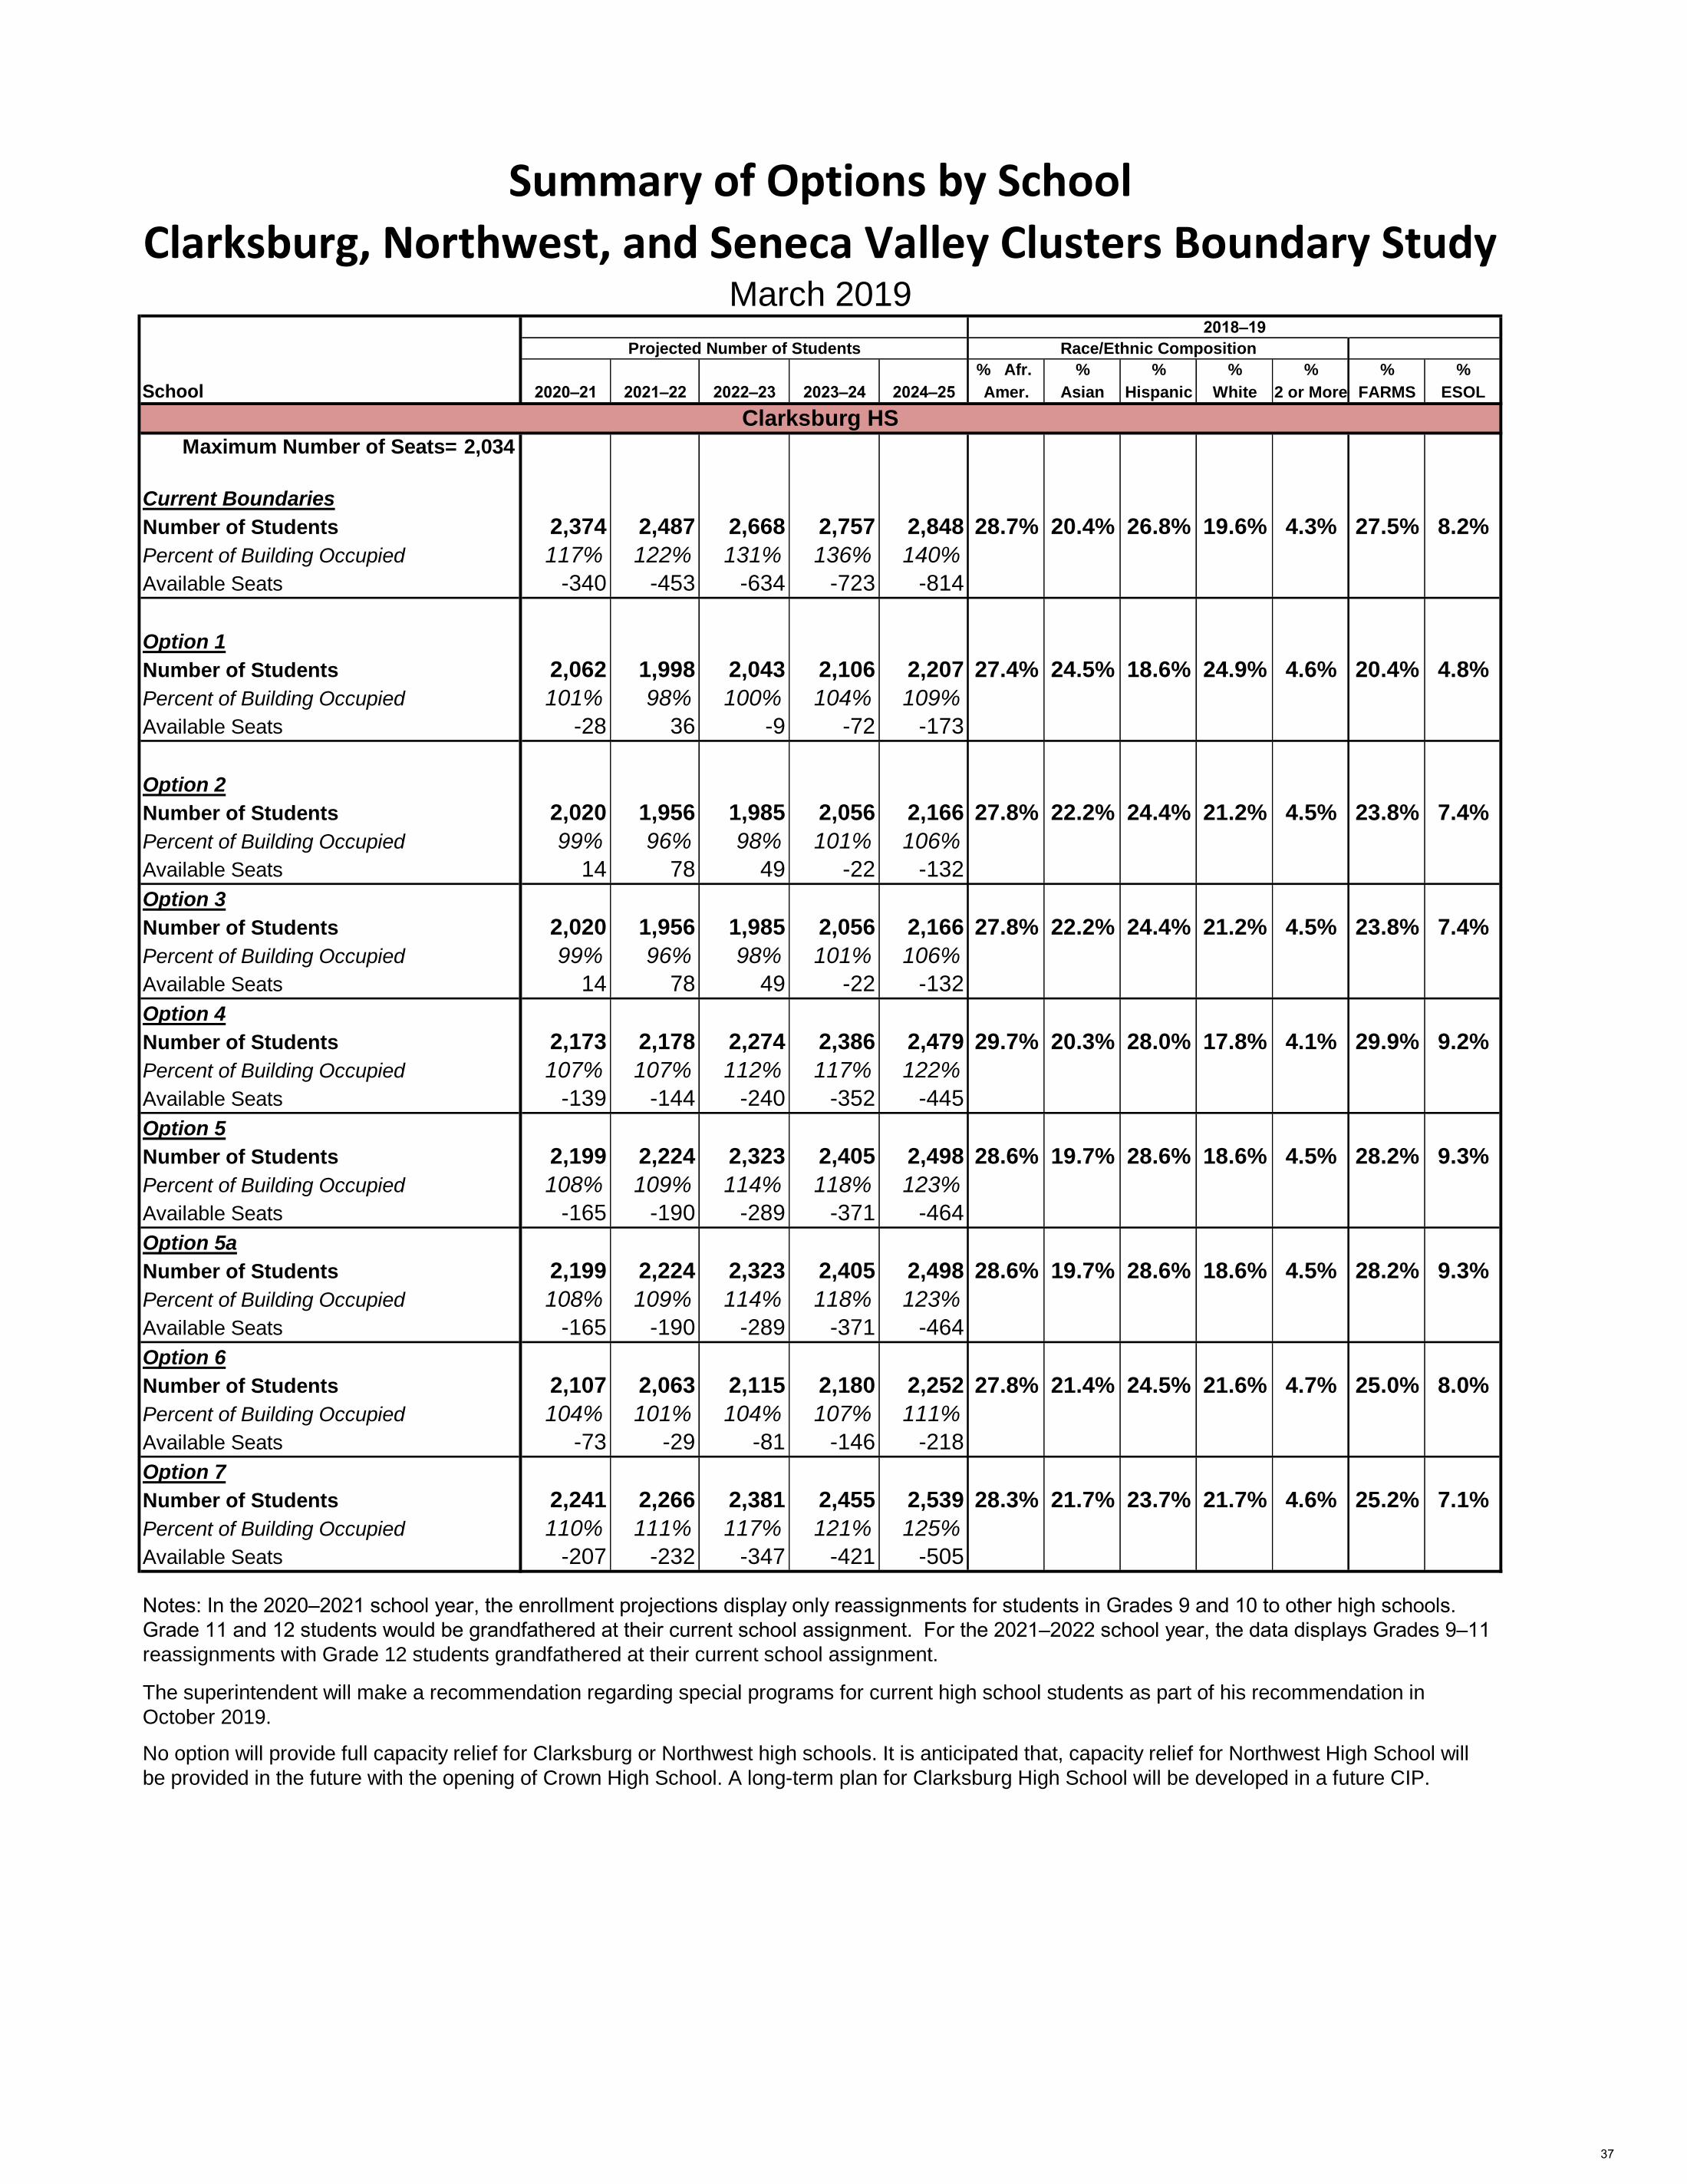
Maximum Number of Seats= 2,034
Current Boundaries
Number of Students 2,374 2,487 2,668 2,757 2,848 28.7% 20.4% 26.8% 19.6% 4.3% 27.5% 8.2%
Percent of Building Occupied 117% 122% 131% 136% 140%
Available Seats -340 -453 -634 -723 -814
Option 1
Number of Students 2,062 1,998 2,043 2,106 2,207 27.4% 24.5% 18.6% 24.9% 4.6% 20.4% 4.8%
Percent of Building Occupied 101% 98% 100% 104% 109%
Available Seats -28 36 -9 -72 -173
Option 2
Number of Students 2,020 1,956 1,985 2,056 2,166 27.8% 22.2% 24.4% 21.2% 4.5% 23.8% 7.4%
Percent of Building Occupied 99% 96% 98% 101% 106%
Available Seats 14 78 49 -22 -132
Option 3
Number of Students 2,020 1,956 1,985 2,056 2,166 27.8% 22.2% 24.4% 21.2% 4.5% 23.8% 7.4%
Percent of Building Occupied 99% 96% 98% 101% 106%
Available Seats 14 78 49 -22 -132
Option 4
Number of Students 2,173 2,178 2,274 2,386 2,479 29.7% 20.3% 28.0% 17.8% 4.1% 29.9% 9.2%
Percent of Building Occupied 107% 107% 112% 117% 122%
Available Seats -139 -144 -240 -352 -445
Option 5
Number of Students 2,199 2,224 2,323 2,405 2,498 28.6% 19.7% 28.6% 18.6% 4.5% 28.2% 9.3%
Percent of Building Occupied 108% 109% 114% 118% 123%
Available Seats -165 -190 -289 -371 -464
Option 5a
Number of Students 2,199 2,224 2,323 2,405 2,498 28.6% 19.7% 28.6% 18.6% 4.5% 28.2% 9.3%
Percent of Building Occupied 108% 109% 114% 118% 123%
Available Seats -165 -190 -289 -371 -464
Option 6
Number of Students 2,107 2,063 2,115 2,180 2,252 27.8% 21.4% 24.5% 21.6% 4.7% 25.0% 8.0%
Percent of Building Occupied 104% 101% 104% 107% 111%
Available Seats -73 -29 -81 -146 -218
Option 7
Number of Students 2,241 2,266 2,381 2,455 2,539 28.3% 21.7% 23.7% 21.7% 4.6% 25.2% 7.1%
Percent of Building Occupied 110% 111% 117% 121% 125%
Available Seats -207 -232 -347 -421 -505
Clarksburg HS
Notes: In the 2020–2021 school year, the enrollment projections display only reassignments for students in Grades 9 and 10 to other high schools.
Grade 11 and 12 students would be grandfathered at their current school assignment. For the 2021–2022 school year, the data displays Grades 9–11
reassignments with Grade 12 students grandfathered at their current school assignment.
The superintendent will make a recommendation regarding special programs for current high school students as part of his recommendation in
October 2019.
No option will provide full capacity relief for Clarksburg or Northwest high schools. It is anticipated that, capacity relief for Northwest High School will
be provided in the future with the opening of Crown High School. A long-term plan for Clarksburg High School will be developed in a future CIP.
Summary of Options by School
Clarksburg, Northwest, and Seneca Valley Clusters Boundary StudyMarch 2019
2018–19
Projected Number of Students Race/Ethnic Composition
37
% Afr. % % % % % %
School 2020–21 2021–22 2022–23 2023–24 2024–25 Amer. Asian Hispanic White 2 or More FARMS ESOL
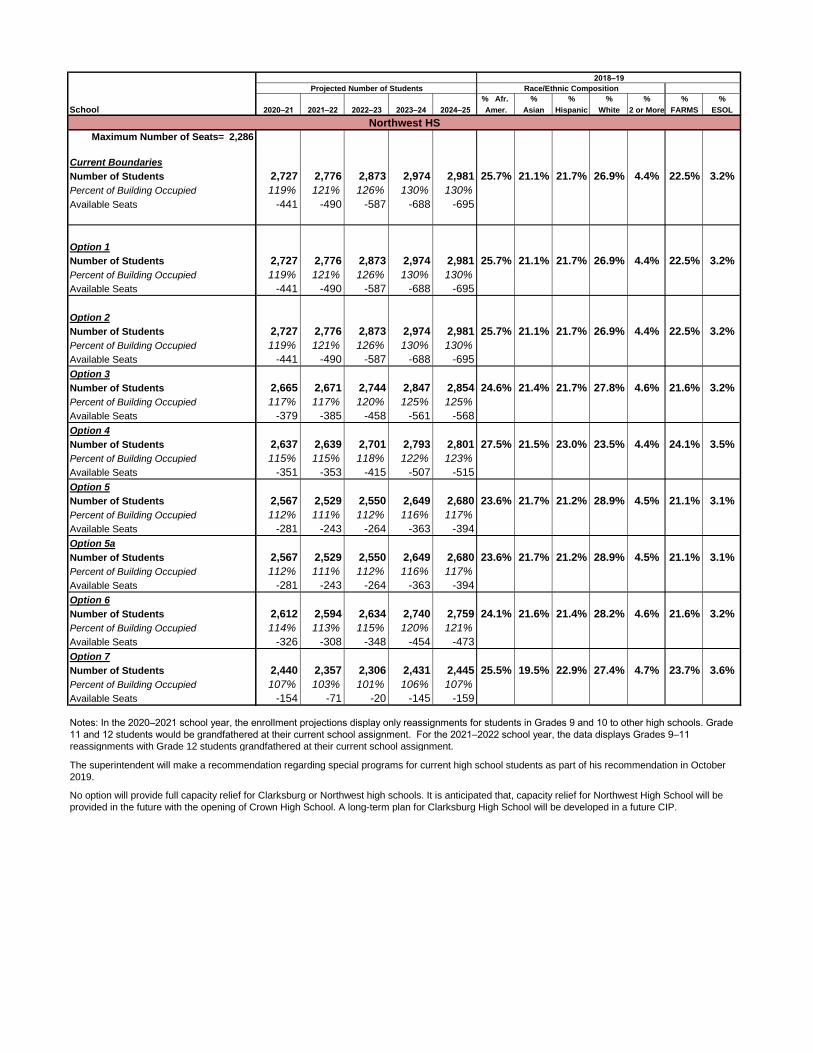
Maximum Number of Seats= 2,286
Current Boundaries
Number of Students 2,727 2,776 2,873 2,974 2,981 25.7% 21.1% 21.7% 26.9% 4.4% 22.5% 3.2%
Percent of Building Occupied 119% 121% 126% 130% 130%
Available Seats -441 -490 -587 -688 -695
Option 1
Number of Students 2,727 2,776 2,873 2,974 2,981 25.7% 21.1% 21.7% 26.9% 4.4% 22.5% 3.2%
Percent of Building Occupied 119% 121% 126% 130% 130%
Available Seats -441 -490 -587 -688 -695
Option 2
Number of Students 2,727 2,776 2,873 2,974 2,981 25.7% 21.1% 21.7% 26.9% 4.4% 22.5% 3.2%
Percent of Building Occupied 119% 121% 126% 130% 130%
Available Seats -441 -490 -587 -688 -695
Option 3
Number of Students 2,665 2,671 2,744 2,847 2,854 24.6% 21.4% 21.7% 27.8% 4.6% 21.6% 3.2%
Percent of Building Occupied 117% 117% 120% 125% 125%
Available Seats -379 -385 -458 -561 -568
Option 4
Number of Students 2,637 2,639 2,701 2,793 2,801 27.5% 21.5% 23.0% 23.5% 4.4% 24.1% 3.5%
Percent of Building Occupied 115% 115% 118% 122% 123%
Available Seats -351 -353 -415 -507 -515
Option 5
Number of Students 2,567 2,529 2,550 2,649 2,680 23.6% 21.7% 21.2% 28.9% 4.5% 21.1% 3.1%
Percent of Building Occupied 112% 111% 112% 116% 117%
Available Seats -281 -243 -264 -363 -394
Option 5a
Number of Students 2,567 2,529 2,550 2,649 2,680 23.6% 21.7% 21.2% 28.9% 4.5% 21.1% 3.1%
Percent of Building Occupied 112% 111% 112% 116% 117%
Available Seats -281 -243 -264 -363 -394
Option 6
Number of Students 2,612 2,594 2,634 2,740 2,759 24.1% 21.6% 21.4% 28.2% 4.6% 21.6% 3.2%
Percent of Building Occupied 114% 113% 115% 120% 121%
Available Seats -326 -308 -348 -454 -473
Option 7
Number of Students 2,440 2,357 2,306 2,431 2,445 25.5% 19.5% 22.9% 27.4% 4.7% 23.7% 3.6%
Percent of Building Occupied 107% 103% 101% 106% 107%
Available Seats -154 -71 -20 -145 -159
2018–19
Projected Number of Students Race/Ethnic Composition
Northwest HS
Notes: In the 2020–2021 school year, the enrollment projections display only reassignments for students in Grades 9 and 10 to other high schools. Grade
11 and 12 students would be grandfathered at their current school assignment. For the 2021–2022 school year, the data displays Grades 9–11
reassignments with Grade 12 students grandfathered at their current school assignment.
The superintendent will make a recommendation regarding special programs for current high school students as part of his recommendation in October
2019.
No option will provide full capacity relief for Clarksburg or Northwest high schools. It is anticipated that, capacity relief for Northwest High School will be
provided in the future with the opening of Crown High School. A long-term plan for Clarksburg High School will be developed in a future CIP.

% Afr. % % % % % %
School 2020–21 2021–22 2022–23 2023–24 2024–25 Amer. Asian Hispanic White 2 or More FARMS ESOL
Maximum Number of Seats= 2,581
Current Boundaries
Number of Students 1,203 1,214 1,256 1,281 1,301 34.6% 10.9% 35.8% 14.5% 4.1% 39.0% 14.1%
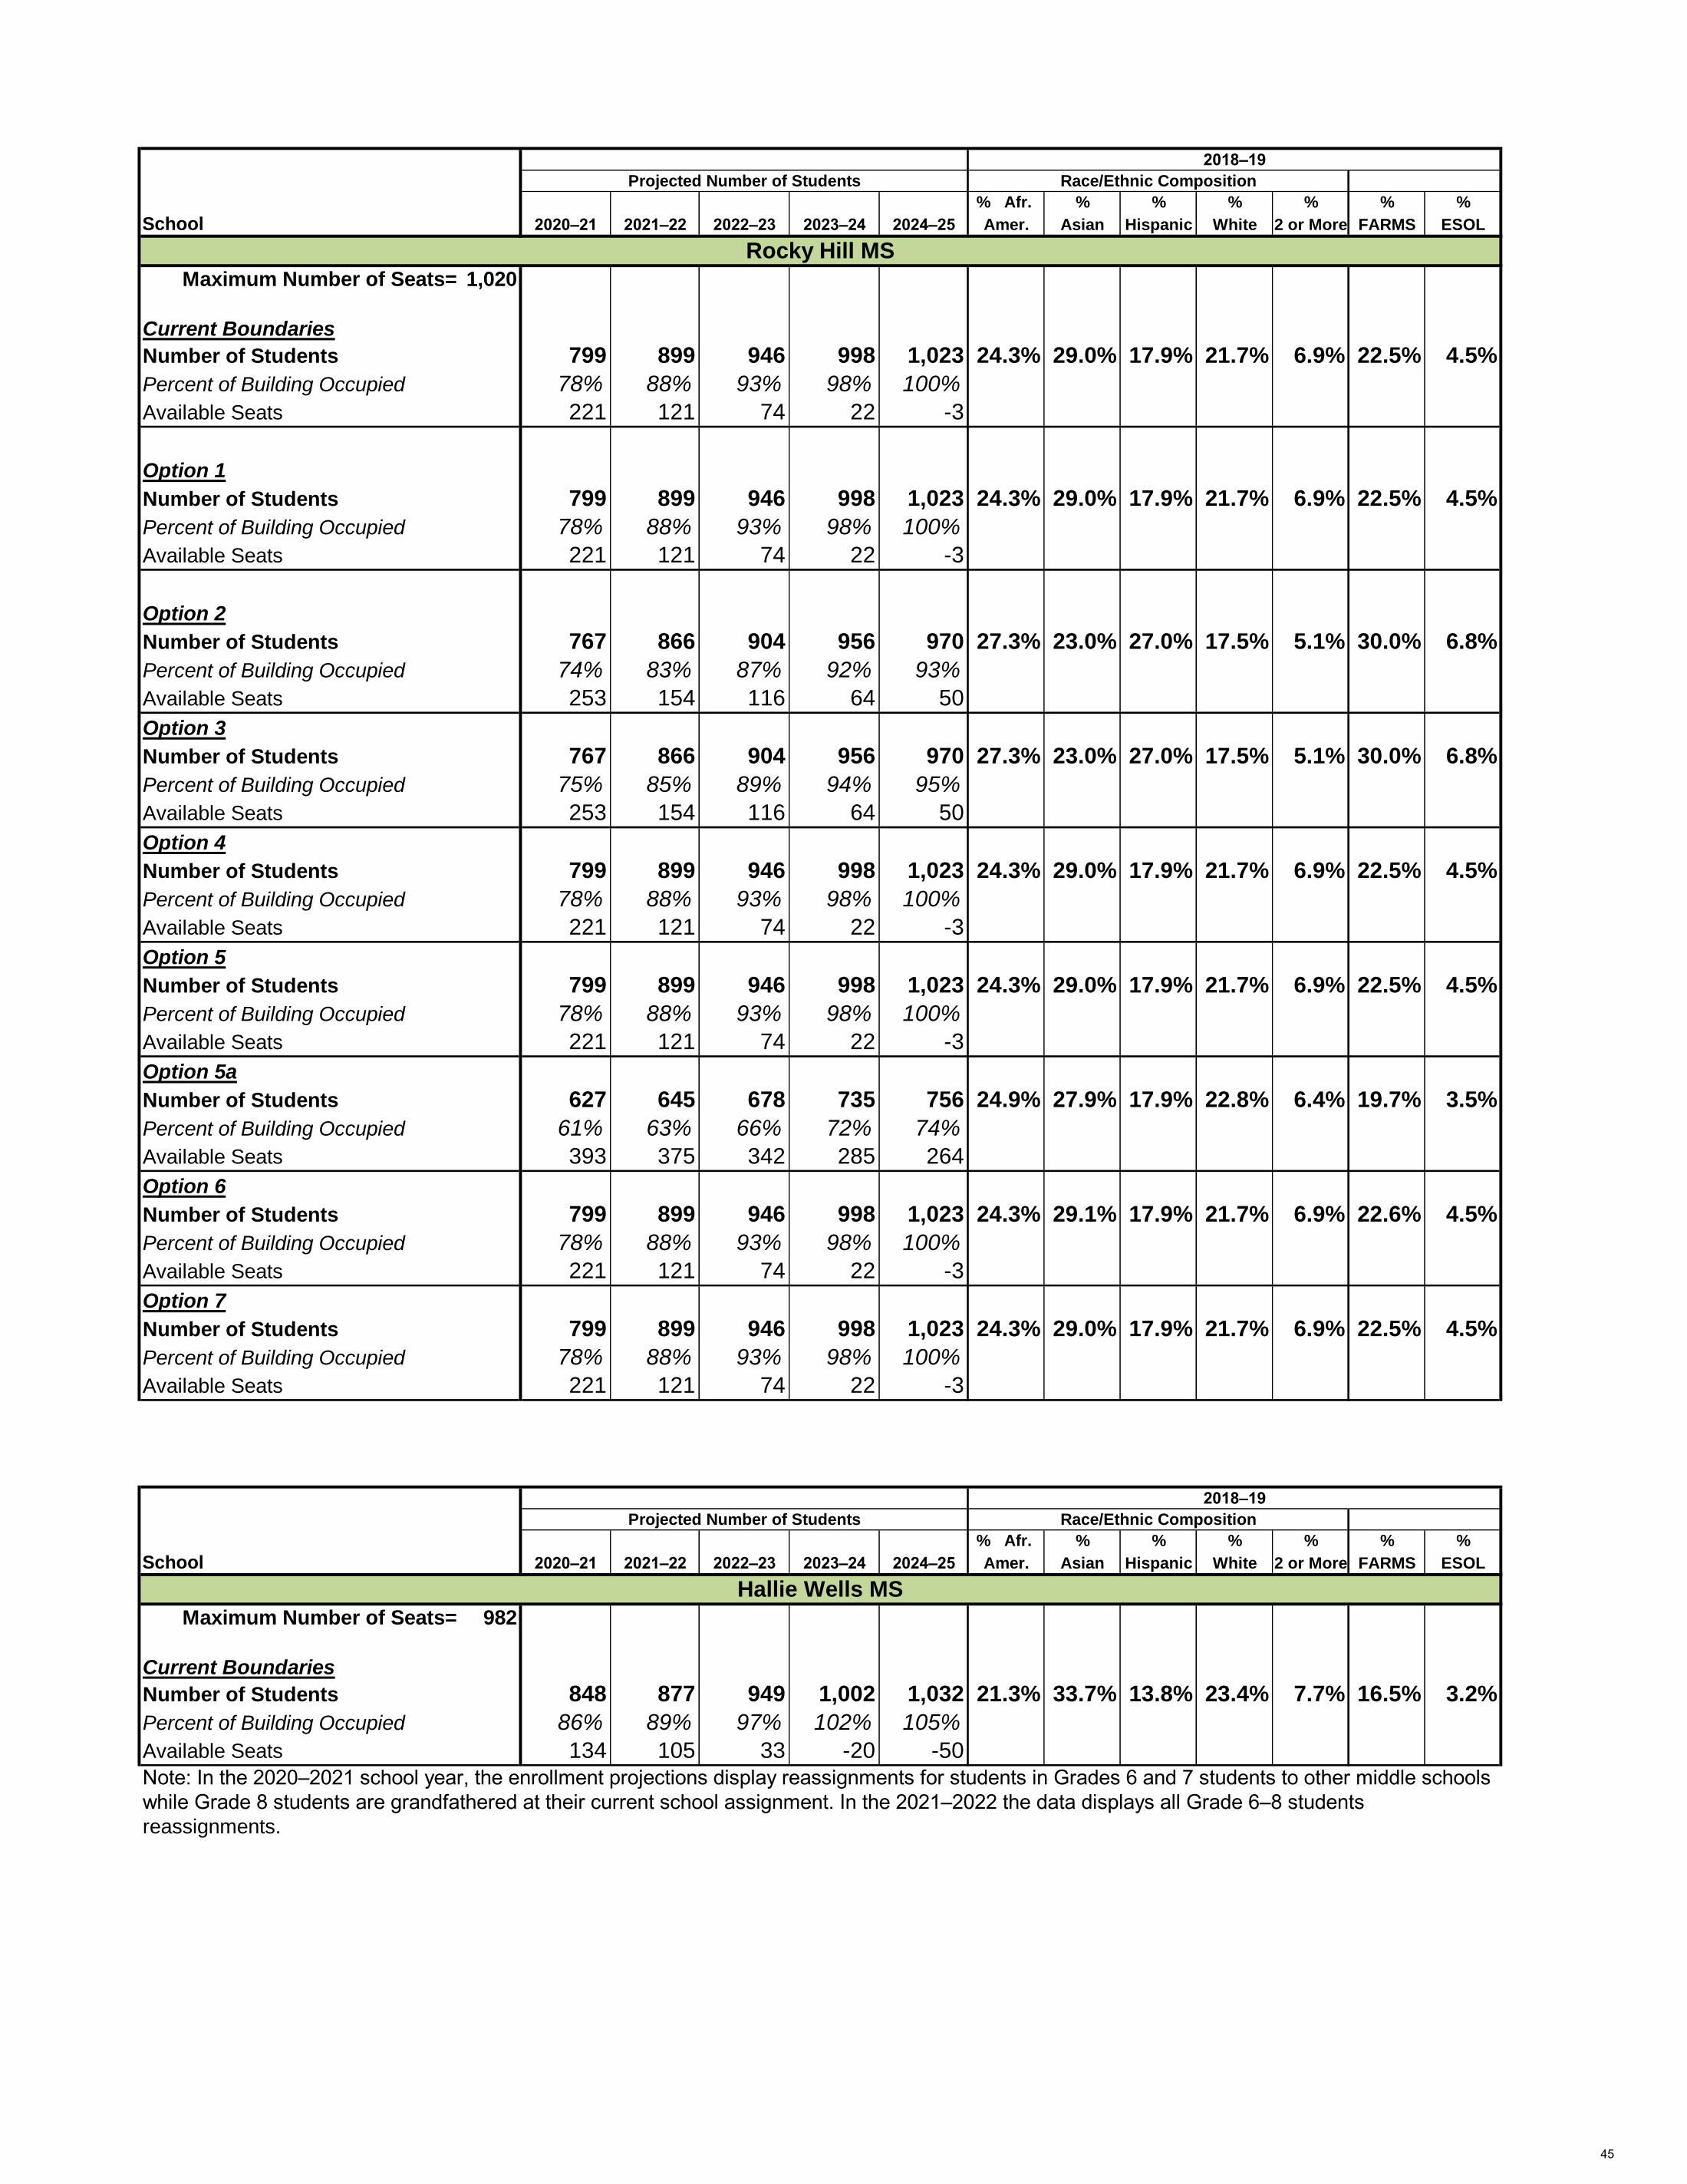
Percent of Building Occupied 47% 47% 49% 50% 50%
Available Seats 1,378 1,367 1,325 1,300 1,280
Option 1
Number of Students 1,515 1,703 1,881 1,932 1,942 33.8% 10.5% 40.0% 11.8% 3.9% 41.3% 15.1%
Students Reserved for CTE Programs 500 500 500 500 500
Percent of Building Occupied 78% 85% 92% 94% 95%
Available Seats 566 378 200 149 139
Option 2
Number of Students 1,557 1,745 1,939 1,982 1,983 33.3% 13.0% 34.3% 15.3% 4.1% 37.5% 12.5%
Students Reserved for CTE Programs 500 500 500 500 500
Percent of Building Occupied 80% 87% 94% 96% 96%
Available Seats 524 336 142 99 98
Option 3
Number of Students 1,619 1,850 2,068 2,109 2,110 34.2% 13.2% 33.7% 15.0% 3.9% 37.8% 12.0%
Students Reserved for CTE Programs 500 500 500 500 500
Percent of Building Occupied 82% 91% 99% 101% 101%
Available Seats 462 231 13 -28 -29
Option 4
Number of Students 1,494 1,660 1,822 1,833 1,850 29.1% 13.2% 29.4% 23.9% 4.4% 30.0% 10.4%
Students Reserved for CTE Programs 500 500 500 500 500
Percent of Building Occupied 77% 84% 90% 90% 91%
Available Seats 587 421 259 248 231
Option 5
Number of Students 1,538 1,724 1,924 1,958 1,952 34.6% 14.5% 30.4% 16.5% 4.0% 34.7% 10.1%
Students Reserved for CTE Programs 500 500 500 500 500
Percent of Building Occupied 79% 86% 94% 95% 95%
Available Seats 543 357 157 123 129
Option 5a
Number of Students 1,538 1,724 1,924 1,958 1,952 34.6% 14.5% 30.4% 16.5% 4.0% 34.7% 10.1%
Students Reserved for CTE Programs 500 500 500 500 500
Percent of Building Occupied 79% 86% 94% 95% 95%
Available Seats 543 357 157 123 129
Option 6
Number of Students 1,585 1,820 2,048 2,092 2,119 34.2% 13.3% 34.0% 14.7% 3.9% 36.4% 11.6%
Students Reserved for CTE Programs 500 500 500 500 500
Percent of Building Occupied 81% 90% 99% 100% 101%
Available Seats 496 261 33 -11 -38
Option 7
Number of Students 1,623 1,854 2,110 2,126 2,146 32.4% 15.0% 33.1% 15.8% 3.7% 34.4% 11.4%
Students Reserved for CTE Programs 500 500 500 500 500
Percent of Building Occupied 82% 91% 101% 102% 103%
Available Seats 458 227 -29 -45 -65
Seneca Valley HS
Notes: In the 2020–2021 school year, the enrollment projections display only reassignments for students in Grades 9 and 10 to other high schools.
Grade 11 and 12 students would be grandfathered at their current school assignment. For the 2021–2022 school year, the data displays Grades 9–11
reassignments with Grade 12 students grandfathered at their current school assignment.
The superintendent will make a recommendation regarding special programs for current high school students as part of his recommendation in
October 2019.
No option will provide full capacity relief for Clarksburg or Northwest high schools. It is anticipated that, capacity relief for Northwest High School will
be provided in the future with the opening of Crown High School. A long-term plan for Clarksburg High School will be developed in a future CIP.
2018–19
Projected Number of Students Race/Ethnic Composition
39

% Afr. % % % % % %
School 2020–21 2021–22 2022–23 2023–24 2024–25 Amer. Asian Hispanic White 2 or More FARMS ESOL
Maximum Number of Seats= 1,231
Current Boundaries
Number of Students 1,335 1,360 1,373 1,392 1,394 26.1% 23.7% 30.7% 13.8% 5.6% 36.4% 6.1%
Percent of Building Occupied 108% 110% 112% 113% 113%
Available Seats -104 -129 -142 -161 -163
Option 1
Number of Students 1,204 1,166 1,196 1,220 1,229 25.5% 25.2% 29.5% 14.1% 5.8% 35.5% 5.7%
Percent of Building Occupied 98% 95% 97% 99% 100%
Available Seats 27 65 35 11 2
Option 2
Number of Students 1,204 1,166 1,196 1,220 1,229 25.5% 25.2% 29.5% 14.1% 5.8% 35.5% 5.7%
Percent of Building Occupied 98% 95% 97% 99% 100%
Available Seats 27 65 35 11 2
Option 3
Number of Students 1,204 1,166 1,196 1,220 1,229 25.5% 25.2% 29.5% 14.1% 5.8% 35.5% 5.7%
Percent of Building Occupied 98% 95% 97% 99% 100%
Available Seats 27 65 35 11 2
Option 4
Number of Students 1,204 1,166 1,196 1,220 1,229 25.5% 25.2% 29.5% 14.1% 5.8% 35.5% 5.7%
Percent of Building Occupied 98% 95% 97% 99% 100%
Available Seats 27 65 35 11 2
Option 5
Number of Students 1,204 1,166 1,196 1,220 1,229 25.5% 25.2% 29.5% 14.1% 5.8% 35.5% 5.7%
Percent of Building Occupied 98% 95% 97% 99% 100%
Available Seats 27 65 35 11 2
Option 5a
Number of Students 1,204 1,166 1,196 1,220 1,229 25.5% 25.2% 29.5% 14.1% 5.8% 35.5% 5.7%
Percent of Building Occupied 98% 95% 97% 99% 100%
Available Seats 27 65 35 11 2
Option 6
Number of Students 1,204 1,166 1,196 1,220 1,229 25.5% 25.2% 29.5% 14.1% 5.8% 35.5% 5.7%
Percent of Building Occupied 98% 95% 97% 99% 100%
Available Seats 27 65 35 11 2
Option 7
Number of Students 1,250 1,257 1,309 1,332 1,320 25.9% 23.5% 33.4% 11.9% 5.3% 39.8% 8.0%
Percent of Building Occupied 102% 102% 106% 108% 107%
Available Seats -19 -26 -78 -101 -89
2018–19
Projected Number of Students Race/Ethnic Composition
Roberto Clemente MS
Note: In the 2020–2021 school year, the enrollment projections display reassignments for students in Grades 6 and 7 to other middle schools while
Grade 8 students are grandfathered at their current school assignment. In the 2021–2022 the data displays all Grade 6–8 students reassignments.
40
% Afr. % % % % % %
School 2020–21 2021–22 2022–23 2023–24 2024–25 Amer. Asian Hispanic White 2 or More FARMS ESOL
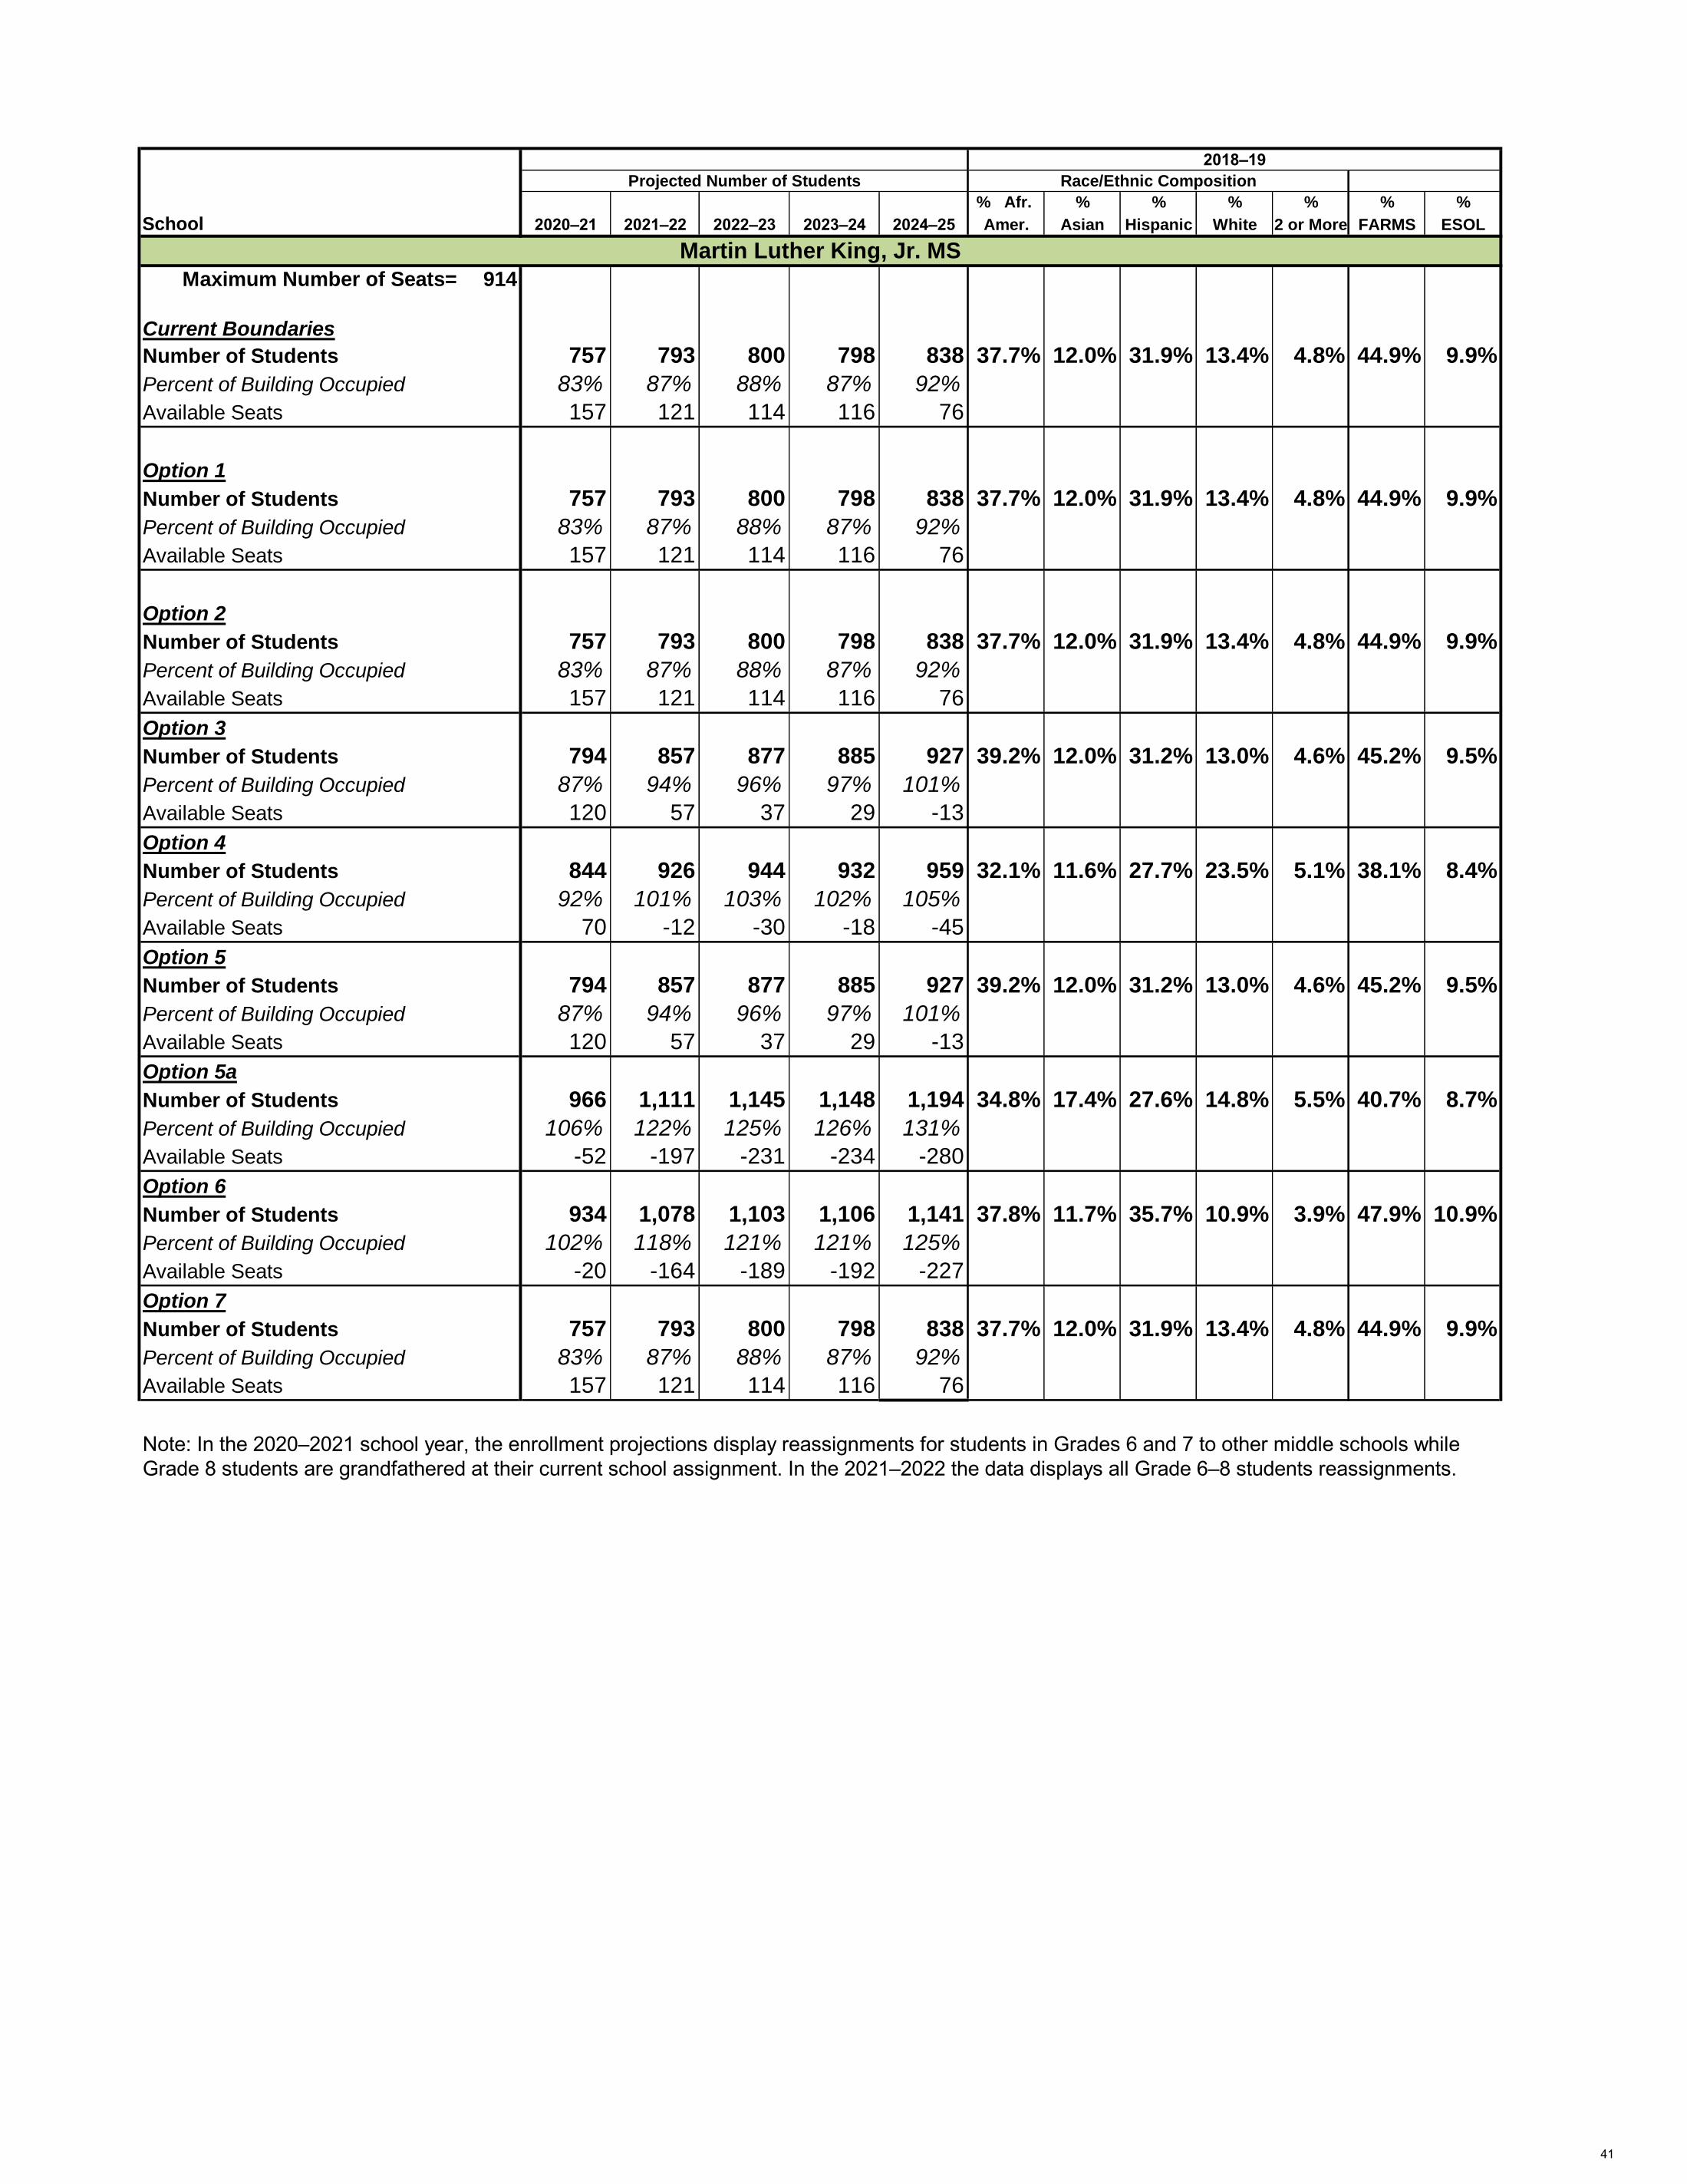
Maximum Number of Seats= 914
Current Boundaries
Number of Students 757 793 800 798 838 37.7% 12.0% 31.9% 13.4% 4.8% 44.9% 9.9%
Percent of Building Occupied 83% 87% 88% 87% 92%
Available Seats 157 121 114 116 76
Option 1
Number of Students 757 793 800 798 838 37.7% 12.0% 31.9% 13.4% 4.8% 44.9% 9.9%
Percent of Building Occupied 83% 87% 88% 87% 92%
Available Seats 157 121 114 116 76
Option 2
Number of Students 757 793 800 798 838 37.7% 12.0% 31.9% 13.4% 4.8% 44.9% 9.9%
Percent of Building Occupied 83% 87% 88% 87% 92%
Available Seats 157 121 114 116 76
Option 3
Number of Students 794 857 877 885 927 39.2% 12.0% 31.2% 13.0% 4.6% 45.2% 9.5%
Percent of Building Occupied 87% 94% 96% 97% 101%
Available Seats 120 57 37 29 -13
Option 4
Number of Students 844 926 944 932 959 32.1% 11.6% 27.7% 23.5% 5.1% 38.1% 8.4%
Percent of Building Occupied 92% 101% 103% 102% 105%
Available Seats 70 -12 -30 -18 -45
Option 5
Number of Students 794 857 877 885 927 39.2% 12.0% 31.2% 13.0% 4.6% 45.2% 9.5%
Percent of Building Occupied 87% 94% 96% 97% 101%
Available Seats 120 57 37 29 -13
Option 5a
Number of Students 966 1,111 1,145 1,148 1,194 34.8% 17.4% 27.6% 14.8% 5.5% 40.7% 8.7%
Percent of Building Occupied 106% 122% 125% 126% 131%
Available Seats -52 -197 -231 -234 -280
Option 6
Number of Students 934 1,078 1,103 1,106 1,141 37.8% 11.7% 35.7% 10.9% 3.9% 47.9% 10.9%
Percent of Building Occupied 102% 118% 121% 121% 125%
Available Seats -20 -164 -189 -192 -227
Option 7
Number of Students 757 793 800 798 838 37.7% 12.0% 31.9% 13.4% 4.8% 44.9% 9.9%
Percent of Building Occupied 83% 87% 88% 87% 92%
Available Seats 157 121 114 116 76
2018–19
Martin Luther King, Jr. MS
Projected Number of Students Race/Ethnic Composition
Note: In the 2020–2021 school year, the enrollment projections display reassignments for students in Grades 6 and 7 to other middle schools while
Grade 8 students are grandfathered at their current school assignment. In the 2021–2022 the data displays all Grade 6–8 students reassignments.
41

% Afr. % % % % % %
School 2020–21 2021–22 2022–23 2023–24 2024–25 Amer. Asian Hispanic White 2 or More FARMS ESOL
Maximum Number of Seats= 1,041
Current Boundaries
Number of Students 1,014 1,003 997 980 979 26.2% 24.5% 14.7% 28.2% 6.2% 21.3% 2.6%
Percent of Building Occupied 97% 96% 96% 94% 94%
Available Seats 27 38 44 61 62
Option 1
Number of Students 1,145 1,197 1,174 1,152 1,144 26.8% 23.0% 18.6% 25.5% 6.0% 24.8% 3.6%
Percent of Building Occupied 110% 115% 113% 111% 110%
Available Seats -104 -156 -133 -111 -103
Option 2
Number of Students 1,145 1,197 1,174 1,152 1,144 26.8% 23.0% 18.6% 25.5% 6.0% 24.8% 3.6%
Percent of Building Occupied 110% 115% 113% 111% 110%
Available Seats -104 -156 -133 -111 -103
Option 3
Number of Students 1,108 1,133 1,097 1,065 1,055 25.2% 23.7% 18.3% 26.5% 6.2% 23.5% 3.4%
Percent of Building Occupied 106% 109% 105% 102% 101%
Available Seats -67 -92 -56 -24 -14
Option 4
Number of Students 1,145 1,197 1,174 1,152 1,144 26.8% 23.0% 18.6% 25.5% 6.0% 24.8% 3.6%
Percent of Building Occupied 110% 115% 113% 111% 110%
Available Seats -104 -156 -133 -111 -103
Option 5
Number of Students 1,108 1,133 1,097 1,065 1,055 25.2% 23.7% 18.3% 26.5% 6.2% 23.5% 3.4%
Percent of Building Occupied 106% 109% 105% 102% 101%
Available Seats -67 -92 -56 -24 -14
Option 5a
Number of Students 1,108 1,133 1,097 1,065 1,055 25.2% 23.7% 18.3% 26.5% 6.2% 23.5% 3.4%
Percent of Building Occupied 106% 109% 105% 102% 101%
Available Seats -67 -92 -56 -24 -14
Option 6
Number of Students 1,108 1,133 1,097 1,065 1,055 25.2% 23.7% 18.3% 26.5% 6.2% 23.5% 3.4%
Percent of Building Occupied 106% 109% 105% 102% 101%
Available Seats -67 -92 -56 -24 -14
Option 7
Number of Students 1,239 1,327 1,287 1,261 1,267 27.6% 22.3% 19.9% 24.5% 5.7% 25.8% 3.3%
Percent of Building Occupied 119% 127% 124% 121% 122%
Available Seats -198 -286 -246 -220 -226
Kingsview MS
2018–19
Projected Number of Students Race/Ethnic Composition
Note: In the 2020–2021 school year, the enrollment projections display reassignments for students in Grades 6 and 7 to other middle schools while
Grade 8 students are grandfathered at their current school assignment. In the 2021–2022 the data displays all Grade 6–8 students reassignments.
42
% Afr. % % % % % %
School 2020–21 2021–22 2022–23 2023–24 2024–25 Amer. Asian Hispanic White 2 or More FARMS ESOL
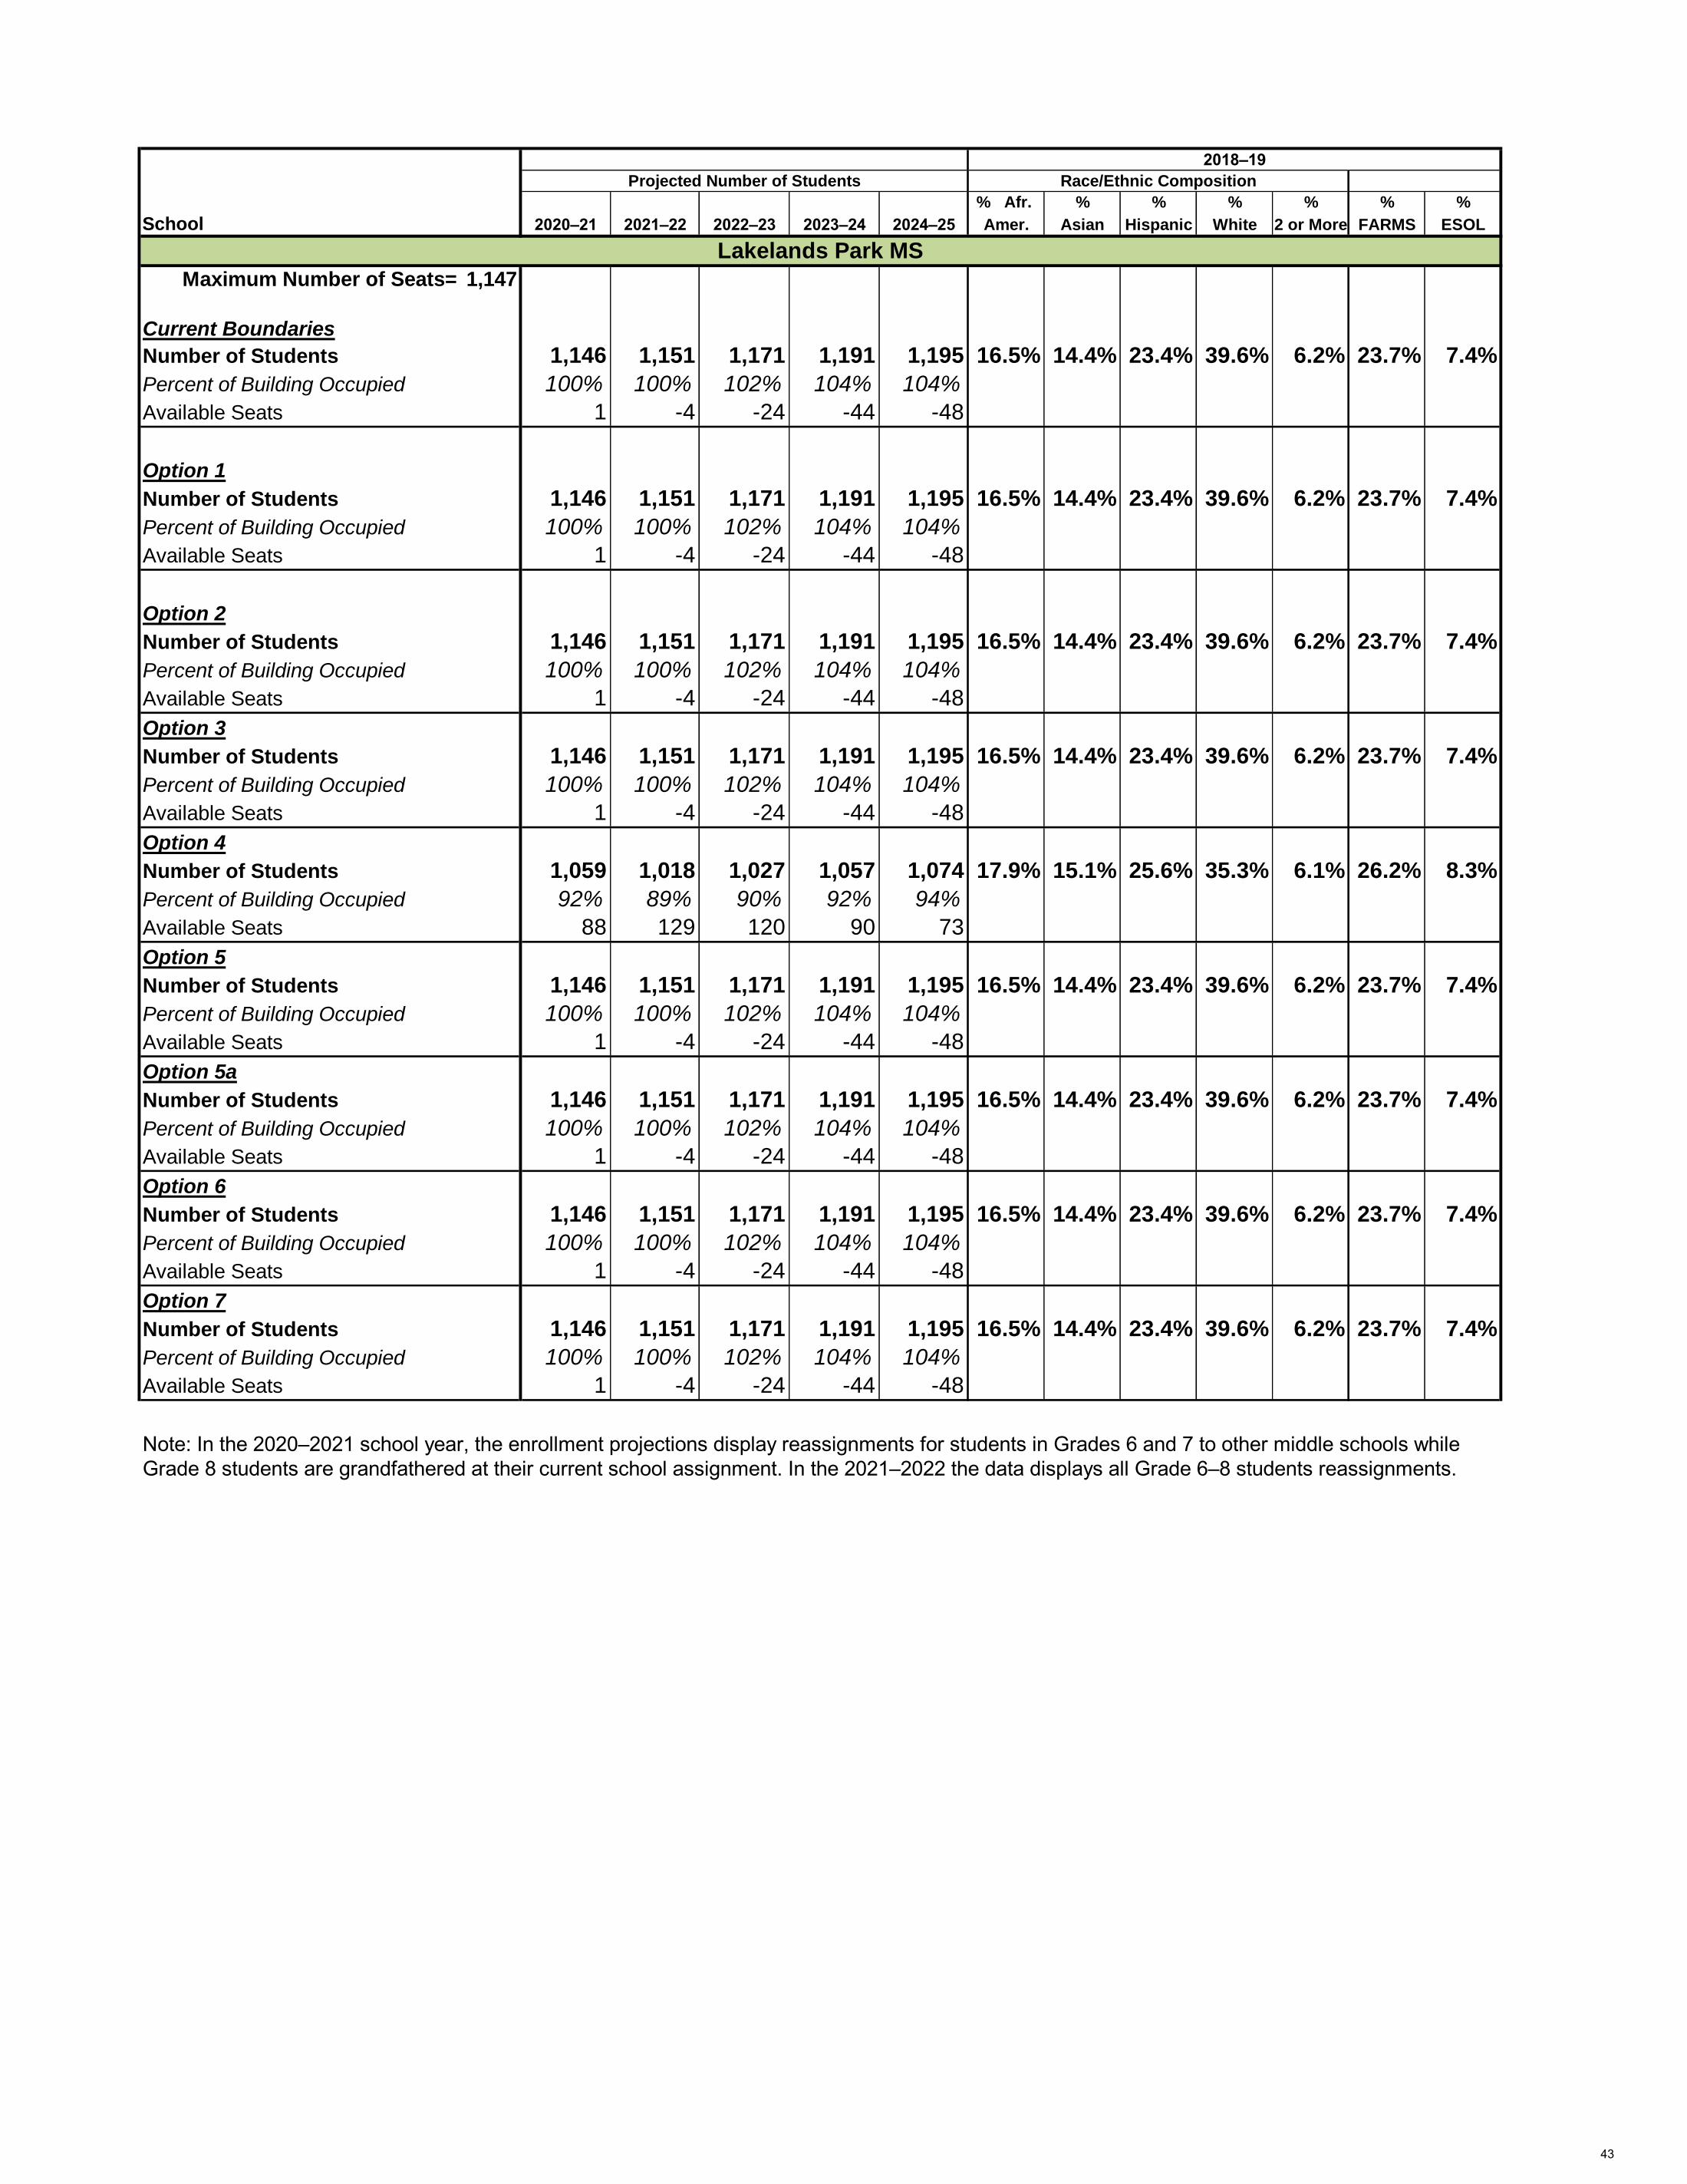
Maximum Number of Seats= 1,147
Current Boundaries
Number of Students 1,146 1,151 1,171 1,191 1,195 16.5% 14.4% 23.4% 39.6% 6.2% 23.7% 7.4%
Percent of Building Occupied 100% 100% 102% 104% 104%
Available Seats 1 -4 -24 -44 -48
Option 1
Number of Students 1,146 1,151 1,171 1,191 1,195 16.5% 14.4% 23.4% 39.6% 6.2% 23.7% 7.4%
Percent of Building Occupied 100% 100% 102% 104% 104%
Available Seats 1 -4 -24 -44 -48
Option 2
Number of Students 1,146 1,151 1,171 1,191 1,195 16.5% 14.4% 23.4% 39.6% 6.2% 23.7% 7.4%
Percent of Building Occupied 100% 100% 102% 104% 104%
Available Seats 1 -4 -24 -44 -48
Option 3
Number of Students 1,146 1,151 1,171 1,191 1,195 16.5% 14.4% 23.4% 39.6% 6.2% 23.7% 7.4%
Percent of Building Occupied 100% 100% 102% 104% 104%
Available Seats 1 -4 -24 -44 -48
Option 4
Number of Students 1,059 1,018 1,027 1,057 1,074 17.9% 15.1% 25.6% 35.3% 6.1% 26.2% 8.3%
Percent of Building Occupied 92% 89% 90% 92% 94%
Available Seats 88 129 120 90 73
Option 5
Number of Students 1,146 1,151 1,171 1,191 1,195 16.5% 14.4% 23.4% 39.6% 6.2% 23.7% 7.4%
Percent of Building Occupied 100% 100% 102% 104% 104%
Available Seats 1 -4 -24 -44 -48
Option 5a
Number of Students 1,146 1,151 1,171 1,191 1,195 16.5% 14.4% 23.4% 39.6% 6.2% 23.7% 7.4%
Percent of Building Occupied 100% 100% 102% 104% 104%
Available Seats 1 -4 -24 -44 -48
Option 6
Number of Students 1,146 1,151 1,171 1,191 1,195 16.5% 14.4% 23.4% 39.6% 6.2% 23.7% 7.4%
Percent of Building Occupied 100% 100% 102% 104% 104%
Available Seats 1 -4 -24 -44 -48
Option 7
Number of Students 1,146 1,151 1,171 1,191 1,195 16.5% 14.4% 23.4% 39.6% 6.2% 23.7% 7.4%
Percent of Building Occupied 100% 100% 102% 104% 104%
Available Seats 1 -4 -24 -44 -48
Lakelands Park MS
2018–19
Projected Number of Students Race/Ethnic Composition
Note: In the 2020–2021 school year, the enrollment projections display reassignments for students in Grades 6 and 7 to other middle schools while
Grade 8 students are grandfathered at their current school assignment. In the 2021–2022 the data displays all Grade 6–8 students reassignments.
43
% Afr. % % % % % %
School 2020–21 2021–22 2022–23 2023–24 2024–25 Amer. Asian Hispanic White 2 or More FARMS ESOL
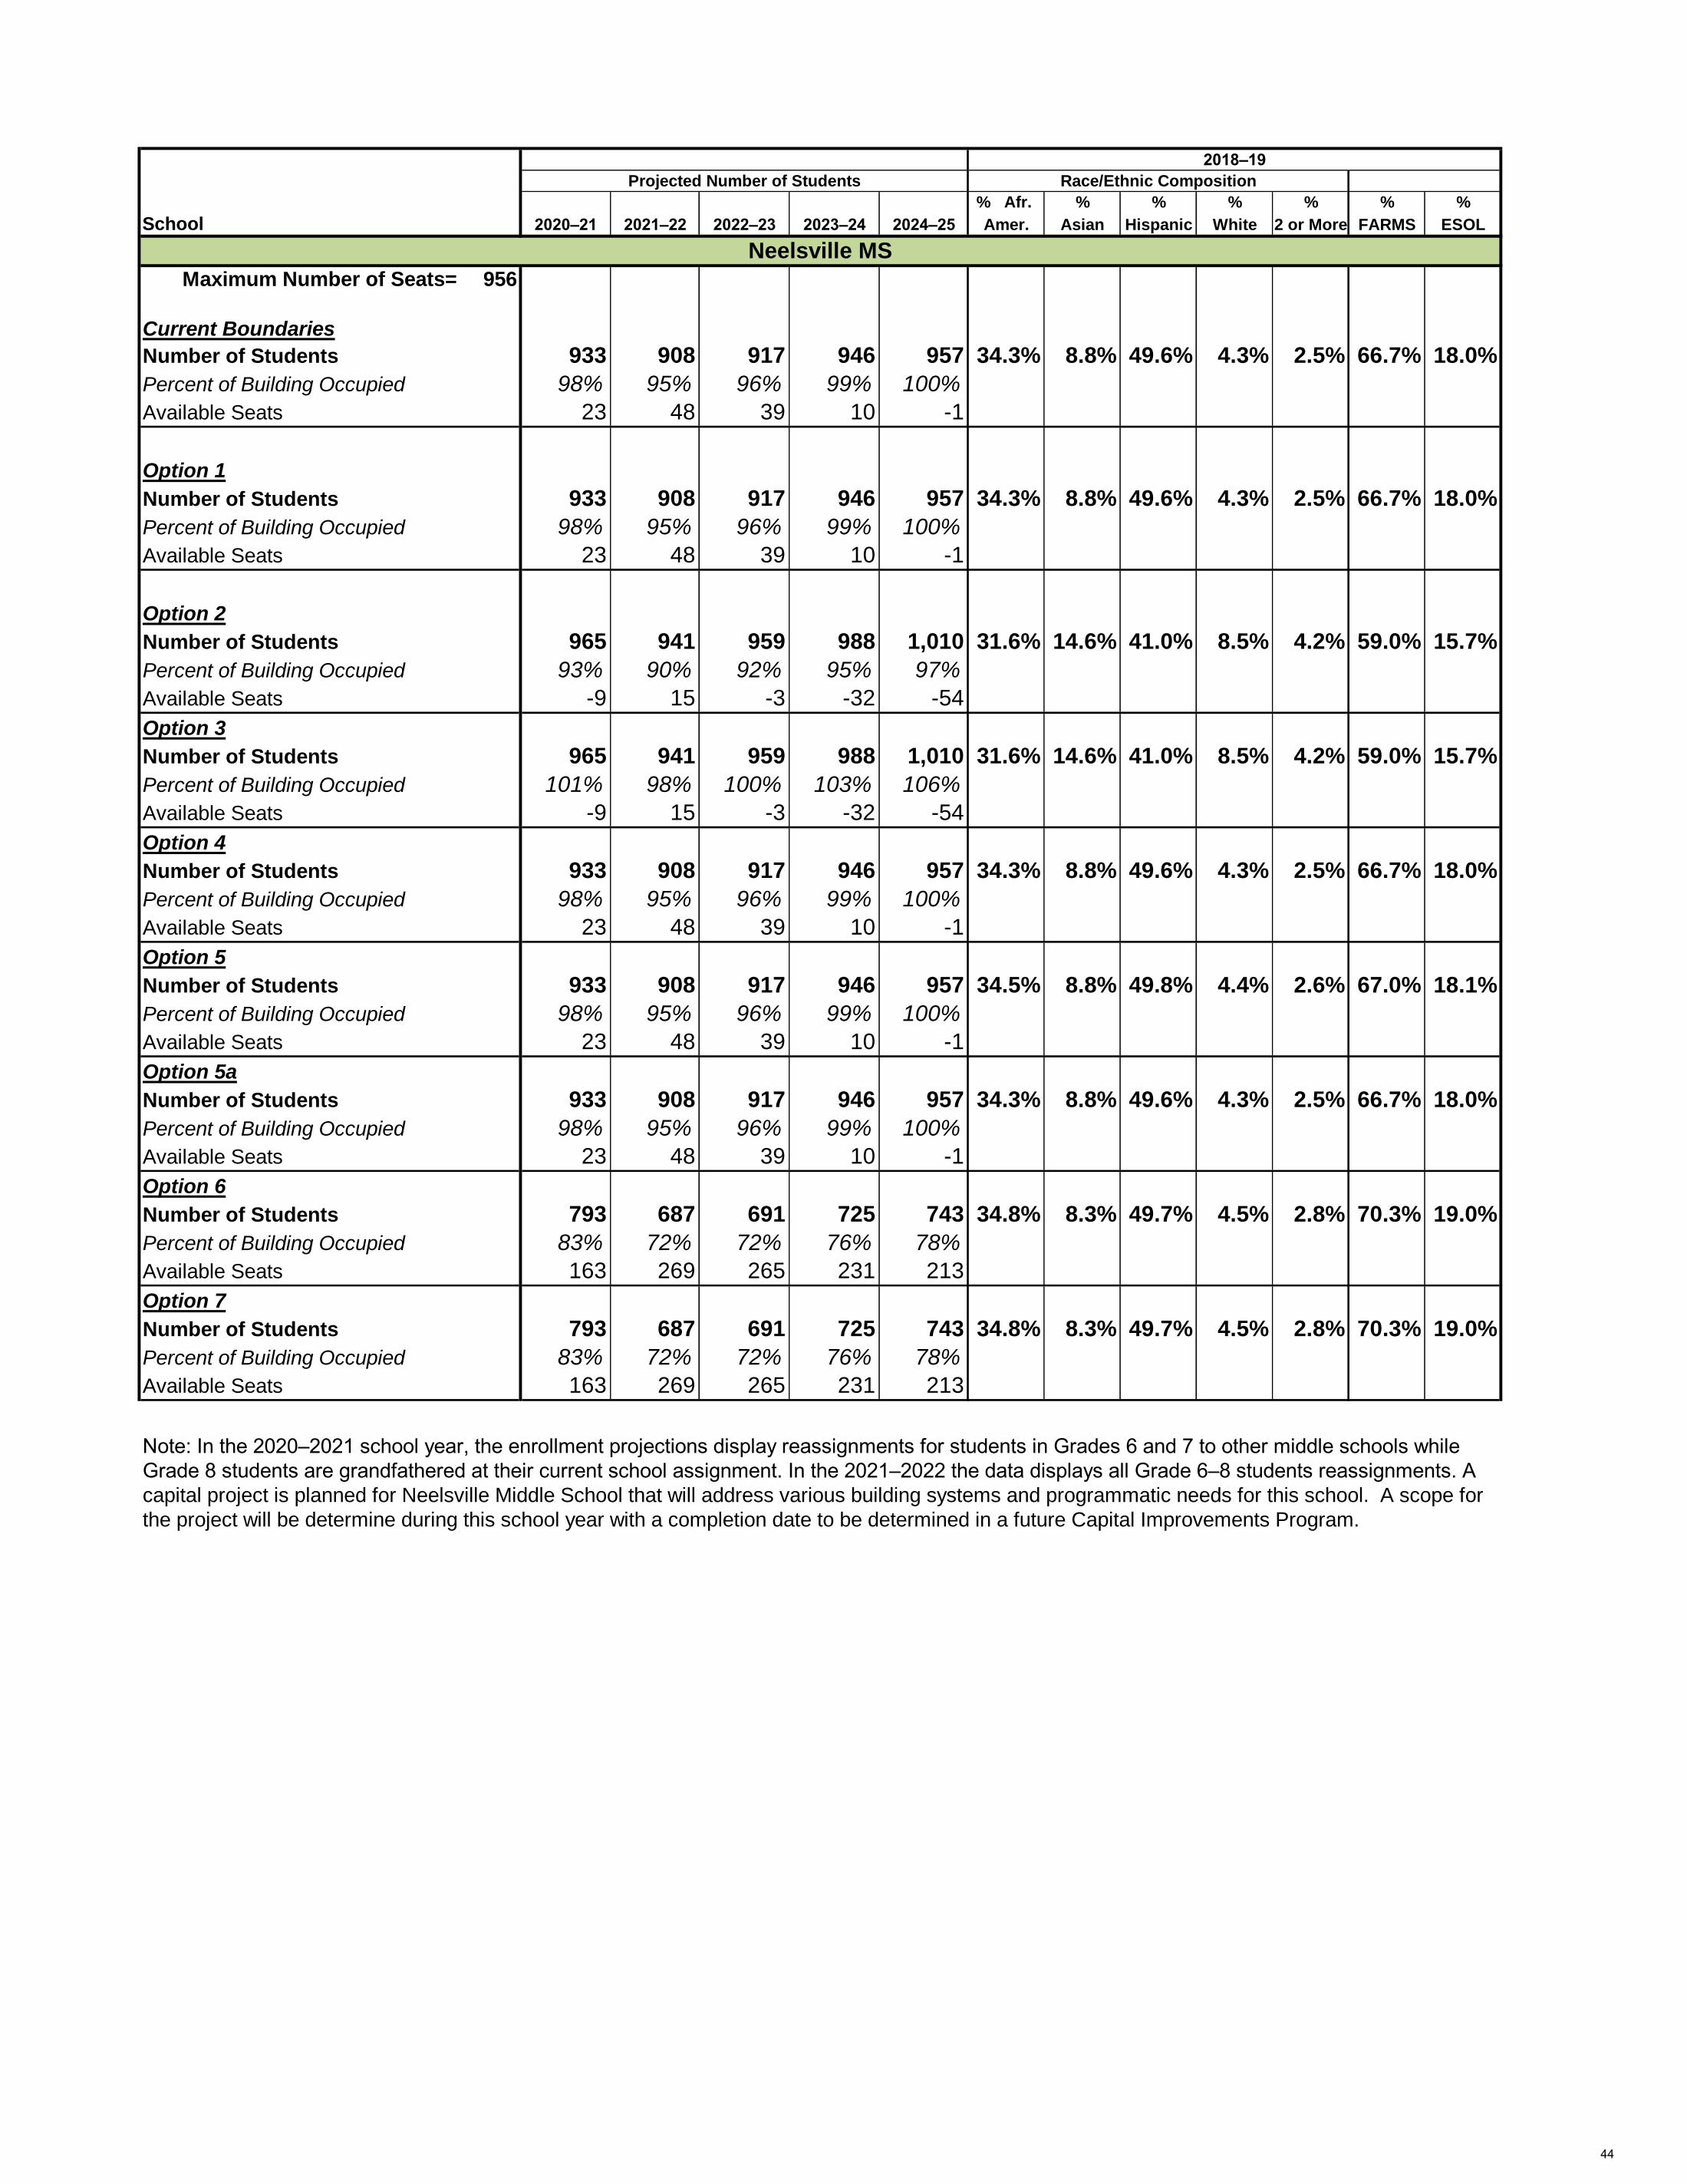
Maximum Number of Seats= 956
Current Boundaries
Number of Students 933 908 917 946 957 34.3% 8.8% 49.6% 4.3% 2.5% 66.7% 18.0%
Percent of Building Occupied 98% 95% 96% 99% 100%
Available Seats 23 48 39 10 -1
Option 1
Number of Students 933 908 917 946 957 34.3% 8.8% 49.6% 4.3% 2.5% 66.7% 18.0%
Percent of Building Occupied 98% 95% 96% 99% 100%
Available Seats 23 48 39 10 -1
Option 2
Number of Students 965 941 959 988 1,010 31.6% 14.6% 41.0% 8.5% 4.2% 59.0% 15.7%
Percent of Building Occupied 93% 90% 92% 95% 97%
Available Seats -9 15 -3 -32 -54
Option 3
Number of Students 965 941 959 988 1,010 31.6% 14.6% 41.0% 8.5% 4.2% 59.0% 15.7%
Percent of Building Occupied 101% 98% 100% 103% 106%
Available Seats -9 15 -3 -32 -54
Option 4
Number of Students 933 908 917 946 957 34.3% 8.8% 49.6% 4.3% 2.5% 66.7% 18.0%
Percent of Building Occupied 98% 95% 96% 99% 100%
Available Seats 23 48 39 10 -1
Option 5
Number of Students 933 908 917 946 957 34.5% 8.8% 49.8% 4.4% 2.6% 67.0% 18.1%
Percent of Building Occupied 98% 95% 96% 99% 100%
Available Seats 23 48 39 10 -1
Option 5a
Number of Students 933 908 917 946 957 34.3% 8.8% 49.6% 4.3% 2.5% 66.7% 18.0%
Percent of Building Occupied 98% 95% 96% 99% 100%
Available Seats 23 48 39 10 -1
Option 6
Number of Students 793 687 691 725 743 34.8% 8.3% 49.7% 4.5% 2.8% 70.3% 19.0%
Percent of Building Occupied 83% 72% 72% 76% 78%
Available Seats 163 269 265 231 213
Option 7
Number of Students 793 687 691 725 743 34.8% 8.3% 49.7% 4.5% 2.8% 70.3% 19.0%
Percent of Building Occupied 83% 72% 72% 76% 78%
Available Seats 163 269 265 231 213
Neelsville MS
2018–19
Note: In the 2020–2021 school year, the enrollment projections display reassignments for students in Grades 6 and 7 to other middle schools while
Grade 8 students are grandfathered at their current school assignment. In the 2021–2022 the data displays all Grade 6–8 students reassignments. A
capital project is planned for Neelsville Middle School that will address various building systems and programmatic needs for this school. A scope for
the project will be determine during this school year with a completion date to be determined in a future Capital Improvements Program.
Projected Number of Students Race/Ethnic Composition
44
% Afr. % % % % % %
School 2020–21 2021–22 2022–23 2023–24 2024–25 Amer. Asian Hispanic White 2 or More FARMS ESOL
Maximum Number of Seats= 1,020
Current Boundaries
Number of Students 799 899 946 998 1,023 24.3% 29.0% 17.9% 21.7% 6.9% 22.5% 4.5%
Percent of Building Occupied 78% 88% 93% 98% 100%
Available Seats 221 121 74 22 -3
Option 1
Number of Students 799 899 946 998 1,023 24.3% 29.0% 17.9% 21.7% 6.9% 22.5% 4.5%
Percent of Building Occupied 78% 88% 93% 98% 100%
Available Seats 221 121 74 22 -3
Option 2
Number of Students 767 866 904 956 970 27.3% 23.0% 27.0% 17.5% 5.1% 30.0% 6.8%
Percent of Building Occupied 74% 83% 87% 92% 93%
Available Seats 253 154 116 64 50
Option 3
Number of Students 767 866 904 956 970 27.3% 23.0% 27.0% 17.5% 5.1% 30.0% 6.8%
Percent of Building Occupied 75% 85% 89% 94% 95%
Available Seats 253 154 116 64 50
Option 4
Number of Students 799 899 946 998 1,023 24.3% 29.0% 17.9% 21.7% 6.9% 22.5% 4.5%
Percent of Building Occupied 78% 88% 93% 98% 100%
Available Seats 221 121 74 22 -3
Option 5
Number of Students 799 899 946 998 1,023 24.3% 29.0% 17.9% 21.7% 6.9% 22.5% 4.5%
Percent of Building Occupied 78% 88% 93% 98% 100%
Available Seats 221 121 74 22 -3
Option 5a
Number of Students 627 645 678 735 756 24.9% 27.9% 17.9% 22.8% 6.4% 19.7% 3.5%
Percent of Building Occupied 61% 63% 66% 72% 74%
Available Seats 393 375 342 285 264
Option 6
Number of Students 799 899 946 998 1,023 24.3% 29.1% 17.9% 21.7% 6.9% 22.6% 4.5%
Percent of Building Occupied 78% 88% 93% 98% 100%
Available Seats 221 121 74 22 -3
Option 7
Number of Students 799 899 946 998 1,023 24.3% 29.0% 17.9% 21.7% 6.9% 22.5% 4.5%
Percent of Building Occupied 78% 88% 93% 98% 100%
Available Seats 221 121 74 22 -3
% Afr. % % % % % %
School 2020–21 2021–22 2022–23 2023–24 2024–25 Amer. Asian Hispanic White 2 or More FARMS ESOL
Maximum Number of Seats= 982
Current Boundaries
Number of Students 848 877 949 1,002 1,032 21.3% 33.7% 13.8% 23.4% 7.7% 16.5% 3.2%
Percent of Building Occupied 86% 89% 97% 102% 105%
Available Seats 134 105 33 -20 -50
Rocky Hill MS
Hallie Wells MS
Note: In the 2020–2021 school year, the enrollment projections display reassignments for students in Grades 6 and 7 students to other middle schools
while Grade 8 students are grandfathered at their current school assignment. In the 2021–2022 the data displays all Grade 6–8 students
reassignments.
2018–19
Projected Number of Students Race/Ethnic Composition
2018–19
Projected Number of Students Race/Ethnic Composition
45