clark glymour carnegie mellon university
TRANSCRIPT

1
Causal Discovery by Computer
Clark Glymour
Carnegie Mellon University
Outline
1. A century of mistakes about causation and discovery:
1. Fisher
2. Yule
3. Spearman/Thurstone
2. Search for causes is statistical estimation
3. Strategies and algorithms
4. Examples
5. Prospects: The Center for Causal Discovery
2
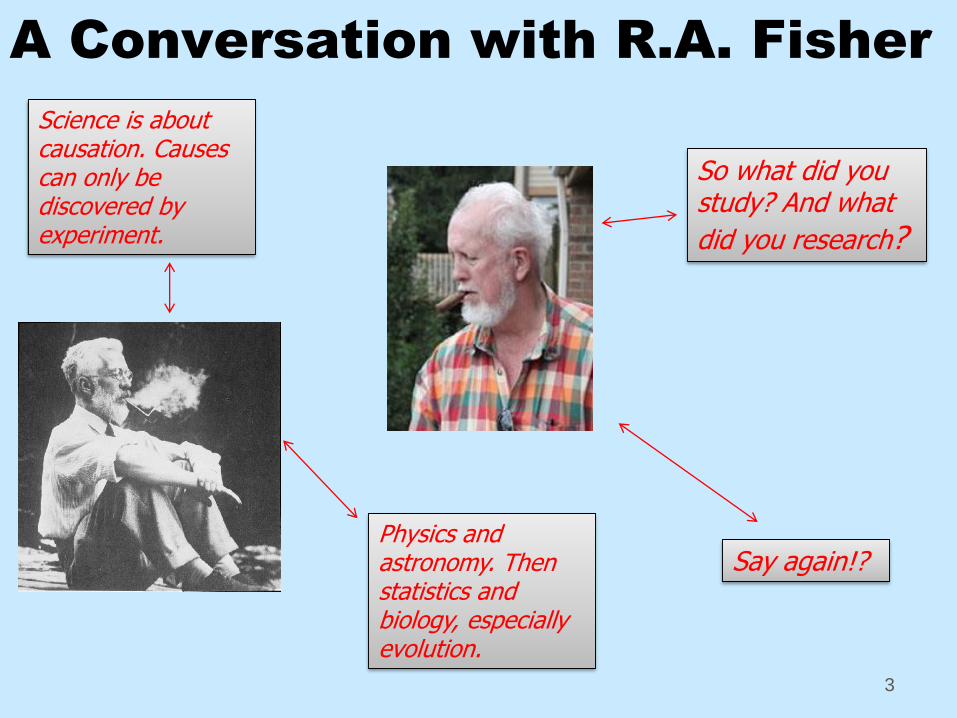
A Conversation with R.A. Fisher
3
Science is about causation. Causes can only be discovered by experiment.
So what did you study? And what
did you research?
Physics and astronomy. Then statistics and biology, especially evolution.
Say again!?

Continued…
4
Very well: Science is about causation. Causes can only be discovered by experiment.
So much then for my discovery of the cause of the motions of the planets, and the cause of the tides.
So much as well for my discovery of the origin of species.
5
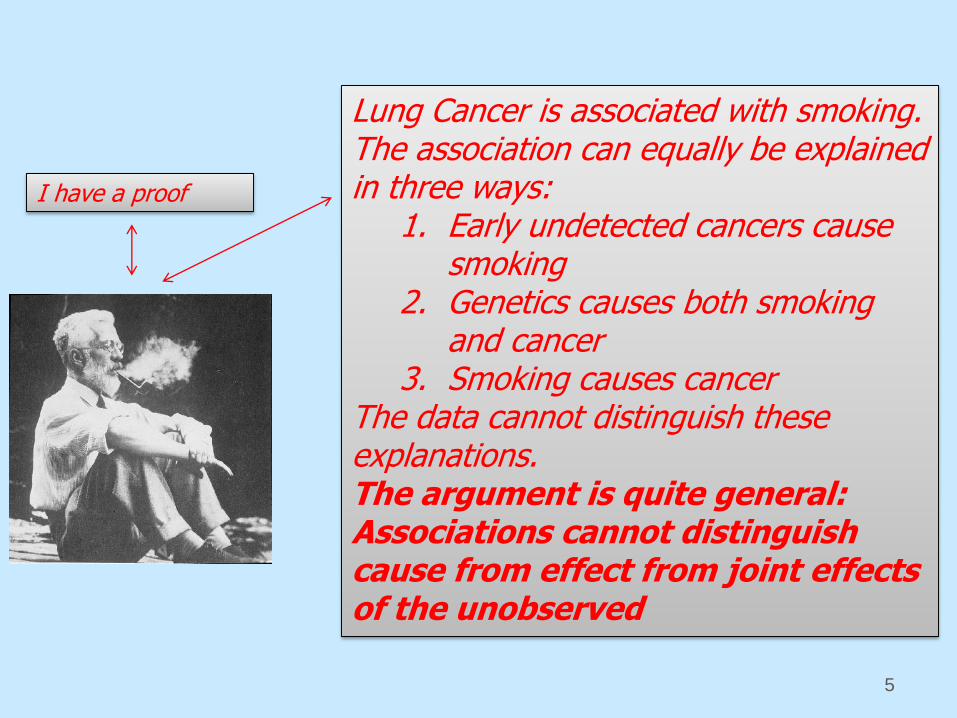
I have a proof
Lung Cancer is associated with smoking.The association can equally be explained in three ways:
1. Early undetected cancers cause smoking
2. Genetics causes both smoking and cancer
3. Smoking causes cancerThe data cannot distinguish these explanations.The argument is quite general: Associations cannot distinguish cause from effect from joint effects of the unobserved

Even Genius Makes Mistakes
Genes
Parents Smoking Cancer Job
Smoking
6
Suppose Data:
• Parents Smoking and Smoking are not associated with Job
• Parents Smoking is not associated with Cancer
• Smoking and Cancer are associated
• Parents Smoking and Smoking are associated
• Job and Cancer are associated
Suppose true:
7
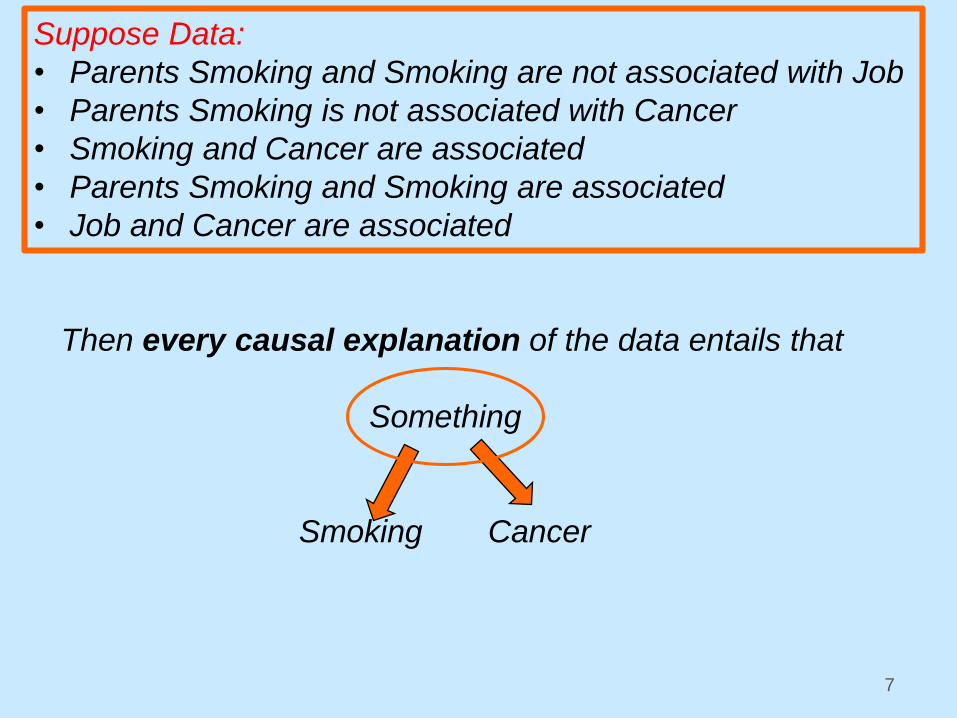
Suppose Data:
• Parents Smoking and Smoking are not associated with Job
• Parents Smoking is not associated with Cancer
• Smoking and Cancer are associated
• Parents Smoking and Smoking are associated
• Job and Cancer are associated
Then every causal explanation of the data entails that
Something
Smoking Cancer

Another example:
Suppose data were to show:
z X and Y are not associated
z Z is associated with X and Y
z X and Y are associated conditional on a value of Z
z X, Y, Z are associated with R
z X, Y are not associated with R conditional on Z
Then Z is a cause of R and there are no confounding common causes of Z and R.
8
XZ R
Y
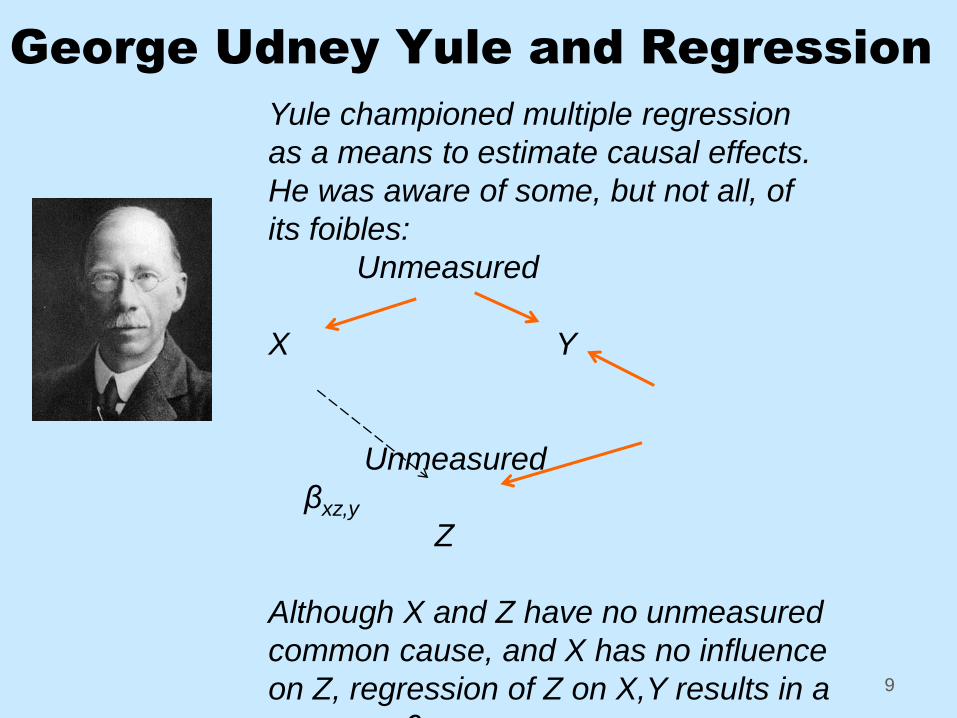
George Udney Yule and Regression
9
Yule championed multiple regression
as a means to estimate causal effects.
He was aware of some, but not all, of
its foibles:
Unmeasured
X Y
Unmeasured
βxz,y
Z
Although X and Z have no unmeasured
common cause, and X has no influence
on Z, regression of Z on X,Y results in a
non-zero β

Spearman, Thurstone and
Factor Analysis
z G
z X1 X2 X3 X4…..
Thurstone’s Equivocation:
“Vectors of Mind” = Linear reduction of correlations
10

Upshot for the 20th
Century
z Causal inferences should not be made from non-experimental data
z But if you must, use regression
z Or factor analysis
z Or “potential outcomes”
Fear of Search
11
Terry Speed: There may be
better search methods than
regression, but only regression
should be used.

~ 1990: Rethinking:
z Relationships between causal hypotheses and probability hypotheses
z Search
12

Search for causal relations is
statistical estimation
Hypothesis Space:
Data: A II C , A II B, B II C, A II C | B
Statistical inference:
A -> B <- C: A B C
A 0 1 0
B 0 0 1
C 0 1 0
A B C
A ? ? ?
B ? ? ?
C ? ? ?
13

What’s the Difference?
In conventional estimation we are estimating a probability distribution—an unobserved distribution covering present and potential future observations.
In causal estimation, we are estimating both a current probability distribution andthe probability distributions that would result from various interventions.
14

Interventions Change
Probabilities
X Y
X Y
X Y
X Y
15
Observed
Force a value on Y;
distribution of X doesn’t
change. Dependence of
Y on X is broken
Force a value on
X; distribution of Y
changes

16
First Goal: To estimate whether there are some values
of other variables C such that some intervention that
changes the distribution of A will change the distribution
of B when C variables are forced to have those values.
Secondary Goals: to estimate the signs or strengths of
effects.
Goals are the same as in Experimental
Design
A B C
A ? ? ?
B ? ? ?
C ? ? ?
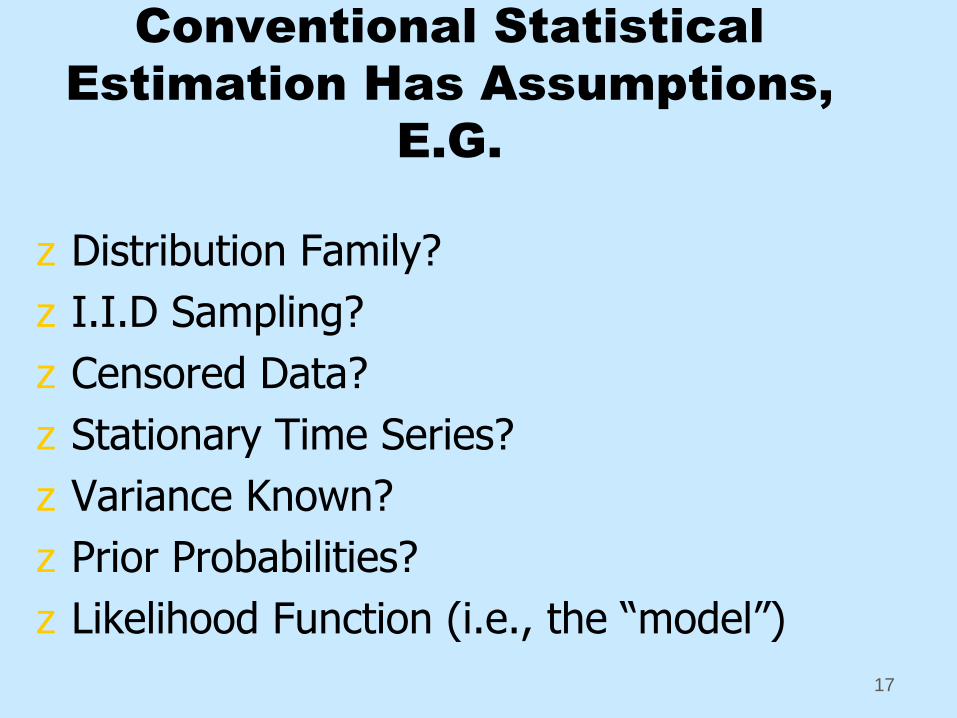
Conventional Statistical
Estimation Has Assumptions,
E.G.
z Distribution Family?
z I.I.D Sampling?
z Censored Data?
z Stationary Time Series?
z Variance Known?
z Prior Probabilities?
z Likelihood Function (i.e., the “model”)
17
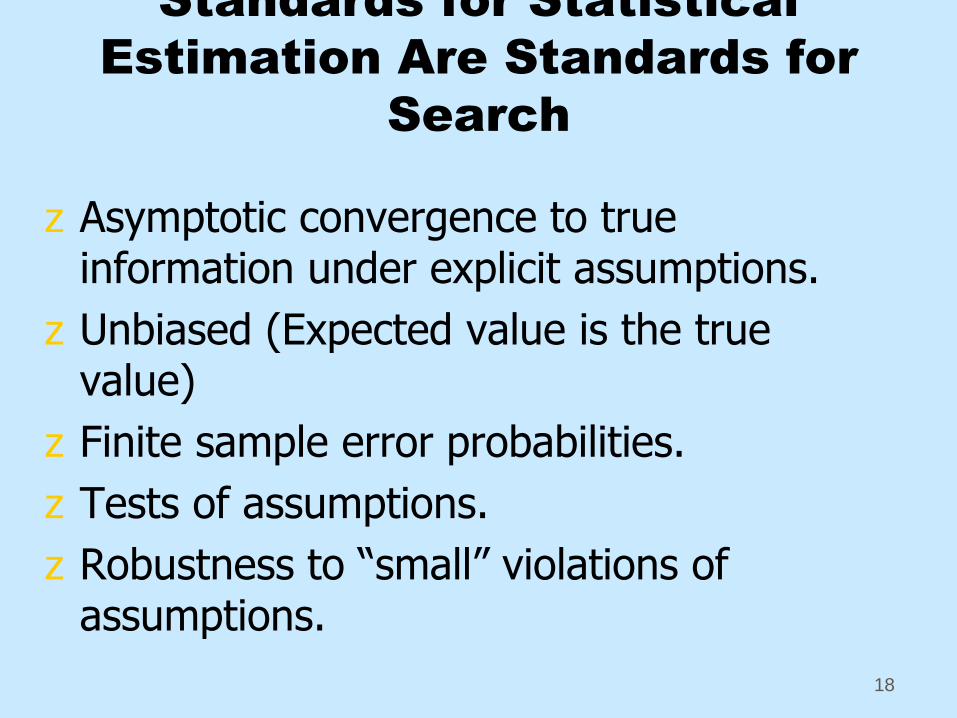
Standards for Statistical
Estimation Are Standards for
Search
z Asymptotic convergence to true information under explicit assumptions.
z Unbiased (Expected value is the true value)
z Finite sample error probabilities.
z Tests of assumptions.
z Robustness to “small” violations of assumptions.
18

Representation
z Represent causal relations on a collection V of variables by directed edges X -> Y
z A directed edge indicates that some intervention on X would change the distribution of Y if all other variables in V(that are not effects of X) were held constant at some values.
19

What Extra Assumptions Are
Needed for Causal Inference?
Answer: Generalizations of principles of experimental design:
Markov Condition
Faithfulness Condition
20
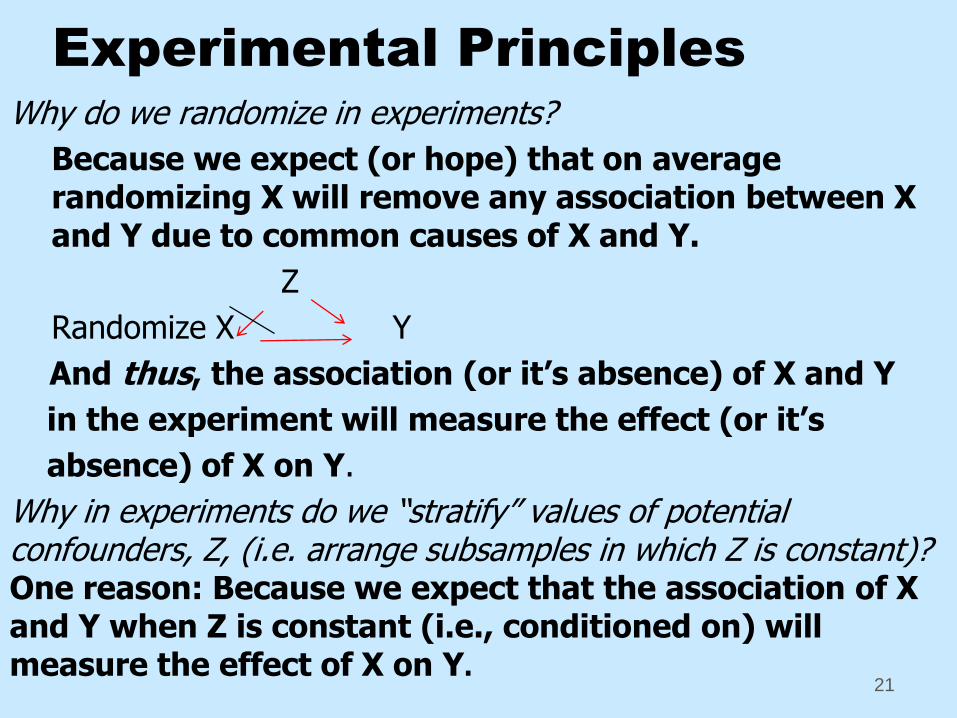
Experimental Principles
Why do we randomize in experiments?
Because we expect (or hope) that on average randomizing X will remove any association between X and Y due to common causes of X and Y.
Z
Randomize X Y
And thus, the association (or it’s absence) of X and Y
in the experiment will measure the effect (or it’s
absence) of X on Y.
Why in experiments do we “stratify” values of potential confounders, Z, (i.e. arrange subsamples in which Z is constant)? One reason: Because we expect that the association of X and Y when Z is constant (i.e., conditioned on) will measure the effect of X on Y.
21
Experimental Principles: Blinding
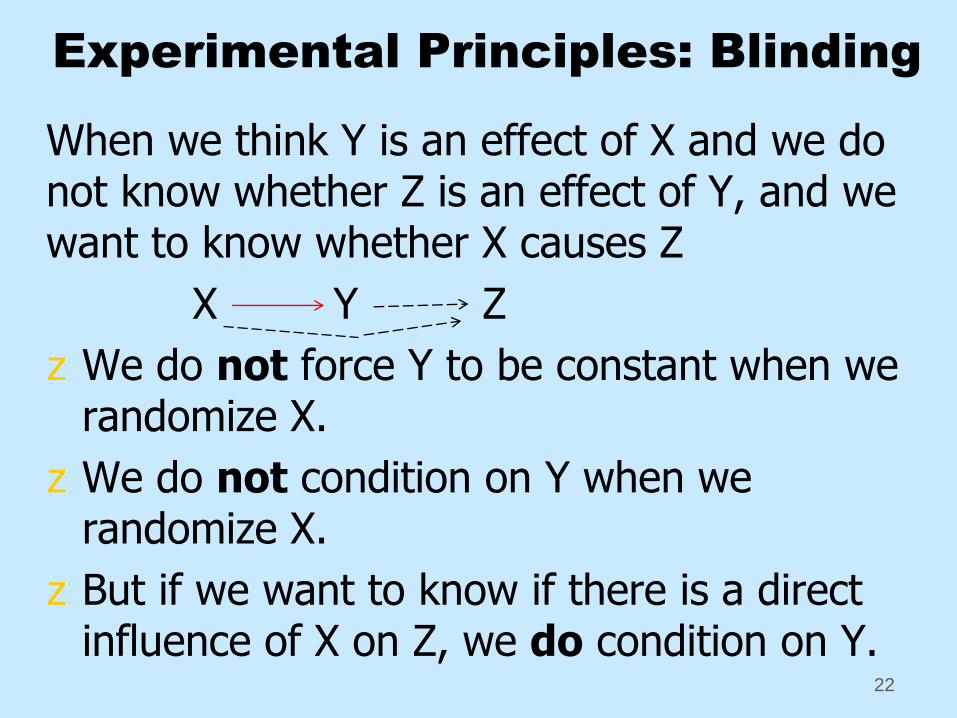
When we think Y is an effect of X and we do not know whether Z is an effect of Y, and we want to know whether X causes Z
X Y Z
z We do not force Y to be constant when we randomize X.
z We do not condition on Y when we randomize X.
z But if we want to know if there is a direct influence of X on Z, we do condition on Y.
22
Generalizations
z Markov: X is independent of all other variables (except for effects of X) conditional on the direct causes of X.
z Faithfulness: All independencies and conditional independencies among variables in a system of variables follow from the Markov condition for the true causal graph of the system.
23

A Flow of Mathematical
Results Since 1990
z Sufficient conditions for recovering causal information:
z Markov
z Acyclic
z Faithfulness
z I.I.D sampling
z No unrecorded common causes
And a host of alternative sufficient conditions.
24

Examples for which There Are
Correct Search Procedures
U1 U2 U3 Linearity of X variables
X 1 X2 X3 X4 X5 X6
X1 X2 Non-Gaussian
X1 X2 X3 Linear
U
X1 X2 X3 X4 X1 X2 X3 X4
U1 U2
O1 O2 O3 O425
The Zen of Search: Don’t Look
(where you don’t need to)
26
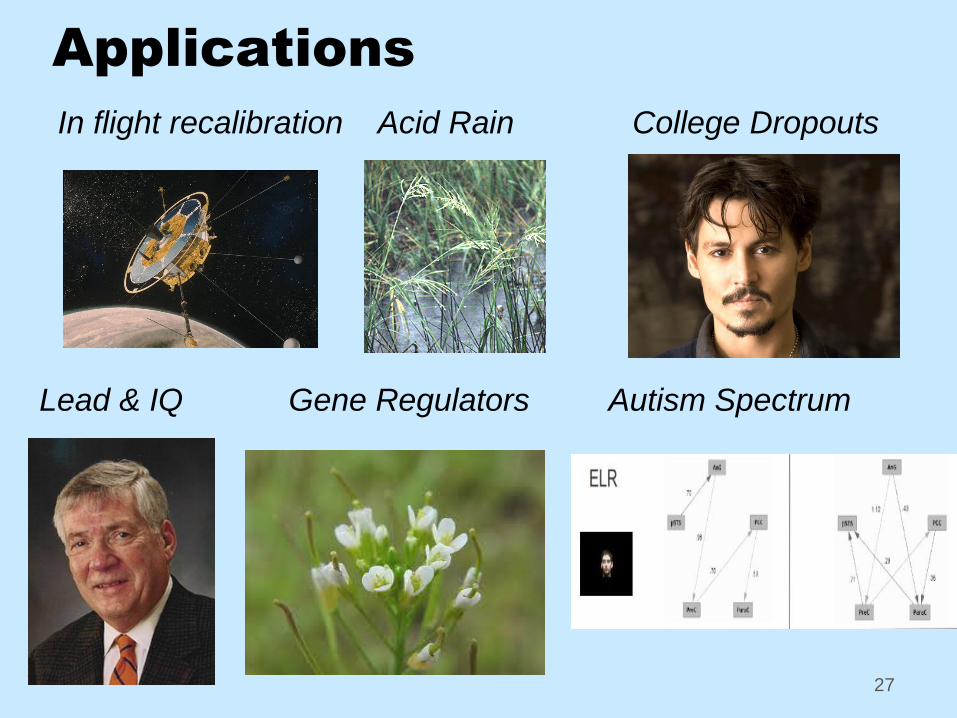
Applications
27
In flight recalibration Acid Rain College Dropouts
Lead & IQ Gene Regulators Autism Spectrum

Center for Causal Discovery
1. New Algorithms
2. Moving from small discovery problems to huge problems
3. Making software easily usable
4. Training
5. Science Applications:
y Cellular pathways in breast cancer
y ………………………..in lung disease
y Brain processing in normals and autistics28

Cancer Signaling and Big Data
z Genomic data y Somatic mutationsy Somatic copy number
alterationsy DNA methylation
z Proteomic datay Quantity of certain
signaling proteins y Chemical modification
(phosphorylation) of proteins
z Transcriptomic datay mRNAy miRNAy lncRNA
Protein (gene)
mutations
Protei
n
quanti
ty
Protei
n
modif
icatio
nRNA
transc
ription

Signaling Pathway and Causal
Network
S1
S2S3
S4 S6
A1
A2A3
A5A4
T2
T5 T6
P2
T4T3
T7
P1T1
S5
Protein (gene)
mutations
Protei
n
quanti
ty
Protei
n
modifi
cationRNA
transc
ription

Identify associations between
clinical features, omics and lung
disease using graphical models
(undirected)
AJ Sedgewick
Gene, 2014
© 2015 Benos lab / Univ of
Pittsburgh
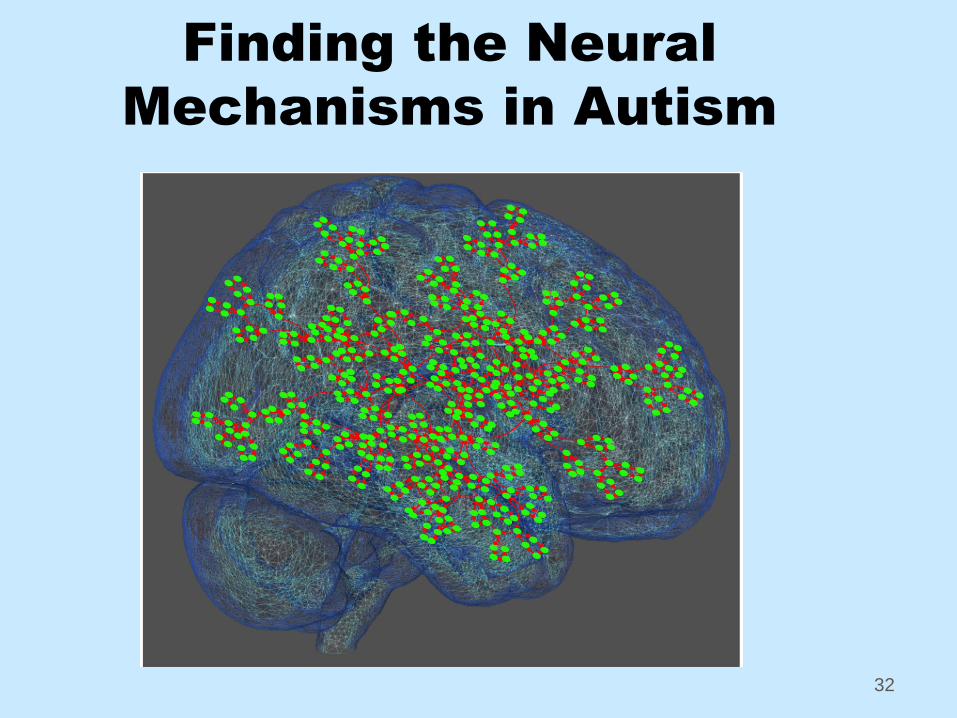
Finding the Neural
Mechanisms in Autism
32

5 Months of Algorithmic
Progress
Size:
.(Thanks PSC)
Variable Types:
Mixed categorical and continuous variables
Model Types
Endogenous latent variables: X -> U -> Y33

MGM-Learn method
z Learn undirected mixed graphical model with both categorical and continuous variables
z By combining existing algorithms in novel ways.
© 2015 Benos lab / Univ of
Pittsburgh
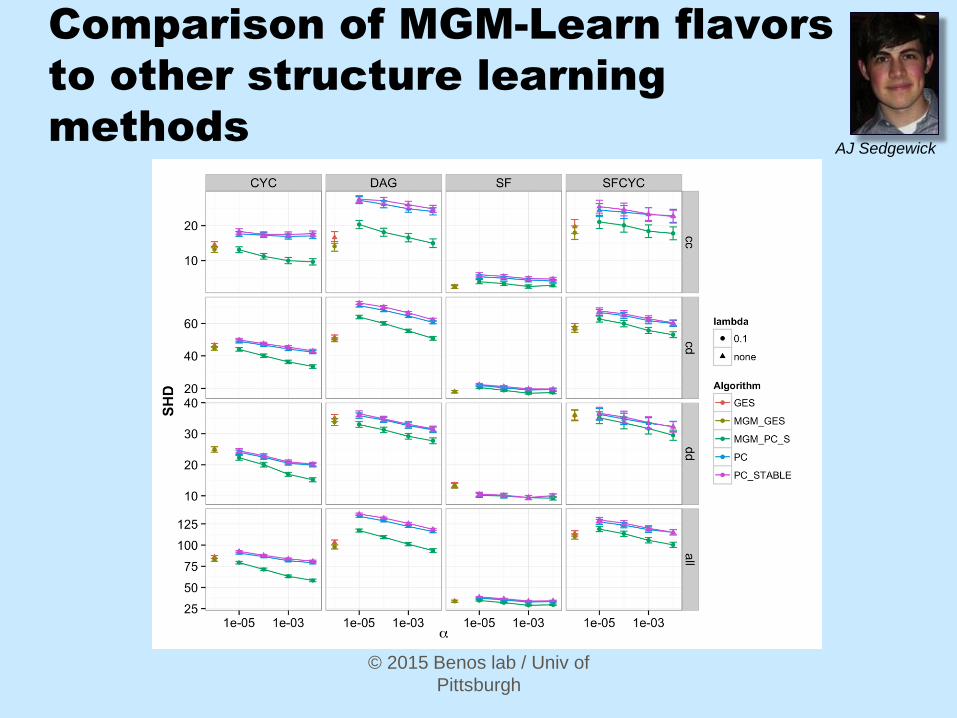
Comparison of MGM-Learn flavors
to other structure learning
methods
© 2015 Benos lab / Univ of
Pittsburgh
AJ Sedgewick

Inferring Unobserved Intermediate
Causes—Between Somatic Gene
Anomalies and mRNA Transcripts
36
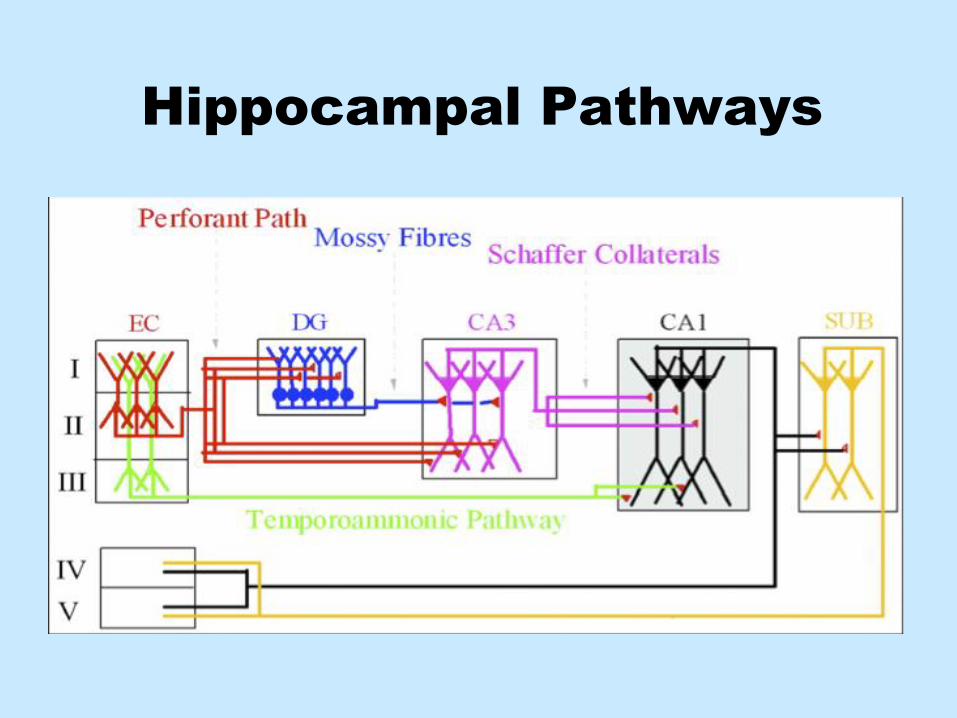
Hippocampal Pathways
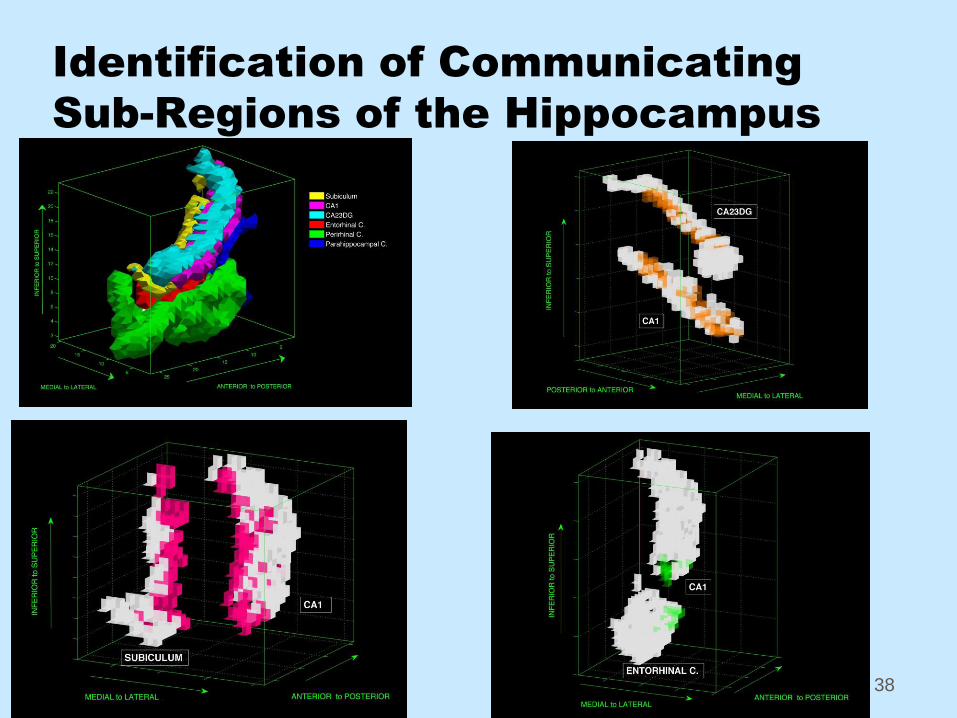
Identification of Communicating
Sub-Regions of the Hippocampus
38

Distinguishing Autistics by
Graphical Search with fMRI
39
Predicted Actual
NT AT
NT .92 .01
AT .08 .99
The Big Task for Big Data
z Showing that we can use big biomedical data to discover novel, important causal relations that can be experimentally confirmed.
40