clark county school district · sylvia lazos professor of law, university of nevada, las vegas ....
TRANSCRIPT

CLARK COUNTY SCHOOL DISTRICT
Final report on
OVERREPRESENTATION BY GENDER, RACE/ETHNICITY, OR DISABILITY IN
DISCIPLINE-RELATED ACTIONS AND/OR SPECIAL EDUCATION PLACEMENT
Produced by the
Superintendent’s Educational Opportunities Advisory Council
For
Dwight D. Jones
Superintendent of Schools Clark County School District
February 5, 2013 Revised: February 20, 2013
Page 1 of 22

The Clark County Board of School Trustees is a dedicated group of community leaders who are elected to overlapping four-year terms and represent a specific geographic region of Clark County. Although each trustee represents a
different region, they are dedicated to ensuring the success of every student in the District through clear, concise direction to the superintendent.
Vision StatementAll students will graduate from high school having the knowledge, skills, attitudes, and values necessary to achieve
academically, prosper economically, and contribute in a diverse global society.
President - Carolyn EdwardsDistrict Fhttp://ccsd.net/trustees/trusteeDetail.php?district=F
Member - Erin E. CranorDistrict G
http://ccsd.net/trustees/trusteeDetail.php?district=G
Member - Dr. Linda E. YoungDistrict C
http://ccsd.net/trustees/trusteeDetail.php?district=C
Clerk - Deanna L. WrightDistrict Ahttp://ccsd.net/trustees/trusteeDetail.php?district=A
Member - Patrice TewDistrict E
http://ccsd.net/trustees/trusteeDetail.php?district=E
Member - Chris GarveyDistrict B
http://ccsd.net/trustees/trusteeDetail.php?district=B
Board of Trustees5100 West Sahara AvenueLas Vegas, NV 89146http://ccsd.net/trustees/
Board of School Trustees
Vice President - Lorraine AldermanDistrict Dhttp://ccsd.net/trustees/trusteeDetail.php?district=D
Page 2 of 22

“Policies which require out‐of‐school suspension or expulsion for certain inappropriate behaviors have become the go‐to disciplinary approach in many schools, but research suggests some downsides.” “Punishments that force students out of school disproportionately affect black, Latino, and male students and those with disabilities.”
Education Week October 13 and November 7, 2012
Page 3 of 22

CONTENTS
I. Preface Page 5
II. Executive Summary Page 6
III. Charge and Success Criteria Page 7 IV. Membership Page 7
V. Terms, Desired Benefits of a Solution, and Frame for the Work Page 8
VI. Key Findings from Research Page 10
VII. Process and Work Streams Page 12 VIII. Month-by-Month Progress Page 14
IX. Data Page 15
X. References Page 20
XI. Recommendations Page 21
Appendix 1: Guiding Principles Page 22
Page 4 of 22

I. PREFACE
Media reports are raising public awareness of the impact of school policies on student engagement. While safety is paramount in every school community, evidence shows that the efforts of urban school districts to educate all students to high levels of achievement are helped or hindered by policies and practices related to code of conduct. Communities across the nation are searching for approaches that promote safety yet ensure schools are stimulating places that provide every student with opportunity and a pathway to success.
In July 2012, Superintendent Dwight D. Jones called upon a group of District stakeholders to consider how changes in District policies and practices concerning discipline and special education placement can improve the prospects of academic success for every student. A group was assembled called the Superintendent’s Educational Opportunities Advisory Council (SEOAC). Its charge was to study the matter and deliver recommendations within six months. The report that follows is a synopsis of results from the work of that SEOAC. This report identifies recommendations and provides insight into the process used to derive them.
A by-product of the SEOAC’s work is the learning that emerged as well-intentioned people came together to address an issue of keen interest and importance. Members learned how much can be accomplished when a community unites to transparently confront an issue that impacts the life chances of many youth. Members learned how much is possible when a team refuses to let individual self-interest impede work. While differences in opinion were encouraged and disagreements arose, SEOAC took the challenges in stride. For instance, faced with data of questionable quality, SEOAC elected not to perseverate and delay its work. Instead, members took to heart the advice of one participant who urged, “We know enough to act.” Granting that it would be helpful if better data were available, SEOAC accepted the data “as is” and shifted gears. SEOAC maintained momentum by asking questions such as “So what?” and “Now what?” This resolve permitted the project to be completed on time.
While this report makes available all the data used for this study (see Section X titled “References”), the report did not list every concern that was expressed during SEOAC meetings. That is to say, some issues were raised but were judged to be beyond the scope of SEOAC’s charge. For example, issues that were raised include underrepresentation by race/ethnicity within gifted and talented programs, how the District will ensure that professional development related to cultural competency is implemented according to plan, and whether quarterly monitoring and public reporting will include results published according to populations protected by federal law, that is, by race/ethnicity, gender, special education, and English language learners.
As well, observations offered by secondary principals in a focus group were passed along but were addressed by SEOAC only in a tangential way. Administrators noted that schools vary widely in how staff members implement discipline policies in the school. These principals further observed that while some latitude is needed (because schools face different kinds of challenges), the wide variation that exists is more than what is necessary. These observations are important, but only appear in a recommendation calling for professional development in cultural competency for new teachers and principals.
SEOAC cochairs, Dr. Robert L. Green and Dr. Andre Denson, extend thanks to the Superintendent for convening the committee and to the Board for its support. The cochairs convey appreciation to staff who supported SEOAC, which includes Gay Johnson in the Academic Services Division and Joyce Pistone in the Office of the Superintendent. These staff members provided invaluable project management support. It also includes two former District teachers, Kristen Cragwall and Rasheed Thompson who are associated with Teach for America, who provide support with special projects to the Special Consultant to the Superintendent. They assisted SEOAC in policy research and analysis. Finally, the cochairs express their thanks to every SEOAC member for their dedication and commitment to this work.
Page 5 of 22

II. EXECUTIVE SUMMARY This describes the proceedings and findings of a Superintendent-appointed committee of 23 individuals that met from August 2, 2012, to January 10, 2013, to address one question.
What changes in District policy, procedure, or structure will mitigate overrepresentation by gender, race/ethnicity, or disability in discipline-related actions and/or special education placement?
Secondary schools were exclusively the focus of study. Recommendations that follow provide general direction and address philosophy, accountability, and training. Ten consensus recommendations follow. 1. Improve Data Quality: Data collection related to suspension and expulsion will be consistent, reliable, standard
(across schools), annually available to the public, and will reflect the intent of SEOAC recommendations.
2. Reduce Overrepresentation: Impose a moratorium on suspensions and expulsions except for the Big 5 offenses, at the Superintendent’s discretion as to terms, with a caveat that student-on-student assault and battery that result in injury now fall under the Big 5 heading.
3. Develop Cultural Competency: Mandatory professional development on cultural competency will be provided for all new teachers and new administrators.
4. Extend Cultural Competency: At every school each year, at least one professional development day will be devoted to cultural competency.
5. Gauge the Benefit of Professional Development: Implement an evaluation procedure to identify the impact of professional development that is intended to promote cultural competency.
6. Refine What We Mean by Cultural Competency: Articulate standards and expectations of professional responsibility related to cultural competency.
7. Provide Early Intervention: Restructure Title I to focus on early interventions with the most at-risk student population.
8. Enhance Early Literacy: Students in Grades K-3 who are not-yet-proficient in literacy will receive appropriate interventions.
9. Provide Better, Earlier, and Different Alternatives to Suspension and Expulsion: During the moratorium period, investigate for possible implementation, various models of tiered-intervention disciplinary systems that include parent notification policies; for example, the Baltimore model.
10. Monitor Progress: Appoint a CCSD administrator who is responsible for monitoring and publicly reporting (at least quarterly) the implementation of these recommendations.
Section XI of this report includes a complete list of recommendations. It includes important clarification for recommendations 2 and 7.
Page 6 of 22

III. DESCRIPTION OF THE CHARGE AND SUCCESS CRITERIA
In July 2012, the Superintendent of Schools in the Clark County School District invited 23 individuals (and three speakers or guests) to convene to address the following charge:
By January 30, 2013, present the Superintendent with recommendations that are designed to mitigate and remedy overrepresentation by gender, race/ethnicity, or disability in discipline-related actions and/or special education placement.
Success Criteria:
- Reflect consensus of the SEOAC. - Conform to requirements of law, contract, and policy. - Delivered on time (by January 30, 2013), under budget, and to specification. - Incorporate actions that are achievable within the existing resources. - Support schools in their efforts to ensure every student is Ready By Exit.
- Achieve the desired effect of eliminating undesirable overrepresentation. - Make sure claims that are made are defensible, valid for their purpose, and based on reliable information. - Provide direction but leave to others responsibility for translating high-level recommendations into practice.
IV. MEMBERSHIP Tami Bass Attorney, United Family Services and Instructor, College of Southern Nevada Richard Boulware Vice President, National Association for the Advancement of Colored People Shawn Boyle CCSD – Principal, Sierra Vista High School Dr. Kay Carl CCSD - Retired Administrator Teresa Cooper Parent Volunteer Dr. Andre Denson CCSD - Associate Superintendent and SEOAC Cochair Reverend Raymond L. Giddens Unity Baptist Church Dr. Robert L. Green Dean and Professor Emeritus, Michigan State University, SEOAC Cochair Frank Hawkins President, National Association for the Advancement of Colored People April Key CCSD – Principal, Cheyenne High School Sylvia Lazos Professor of Law, University of Nevada, Las Vegas Susie Lee Board President, Communities in Schools of Nevada Lavonne Lewis Las Vegas Urban League Lily Lin Parent Volunteer Steve Linder Businessman Jose Melendrez University of Nevada, Las Vegas Leon Pearson State Farm Insurance Dr. Greta Peay CCSD - Equity and Diversity Education Department Lee Quick Southern Nevada Regional Housing Authority Dr. Kenneth Turner CCSD - Superintendent’s Representative - Special Assistant to the Superintendent Brad Waldron CCSD - Assistant Superintendent, Education Services Division Yvette Williams Chair and Founder, Clark County Democratic Black Caucus Kim Wooden CCSD - Chief Student Services Officer, Student Support Services Division
Invited Speakers and Guests Dr. Gwen Marchand University of Nevada, Las Vegas Dr. Tamara White CCSD - Grant Writer, Grants Development and Administration Department Dr. Dan Reschly Vanderbilt University
Page 7 of 22

V. TERMS, DESIRED BENEFITS OF A SOLUTION, AND FRAME FOR THE WORK Terms:
- This work will be referred to simply as “overrepresentation” or “disproportionality” or “rates”.
- The charge to SEOAC includes a reference to “discipline-related actions.” In this context, the term “discipline-related actions” means referrals for expulsions, as well as its precursors (in this case suspensions and referrals to alternative schools).
- “African American” is used throughout this report except in cases where a quotation is drawn from a
publication that relies on another identifier. The identifier “black” is commonly used in official documents provided by the U.S. Department of Education.
- Recommendations 3, 4, and 6 include a reference to “cultural competency.”
o In this context, the term “cultural competency” means the ability to understand, appreciate, and interact with persons from cultures and/or belief systems other than our own. Cultural competency entails knowledge, skills, dispositions, and expressions (such as: what we know, do, believe, and respect) about ourselves, others, and society.
The aim of professional development in cultural competency is to create environments free from bias, prejudice, stereotyping, discrimination, and disenfranchisement.
Cultural competency is demonstrated through thoughts, words, actions, and interactions.
Training in cultural competency equips educators with a framework for making schools more welcoming, engaging, and rewarding for students.
The intended outcome of professional development in cultural competency is mutual respect among all persons; that is, respect for others who differ from us.
o Objectives related to cultural competency include:
Promote community by bridging differences in a way that does not sacrifice identity.
Understand how learning styles, values, and sensitivities vary.
Understand and identify how cultural boundaries impact learning.
Display attitudes and behaviors that reflect the belief that even those who are different can also be right.
o Objectives related to cultural competency and communication include:
Facilitate productive cross-cultural dialogue by knowing when, how, and why to vary language, symbols, and stories.
Interact productively on culturally-sensitive issues in a way that surfaces biases and brings beliefs and practices into better alignment.
Create learning environments where staff members seek valid information, make informed choices, and take responsibility for monitoring their effectiveness and the effectiveness of classrooms, programs, and schools.
o An objective related to cultural competency and curriculum, instruction, and assessment is:
Differentiate content, materials, and conduct in order to optimize learning for students of various backgrounds.
Page 8 of 22

- Recommendation 2 includes a reference to the “Big 5.” In this context, the term Big 5 refers to behaviors that warrant mandatory expulsion due to Federal statute (Federal Guns- Free School Act of 1994), Nevada law (N.R.S. 392.466), or District policy (R-5141.1). These include the following: arson; weapons; drug distribution; battery or assault on a staff member leading to harm; and inappropriate sexual relationship involving students. In addition to these requirements concerning mandatory expulsion, there are related laws and regulations and policies that pertain to mandatory suspensions. While it is the intent of SEOAC to use the Big 5 to reduce the rate of suspension, it is also the intent of SEOAC to ensure that the District remains in compliance with existing laws, regulations, and policies.
- A variety of statistics are typically used to characterize disproportionality. Those terms are described here along with their advantages and limitations.
o A term that has been used in the past to characterize disproportionality is “composition statistic” (or “compositional ratio”). The compositional ratio is 1.0 if a group constitutes 10 percent of the student population at large in a district and the same group also represents 10 percent of the expelled student population in the district. By comparison, the compositional ratio is 2.0 if a group constitutes 10 percent of the student population in the district and the same group represents 20 percent of the expelled population. Care should be taken when this term is used because this approach is no longer endorsed by the National Research Council. It was used by the U.S. Department of Education’s Office for Civil Rights until 2010-2011 when the Office for Civil Rights discontinued its use because a more accurate and descriptive term had emerged in the research literature (see below for discussion of “relative risk”). The National Research Council now discounts “compositional ratio” because “compositional statistics are easily misunderstood and often distorted.” (Reschly , D., Analysis of CCSD Discipline Outcomes by Gender, Race/Ethnicity, and Disability, July 30, 2012, p. 9)
o Despite its limitations, compositional ratio statistics still appear on the Web site for the U.S. Department of Education’s Office for Civil Rights. The information is no longer current because it is based on information schools provided for 2009-2010; nonetheless, it provides an approximate way to compare expulsion rates across and within districts nationally. In the interest of fairness and accuracy, when presenting and interpreting comparisons of compositional ratios, it is vital to declare the limitations of this approach.
o For details, go to http://ccsd.net/internal/documents/items.php?category=Quantitative o Beginning in 2010, use of “compositional ratio” declined and the term “relative risk” gained
prominence. This shift occurred because the term “relative risk” earned the endorsement of the National Research Council Panel on Disproportionality (see Donovan and Cross, Minority and Gifted Students in Special Education, 2002). In the context of the work of SEOAC, the notion of overrepresentation was most appropriately and reliably characterized by the term “relative risk.” Relative risk is computed by dividing the number of behavioral events (in this case expulsion) for a student group by the total population of the same group (call the result x). Then take the sum of the behavioral events for all other groups and divide it by the total population of all other student groups (call the result y). The relative risk is derived by dividing x by y. Relative risk of 1.0 indicates exact proportional representation. Relative risk of 2.0 means that students in a group are overrepresented at a rate that is twice that of students in all other groups (Reschly, D., Analysis of CCSD Discipline Outcomes by Gender, Race/Ethnicity, and Disability, July 30, 2012, p. 9)
- Recommendation 9 includes a reference to “various models of tiered-intervention disciplinary systems that
include parent notification policies; for example, the Baltimore model.” In this context, the term “Baltimore model” refers to a district system of student discipline and adult response that is characterized by the following features.
Page 9 of 22

o It divides staff response to student behavior into four levels. Levels correspond to the seriousness of the student offense, the degree or harm involved, and the impact on a school community. Lower levels (one or two) concern less serious behaviors; higher levels (three or four) concern more serious offenses. Inappropriate student behaviors are classified according to levels. A particular student behavior is assigned a specific level of staff intervention and response. When responding to a specific inappropriate behavior, staff members make note of the level of expected response. Staff members apply a response that is associated with that level (or lower).
o For every level, there is an expectation that parents will receive information and prompt notification of inappropriate or disruptive behaviors by their students. For lower levels, this contact may occur via phone, e-mail, or text.
o For more details, go to http://ccsd.net/internal/documents/items.php?category=Structural Desired Benefits of a Solution:
- Advance accountability for students, staff, schools, and parents. - Enhance the achievement and academic growth at all school sites. - Promote access, equity, efficiency, and quality in educational programming. - Enhance retention (that is, extend ownership of each school for the success and safety of each student). - Increase site-based responsibility as it relates to programming and services for each and every student. - Narrow gaps separating particular student subgroups with respect to academic achievement and growth. - Promote continuous improvement, greater transparency, and public understanding of causes/remedies.
Work Frame:
- The window for examining discipline-related outcomes extends from 2009-2010 (concerning expulsion) and 2011-2012 (concerning suspension and referral to alternative school).
- The window for examining special education representation extends from 2003 to 2012.
VI. KEY FINDINGS FROM RESEARCH Two studies on disproportionality within the Clark County School District were commissioned by the District and conducted by Vanderbilt University. Both culminated in reports that were made available to SEOAC members. One of the studies used data from 2003-2012 to analyze overrepresentation by gender, race, and ethnicity in rates of special education placement. The other study analyzed data from 2009-2010 and 2010-2011 and examined how discipline-related events varied by gender, race/ethnicity, and disability. The findings from these two studies provided SEOAC with the most definitive assessment of District performance in the two areas of focus. Discipline-Related Findings Arising from the Vanderbilt Report: The Vanderbilt study on discipline concluded that, “black students were about 2.7 times more likely than other groups to be excluded (expelled) by action of the school board.” This translates into a relative risk of 2.7. By contrast, with respect to other racial/ethnic groups, the Vanderbilt Report showed that during the same time period, only one other group had a slightly elevated level of expulsion (relative risk of 1.1 for Hispanic students). This means that students in this group are 1.1 times more likely than other groups to be expelled. No other group had a level of relative risk that exceeded this. A relative risk of 1.0 means that there is no evidence of disproportionality (Reschly, D., Analysis of Clark County School District 2009-2010 and 2010-2011 Discipline Outcomes by Gender, Race/Ethnicity, and Disability, July 30, 2012, p. 43) With respect to suspension, within the same time period, the Vanderbilt study concluded that black students were 2.2 more likely than other groups to be suspended. In other words, the relative risk for suspension for black students was 2.2. By contrast, Hispanic students were 1.3 times more likely than other groups to be suspended. Secondarily, the study showed that a more fine-grained look at the data revealed that the likelihood of suspension in response to a
Page 10 of 22
particular student behavior varies by race/ethnicity and by gender. That is to say, different groups are more likely to be suspended for certain behaviors. (Reschly, D., Analysis of Clark County School District 2009-2010 and 2010-2011 Discipline Outcomes by Gender, Race/Ethnicity, and Disability, July 30, 2012, p. 25) Cautionary Note About Discipline-Related Results: To clarify findings from the Reschly report in context, members of the SEOAC considered how other big-city districts compare nationally with respect to expulsion rates for different racial and ethnic groups. When early evidence pointed to an overrepresentation of African American students in the expelled population, attempts were made to gauge the magnitude of the overrepresentation. With this purpose in mind, attention turned to sources of data that would provide the desired comparisons. A national Web site hosted by the U.S. Department of Education’s Office for Civil Rights provided one such source. The site included district-by-district and school-by-school data describing the demographic composition of the student population and also the expelled population. Information appearing on the Web site of the Office for Civil Rights represented both mandatory and discretionary expulsions. The information that was portrayed was used to generate compositional statistics. While statistics on compositional ratios are an outdated approach and been replaced by the more descriptive term of relative risk, compositional ratios were used in a preliminary way by SEOAC to gauge how the Clark County School District compared to districts of similar size and complexity. Analyses indicated that the compositional ratio of the Clark County School District (2.5) exceeded the compositional ratios of Baltimore (1.9), Miami-Dade (1.8), Houston (1.6), Dallas (1.5), Boston (1.4), Los Angeles (1.4), and Philadelphia (1.3). When considering these results, members noted that the data was of questionable validity. In part this was due to questions about how districts count students who are expelled. In spite of this, SEOAC accepted the district-to-district comparisons of compositional ratios, treated the results as “directionally correct,” and found them useful to guide discussion about next steps. Special Education-Related Findings Arising from the Vanderbilt Report: The report from the other Vanderbilt study focused on special education placement rates. The report begins with a description saying that the U.S. Department of Education Office of Special Education Programs has historically avoided setting specific numerical standards for overrepresentation with respect to special education placement rates but instead has traditionally left these decisions for each state to make. The report states that “the question is what level of disproportionality should be identified as potentially problematic. The State of Nevada criterion for special education disproportionality is a relative risk that is greater than 3.0, similar to many other states (Albrecht et al., 2011). The criterion seemed excessively lenient, leading possibly to failure to identify discipline patterns that need further attention and analysis.” Continuing, Reschly reported “The CCSD Division of Student Support Services has applied a relative risk criterion that is greater than 2.0 to identify potential disproportionality that should receive further attention and analysis.” This means that a group has to be two or more times as likely to be in special education as other groups. This has been the approach taken by the District for the last nine years. This standard “is substantially more stringent than the significant disproportionality criterion established by the State of Nevada.” (Reschly, D., Analysis of Clark County School District 2009-2010 and 2010-2011 Discipline Outcomes by Gender, Race/Ethnicity, and Disability, July 30, 2012, p. 2, 6, 9-10) By this standard (2.0), the Reschly report revealed a single occurrence where a student group was overrepresented. “Black students were overrepresented in the disability categories of emotional disturbance.” (Reschly, D., Analysis of Clark County School District Special Education Representation 2003-2012, July 28, 2012, p. 2, 11). The relative risk for black students is 2.7. At the same time, the report showed that while “persistent overrepresentation of black students in the emotional disturbance category occurred in all nine years” it was largely attributable to racial/ethnic imbalances in the overall population of students receiving special education services. Further, largely because the District has a sustained effort underway to implement a strategy (called Response to Instruction or RTI), SEOAC members elected to devote greater attention to mitigating overrepresentation in discipline-related matters.
Page 11 of 22

VII. PROCESS AND WORK STREAMS
At the outset of this work, SEOAC participants were invited to reply to two questions: 1. If you could have what you want with respect to a solution for disproportionality, what would you have? 2. What beliefs should SEOAC consider as a philosophical guide for this work? With respect to question 1, SEOAC responses were compiled and placed in a table with four columns: - Improvements that are within our prerogative - Improvements that are possible only with a change in District policy - Improvements that are possible only with a change in State law - Improvements that are possible only with a change in a collective bargaining agreement
A large majority of SEOAC member responses (total of 50) appeared in the first column (“within our prerogative”). A far smaller number (total of 4) appeared in the second column (“possible only with a change in District policy”). Fewer responses (total of 2) appeared in the third column (“possible only with a change in State law”). A single response appeared in the fourth column (“possible only with a change in a collective bargaining agreement”). This demonstrated to SEOAC membership how work of the committee could proceed relatively – though not Completely – unhindered by laws or contracts. This realization helped SEOAC members think creatively about what was possible in terms of solutions. With respect to question 2, responses that SEOAC members submitted were arranged thematically. These were then translated into a “Statement of Guiding Principles.” That statement appears as an Appendix 1 in this report.
Page 12 of 22

Superintendent’s Educational Opportunities Advisory Council (SEOAC)
WORK STREAMS
Thurs., Aug. 2, 2012
10:00 a.m. – noon
Framing the Work
(Beliefs to Guide
Action)
Thurs., Aug. 30, 2012
10:00 a.m. – noon
Understanding the
Issue (Data and
Information)
Thurs., Sept. 6, 2012
10:00 a.m. – noon
Root Cause
Analysis
Thurs., Oct. 4, 2012
10:00 a.m. – noon
Listing the
Options
Thurs., Nov. 1, 2012
10:00 a.m. – noon
Narrowing the
Possibilities
What is our charge?
What are our
operating
agreements?
How do we reach
agreement?
What are our work
streams?
What do we mean
by terms we use?
What period of time
is our focus?
If we had what we
wanted (re this
issue), what would
we have?
Historically, how have these rates been associated with gender, race, ethnicity, and/or disability? How, why, and to what extent do rates vary in CCSD? What explains why rates vary? How do rates change over time? Which factors that explain the variability in rates are in our control?
What has helped eliminate variability in rates? How do CCSD rates compare to other districts of similar size and complexity that have higher academic performance (Broward, Houston, and Miami-Dade)? Of those factors in our
control that explain the
variability in rates,
which ones hold the
greatest promise as
possible remedies?
What lessons can we
learn from areas of
success?
What is the universe
of possible options
for solutions?
In what areas and to
what extent do
SEOAC members
agree are the most
promising options?
How many and
which of the most
promising options
are related to or
dependent on one
another and how
many and which are
independent of each
other?
If we were to place
the options in a rank
order (from most to
least promising),
what would we find?
When we consider
the top-ranked
option, what are the
implications for
policy, procedure,
and/or practice?
If we could only offer
one structural
recommendation,
what would it be (in
other words, what is
the difference that
makes the biggest
difference)?
Thurs., Dec. 6, 2012
10:00 a.m. – noon
Generating SEOAC
Recommendation
Thurs., Jan. 10, 2013
10:00 a.m. – noon
Preparing to Present SEOAC
Recommendation
After we lock down
the most important
recommendation,
what other
recommendations
can we agree to
offer?
At what point in our
deliberations does
consensus begin to
wane and we need to
agree to wrap up our
work?
Is a meeting needed
on January 10, 2013
to prepare for a
presentation of the
recommendation to
Superintendent Jones
and/or to the Board
of Trustees?
As we check the
pulse of all our
members do we find
that we still have a
consensus around
the most important
elements of our
recommendation?
Do we all still agree
to subordinate our
self-interests so that
we can achieve
something as a team
that no one of us can
achieve alone?
Do we all still agree
to support what we
helped create in this
work?
Page 13 of 22

VIII. MONTH-BY-MONTH PROGRESS Seven SEOAC meetings were held between August 2, 2012, and January 10, 2013. A thumbnail summary follows for each meeting. August 2, 2012 SEOAC members agreed that to deliver on the charge, members must be flexible; that is,
willing to subordinate self-interest so the team can accomplish what no individual can achieve alone. SEOAC members agree that to “mitigate and remedy” overrepresentation means annually reducing overrepresentation.
August 30, 2012 SEOAC agreed with findings from the Vanderbilt studies. African American students
(especially males) are overrepresented in expulsion. To a lesser extent, Hispanic students (especially males) are overrepresented in suspensions. To a lesser degree, African Americans are disproportionately overrepresented in special education placement (related to behavior). SEOAC concluded that with respect to discipline-related matters, precursors of interest include suspensions. Going forward, SEOAC will focus attention chiefly on mitigating and remedying expulsions, suspensions, and referrals to alternative schools among African Americans (especially males).
September 6, 2012 SEOAC identified a preliminary set of the most likely root causes of overrepresentation in discipline-related events. The set included: (a) lack of early intervention; (b) lack of accountability by parties; (c) bias; (d) lack of positive interventions; (e) variability in execution of policy; (f) lack of basic skills; and (g) lack of basics support.
October 4, 2012 Root causes were rank-ordered: (1) bias, (2) lack of administrative awareness of
disproportionality, (3) unacceptably-variable execution of procedures, (4) lack of accountability on everyone’s part, (5) too much discretion, (6) lack of care about conditions contributing to discipline, and (7) lack of cultural competency.
November 1, 2012 SEOAC identified solutions to root causes and then gauged its support for each solution.
Solutions included: (a) address discretion via a moratorium on expulsions for all but the “Big 5” but add student-on-student assault; (b) address bias via summer staff training; and (c) address lack of accountability by measuring teacher discipline referral.
December 6, 2012 SEOAC identified solutions to additional root causes and gauged support for each solution.
Solutions included: (a) address lack of cultural competency for all staff, (b) address early intervention for Grades 4, 5, 7, and 8, and (c) address lack of understanding about conditions that may contribute to discipline-related events.
January 10, 2013 SEOAC finalized 10 recommendations. All members indicated that they agreed to support
each of the 10 recommendations.
Page 14 of 22
IX. DATA This report includes a small subset of all data that SEOAC reviewed. Section X of this report describes the data elements that were reviewed by SEOAC members. Altogether, 90 separate documents were reviewed totaling 918 pages of text. Assembling data that permitted district-to-district and school-to-school comparisons proved to be challenging. Reasons for this include uncertainty about how other districts define, interpret, measure, and report expulsion and uncertainty about the way in which data from our own schools travels from a school to the District to a national Web site such as the one hosted by the U.S. Department of Education’s Office for Civil Rights (OCR). A cautionary note is included. Care should be used when reviewing data in the tables that appear immediately below or when citing or reporting the data or findings in this report. Tables that follow include data on expulsions that was drawn from the Web site of the OCR. Data on expulsion that appear are three years old (from the 2009-2010 academic year) and are no longer being collected by the OCR. Figures that appear for expulsion are summarized in a compositional ratio. For reasons explained earlier in this report (see Section IV on “Terms”), care should be taken when interpreting these findings because “compositional statistics are easily misunderstood and often distorted” (Reschly, D., Analysis of Clark County School District 2009-2010 and 2010-2011 Discipline Outcomes by Gender, Race/Ethnicity, and Disability, July 30, 2012, p. 9). Although the figures are out-of-date, the figures are presented here because they offer roughly comparable information on school-by-school expulsion rates. The information on expulsions that follows in the tables is limited in usefulness because the figures do not depict current conditions and because a more accurate descriptor (relative risk) is now available. Nevertheless, the data proved helpful to SEOAC because they provided a glimpse of district-to-district and school-to-school variability in expulsion rates. In addition to expulsion data, the tables that follow also display school-by-school rates of alternative school referrals and suspensions. The Clark County School District (Education Services Division) is the source of this data. The time period for this data (2011-2012) differs from the time period for the expulsion data (2009-2010). To aid in interpreting the information found in the tables that follow, a single column is found in each of the three panels. The column heading is “Composition Ratio” and provides a way to compare rates between and among schools. It also provides a way to compare expulsion rates to suspension rates and to the rates of referral to alternative schools.
Page 15 of 22

Middle School by Middle School Comparison of
Discipline-Related Activity for CCSD
Data Based on 2009-10 School Year Data Based on 2011-12 School Year Data Based on 2011-12 School Year
MIDDLE SCHOOLS
2009-10 School Year EXPULSIONS 2011-12 School Year ALTERNATIVE SCHOOL REFERRALS 2011-12 School Year SUSPENSIONS
TOTAL ENROLLMENT
TOTAL AA ENROLLMENT
TOTAL EXPULSIONS
TOTAL AA EXPULSIONS
COMPOSITION RATIO
TOTAL ENROLLMENT
TOTAL AA ENROLLMENT
TOTAL REFERRALS
TOTAL AA REFERRALS
COMPOSITION RATIO
TOTAL ENROLLMENT
TOTAL AA ENROLLMENT
TOTAL SUSPENSIONS
TOTAL AA SUSPENSIONS
COMPOSITION RATIO
Bailey 1305 235 5 0 0.0 1,250 206 35 14 2.4 1,250 206
No data is reported here due to the unavailability of the data at time of print.
Becker 1465 230 5 0 0.0 1,406 209 15 3 1.3 1,406 209
Bridger 1305 235 5 0 0.0 1,431 164 47 15 2.8 1,431 164
Brinley 920 190 20 5 1.2 862 158 53 19 2.0 862 158
Brown 900 115 0 0 0.0 849 79 15 5 3.6 849 79
Burkholder 865 70 0 0 0.0 802 48 22 3 2.3 802 48
Cadwallader 1585 209 30 5 1.3 1,511 142 41 9 2.3 1,511 142
Canarelli 1520 205 0 0 0.0 1,766 206 18 3 1.4 1,766 206
Cannon 935 105 10 5 4.5 908 77 24 6 2.9 908 77
Cashman 1360 105 25 5 2.6 1,479 119 30 5 2.1 1,479 119
Cortney 1205 149 10 5 4.0 1,219 134 55 5 0.8 1,219 134
Cram 1580 330 0 0 0.0 1,493 278 35 17 2.6 1,493 278
Escobedo 1185 260 0 0 0.0 1,163 175 13 6 3.1 1,163 175
Faiss 1230 180 15 5 2.3 1,343 163 24 7 2.4 1,343 163
Fertitta 1370 175 0 0 0.0 1,430 173 31 6 1.6 1,430 173
Findlay 1525 485 5 5 3.1 1,493 478 59 32 1.7 1,493 478
Fremont 840 85 5 0 0.0 941 88 45 11 2.6 941 88
Garrett 525 15 5 0 0.0 495 5 9 2 22.0 495 5
Garside 1205 125 5 0 0.0 1,114 106 16 3 2.0 1,114 106
Gibson 905 125 10 0 0.0 1,109 126 17 6 3.1 1,109 126
Greenspun 1400 134 5 0 0.0 1,310 92 10 1 1.4 1,310 92
Guinn 890 105 15 0 0.0 797 77 42 8 2.0 797 77
Harney 1670 256 0 0 0.0 1,815 194 55 12 2.0 1,815 194
Hughes 585 5 0 0 0.0 588 3 2 0 0.0 588 3
Hyde Park 1775 190 0 0 0.0 1,707 150 18 4 2.5 1,707 150
Johnson 1150 175 30 15 3.3 1,190 158 9 5 4.2 1,190 158
Johnston 1395 455 25 15 1.8 1,389 445 66 34 1.6 1,389 445
Keller 1310 130 15 5 3.4 1,192 101 22 4 2.1 1,192 101
Knudson 1365 171 0 0 0.0 1,259 126 25 3 1.2 1,259 126
Lawrence 1415 200 0 0 0.0 1,446 177 19 3 1.3 1,446 177
Leavitt 1535 206 0 0 0.0 1,529 182 41 13 2.7 1,529 182
Lied 1445 280 5 0 0.0 1,342 224 31 10 1.9 1,342 224
Lyon 450 8 0 0 0.0 414 2 6 0 0.0 414 2
Mack 1330 156 5 0 0.0 1,331 138 54 16 2.9 1,331 138
Page 16 of 22

Data Based on 2009-10 School Year Data Based on 2011-12 School Year Data Based on 2011-12 School Year
MIDDLE SCHOOLS
2009-10 School Year EXPULSIONS 2011-12 School Year ALTERNATIVE SCHOOL REFERRALS 2011-12 School Year SUSPENSIONS
TOTAL ENROLLMENT
TOTAL AA ENROLLMENT
TOTAL EXPULSIONS
TOTAL AA EXPULSIONS
COMPOSITION RATIO
TOTAL ENROLLMENT
TOTAL AA ENROLLMENT
TOTAL REFERRALS
TOTAL AA REFERRALS
COMPOSITION RATIO
TOTAL ENROLLMENT
TOTAL AA ENROLLMENT
TOTAL SUSPENSIONS
TOTAL AA SUSPENSIONS
COMPOSITION RATIO
Mannion 1645 81 5 0 0.0 1,783 71 14 1 1.8 1,783 71
Martin 1360 135 5 0 0.0 1,397 91 20 6 4.6 1,397 91
Miller 1,670 110 0 0 0.0 1,726 84 18 3 3.4 1,726 84
Molasky 1,435 276 5 5 5.2 1,396 225 19 7 2.3 1,396 225
Monaco 1,265 130 10 5 4.9 1,215 98 56 14 3.1 1,215 98
O'Callaghan 1,410 120 10 0 0.0 1,458 119 38 7 2.3 1,458 119
Orr 910 190 0 0 0.0 932 158 41 15 2.2 932 158
Robison 1,085 105 0 0 0.0 1,143 65 27 1 0.7 1,143 65
Rogich 1,765 169 10 5 5.2 1,696 144 25 3 1.4 1,696 144
Saville 1,500 240 0 0 0.0 1,540 210 23 5 1.6 1,540 210
Sawyer 1,280 165 5 0 0.0 1,274 174 20 7 2.6 1,274 174
Schofield 1,405 150 0 0 0.0 1,306 111 22 1 0.5 1,306 111
Sedway 1,350 400 5 5 3.4 1,371 355 62 27 1.7 1,371 355
Silvestri 1,535 175 15 0 0.0 1,556 139 19 2 1.2 1,556 139
Smith 970 55 15 0 0.0 893 47 61 4 1.2 893 47
Swainston 1,270 370 0 0 0.0 1,202 335 47 27 2.1 1,202 335
Tarkanian 1,165 144 0 0 0.0 1,310 154 36 8 1.9 1,310 154
Von Tobel 1,075 115 20 5 2.3 1,168 108 49 7 1.5 1,168 108
Webb 1,705 124 0 0 0.0 1,820 102 15 3 3.6 1,820 102
White 1,295 161 0 0 0.0 1,429 163 29 9 2.7 1,429 163
Woodbury 885 85 15 5 3.5 872 66 25 6 3.2 872 66
TOTALS 69,425 9,598 375 100 69,860 8,222 1,670 453 69,860 8,222
NOTE: In every case, data displayed represents the most current information available. The data on expulsion are drawn from the Office for Civil Rights national Web site. By contrast, the data on Alternative School referrals and out-of-school suspensions are drawn from CCSD records. Note that African American is indicated by “AA.”
Page 17 of 22

High School by High School Comparison of
Discipline-Related Activity for CCSD
Data Based on 2009-10 School Year Data Based on 2011-12 School Year Data Based on 2011-12 School Year
HIGH SCHOOLS
2009-10 School Year EXPULSIONS 2011-12 School Year ALTERNATIVE SCHOOL REFERRALS 2011-12 School Year SUSPENSIONS
TOTAL ENROLLMENT
TOTAL AA ENROLLMENT
TOTAL EXPULSIONS
TOTAL AA EXPULSIONS
COMPOSITION RATIO
TOTAL ENROLLMENT
TOTAL AA ENROLLMENT
TOTAL REFERRALS
TOTAL AA REFERRALS
COMPOSITION RATIO
TOTAL ENROLLMENT
TOTAL AA ENROLLMENT
TOTAL SUSPENSIONS
TOTAL AA SUSPENSIONS
COMPOSITION RATIO
Arbor View
2685 456 10 0 NA 2,691 379 66 26 2.8 2,691 379 538 145 1.9
Basic 2535 375 25 10 2.7 2,389 274 66 16 2.1 2,389 274 109 25 2.0
Bonanza 2235 246 0 0 NA 1,987 200 75 22 2.9 1,987 200 139 33 2.4
Boulder City
665 100 0 0 NA 664 10 11 0 NA 664 10 61 3 3.3
Canyon Springs
2575 966 60 45 2.0 2,601 805 171 88 1.7 2,601 805 116 64 1.8
Centennial 2925 450 5 5 6.5 2,996 415 74 25 2.4 2,996 415 21 8 2.8
Chaparral 2565 400 0 0 NA 2,301 278 56 13 1.9 2,301 278 738 114 1.3
Cheyenne 2380 835 0 0 NA 2,188 691 81 47 1.8 2,188 691 255 137 1.7
Cimarron-Memorial
2705 576 15 5 1.6 2,525 475 102 31 1.6 2,525 475 326 77 1.3
Clark 2610 266 0 0 NA 2,886 255 66 18 3.1 2,886 255 7 0 NA
Coronado 3005 189 10 5 7.9 3,047 150 54 11 4.1 3,047 150 119 11 1.9
Del Sol 2255 280 25 10 3.2 1,994 197 77 8 1.1 1,994 197 347 56 1.6
Desert Oasis
1930 280 40 10 1.7 2,056 283 53 11 1.5 2,056 283 15 7 3.4
Desert Pines
2525 311 5 0 NA 2,231 206 129 17 1.4 2,231 206 814 85 1.1
Durango 2525 341 20 5 1.9 2,208 246 63 8 1.1 2,208 246 258 42 1.5
Eldorado 1815 240 20 5 1.9 1,697 189 67 17 2.3 1,697 189 144 27 1.7
Foothill 2580 191 20 0 NA 2,639 125 63 16 5.4 2,639 125 291 25 1.8
Green Valley
2865 235 0 0 NA 2,809 164 44 5 2.0 2,809 164 73 11 2.6
Indian Springs
80 5 0 0 NA 85 1 9 0 NA 85 1 12 0 NA
Las Vegas 3075 400 15 10 5.1 2,865 249 72 13 2.1 2,865 249 239 34 1.6
Laughlin 405 30 0 0 0.0 424 20 4 0 NA 424 20 92 1 0.2
Legacy 2765 874 100 70 2.2 2,902 904 82 48 1.9 2,902 904 231 146 2.0
Liberty 1970 266 20 5 1.9 2,153 202 67 18 2.9 2,153 202 275 30 1.2
Moapa Valley
590 5 0 0 NA 551 1 5 0 NA 551 1 71 0 NA
Mojave 2180 700 30 20 2.1 2,055 637 130 65 1.6 2,055 637 432 235 1.8
Palo Verde
3055 379 20 5 2.0 2,718 258 57 15 2.8 2,718 258 81 25 3.3
Page 18 of 22

Data Based on 2009-10 School Year Data Based on 2011-12 School Year Data Based on 2011-12 School Year
HIGH SCHOOLS
2009-10 School Year EXPULSIONS 2011-12 School Year ALTERNATIVE SCHOOL REFERRALS 2011-12 School Year SUSPENSIONS
TOTAL ENROLLMENT
TOTAL AA ENROLLMENT
TOTAL EXPULSIONS
TOTAL AA EXPULSIONS
COMPOSITION RATIO
TOTAL ENROLLMENT
TOTAL AA ENROLLMENT
TOTAL REFERRALS
TOTAL AA REFERRALS
COMPOSITION RATIO
TOTAL ENROLLMENT
TOTAL AA ENROLLMENT
TOTAL SUSPENSIONS
TOTAL AA SUSPENSIONS
COMPOSITION RATIO
Rancho 3220 345 15 5 3.1 2,944 291 68 14 2.1 2,944 291 70 9 1.3
Shadow Ridge
2295 395 65 25 2.2 2,286 324 60 18 2.1 2,286 324 152 59 2.7
Sierra Vista
2225 320 70 20 2.0 2,115 305 85 22 1.8 2,115 305 62 21 2.3
Silverado 2495 240 15 0 NA 2,328 165 90 15 2.4 2,328 165 447 76 2.4
Spring Valley
2410 340 30 10 2.4 2,127 273 112 29 2.0 2,127 273 282 75 2.1
Sunrise Mountain
1805 294 30 10 2.0 2,494 349 47 7 1.1 2,494 349 441 80 1.3
Valley 2825 390 15 5 2.4 2,897 403 127 40 2.3 2,897 403 517 172 2.4
Virgin Valley
740 10 0 0 NA 651 3 10 0 NA 651 3 30 0 NA
Western 2395 455 25 15 3.2 2,144 353 129 54 2.5 2,144 353 189 65 2.1
TOTALS 77,910 12,183 705 300 75,648 10,080 2,472 737 75,648 10,080 7,994 1,898
NOTE: In every case, data displayed represents the most current information available. The data on expulsion are drawn from the Office for Civil Rights national Web site. By contrast, the data on Alternative School referrals and out-of-school suspensions are drawn from CCSD records. Note that African American is indicated by “AA.”
Page 19 of 22

X. REFERENCES
SEOAC took advantage of a District Web site where all source documents for this project were stored. To view any of the documents SEOAC used for its work, go to the following Web address. The address is: http://ccsd.net/internal/documents
Page 20 of 22

XI. CONSENSUS RECOMMENDATIONS
Recommendations appear sequentially in the order they were approved by SEOAC members. They are not arranged thematically, nor are they necessarily arranged by importance. Recommendations that appear enjoy the endorsement of all SEOAC members. All members agreed that they “could live with and support the recommendations.”
1. IMPROVE DATA QUALITY: Data collection related to suspension and expulsion will be consistent, reliable, standard (across schools), annually available to the public, and will reflect the intent of SEOAC recommendations.
2. REDUCE OVERREPRESENTATION: Impose a moratorium on suspensions and expulsions except for the
“Big 5” offenses, at the Superintendent’s discretion as to terms, with a caveat that student-on-student assault and battery that results in injury now fall under the “Big 5” heading. Note: The word “terms” refers to how swiftly the moratorium is implemented. That is, will it be
immediately imposed or will it be phased in, and if so, over what period of time? Phase-in will ensure the District complies with relevant discipline-related laws, regulations, and policies.
3. DEVELOP CULTURAL COMPETENCY: Mandatory professional development on cultural competency will be
provided for all new teachers and administrators.
4. EXTEND CULTURAL COMPETENCY: At every school each year, at least one professional development day will be devoted to cultural competency.
5. GAUGE THE BENEFIT OF PROFESSIONAL DEVELOPMENT: Implement an evaluation procedure to identify
the impact of professional development that is intended to promote cultural competency.
6. REFINE WHAT WE MEAN BY CULTURAL COMPETENCY: Articulate standards and expectations of professional responsibility related to cultural competency.
7. PROVIDE EARLY INTERVENTION: Restructure Title I to focus on early interventions with the most at-risk
student population. Note: The term “early intervention” could refer to early in a school year or in any grade and not just the
early grades. It is also plausible that the term “early intervention” could refer to the introduction or development of an early warning system; such a system would identify behaviors that research shows could lead to suspensions, expulsions, and/or behavioral school placement, if not corrected.
8. ENHANCE EARLY LITERACY: Students in Grades K-3 who are not-yet-proficient in literacy will receive
appropriate interventions. 9. PROVIDE BETTER, EARLIER, AND DIFFERENT ALTERNATIVES TO SUSPENSION AND EXPULSION: During the
moratorium period, investigate for possible implementation various models of tiered-intervention disciplinary systems that include parent notification policies; for example, the Baltimore model.
10. MONITOR PROGRESS: Appoint a CCSD administrator who is responsible for monitoring and publicly
reporting (at least quarterly) the implementation of these recommendations.
Page 21 of 22
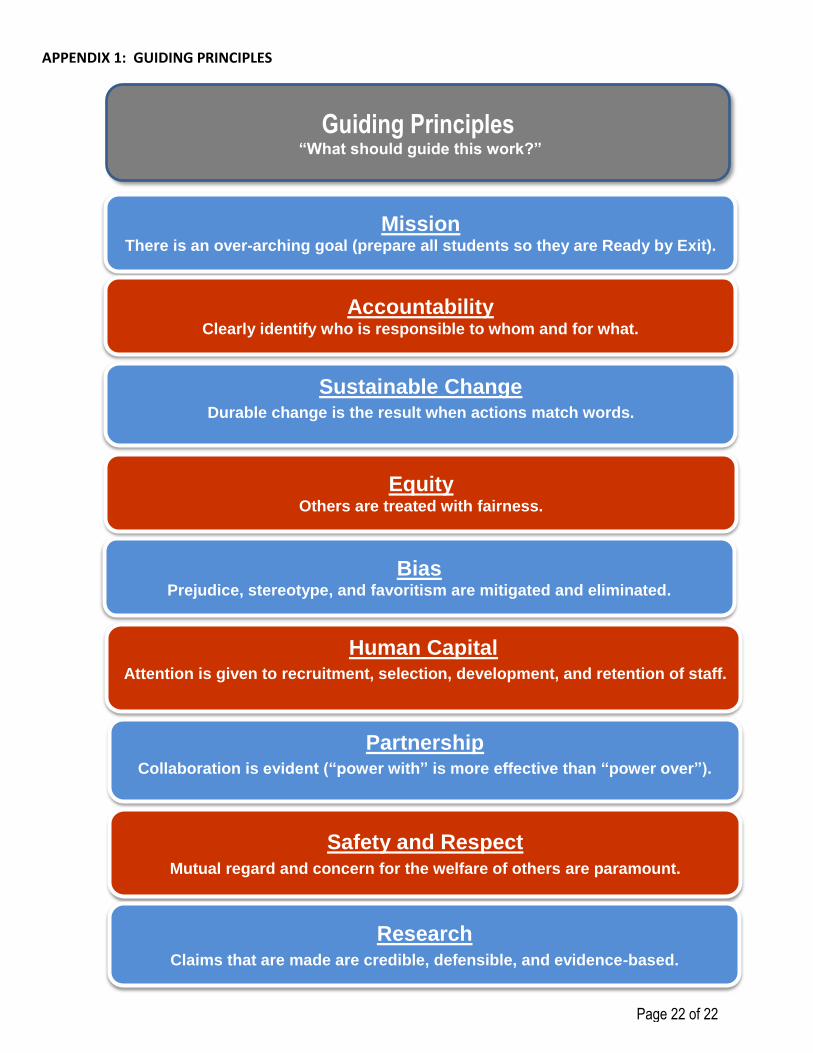
APPENDIX 1: GUIDING PRINCIPLES
Guiding Principles “What should guide this work?”
Mission There is an over-arching goal (prepare all students so they are Ready by Exit).
Accountability Clearly identify who is responsible to whom and for what.
Bias Prejudice, stereotype, and favoritism are mitigated and eliminated.
Sustainable Change
Durable change is the result when actions match words.
Human Capital
Attention is given to recruitment, selection, development, and retention of staff.
Partnership
Collaboration is evident (“power with” is more effective than “power over”).
Equity Others are treated with fairness.
Safety and Respect
Mutual regard and concern for the welfare of others are paramount.
Research
Claims that are made are credible, defensible, and evidence-based.
Page 22 of 22