clarifications on the proposed eedi correction factor for differences
TRANSCRIPT

Clarifications on the proposed EEDI correction factor for differences in
operational profile for General cargo ships as outlined in MEPC 64/4/18
and MEPC 64/INF.9
Place and date: Groningen, 6 February 2013
MARIN Michiel Verhulst MSc.
Conoship International B.V. Jan Jaap Nieuwenhuis MSc.
Wieger Duursema B.MO

I
Contents
1 Introduction ....................................................................................................................................... 1
2 Consequence of not adopting a correction factor for higher minimum operational speed .............. 3
3 Inclusion of speed in correction factor vs. principles of EEDI .......................................................... 9
3.1 High speed to power exponents ........................................................................................ 9
3.2 Slope of the Attained EEDI curve .................................................................................... 11
3.2.1 Analysis of the Attained EEDI curves .............................................................................. 12
3.2.2 Analysis of cause of the reduced slope for Attained EEDI .............................................. 14
3.2.3 Consequences of reduced slope for Attained EEDI ........................................................ 16
3.3 Limiting the maximum value of Fnvol .............................................................................. 20
4 Boundary effect .............................................................................................................................. 22
4.1 Correction factor for General Cargo Ships >20.000 DWT ............................................... 22
4.2 Preventing paragraph ships ............................................................................................. 24
5 Conclusion and discussion ............................................................................................................. 27
Appendix 1 Required, Attained and Corrected Attained EEDI of Ship 5 and 7 ......................... 29
Appendix 2 Required, Attained and Corrected Attained EEDI of Ship 8 and 11 ....................... 30
Appendix 3 Required, Attained and Corrected Attained EEDI of Ship 12 and 13 ..................... 31
Appendix 4 Required, Attained and Corrected Attained EEDI of Ship 14 and 15 ..................... 32
Appendix 5 Required, Attained and Corrected Attained EEDI of Ship 16 and 17 ..................... 33
Appendix 6 Required, Attained and Corrected Attained EEDI of Ship 18 and 19 ..................... 34
Appendix 7 Required, Attained and Corrected Attained EEDI of Ship 20 and 21 ..................... 35
Appendix 8 Required, Attained and Corrected Attained EEDI of Ship 23 and 24 ..................... 36
Appendix 9 Required, Attained and Corrected Attained EEDI of Ship 25 and 26 ..................... 37
Appendix 10 Required, Attained and Corrected Attained EEDI of Ship 27 and 28 ................. 38
Appendix 11 Required, Attained and Corrected Attained EEDI of Ship 29 and 30 ................. 39
Appendix 12 Required, Attained and Corrected Attained EEDI of Ship 31 and 32 ................. 40
Appendix 13 Required, Attained and Corrected Attained EEDI of Ship 34 and 36 ................. 41
Appendix 14 Required, Attained and Corrected Attained EEDI of Ship 37 and 38 ................. 42
Appendix 15 Required, Attained and Corrected Attained EEDI of Ship 40 and 42 ................. 43
Appendix 16 Required, Attained and Corrected Attained EEDI of Ship 44 and 47 ................. 44
Appendix 17 Required, Attained and Corrected Attained EEDI of Ship 49 and 51 ................. 45
Appendix 18 Required, Attained and Corrected Attained EEDI of Ship 53 ............................. 46
II
Executive summary
During the 64th session of the Marine Environment Protection Committee, three correction factors
were proposed to improve the inclusion of small General cargo ships into the EEDI regulatory
framework. The Working Group on Air Pollution and Energy Efficiency in principle supported the
proposal, and agreed to continue the measures for General cargo ships with a view to finalize it at the
next session. However, a small number of delegations had some remarks concerning the proposed
correction factors. The following remarks were made by the delegations:
12.23 "Denmark reiterated its view that a correction factor including the speed should not be
accepted as stated under the discussions on the ro-ro ships".
12.24 "A concern was expressed that the application of the proposed correction factors in terms of
ship size could possibly lead to similar sized ships at the upper end of the range considered
with and without correction factors".
The aim of this research project is to examine whether the remarks are justified. To further analyse the
effect of the proposed correction factor, the influence of the correction factor for a higher minimum
operational speed was determined for over 30 ships over a range of speeds. The resulting plots have
been analysed in detail. Therefore it was analysed whether:
- the correction factor might enable the possibility of designs with very high speed to power
exponents;
- the correction factor for some designs, may result in a nearly constant EEDI across a limited
speed range, whereas actual CO2 emissions do increase when the speed is increased;
- it, in rare cases, the correction factor may lead to EEDI values that increase when the speed is
reduced.
Previous reports have shown that there is a clear need for these vessels to sail at high operational
speeds. This analysis shows that the use of the speed in the correction factor is not in contradiction
with the principles and objectives of the EEDI. Only highly optimized ships receive a correction which
is sufficient to meet the EEDI requirements. Optimization thus remains necessary.
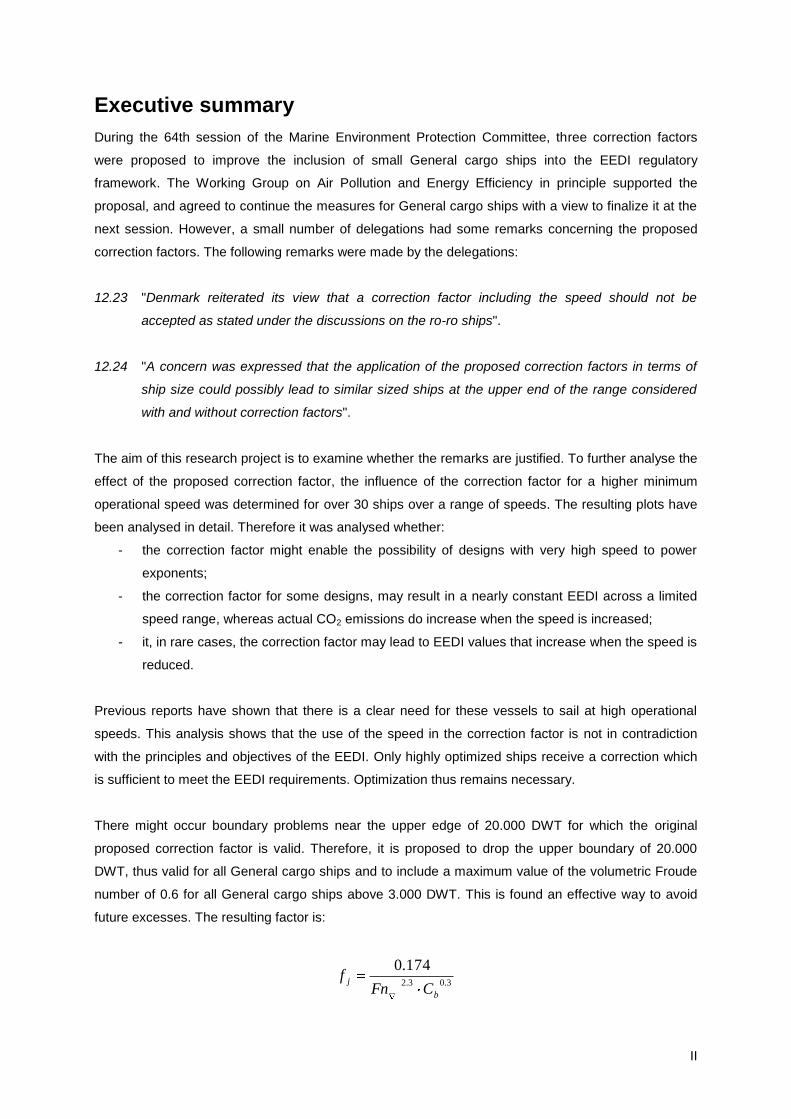
There might occur boundary problems near the upper edge of 20.000 DWT for which the original
proposed correction factor is valid. Therefore, it is proposed to drop the upper boundary of 20.000
DWT, thus valid for all General cargo ships and to include a maximum value of the volumetric Froude
number of 0.6 for all General cargo ships above 3.000 DWT. This is found an effective way to avoid
future excesses. The resulting factor is:
3.03.2
174.0
b
jCFn
f
III
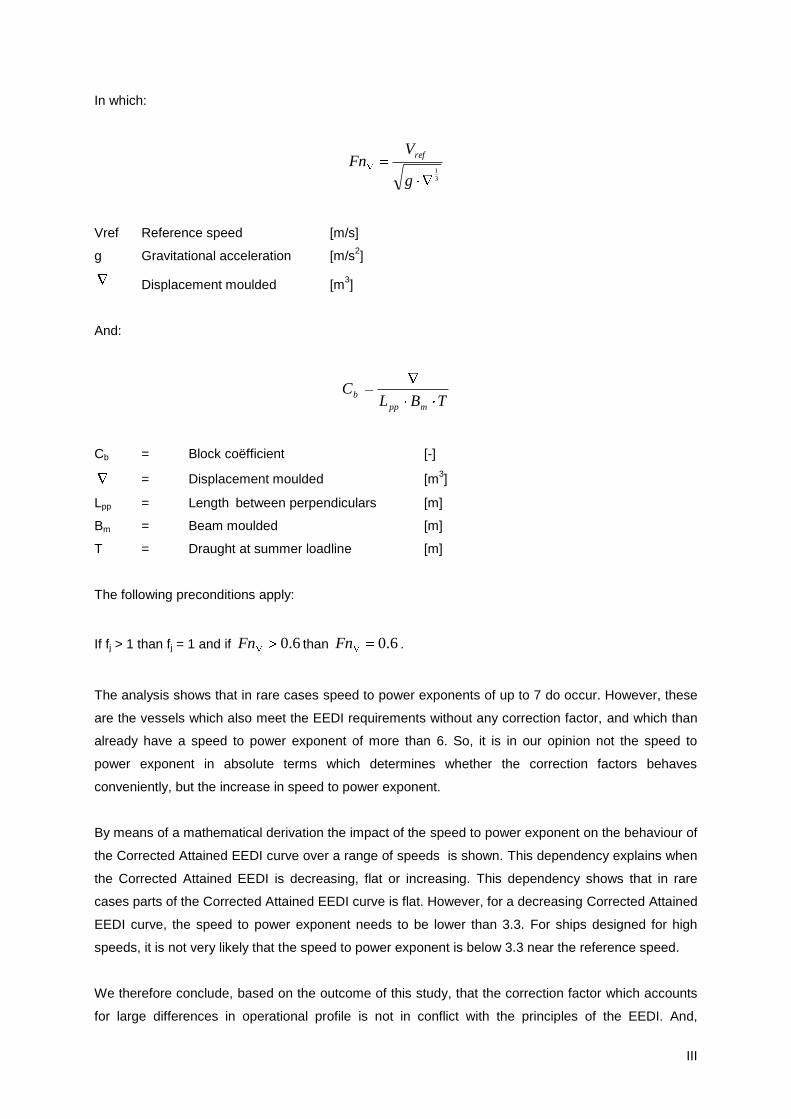
In which:
3
1
g
VFn
ref
Vref Reference speed [m/s]
g Gravitational acceleration [m/s2]
Displacement moulded [m3]
And:
TBLC
mpp
b
Cb = Block coëfficient [-]
= Displacement moulded [m3]
Lpp = Length between perpendiculars [m]
Bm = Beam moulded [m]
T = Draught at summer loadline [m]
The following preconditions apply:
If fj > 1 than fj = 1 and if 6.0Fn than 6.0Fn .
The analysis shows that in rare cases speed to power exponents of up to 7 do occur. However, these
are the vessels which also meet the EEDI requirements without any correction factor, and which than
already have a speed to power exponent of more than 6. So, it is in our opinion not the speed to
power exponent in absolute terms which determines whether the correction factors behaves
conveniently, but the increase in speed to power exponent.
By means of a mathematical derivation the impact of the speed to power exponent on the behaviour of
the Corrected Attained EEDI curve over a range of speeds is shown. This dependency explains when
the Corrected Attained EEDI is decreasing, flat or increasing. This dependency shows that in rare
cases parts of the Corrected Attained EEDI curve is flat. However, for a decreasing Corrected Attained
EEDI curve, the speed to power exponent needs to be lower than 3.3. For ships designed for high
speeds, it is not very likely that the speed to power exponent is below 3.3 near the reference speed.
We therefore conclude, based on the outcome of this study, that the correction factor which accounts
for large differences in operational profile is not in conflict with the principles of the EEDI. And,

IV
inclusion of the correction factors as proposed in MEPC 64/8/18 will improve the inclusion of small
General cargo ships within the EEDI regulatory framework.

1
1 Introduction
During the 62nd
session of the Marine Environment Protection Committee a new chapter of MARPOL
ANNEX VI was adopted. This new chapter aims to reduce the emission of Greenhouse Gases by
shipping and more specifically aims to reduce CO2 emissions. One of the most noticeable aspects of
the new regulations is the "Energy Efficiency Design Index", or EEDI, which defines a minimum
"energy efficiency level", expressed in tons of CO2 emitted per "Capacity mile", which all new designs
should meet.
Even though the new MARPOL regulations came into force as of the first of January 2013, concerns
regarding the effect of the EEDI regulations for small General cargo ships still exist. With the currently
accepted formula and guidelines there continues to be a high scatter of Attained EEDI values for the
smaller deadweight ranges for General cargo ships. Because of the difficulties with the derivation of a
robust reference line for the smaller vessels, small General cargo ships up to 15.000 DWT have been
excluded from the first phase of implementation of the EEDI requirements. In the meantime IMO
invites parties to propose alternative measures or methods to improve the robustness of the EEDI
methodology for small General cargo ships.
CMTI commissioned MARIN and Conoship International B.V. to investigate the cause of the poor
reference line correlation for small General cargo ships and to propose alternative measures. The
results of that research project included the identification of three design elements, typical for small
General cargo ships, which mainly cause the high scatter. To improve the inclusion of General cargo
ships up to 20.000 DWT in the EEDI regulatory framework, three correction factors were developed
based on the identified normative design elements. The correction factors were proposed during the
64the
session of the Marine Environment Protection Committee, by means of a submission of the
Netherlands1 and the full report of the research and related to the submission
2. The three proposed
correction factors are:
1. Factor to account for the differences in minimum required operational speed between
small General cargo ships that have been optimised for different trades, f j;
2. Factor to account for the differences between ships with and without cargo handling
equipment, fl;
3. Factor to address differences in additional class notations that can lead to relatively higher
lightweights, fl,Gen.Cargo.
1 MEPC 64/4/18
2 MEPC 64/INF.9

2
The proposed correction factors effectively reduces the scatter of attained EEDI values for small
General cargo ships. For the database as used in this study, containing more than 70 recently build
General cargo ships, the "R2'' factor
3 increased from was 0.403 to 0.55.
The submission as proposed by the Dutch delegation was in principle accepted. However, two
delegations expressed their reservations concerning the proposal. During the 64th session of the
Marine Environment Protection Committee, the following remarks were noted4:
12.23 "Denmark reiterated its view that a correction factor including the speed should not be
accepted as stated under the discussions on the ro-ro ships".
12.24 "A concern was expressed that the application of the proposed correction factors in terms of
ship size could possibly lead to similar sized ships at the upper end of the range considered
with and without correction factors".
The aim of this report is to provide the results of an investigation done to verify the above stated
remarks. Therefore it was analysed whether:
- the correction factor might enable the possibility of designs with very high speed to power
exponents;
- the correction factor for some designs, may result in a nearly constant EEDI across a limited
speed range, whereas actual CO2 emissions do increase when the speed is increased;
- it, in rare cases, the correction factor may lead to EEDI values that increase when the speed is
reduced.
In chapter 2 the consequences of not introducing a correction factor for a higher minimum required
operational speed are identified. Chapter 3 deals with the comments regarding the use of speed as a
correction factor. Further a maximum to the volumetric Froude number is introduced in chapter 3. In
chapter 4 the different methods for smoothening the transition near the upper edge of 20.000 DWT are
introduced, and a proposal is made for the most suitable method.
3 The R
2 coefficient, or the correlation coefficient, is a statistical measure which indicates how close
the regression line approximates the real data points. A R2 of 1 indicates a perfect fit.
4 MEPC 64/WP.11

3
2 Consequence of not adopting a correction factor for
higher minimum operational speed
MEPC 215 (63) states that the purpose of the EEDI is: “to provide a fair basis for the comparison, to
stimulate the development of more efficient ships in general and to establish the minimum efficiency of
new ships depending on ship type and size”.
Previous research identified a very high scatter and a very low reference line correlation for small
General cargo vessels. Clearly, for small General cargo vessels, up to 20.000 DWT the EEDI
regulatory framework does not provide a fair comparison. In their previous report, Conoship and Marin
identified a number of causes for the high scatter and the low reference line correlation and proposed
to improve the fairness of the comparison by including three new correction factors. One of the
proposed correction factors is a factor to correct for large differences within the operational profile of
small General cargo ships regarding to sailing area and higher minimum operational speed.
The previous Conoship and Marin reports clearly indicated a number of reasons why a higher
minimum required operational speed is considered to be justified5. Not including such a correction
factor will have numerous consequences. The main consequence is that the inclusion of small
General cargo ships within the EEDI framework will remain unfair as the scatter remains high. Further,
without a correction factor to account for this higher minimum operational speed, building relatively
small General cargo ships with a higher minimum operational speed will no longer be possible, as they
will not meet the EEDI requirements. This again will have numerous consequences, as also described
in the previous reports. If it is not longer possible to built these kind of vessels shipping companies and
other shippers in the logistic chain have to search for alternatives:
1. Continue operations with old less environmentally friendly vessels (not only regarding CO2,
but also regarding NOx, SOx, etc.);
2. Use container vessels (“exclusively designed for carriage of containers") for the transport of
general cargo for which a higher minimum operational speed is required. However as these
vessels are not designed and optimized for the carriage of general cargo, there is the risk of
structural damage to the ship (tank top, hatches) potentially putting the crew and the
environment at risk;
3. Use a considerably larger vessel, with a reference speed equal to the required high speed of
the smaller vessel. Because of the much larger size, the larger vessel might be able to comply
with the EEDI regulations without the proposed correction factor for the operational profile. As
a consequence, it is to be expected that more transport to and from ports is required, since the
number of ports in which the larger vessel can call will be considerably lower. This will put an
additional burden on the environment.
5 MEPC 64/4/18 and MEPC 64/INF.9

4
Each of these alternatives will result in an increase of the CO2 emissions. The older tonnage is often
not extensively optimized and thus emits more CO2 than newly designed optimized vessels which
meet the regulations through the proposed correction factor. Using container vessels for this trade will
result in higher CO2 emissions, as the required EEDI values for container vessels allows more power
be installed to reach a Vref (i.e. less hull optimization required) than in the case of a General cargo
vessel for which the correction factor is applied. See example 1 below. Further, the cut-off limit for
Container vessels (phase 1) is 10.000 DTW, and thus in that case for many small General cargo
vessel designs there is no need to comply with the regulations. The 3rd
alternative would result in an
overall higher CO2 emission. Despite its lower attained EEDI, the absolute amount of CO2 emitted by
the larger vessels is considerably higher. See example 2 below.
Also, lowering the speed until the EEDI requirement is met, without the introduction of a correction
factor, and simply use more ships to provide the same transport capacity is not feasible.. The raison
d’être of the fast General cargo vessels is their capability to reach a higher minimum operational
speed. Without the possibility to reach this speed, shipping companies will seek refuge in the
aforementioned alternatives 1 to 3, which will lead to higher CO2 emissions.
Example 1
The first example is relating to alternative two above; using container ships for trades which are
normally maintained by General cargo ships. That is; the cargo which is to be transported in that trade
is other than containers, and a General cargo ship is ideally equipped to carry such cargo. Below a
description of the ship. In Table 1, the main dimensions of the ships are given.
Ship A A large General cargo ship designed for a particular high speed, the reference speed
is more than 17 knots. The deadweight of the ship is about 10006 tons. The EEDI is
calculated following the guidelines for a General Cargo Ship.
Ship B Identical ship as Ship A, however the EEDI is calculated following the guidelines for
Container ships. Conform the guidelines for calculating the EEDI for container ships,
70 percent of the DWT is used in the calculations. The reference speed is at the
draught of 6.1 m., than the deadweight is 70 percent of the total deadweight.
Table 1 Main dimensions of Ship A and Ship B
Ship A - General cargo ship Ship B - Container ship
DWT [mt] 10006 7004 (70% of total DWT)
VRef [knots] 16.9 17.4
Lpp [m] 125.6 125.6
Bm [m] 21.5 21.5
Dm [m] 9.3 9.3
Tsummer [m] 7.38 6.10

5
For both vessels, the Attained and Required EEDI are calculated. In the calculations, the following
assumptions are included:
1. For both vessels the constant CF is assumed to be 3.206, corresponding with the fuel DO/GO;
2. The required electrical power is assumed to be provided by a shaftgenerator;
3. The ships are not equipped with a power take in installation, nor equipped with other energy
efficient technology;
4. The ships do not have an ice class notation.
General cargo ship: reference speed is 16,9 knots
Containership: reference speed is 17,4 knots
0,000
5,000
10,000
15,000
20,000
25,000
30,000
35,000
40,000
Ship A - General Cargo Ship Ship B - Containership
EE
DI [g
CO
2/m
t*n
m]
Uncorrected Attained EEDI
Required EEDI
Figure 1 Comparison of EEDI values of Ship A (General cargo ship) and Ship B ( Container
ship)
Figure 1 above reveals that the ship type is crucial, as Ship A does not meet the requirements and
Ship B meets the requirements. In fact both ships emit an equal amount of CO2 to transport the same
amount of cargo. Carrying General cargo with container ships is unwanted both because of the
possible damage to the construction as well as the potential increase in CO2 emissions (even more
engine power can be installed on Ship B, and Ship B will than still meet the EEDI Requirements).
Fn [-] 0.252 0.255
PME [kW] 5130 5130
PPTO [kW] 360 360
CF [t-CO2/t-Fuel] 3.206 3.206
S.f.c. [g/kWh] 180 180

6
Example 2
Consider a trade in which a transport capacity of about 3500 ton and reference speed of 15.1 knots is
required, with a distance between two ports of 750 nm. The vessel should be able to maintain a
roundtrip within 5 days, in which 1 day in port is included. An optimized small General cargo vessel
would result in a vessel with the characteristics of vessel A in table 1. This vessel is actually built and
extensively optimized. To meet the EEDI regulations it does require the inclusion of a correction for
the operational profile. Vessel B in table 2, is far larger and would meet the EEDI requirements without
a correction factor.
Ship A A small General cargo ship designed for a particular high speed, the reference
speed is 15.1 knots. The deadweight of the ship is about 3600 tons, which is optimal
for the specific trade.
Ship B A large General cargo ship designed for a particular high speed, the reference speed
is more than 18 knots. However, for the sake of a fair comparison the reference
speed is assumed to be 15.1 knots. The deadweight of the ship is about 29700 tons,
which is far too high for the specific trade.
The main particulars of both vessels can be seen in
Table 2 below.
Table 2 Main dimensions of Ship A and Ship B
For both vessels, the Attained and Required EEDI are calculated. In the calculations, the following
assumptions are included:
1. For both vessels the constant CF is assumed to be 3.206, corresponding with the fuel DO/GO;
2. The required electrical power is assumed to be provided by a shaftgenerator;
3. The ships are not equipped with a power take-in installation, nor equipped with other energy
efficient technology;
4. The ships do not have an ice class notation.
Ship A Ship B
DWT [mt] 3600 29700
VRef [knots] 15.1 15.1
Lpp [m] 98.2 183.3
Bm [m] 15.6 27.8
Dm [m] 7.4 15.5
Tsummer [m] 5.8 11.2
Fn [-] 0.250 0.183
PME [kW] 2137 5419
PPTO [kW] 150 442
CF [t-CO2/t-Fuel] 3.206 3.206
S.f.c. [g/kWh] 180 180

7
In Figure 2 the resulting EEDI values, both Attained and Required, are shown. Ship A does not meet
the requirements at all. Ship B meets the requirements easily. See the figure below.
Reference speed = 15,1 knots
0,000
5,000
10,000
15,000
20,000
25,000
Ship A Ship B
EE
DI [g
CO
2/m
t*n
m]
Uncorrected Attained EEDI
Required EEDI
Figure 2 Comparison of EEDI values of Ship A and Ship B
Based on the Attained EEDI values of both vessels, Ship B puts less burden on the environment.
However, it is not the EEDI which is to be compared for this trade, as the required cargo capacity is
only 3500 tons. The actual amount of CO2 produced for transporting 3500 tonnes of cargo between
the two ports is a better reflection of the costs of the environment.
For a trade of 750 nautical miles, it takes about 50 hours at a speed of about 15.1 knots. To calculate
the amount of CO2 produced, the formula of Attained EEDI is used. The numerator of the formula is
defined by the following units:
h
gCO
kWh
gFuel
gFuel
gCOkWCFSCP FME
22...
So by determining the numerator of the Attained EEDI value, and by multiplying the numerator by the
time required for the transportation, the amount of CO2 produced for the specific trade can be
calculated. So the total amount of CO2 is determined by the following formula (according to the
principles of EEDI):
hourssailingCFSCPCFSCP AEFAEMEFME )......(
Ship B does not utilize it's full power to sail 15.1 knots with 3500 ton cargo. With use of the admiralty
constant, the required power is determined to be 2826 kW. The amount of CO2 produced for 750 nm
is:

8
Ship A 22 99.656598909850)206.3180150206.31802137( COtongCO
Ship B
22 29.949429487250)206.3180442206.31802826( COtongCO
Ship B produces about 43% more CO2 for the same trade compared to Ship A and could even be less
optimized (considering the difference between attained and required EEDI) and still meet the
regulations. This would result in a higher PME and thus even higher CO2 emissions. Instead of
reducing CO2 emissions, the CO2 emissions will increase when a trade maintained by a small
optimized General cargo vessel with a higher minimum operational speed will be maintained by a
larger vessel.

9
3 Inclusion of speed in correction factor vs. principles of
EEDI
The noted remark of Danish delegation on the proposed correction factor to account for minimum
operational speed was:
12.23 "Denmark reiterated its view that a correction factor including the speed should not be
accepted as stated under the discussions on the ro-ro ships".
To analyse the effect of the proposed correction factor, the influence of the correction factor for a
higher minimum operational speed was determined for over 30 ships over a range of speeds. The
resulting plots have been analysed in detail. Therefore it was analysed whether:
- the correction factor might enable the possibility of designs with very high speed to power
exponents;
- the correction factor for some designs, may result in a nearly constant EEDI across a limited
speed range, whereas actual CO2 emissions do increase when the speed is increased;
- it, in rare cases, the correction factor may lead to EEDI values that increase when the speed is
reduced.
The results of the analysis are presented in this chapter. The chapter ends with the proposal of the
inclusion of a maximum to the correction factor.
3.1 High speed to power exponents
It is true that the inclusion of a correction factor for the operational profile will lead to higher speed-
power exponents, however it is a misconception that the implementation will lead to speed-to-power
exponents for general cargo vessels of far above 7.
In Figure 3, a speed to power curve of a common General cargo ship is shown, by means of the blue
line. The exponent of the speed to power curve is represented by means of the red curve. Up to a
about 8 knots, the speed to power exponent is constant. Between 8 and 12 knots the speed to power
exponent rises with a low degree. From 12 knots on the speed power exponent rises sharply. When
the speed to power curve is steep, the speed to power exponent is also very high.

10
Figure 3 Speed power curve of a common vessel, with the speed to power exponent
For the vessels in the database of this research, the speed to power exponents have been
determined. Ships with ice class notation were not taken into account, as the power correction factor
for ice class “pollutes” the data and the subsequent analysis. Further, the vessels that don’t meet the
required EEDI, even with the implementation of the correction factor are not considered, as their
resulting speed-power exponent is not relevant since the regulations are not met. The speed to power
exponents of the remaining vessels can be seen in the figure below. Of these ships also plots of the
Corrected Attained EEDI curves can be found in the Appendices to this document. A curve of
Corrected Attained EEDI value is the result of calculating the Attained EEDI and Corrected Attained
EEDI over a range of speeds, and hence plotting the resulting values over this range of speeds (see
further section 3.2). See Figure 4 and Appendix 1 to 18.
In Figure 4, for all 11 vessels the speed to power exponent corresponding to the reference speed is
shown by the blue bars. The orange bars represent the point where the uncorrected EEDI
corresponds with the Required EEDI. I.e., the maximum possible exponent without correction. The
green bars represent the exponents corresponding to the speed with which the Corrected Attained
EEDI equals the Required EEDI. If no green bar is shown, the correction is applied on speeds
exceeding the speed where Attained EEDI equals the Required EEDI. See for example Appendix I, in
which difference between a ship of which the Attained EEDI is corrected at speeds below the
Required EEDI (ship 5) and a ship for which the correction factor does not apply on speeds below the
speed where the Attained EEDI equals the Required EEDI.

11
Speed to power exponents
0
1
2
3
4
5
6
7
8
5 7 8 11 14 17 23 27 38 42 53
Ships number
Sp
eed
to
po
wer
exp
on
en
t
Exponent corresponding to Vref
Exponent corresponding to intersection of EEDI Required and EEDI Attained
Exponent corresponding to intersection of EEDI Required and EEDI Attained Corrected
Figure 4 Speed to power exponents.
The majority of the ships in the selection, 7 out of 11, have a speed to power exponent which is
between 3 and 4 near their reference speed. The rest of the ships have an exponent above 5. Two
ships have an exponent of six and higher, which is considered to be high. Note that both ships do
meet the requirements, even without the correction factor for higher minimum operational speed
applied. This is a result of the speed to power curve of these vessels: the curve remains 'flat', until a
certain speed where the slope of the curve suddenly rises quickly. The reference speed of these
vessels is just in the beginning of the steep part.
Obviously with the correction factor applied, it is possible to meet the requirements with at a higher
reference speed, however the possible speed to power exponent is not much higher than the
exponent corresponding to the speed without correction. For the two ships with the highest exponent,
the exponent increases from 6.8 to 7 and from 6.7 to 6.9. This shows that operating with high speed to
power exponents does occur, but not as a result of the proposed correction factor for higher minimum
operational speed.
3.2 Slope of the Attained EEDI curve
For the vessels in the database the Corrected Attained EEDI curve was analysed; that is, the curve
resulting from the calculation of the Corrected Attained EEDI over a range of speeds. In the analysis
the focus was on:

12
- whether or not for some designs, it may result in a nearly constant EEDI across a limited
speed range, whereas actual CO2 emissions do increase when the speed is increased;
- whether or not it, in rare cases, the correction factor may lead to EEDI values that increase
when the speed is reduced.
In 3.2.1 it is analysed if and how often this behaviour occurs for General cargo vessels. In 3.2.2 the
cause and the consequences of this effect are described.
3.2.1 Analysis of the Attained EEDI curves
For the vessels in the database the attained EEDI is calculated for a range of speeds, as if each
speed was the reference speed. Vessels below 3000 dwt were excluded. Furthermore, to improve
accuracy, vessels were excluded for which the available speed-power data did not sufficiently extend
beyond the vessel’s original reference speed. For all of these vessels also the required EEDI and the
Corrected Attained EEDI are calculated. The speed-power data which we used to extrapolate around
the original Vref came from model tests, or from the MARIN database.
Assumptions made for the calculations are as follows:
1. Some of the ships in the database are ships with an ice class notation. These ships are used
in this research as if the ships are without ice class notation. As such the ice class correction
method has not been applied.
2. The specific fuel consumption is assumed to be constant, regardless the required propulsive
power corresponding with the speed.
3. The factor PAE included in the calculations depends on the factor PME relating to the speed.
4. If the EEDI is calculated for a condition which is far above or below the original reference
condition, the weight of an engine which is able to provide the required power might also be
far above or below the actual installed engine. This has its influence on the deadweight, and
as such on the EEDI. This phenomena has been accounted for. The vessel will still have the
same scantling draught, volume of displacement, block coefficient and speed/power curve.
The deadweight at the new engine power is found by adding the change in machinery weight
to the original deadweight (with original engine). The machinery weight is calculated by:
0.01MCR + 0.69MCR0.7
, with MCR in kW and the machinery weight in tons6. Not only the
attained EEDI is affected by the change in deadweight, but also the required EEDI will change
slightly with speed (engine power).
This analysis results in a large number of graphs, attached to this report in Appendices 1 to 18. The
plots show that for all ships, when the speed is increased, at some point the EEDI will be corrected.
However, for the majority of the ships this happens at a combination of speed and power at which they
6 Practical Ship Design, D.G.M. Watson

13
will not meet the EEDI regulations, even when corrected. The graphs further show that for most of the
vessels, also the Corrected Attained EEDI continuous to rise sharply, see for example Figure 5.
Figure 5 Required EEDI, Attained EEDI and Corrected Attained EEDI of a ship 14.l
Only for one of the vessels a very “flat” slope of the attained EEDI curve was identified, see Figure 6.
For this vessel, with a reference speed of about 15.1 knots, the slope of the Corrected Attained EEDI
becomes nearly flat between 12.8 and 14.5 knots.
Figure 6 Required EEDI, Attained EEDI and Corrected Attained EEDI of Ship 5

14
A decreasing Attained EEDI at increasing speed is not identified for any of the vessels in our
database. As also shown in [Sweden, MEPC65/4/XX], this behaviour could be caused by the way the
auxiliary power was considered in their calculations. When the PAE is kept constant, in some cases the
EEDI tends to decrease when the speed is increased. There might be other causes, which will be
described in the following sections.
3.2.2 Analysis of cause of the reduced slope for Attained EEDI
The Attained EEDI is dominated by the relationship between the speed, power and the deadweight.
The curve of the Attained EEDI as a function of speed is dominated by the relationship between speed
and power, as the capacity (deadweight) is constant over speed. The Corrected Attained EEDI curve
is the result of the correction factor on the Attained EEDI curve.
The effect of the correction factor on the Attained EEDI is shown by means of a mathematical
derivation. It is shown that the curve of the Attained EEDI curve is determined by the relationship
between speed and power. That is, the speed to power exponent determines to a great deal the
exponent of the Attained EEDI curve. This is equally the case when the correction factor is applied on
the Attained EEDI curve.
In the following, the formula for calculating the EEDI is simplified (reduced) so that solely the main
contributing components to EEDI remain. This is for reasons to clearly identify the main behaviour of
the EEDI, but the findings are valid too when the remaining EEDI factors are included. Simplified, the
EEDI can be expressed as follows:
(1)
ref
FMEMEMEj
VCapacity
CSFCPfEEDI
The following simplifications and assumptions have been taken into account:
- Specific fuel consumption (SFC) is constant over speed;
- The auxiliary power is left out of consideration;
- The ship does not have an ice class notation.
Formula (1) can be subdivided in a part which is changing over speed, and a part which is (assumed
to be) independent of the speed, thus constant:
(2) 1CV
PfEEDI
ref
MEj with
Capacity
CSFCC FMEME
1
For the sake of simplicity the indices ME and ref, as used in (1) and (2) are dropped from this point on.
The variables power and speed are not independent variables. The dependency of the power on the
speed can, in general terms, be written as:

15
(3) kVCP 2 with 2C = constant [-]
k = speed to power exponent [-]
By substituting (3) in (2), without the indices:
(4) 12 CV
VCfEEDI
k
j
Or:
(5) 21
1 CCVfEEDI k
j
The proposed factor for higher minimum operational speed is defined as:
(6) 3.03.2
174.0
bn
jCF
f with nF = Volumetric Froude number [-]
bC = Block coefficient [-]
The volumetric Froude number is defined as:
(7) 3
1
g
VFn with Vref Reference speed [m/s]
g Gravitational acceleration [m/s2]
Displacement moulded [m3]
By substituting (7) in (6) and by arranging the formula:
(8) 3.03.2
2
3.2
3
1
174.0
b
jCV
gf
This can be subdivided in a part which is changing and a part which is constant, or independent of the
speed:
(9) 33.2
1C
Vf j with
3.03
2
3.2
3
1
174.0
bC
gC

16
Definition (9) can be substituted in (5):
(10) 3213.2
1
CCCV
VEEDI
k
And this can be re-written as:
(11) 321
3.3 CCCVEEDI k
This has the following result, if:
(12) k < 3.3; Attained EEDI is decreasing with increasing speed;
k = 3.3; Attained EEDI is constant, independent of speed;
k > 3.3; Attained EEDI is increasing with increasing speed.
In which k is the speed to power exponent. The value of 3.3 is both a result of the definition of the
Attained EEDI and the exponent of 2.3 of the volumetric Froude number in the correction factor. This
explains the flat part of the Corrected Attained EEDI curve in Figure 6 on page 14. The speed to
power exponent corresponding to a speed of 13.5 knots is around the value of 3.3. This also explains
why the Corrected Attained EEDI curve of Ship 14 is represented by a curve with a much higher slope:
the speed to power exponent corresponding to a speed of 14 knots is about 5.
3.2.3 Consequences of reduced slope for Attained EEDI
The nearly ‘flat’ part of the Corrected Attained EEDI line between 12.8 and 14.5 knots looks ‘odd’. The
question is whether this low slope of the attained EEDI curve is against the principles of the EEDI
regulations. A perfect instrument cannot be established and in our opinion the proposed correction
factor is the best method for a fairer inclusion of small General cargo ships within the regulatory
framework of the EEDI and still meet the goals of the EEDI, in which we consider the purpose of the
EEDI is to7:
- Provide a fair comparison between vessels;
- Stimulate the development of more efficient ships.
To provide a fair comparison, the implementation of a correction factor regarding the operational
profile is required. Without the correction factor the scatter remains very high; because the large
differences in operational profile are still reflected in the EEDI values. On the other hand, the
implementation of the proposed correction factor still requires to develop more efficient ships. The
ships still need to be optimized, as without optimization they will not meet the EEDI requirements,
even when the correction is implemented.
7 Resolution MEPC.215(63)
17
The need for optimization is demonstrated by the following example. Both vessel A and Vessel B are
Conoship designs and according to MARIN the optimization potential for both vessels is very low (see
previous report8).
Ship A A ship designed for a particular high speed, the reference speed is more than 15
knots. The hull form is extensively optimized for the high speeds, which can be
(among others) deduced from the low block coefficient and the optimized bulb. The
main dimensions are not restricted by any operational limits, what emerges in a
particular high length in relation with the deadweight. A high length is favourable for
a low wave making resistance, which is the dominant resistance component at high
speeds.
Ship B This ship is also designed for a relatively high speed, but not as high as the speed
Ship A is designed for. The reference speed is 12.8 knots. The block coefficient of
Ship B is higher, but lower than what is often seen for ships of comparable
dimensions. The bow is designed to be able to attain good results at different
speeds/draughts.
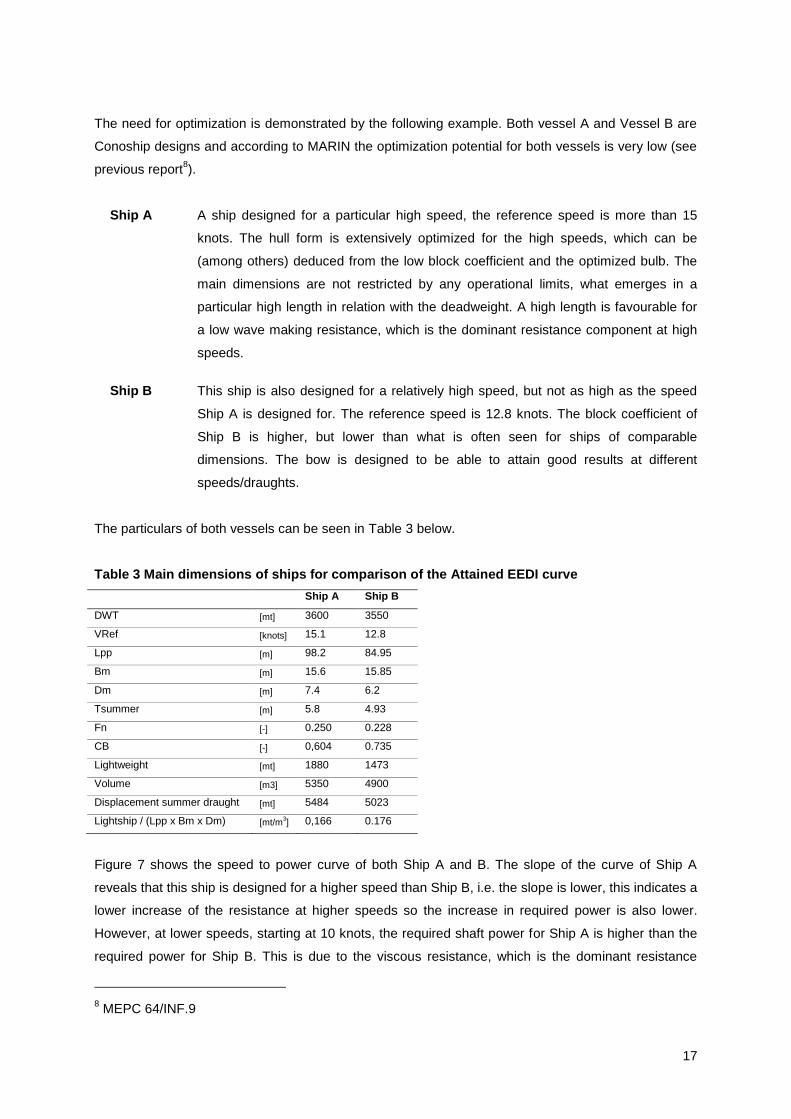
The particulars of both vessels can be seen in Table 3 below.
Table 3 Main dimensions of ships for comparison of the Attained EEDI curve
Ship A Ship B
DWT [mt] 3600 3550
VRef [knots] 15.1 12.8
Lpp [m] 98.2 84.95
Bm [m] 15.6 15.85
Dm [m] 7.4 6.2
Tsummer [m] 5.8 4.93
Fn [-] 0.250 0.228
CB [-] 0,604 0.735
Lightweight [mt] 1880 1473
Volume [m3] 5350 4900
Displacement summer draught [mt] 5484 5023
Lightship / (Lpp x Bm x Dm) [mt/m3] 0,166 0.176
Figure 7 shows the speed to power curve of both Ship A and B. The slope of the curve of Ship A
reveals that this ship is designed for a higher speed than Ship B, i.e. the slope is lower, this indicates a
lower increase of the resistance at higher speeds so the increase in required power is also lower.
However, at lower speeds, starting at 10 knots, the required shaft power for Ship A is higher than the
required power for Ship B. This is due to the viscous resistance, which is the dominant resistance
8 MEPC 64/INF.9

18
component at lower speeds. As Ship A has a higher wetted surface, the viscous resistance of Ship A
becomes higher at low speeds compared to Ship B. See Figure 7.
As the slope of the speed-power curve of vessel A is lower than that of vessel B, the Corrected
Attained EEDI curve will have a lower slope as well, which in extreme cases becomes nearly flat
within a certain speed range. I.e. the low slope of the attained EEDI curve will only occur for vessels
which are extensively optimized for higher speeds. For this vessel the wave-making resistance is low
compared to other vessels in their deadweight class.
When we try to reach the reference speed of vessel A with the design of vessel B, its Corrected
Attained EEDI becomes very high, even though the correction received is larger than the correction of
vessel A. See Table 4 and Figure 8.
Table 4 Results of EEDI - Reference speed = 15 knots
Ship A Ship B
Pme [kW] 2085 2926
Installed power [kW] 2926 4153
Reference speed [knots] 15 15
Attained EEDI (uncorrected) [gCO2/(mt*nm)] 24.1 34.7
fj [-] 0.68 0.62
Attained EEDI (Corrected) [gCO2/(mt*nm)] 17.0 22.5
Required EEDI [gCO2/(mt*nm)] 18.3 18.4
The required shaft power of Ship A at a reference speed of 15 knots is considerably lower than that of
Ship B. This results in a considerably lower initial Attained EEDI: 24.1 of Ship A compared to 34.7 of
Ship B. Ship B receives a correction which is larger than the correction of Ship A, however the
correction for Ship B is by far not enough; the Corrected Attained EEDI is still 22.5 after correction,
Comparison of ships
0
500
1000
1500
2000
2500
10 11 12 13 14
EEDI Reference speed [knots]
Sh
aft
po
wer
Ps [
kW
]
Ship A
Ship B
Figure 7 Speed to power curve of Ship A and Ship B.

19
where 18.4 is required. Ship A does also receive a correction, and this correction is sufficient for Ship
A to meet the requirements.
Reference speed = 15 knots
0,000
5,000
10,000
15,000
20,000
25,000
30,000
35,000
40,000
Ship A Ship B
EE
DI [g
CO
2/m
t*n
m]
Uncorrected Attained EEDICorrected Attained EEDIRequired EEDI
Figure 8 Comparison of Ship A and B, for a reference speed of 15 knots.
By means of this example it is shown that a ship needs to be extensively optimized to be sufficiently
corrected to be able to meet the requirements. When done the other way around, i.e. using the design
of vessel A for a reference speed of 12 kts. for both vessels o correction factors is applied and both
ships comply. However, the design aspects of Vessel B are to be considered “optimal” with respect to
its operational profile, e.g. limiting the length to maximize the operational area, etc.
Table 5 Results of EEDI - Reference speed = 12 knots
Ship A Ship B
Pme [kW] 963 1020
Installed power [kW] 1352 1432
Reference speed [knots] 12 12
Attained EEDI (uncorrected) [gCO2/(mt*nm)] 13.9 15,0
fj [-] 1 1
Attained EEDI (Corrected) [gCO2/(mt*nm)] 13.9 15.0
Required EEDI [gCO2/(mt*nm)] 18.3 18.4
By taking a look at the speed power curves in Figure 7 it can be concluded that for a reference speed
of 12 knots Ship A requires less shaft power Ps than Ship B. This combined with the higher
deadweight of Ship A and the equal reference speed, it is not a surprise that the Uncorrected Attained
EEDI of Ship A is lower compared to ship B. The Required EEDI of Ship A is slightly lower than that of
Ship B, due to the higher deadweight of Ship A.

20
Reference speed = 12 knots
0,000
5,000
10,000
15,000
20,000
25,000
Ship A Ship B
EE
DI [g
CO
2/m
t*n
m]
Uncorrected Attained EEDI
Corrected Attained EEDI
Required EEDI
Figure 9 Comparison of Ship A and B, for a reference speed of 12 knots
3.3 Limiting the maximum value of Fnvol
The correction factor for higher minimum operational speed is intended to provide a correction for
ships sailing at higher minimum operational speeds. In the previous report9, it was shown that there
are numerous examples which prove that there is a clear need for ships sailing at high speeds. The
correction factor is developed with the precondition that only ships extensively optimized for high
speeds do receive a correction on the Attained EEDI value which is sufficient to meet the EEDI
requirements.
The background to set this precondition is the strong conviction of the project group that ships sailing
at high speeds is justified, if these vessels are (relatively) very low energy consuming, that is when
these vessels are extensively optimised. By setting a maximum to the correction factor, there is a
strong incentive for ship designers to put much effort in the design and more especially in the
optimization of the hull form of the ship. Another advantage of the maximum correction factor is that
future excesses, which cannot be foreseen at the moment, are avoided. This is conform the principles
of EEDI. Setting a maximum to the correction factor is not a requirement, but is proposed to reduce
the amount of CO2 emissions.
Method of limiting the correction factor
There are different methods of setting a maximum to the correction factor. It is proposed to introduce a
boundary through a limitation of the volumetric Froude number Fnvol. By doing so, a limitation is set
on the relation between speed and the volume of the ship, to avoid ships with a very high reference
speed and a very low displacement.
9 MEPC64/INF.9.

21
The volumetric Froude numbers of the vessels used for this research are presented in the figure
below. See Figure 10. The highest volumetric Froude number seen in this figure is close to 0.6. It is
proposed to set a maximum volumetric Froude number of 0.6. It is expected that unforeseen excesses
are avoided and that the ships stay within the so called displacement mode, for which the factor was
developed and stay away from any (probably purely hypothetical) planning modes.
Volumetric Fn numbers
0,00
0,10
0,20
0,30
0,40
0,50
0,60
0,70
0 2000 4000 6000 8000 10000 12000 14000 16000 18000 20000
Deadweight [mt]
Vo
lum
etr
ic F
n [
-]
Volumetric Fn values
Figure 10 Values of volumetric Froude numbers of ships in database
By setting a maximum for the volumetric Froude number, the correction factor is indirectly bounded to
a minimum value as well (a low correction factor results in a high correction). See the above presented
definition of the correction factor fj, which has also been introduced in the submission and the related
report10
. In the way the correction factor is formulated, the correction factor is low (resulting in a
maximum correction) when the block coefficient is near 1 and the volumetric Froude number high
(above 1 is possible). Commonly the block coefficient (for General cargo ships) varies between 0.5
and 0.9, with the lower values more suited for higher speeds. Again, the correction increases (than the
correction factor is very low) when the volumetric Froude number increases, that is when the speed
increases and the volume of displacement decreases. Implementing a maximum value to the
volumetric Froude number is a very effective method to bound the correction factor to a maximum and
thus to prevent unforeseen excesses, such as (theoretically) planning hulls, etc.
10 MEPC 64/4/18 and MEPC 64/INF.9

22
4 Boundary effect
The noted remark of one of the delegations on the proposed correction factor to account for minimum
operational speed was:
12.24 "A concern was expressed that the application of the proposed correction factors in terms of
ship size could possibly lead to similar sized ships at the upper end of the range considered
with and without correction factors".
The research project focussed on the group of ships between 3.000 and 20.000 DWT, as for this
range the scatter was the highest. The objective of the research project was to find the cause of this
high scatter and to propose correction factors. The proposed correction factor for operational speed
was, in that respect, applicable for the range of ships with a maximum of 20.000 DWT. Thus a strict
boundary might result in so-called “paragraph” ships, which is an undesired side effect.
To be able to enhance a 'smooth transition' near the edge of 20.000 DWT, it is essential to know how
the correction factor 'works' for ships above 20.000 DWT. In section 4.1 an analysis is given whether
there are ships above 20.000 dwt which require a correction factor to meet the EEDI requirements. In
4.2 different methods to avoid the boundary problems are discussed, and a final decision is made
which methodology will be proposed.
4.1 Correction factor for General Cargo Ships >20.000 DWT
As the availability of General cargo ships above 20.000 DWT in our database is low, we searched for
designs above 20.000 DWT from parties which did not participate in this project. A small number of
recently delivered large General cargo ships was found. Missing particulars were determined on the
basis of statistics as found in the Conoship or Marin databases. With use of the MARIN program
DESP11
, a speed to power curve was produced to calculate the EEDI in the reference condition. For
the particulars of one of these vessels, see Table 6 below.
11 The computer program DESP predicts the resistance and propulsion characteristics of
displacement ships, based on the Holtrop & Mennen method. The predictions are based on formulas
obtained from a regression analysis on results of model experiments and sea trials.

23
Table 6 Particulars of a ship larger than 20.000 DWT
Ship >20.000 DWT
DWT [mt] 30000
VRef [knots] Abt. 18.1
Lpp [m] 184
Bm [m] 28
Dm [m] 15.5
Tsummer [m] 11.2
Fn [-] Abt. 0.219
CB [-] Abt. 0.716
Lightweight [mt] Abt. 12.250
Volume [m3] Abt. 41.000
Displacement summer draught [mt] Abt. 42.025
Lightship / (Lpp x Bm x Dm) [mt/m3] Abt. 0,155
The results of the calculations are presented in Table 7 and in Figure 11. The calculations are based
on the assumption that:
1. It is assumed that the fuel is DO/GO. As such, the factor CF is equal to 3.206.
2. The total required electrical power is assumed to be provided by a shaft generator.
3. The specific fuel consumption is assumed to be constant, and assumed to be 180 g/kWh.
Table 7 Results of EEDI for ship of 30.000 DWT
Ship A
Pme [kW] Abt. 11355
Installed power [kW] Abt. 15.800
Reference speed [knots] Abt. 18.1
Attained EEDI (uncorrected) [gCO2/(mt*nm)] 12.9
fj [-] 0.927
Attained EEDI (Corrected) [gCO2/(mt*nm)] 12.0
Required EEDI [gCO2/(mt*nm)] 11.6
Based on the table above and the figure below, it can be concluded that the vessel does not meet the
requirements for EEDI, the Corrected Attained EEDI is slightly above the Required EEDI. It might be
possible to gain some efficiency by optimizing the hull form, but it is not possible to exactly know how
much due to lack of details of the ship. However, this example illustrates that there are ships above
20.000 DWT which sail at comparatively high minimal operational speeds and would benefit from the
correction factor. In addition to this it must be noted that the correction factor was developed based on
speed/power measurements in the MARIN database, where also some larger ships were included
because no strict 20.000 DWT boundary was used. There are no indications that the hydrodynamics
of General cargo ships above 20.000 DWT are any different from the smaller ones.

24
Ship of about 30.000 DWT
0,0
2,0
4,0
6,0
8,0
10,0
12,0
14,0
16,0
18,0
20,0
Ship 30.000 DWT
EE
DI [g
CO
2/m
t*n
m]
Uncorrected Attained EEDI
Corrected Attained EEDI
Required EEDI
Figure 11 Results of EEDI calculation of a ship of about 30.000 DWT.
4.2 Preventing paragraph ships
To prevent the so-called “paragraph” ships, several options are possible, which were discussed during
the project group meetings. For clarity all the options are shown below. The example in the previous
section does make clear that there are also large, optimized General Cargo vessels that need a
correction factor in order to operate at higher minimum operational speeds. In both methods the
volumetric Froude number is used to limit the correction factor and to prevent the occurrence of
“paragraph” ships (see also chapter 3.3).
Maximum Fnvol of 0.6 applicable from 3.000 DWT and over, not limited to 20.000 DWT
The first method is a constant maximum volumetric Froude number with a lower boundary of the range
for which the correction factor is applicable, but without an upper boundary. This method is
transparent and easy to introduce, and all possible boundary effects are avoided. All General Cargo
Ships can receive a correction factor. See Figure 12 below. It is the opinion of the project group that
this constant maximum volumetric Froude number is the most suitable, and this method is proposed.

25
Method 3: Maximum Fnvol valid between 3.000 DWT and
over, not limited to 20.000 DWT
0,3
0,35
0,4
0,45
0,5
0,55
0,6
0,65
0,7
0,75
0,8
0 5000 10000 15000 20000 25000 30000 35000 40000 45000 50000
Deadweight [mt]
Fn
vo
l [-
]
Maximum volumetric Froud number (Fnvol)
Lower boundary of range of deadweights where correction factor is applicable
Figure 12 Visualisation of maximum Fnvol - Method 3
The proposal for the inclusion of the correction factor fj for higher minimum operational speed is than
extended with a maximum on the volumetric Froude number:
3.03.2
174.0
b
jCFn
f
In which:
3
1
g
VFn
ref
Vref Reference speed [m/s]
g Gravitational acceleration [m/s2]
Displacement moulded [m3]
And:
TBLC
mpp
b
Cb = Block coëfficient [-]
= Displacement moulded [m3]
Lpp = Length between perpendiculars [m]
26
Bm = Beam moulded [m]
T = Draught at summer loadline [m]
The following preconditions apply:
If fj > 1 than fj = 1 and if 6.0Fn than 6.0Fn .
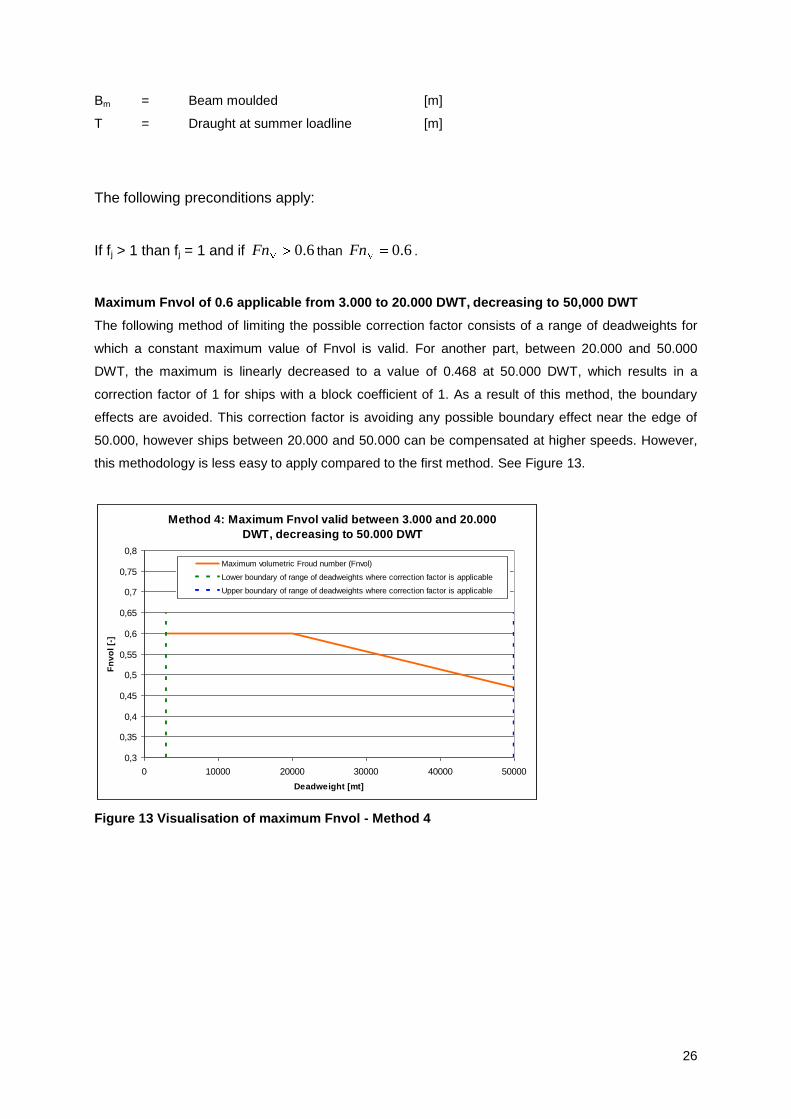
Maximum Fnvol of 0.6 applicable from 3.000 to 20.000 DWT, decreasing to 50,000 DWT
The following method of limiting the possible correction factor consists of a range of deadweights for
which a constant maximum value of Fnvol is valid. For another part, between 20.000 and 50.000
DWT, the maximum is linearly decreased to a value of 0.468 at 50.000 DWT, which results in a
correction factor of 1 for ships with a block coefficient of 1. As a result of this method, the boundary
effects are avoided. This correction factor is avoiding any possible boundary effect near the edge of
50.000, however ships between 20.000 and 50.000 can be compensated at higher speeds. However,
this methodology is less easy to apply compared to the first method. See Figure 13.
Method 4: Maximum Fnvol valid between 3.000 and 20.000
DWT, decreasing to 50.000 DWT
0,3
0,35
0,4
0,45
0,5
0,55
0,6
0,65
0,7
0,75
0,8
0 10000 20000 30000 40000 50000
Deadweight [mt]
Fn
vo
l [-
]
Maximum volumetric Froud number (Fnvol)
Lower boundary of range of deadweights where correction factor is applicable
Upper boundary of range of deadweights where correction factor is applicable
Figure 13 Visualisation of maximum Fnvol - Method 4

27
5 Conclusion and discussion
With reference to the concerns raised by the two delegations during MEPC 64 regarding the Dutch
proposal for additional correction factors for General cargo ships, we conclude, based on an additional
analysis, that the proposal does not violate the principles of the EEDI regulations. The misconceptions
that the correction factor enables the possibility of extreme high speed to power exponents and that a
flat or decreasing Corrected Attained EEDI curve are in conflict with the principles of EEDI have been
clarified throughout the report.
High speed to power exponents of up to seven are seen for the ships in the database. These high
exponents are however not a result of the proposed correction factors; the increase because of
application of a correction factor exponents is low. Without the correction factor applied for the high
operational speed, speed to power exponents are seen up to 6.8, for the vessels which also meet the
EEDI requirements without any correction factor, even though the exponent of the speed to power
curve is above 6. The difference between the speed to power exponent with and without the inclusion
of the correction factor determines whether the factor is against the principles of the EEDI, not the
absolute value of the exponent.
The Corrected Attained EEDI curve becomes constant when the speed to power exponent 'k' is near
3.3, and this will seldom occur. For none of the vessels in the database a flat part of the Corrected
Attained EEDI curve near the reference condition is discovered. Only highly optimised vessels,
specifically designed for high speed will receive a correction factor which is sufficient to meet the EEDI
requirements. It is still required to extensively optimize vessels for high operational speed in order to
meet the requirements, and hence to limit the amount of CO2 emissions.
A decreasing Corrected Attained EEDI curve will only occur when the speed to power exponent 'k' is
lower than 3.3. Decreasing Corrected Attained EEDI lines with increasing speed are not seen in any of
the ships included in the database. In non of the figures the Attained EEDI corresponding to the
reference speed is in a flat part of the Attained EEDI curve. From this we can draw the conclusion that
the occurrence of a decreasing Attained EEDI line is not very likely, and a flat Attained EEDI curve will
occur seldom. As a speed to power exponent of 3.3 is a very low value for ships optimized for high
speed, it is not to be expected that Corrected Attained EEDI curve will decrease near the reference
speed.
In order to avoid the boundary effects near the upper edge of the range of deadweights for which the
correction factor is proposed to be valid, it is proposed by the project group to drop the upper edge of
20.000 DWT. The background of this decision is that it has been shown that there are General cargo
ships above 20.000 DWT. which sail at higher minimum operational speed, and are optimised for that
high speed, which need a correction factor to meet the EEDI requirements. As such, boundary
problems are avoided, as there no longer is an upper edge.

28
Although it is not required by the Working Group, it is proposed by the project group to introduce a
maximum to the volumetric Froude number used in the correction factor, in order to avoid future
unseen excesses and to bound the possible speeds, in order to bound the CO2 emissions. It is
proposed to set the maximum volumetric Froude number to a value of 0.6 valid for all General cargo
ships above 3.000 dwt, for those ships to which the correction factor is applicable in the reference
condition.

29
Appendix 1 Required, Attained and Corrected Attained EEDI of Ship
5 and 7

30
Appendix 2 Required, Attained and Corrected Attained EEDI of Ship
8 and 11

31
Appendix 3 Required, Attained and Corrected Attained EEDI of Ship
12 and 13

32
Appendix 4 Required, Attained and Corrected Attained EEDI of Ship
14 and 15

33
Appendix 5 Required, Attained and Corrected Attained EEDI of Ship
16 and 17

34
Appendix 6 Required, Attained and Corrected Attained EEDI of Ship
18 and 19

35
Appendix 7 Required, Attained and Corrected Attained EEDI of Ship
20 and 21

36
Appendix 8 Required, Attained and Corrected Attained EEDI of Ship
23 and 24

37
Appendix 9 Required, Attained and Corrected Attained EEDI of Ship
25 and 26

38
Appendix 10 Required, Attained and Corrected Attained EEDI of Ship
27 and 28

39
Appendix 11 Required, Attained and Corrected Attained EEDI of Ship
29 and 30

40
Appendix 12 Required, Attained and Corrected Attained EEDI of Ship
31 and 32

41
Appendix 13 Required, Attained and Corrected Attained EEDI of Ship
34 and 36

42
Appendix 14 Required, Attained and Corrected Attained EEDI of Ship
37 and 38

43
Appendix 15 Required, Attained and Corrected Attained EEDI of Ship
40 and 42

44
Appendix 16 Required, Attained and Corrected Attained EEDI of Ship
44 and 47

45
Appendix 17 Required, Attained and Corrected Attained EEDI of Ship
49 and 51

46
Appendix 18 Required, Attained and Corrected Attained EEDI of Ship
53