clarendon hills attached market stats q2 2010
DESCRIPTION
A look at condos and townhomes market stats for Clarendon Hills in Q2 2010.TRANSCRIPT
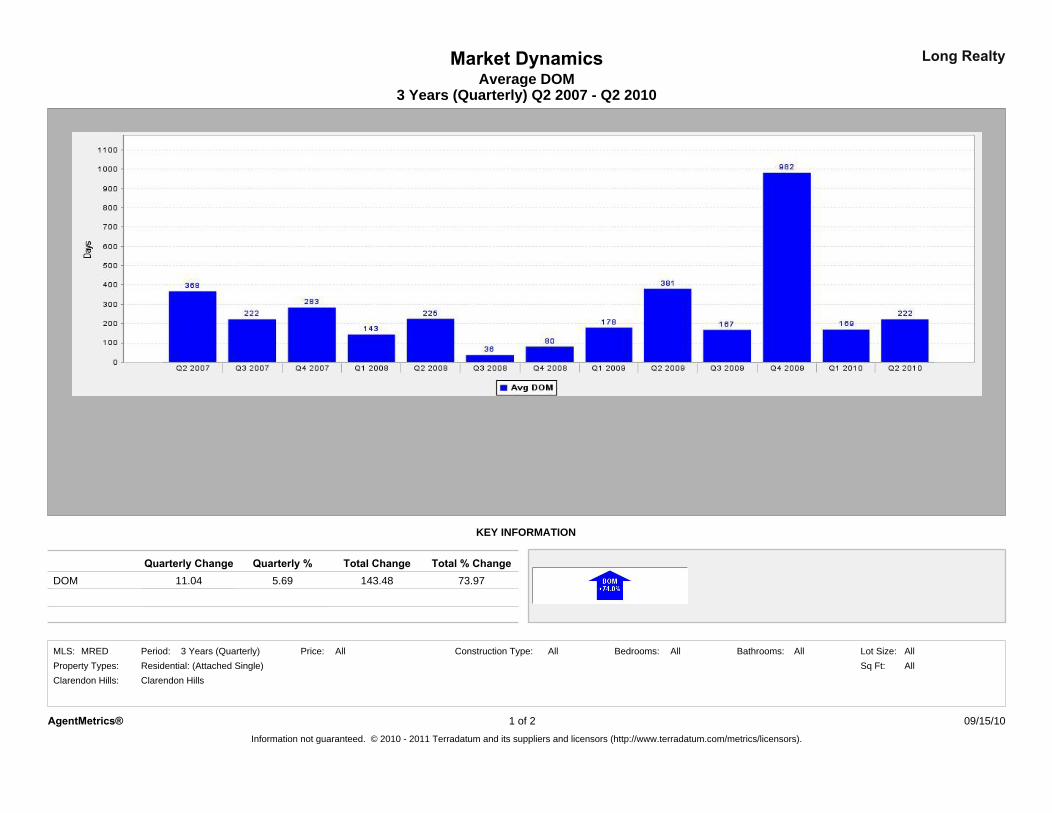
Long RealtyMarket Dynamics
3 Years (Quarterly) Q2 2007 - Q2 2010Average DOM
Quarterly %11.04
Clarendon Hills
Total % Change
Sq Ft:Bathrooms:All All
DOM
Construction Type:
Clarendon Hills:
Period:Property Types:
143.48 73.97Quarterly Change
5.69
Lot Size:All
KEY INFORMATION
Residential: (Attached Single) AllMRED AllBedrooms:
Total Change
AllMLS: Price:3 Years (Quarterly)
Information not guaranteed. © 2010 - 2011 Terradatum and its suppliers and licensors (http://www.terradatum.com/metrics/licensors).
AgentMetrics® 1 of 2 09/15/10

Average DOMMarket Dynamics Long Realty
3 Years (Quarterly) Q2 2007 - Q2 2010
Period Avg DOM Avg CDOMContract# UnderTime
222Q2 2010 10169Q1 2010 4982Q4 2009 2167Q3 2009 3381Q2 2009 5178Q1 2009 4
80Q4 2008 336Q3 2008 2
225Q2 2008 3143Q1 2008 1283Q4 2007 5222Q3 2007 7368Q2 2007 14
2 09/15/10Information not guaranteed. © 2010 - 2011 Terradatum and its suppliers and licensors (http://www.terradatum.com/metrics/licensors).
AgentMetrics® 2 of

Market DynamicsSupply & Demand - # Units (FS, UC, Sold)
3 Years (Quarterly) Q2 2007 - Q2 2010
Long Realty
Price:
2.71
AllAll All
-3.5016.46
Property Types:MRED
Under Contract-0.41
For Sale
MLS: All
-0.21
Bathrooms:
-5.76
1.37
Sold
All
-42.02-2.58
Construction Type:
Total Change
Sq Ft:
Quarterly Change
3 Years (Quarterly)
Clarendon Hills:
All
32.57
Lot Size:Period:
-69.07
Quarterly %
Bedrooms:
KEY INFORMATION
Total % Change
-4.95
Residential: (Attached Single)Clarendon Hills
Information not guaranteed. © 2010 - 2011 Terradatum and its suppliers and licensors (http://www.terradatum.com/metrics/licensors).
1 ofAgentMetrics® 2 09/15/10

Supply & Demand - # Units (FS, UC, Sold)3 Years (Quarterly) Q2 2007 - Q2 2010
Market Dynamics Long Realty
# Properties # PropertiesAverage DOM# PropertiesSOLD
# PropertiesFOR SALE
Average DOM Average DOMUNDER CONTRACT
Average DOMNEW LISTINGS
# PropertiesEXPIRED
Time Period
159 27Q2 2010 401196 14222 71072160 24Q1 2010 268994 17169 2466159 20Q4 2009 22990 19982 2263173 25Q3 2009 337224 21167 4367196 20Q2 2009 255346 14381 6561181 16Q1 2009 12480 8178 3453156 21Q4 2008 23288 2380 1363140 18Q3 2008 169174 1136 3255141 21Q2 2008 328123 11225 3351159 20Q1 2008 313126 16143 1147174 12Q4 2007 163250 18283 8550156 18Q3 2007 209293 9222 8754126 27Q2 2007 309328 12368 131462
09/15/10 2Information not guaranteed. © 2010 - 2011 Terradatum and its suppliers and licensors (http://www.terradatum.com/metrics/licensors).
2 ofAgentMetrics®

Median Price (Sold)Market Dynamics Long Realty
Clarendon HillsProperty Types:
Bedrooms: Bathrooms:MRED 3 Years (Quarterly) AllConstruction Type: All AllPeriod:
Clarendon Hills:Residential: (Attached Single)
MLS: AllPrice:
3 Years (Quarterly) Q2 2007 - Q2 2010
KEY INFORMATION
Sold 1,805.47 0.70 21,665.68
Quarterly Change Total ChangeQuarterly % Change Total % Change
8.39
Lot Size: AllSq Ft: All
09/15/10AgentMetrics®Information not guaranteed. © 2010 - 2011 Terradatum and its suppliers and licensors (http://www.terradatum.com/metrics/licensors).
1 of 2
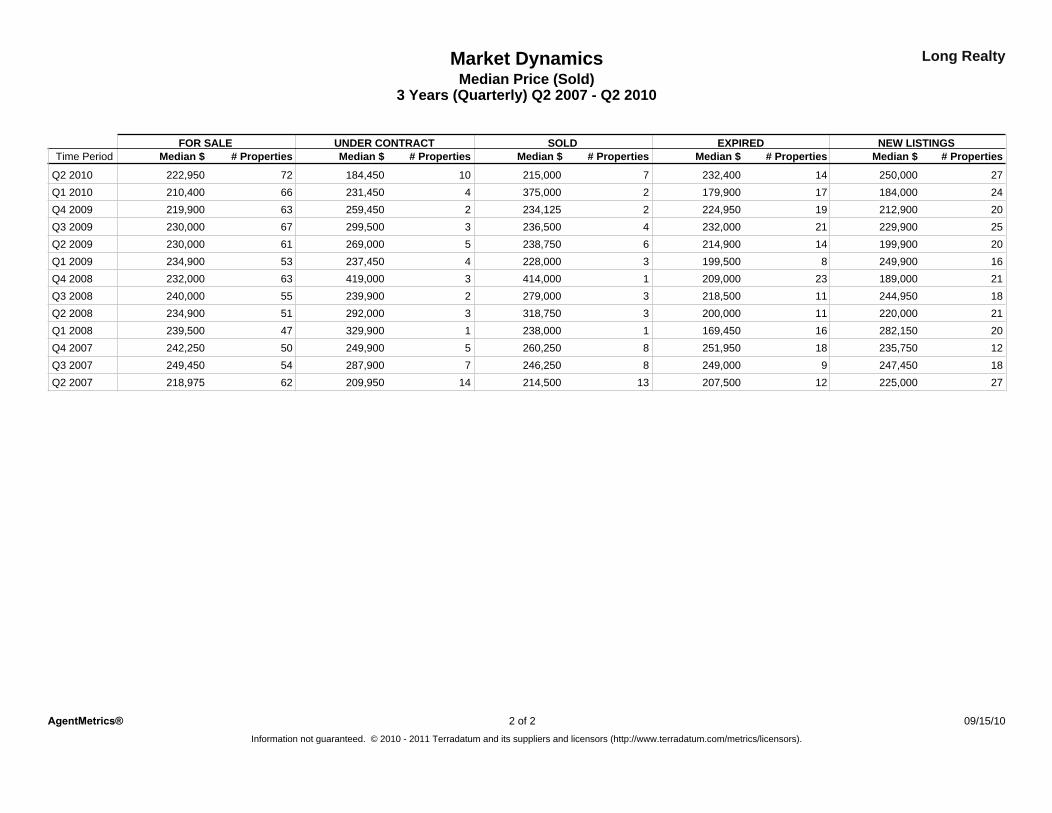
Market DynamicsMedian Price (Sold)
Long Realty
3 Years (Quarterly) Q2 2007 - Q2 2010
Median $ # Properties Median $Median $ # Properties # PropertiesMedian $ # PropertiesFOR SALE UNDER CONTRACT SOLD EXPIRED NEW LISTINGS
Median $ # PropertiesTime Period
222,950Q2 2010 10 215,000 7 250,000184,45072 27232,400 14210,400Q1 2010 4 375,000 2 184,000231,45066 24179,900 17219,900Q4 2009 2 234,125 2 212,900259,45063 20224,950 19230,000Q3 2009 3 236,500 4 229,900299,50067 25232,000 21230,000Q2 2009 5 238,750 6 199,900269,00061 20214,900 14234,900Q1 2009 4 228,000 3 249,900237,45053 16199,500 8232,000Q4 2008 3 414,000 1 189,000419,00063 21209,000 23240,000Q3 2008 2 279,000 3 244,950239,90055 18218,500 11234,900Q2 2008 3 318,750 3 220,000292,00051 21200,000 11239,500Q1 2008 1 238,000 1 282,150329,90047 20169,450 16242,250Q4 2007 5 260,250 8 235,750249,90050 12251,950 18249,450Q3 2007 7 246,250 8 247,450287,90054 18249,000 9218,975Q2 2007 14 214,500 13 225,000209,95062 27207,500 12
2 09/15/102 ofAgentMetrics®Information not guaranteed. © 2010 - 2011 Terradatum and its suppliers and licensors (http://www.terradatum.com/metrics/licensors).

2AgentMetrics® 1 ofInformation not guaranteed. © 2010 - 2011 Terradatum and its suppliers and licensors (http://www.terradatum.com/metrics/licensors).
09/15/10
Market DynamicsAverage SP/OP Comparison – No Price Changes vs. 1+ Price Changes
3 Years (Quarterly) Q2 2007 - Q2 2010
Long Realty
Price:
0.00
AllAll All
0.00100.00
Property Types:MRED
SP/OP - 1+ PriceSP/OP - No Price
MLS: All
87.57
Bathrooms:
94.80
All
97.5697.56
Construction Type:
Max
Sq Ft:
Average SP/OP
3 Years (Quarterly)
Clarendon Hills:
All
100.00
Lot Size:Period:
Min
Bedrooms:
KEY INFORMATION
Range
Residential: (Attached Single)Clarendon Hills
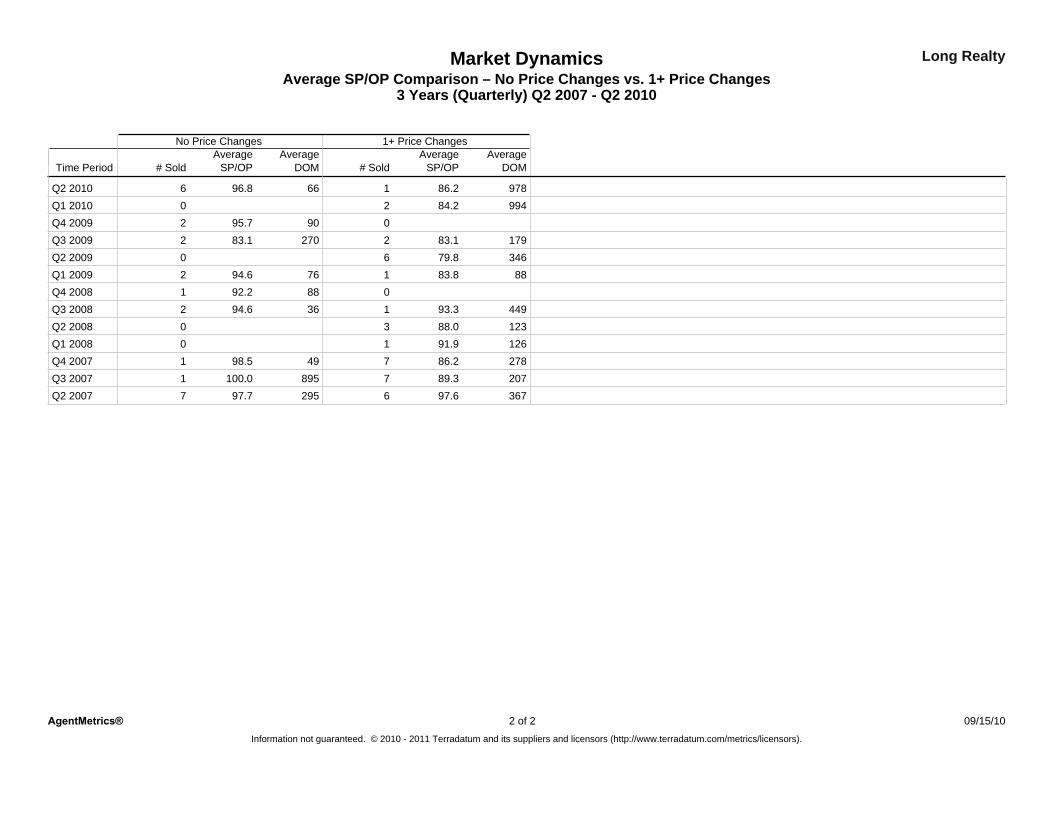
Average SP/OP Comparison – No Price Changes vs. 1+ Price Changes3 Years (Quarterly) Q2 2007 - Q2 2010
Market Dynamics Long Realty
# Sold# Sold
No Price Changes
DOM
1+ Price Changes
DOMTime PeriodAverage AverageAverage
SP/OPAverage
SP/OP
66Q2 2010 97816 96.8 86.2Q1 2010 99420 84.2
90Q4 2009 02 95.7270Q3 2009 17922 83.1 83.1
Q2 2009 34660 79.876Q1 2009 8812 94.6 83.888Q4 2008 01 92.236Q3 2008 44912 94.6 93.3
Q2 2008 12330 88.0Q1 2008 12610 91.9
49Q4 2007 27871 98.5 86.2895Q3 2007 20771 100.0 89.3295Q2 2007 36767 97.7 97.6
Information not guaranteed. © 2010 - 2011 Terradatum and its suppliers and licensors (http://www.terradatum.com/metrics/licensors).
09/15/102 ofAgentMetrics® 2